Article

Application of Geotextile Tubes to Coastal Silt Mitigation: A Case Study in Niaoyu Fishing Harbor

1
Department of Marine Environment and Engineering, National Sun Yat-sen University, Kaohsiung 804, Taiwan
2
Gold-Joint Industry Co., Ltd., Taichung 43541, Taiwan
3
IGS Chinese Taipei Chapter Chinese Geosynthetics Association, Pingtung 91200, Taiwan
*
Author to whom correspondence should be addressed.
Sustainability 2023, 15(3), 2024; https://doi.org/10.3390/su15032024
Submission received: 23 November 2022 / Revised: 17 January 2023 / Accepted: 18 January 2023 / Published: 20 January 2023
(This article belongs to the Special Issue Sustainable Development of Green Ecological Environment)

Abstract

:
Pengpeng Beach, near Niaoyu Fishing Harbor, is an offshore sandbar that formed on the west side of Niaoyu Island in Penghu County, Taiwan, in 1995. Due to siltation, Pengpeng Beach also forms a sandbar tail that stretches toward the Niaoyu Fishing Harbor, meaning the Niaoyu Fishing Harbor and its navigation channel are facing serious siltation problems. This study aimed to find a solution for the siltation problem of the area by utilizing geotextile tubes, which are an economical material in terms of their material and construction cost, as well as being ecologically friendly in terms of their carbon emissions during production and transportation. Based on numerical simulations, location candidates for placing silt trap facilities were tested, selected, and modified to develop alternative mitigation plans. Evaluation of the mitigation plans was based on (1) the silt mitigation effect; (2) engineering cost; (3) public acceptance; and (4) impact on the surrounding landscape. The results showed that the proposed silt mitigation plan would be effective, and the plan was accepted by the local residents and government.

1. Introduction

Geotextile tubes have been used in coastal engineering for decades. With proper design and allocation, geotextile tubes can be implemented in various structures, such as jetties, submerged breakwaters, or revetments, for the purposes of beach restoration, coastal protection, and sludge treatment, etc. For example, Chien et al. [1] reported a case in the UAE in which geotextile tubes were used to replace the original deteriorated rubble groins and in the construction of a new breakwater for beach nourishment. The measure was found to be cost-effective and eco-friendly, and it successfully restored the beach. Tsai et al. [2] reported a case that used geotextile tubes to construct a breakwater as part of a harbor construction project. In this case, the geotextile tubes were used as the core of the designed rubble mound breakwater. They found that this measure reduced the rocks from 185,000 m2 to 70,000 m2, saving the project budget from USD 37 to 87 million, and reducing 50% (283 T) of the CO2e, compared to the traditional rubble mound breakwater. Lin et al. [3] reported a project in Tabasco, Mexico, that used geotextile tubes as a support for oil pipes on the nearshore and as a submerged breakwater. This combination of geotextile tubes reduced the turbulence of the waves, reducing the amount of sand required for beach nourishment and providing stable support for the oil pipes. A similar case can be found in Yucatan, Mexico [4], which used geotextile tubes as a submerged breakwater for beach restoration. Currently, using geotextile tubes is a common practice in the field of hydraulic and coastal engineering. The general concepts for implementing geotextile tubes, including the design procedure, required tensile properties, and protection measures, along with various types of applications, were presented in Lim et al. [4]. Some recent research concerning geotextile tubes focused on the analysis of the tension force of the geotextile tubes and the consolidation behavior of the fill material, such as that carried out by Kim et al. [5,6] and Kim et al. [7], and aimed to improve the robustness of the geotextile tube installation process.
In Taiwan, geotextile tubes were first introduced in 1981; however, they were rarely utilized until the 2000s. Since the 2010s, the use of geotextile tubes for coastal engineering has boomed. Some cases have already proved that geotextile tubes can be used for tidal inlet restoration, wind-blown sand remediation, and sludge treatment. For example, Ho et al. [8] reported a case using geotextile tubes to restore a barrier island in Tainan City. During the construction, the barrier island beach exhibited an obvious phenomenon of sedimentation due to the effective closure of the tidal inlet. This project successfully closed the tidal inlet that formed due to erosion and was able to endure typhoons after the restoration had been completed. Wu et al. [9] reported a case in Taichung Harbor that used geotextile tubes for wind-blown sand remediation. This project used a specific type of geotextile tube that has a high strength, high water permeability, and light weight, and used 45,760 m2 of the geotextile tubes. Compared to rock armor with an equivalent weight, the CO2e were significantly reduced from 2700 T to 177 T.
Although geotextile tubes are commonly used for beach restoration or as a replacement for concrete-based groins and breakwaters, they can also be used to store and isolate contaminated sludge produced by dredging [10,11]. For example, Tseng et al. [12] conducted experiments and in situ sludge treatment using geotextile tubes. Firstly, mathematical calculations were undertaken to find the design strength of geotextile tubes, and then actual hydraulic tests proved that the geotextile tubes could endure the operation without damage. Two in situ dumping operations were carried out in Victoria Harbor, Hong Kong, and water quality monitoring and control were carried out during the dumping process. The results showed that with different filling amounts and materials, there was no damage or leakage, which proved that geotextile tubes are suitable for sludge treatment.
As well as actual engineering projects, studies have been conducted testing different geotextile tube designs, along with performance assessment, for possible future engineering implementations. Tseng et al. [13] used a physical hydraulic model to explore the utility of geotextile tubes exposed to typhoon-induced and monsoon-induced waves. Their experiments tested and discussed: (1) the stability of the offshore submerged breakwater, by changing the scale of geotextile tubes and observing their corresponding movement, critical wave height, and period in the open sea; and (2) the wave-eliminating effect of the offshore submerged breakwater and the applicability of replacing traditional offshore submerged breakwaters with geotextile tubes. Qiu et al. [14] conducted experiments similar to Tseng et al.’s but with performance comparison between traditional armor blocks and geotextile tubes. Their experiments also discussed the topographical changes and the wave runup phenomenon that occurred with both materials.
In general, geotextile tubes are widely used in general civil engineering structures, such as artificial sand dunes, cores of jetties, offshore submerged breakwaters, beach nourishment, bridge pier protection, temporary cofferdams, silt solidification, reservoir dredging, etc. The advantages of using geotextiles tubes are as follows: (1) mitigating the impact on soil water conservation due to gravel and sand exploitation; (2) reducing pollution, such as noise and dust, etc., caused by transportation of construction materials; (3) less likely to need temporary construction access roads; (4) lower cost of materials; and (5) greater energy efficiency compared to traditional construction methods. For example, when using geotextile tubes for coastal dune protection and restoration, their permeability allows vegetation to grow, attach, or root to their surface, which allows the installation site to recover its natural status rapidly (see Figure 1a,b). When using geotextile tubes as submerged breakwaters, algae can grow on the surface of the geotextile tubes, which means less disturbance to the nearby ocean environment. Actual engineering cases have shown that after installing geotextile tubes, the nearby ecosystem was rapidly restored (see Figure 1c,d). The above examples used the sand or sand slurry near the installation site as the fill material for the geotextile tubes (see Figure 1e,f); hence, there was no need for massive material transportation, which reduced the cost for material production and transportation, and reduced CO2 emissions as well. Geotextile tubes have also become a widely used green engineering material in various disaster prevention, restoration, and new construction projects in recent years. Compared with traditional engineering measures, implementing geotextile tubes in civil engineering is economical and eco-friendly. In the “CO2 Emissions Table of Taiwan Architecture Materials” [15], three engineering materials for breakwater construction, namely, geotextile tubes, armor block, and riprap, are calculated and compared. The results show that carbon emissions from geotextile tubes are significantly lower than those from the other materials (see Table 1; the detailed calculation is shown in the Appendix A).
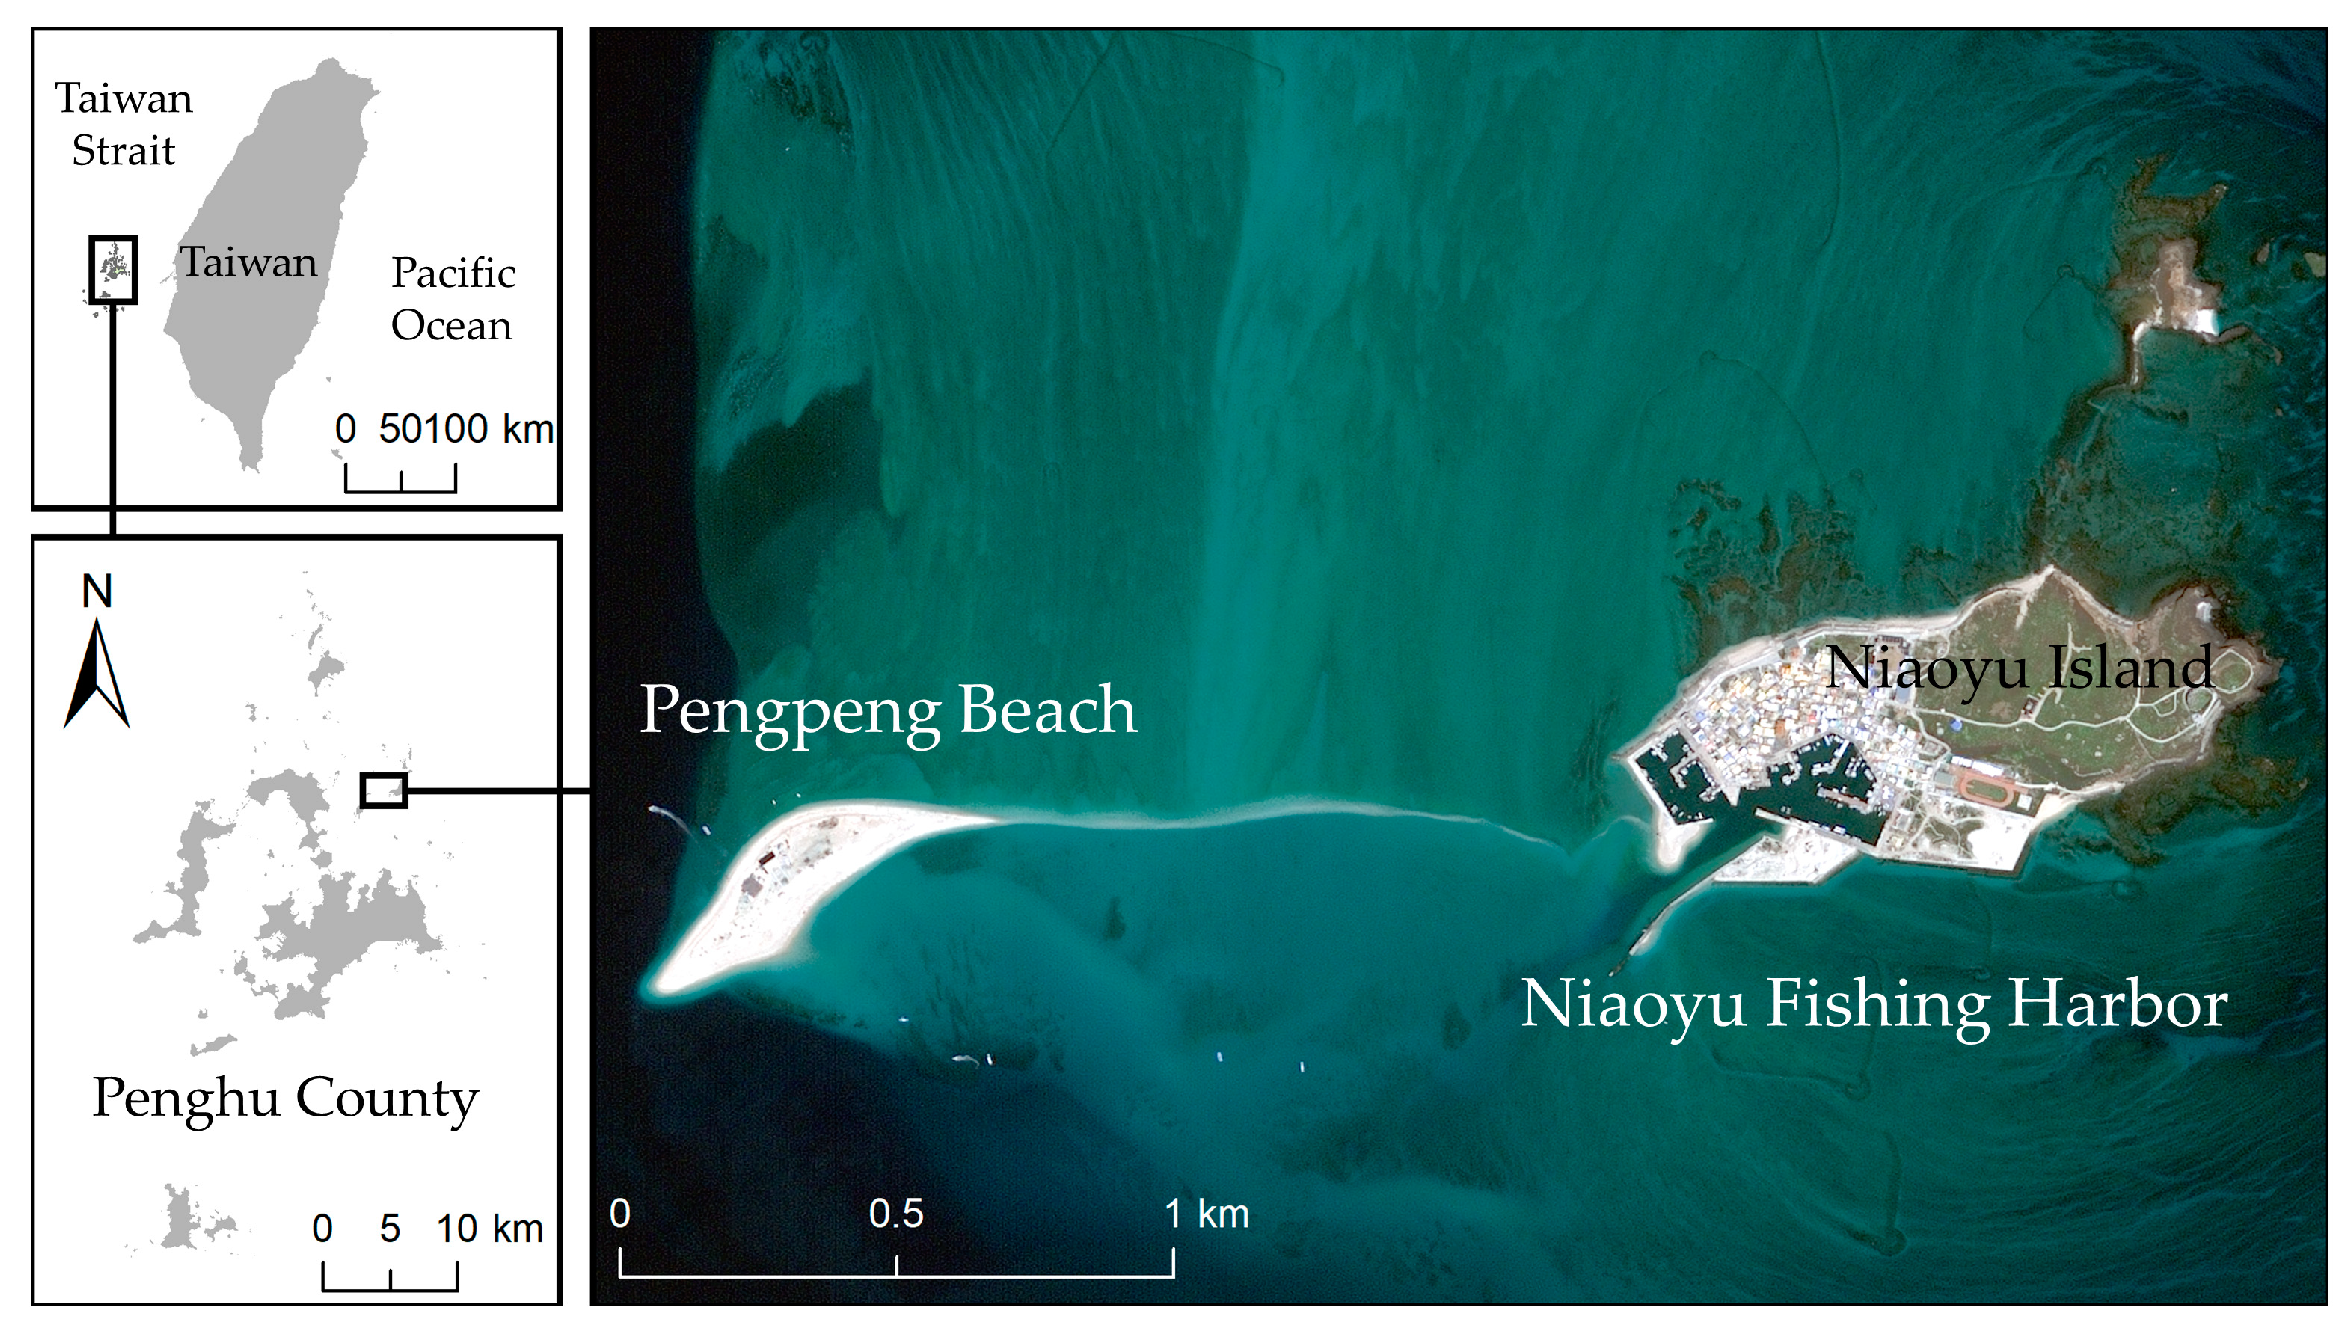
Pengpeng Beach sandbar, on the west side of Niaoyu Island in Penghu County, has been forming since 1995, and its sand tail has extended toward the Niaoyu Fishing Harbor as the sandbar has evolved. The fishing harbor and its navigation channel are facing serious siltation problems. As a result, the Penghu County government needs to allocate a significant amount of budget to dredging, which represents a notable financial burden for a local government. To resolve the siltation problem of the Niaoyu Fishing Harbor, various aspects, such as the ecological environment and recreation value of this specific location, need to be taken into account. The considered mitigation measures include the following:

1.1. Hard Solution

Submerged breakwaters or artificial reefs are underwater structures that can reduce wave and current energy and have less influence on water circulation, the ecological environment, and the landscape.

1.2. Soft Solution

Traditional coastal protection structures (hard solution) are constructed using large amounts of concrete, which is costly and usually does not match the coastal landscape. Geotextile tubes filled with sand or dredged materials are a cost-saving alternative to traditional methods. The CO2 emissions from the material production and transportation of the geotextile tubes are 2.4 kg/t. Compared to rubble mound breakwaters, the carbon reduction efficiency of geotextile tubes is 97.8% and 91.3%, respectively (see Table 1).
A stone weir is a long-established intertidal fishing facility with considerable historical value. Penghu has the most developed stone weir fishery, and probably the most stone weirs, in the world. They represent a very precious cultural asset. Stone weirs are located at the intertidal zone or nearshore area, and also have the function of a submerged breakwater to mitigate wave energy and trap the drift sand. In terms of shape, stone weirs can be roughly categorized into three types: arc stone weirs, single-pool stone weirs, and multi-pool stone weirs. About eight stone weirs are distributed on the south and north sides of Niaoyu Island, enriching the local fishery culture, biodiversity, and tourism resources (see Figure 2).
Based on the abovementioned considerations and options, a bathymetry survey and wave and current data were collected and analyzed to understand the mechanics of siltation near Niaoyu Fishing Harbor and the nearby Pengpeng Beach. Alternative silt mitigation plans were developed and evaluated based on numerical simulation under given scenarios.

2. Study Area

There are a total of 90 islands in Penghu County, which are scattered in a sea area with a length of more than 90 km from north to south and a width of more than 60 km from east to west. Of them, 19 are inhabited islands (see Figure 3). According to the report of the “Basic Information Survey on Coastal Protection of Penghu (2/2)” by the Seventh River Bureau of the Water Resources Administration of the Ministry of Economic Affairs (2013), there are currently 64 seawalls and breakwaters in Penghu, with a total length of about 26,089 m. The construction of seawalls and breakwaters in Penghu County began around 1978 and was generally completed by the 1980s. According to satellite images from 1996, the length of the artificial coastal structure was about 102,043 m, accounting for 27.1% of the entire coastline. Penghu County has high recreational value and has many sightseeing spots that attract tourists to visit. Niaoyu Island and Pengpeng Beach are two of them. The local government needs a source of sand to maintain Pengpeng Beach, and on the other hand, does not want the accumulated sediments in the harbor to affect the fishing industry at Niaoyu Island. Hence, resolving the siltation issue and protecting the fishing and recreational activities is of significant importance.

3. Methods

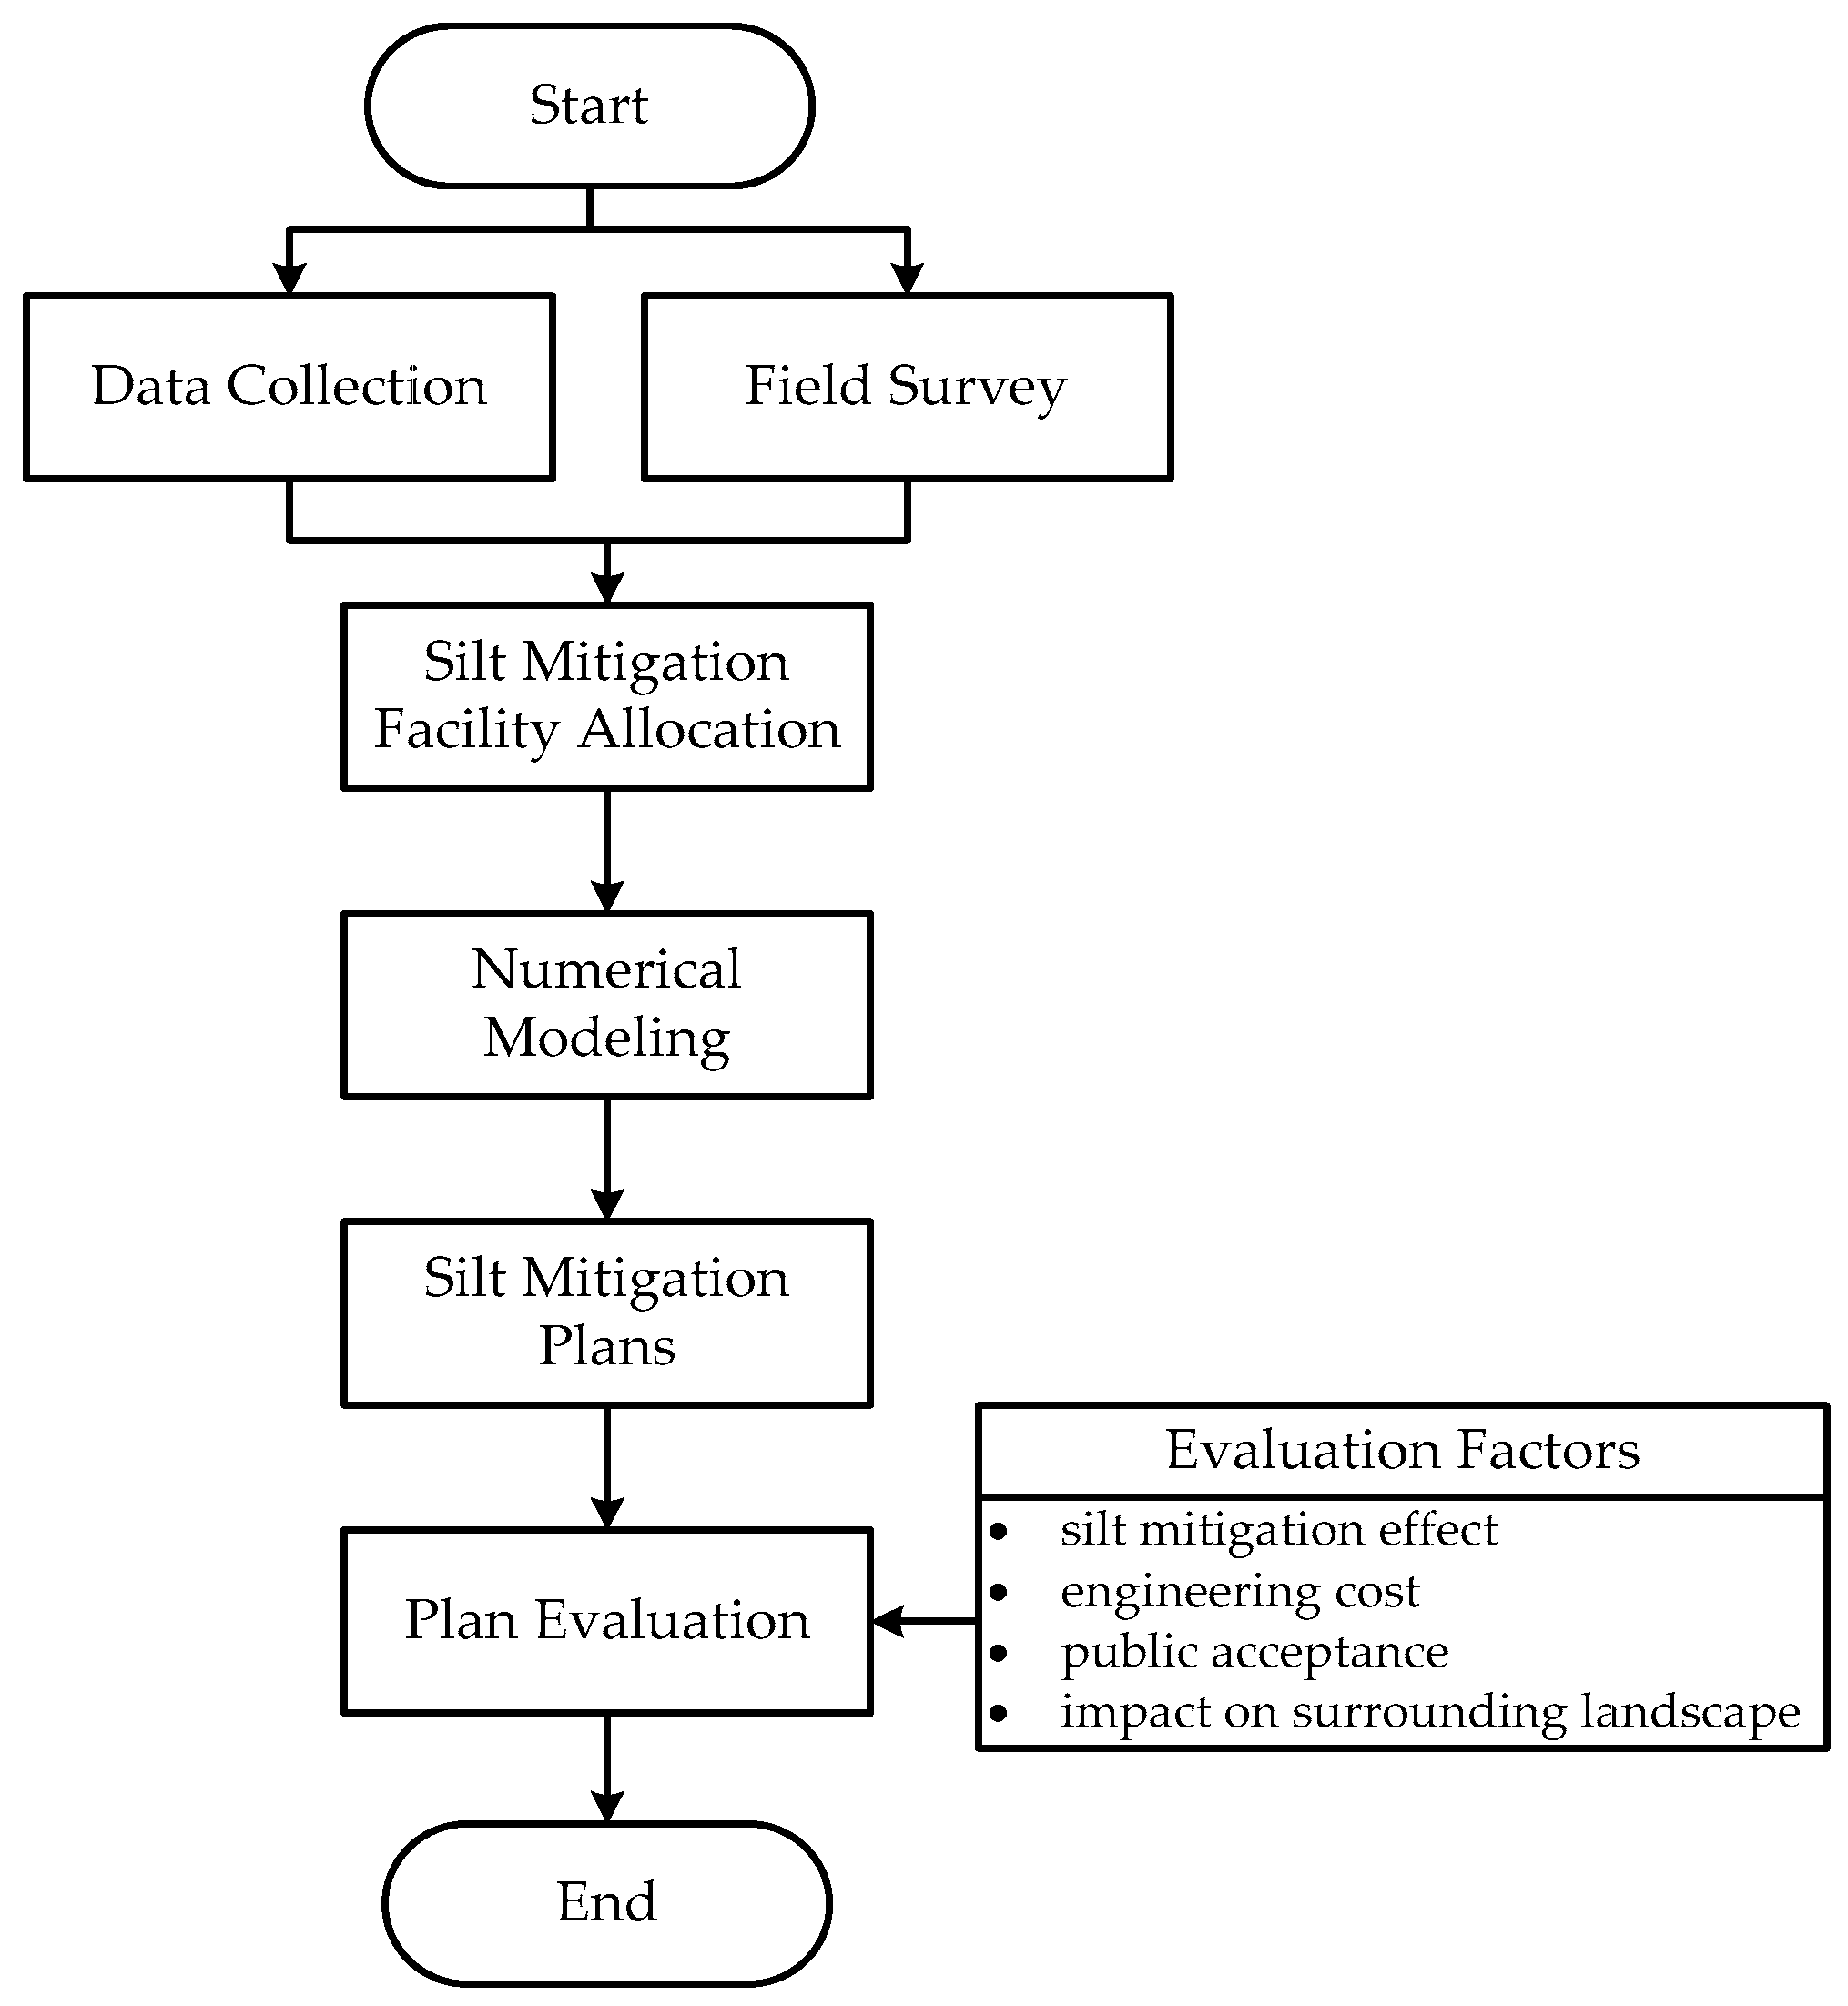
This study collected and analyzed basic data from the study area, including meteorological, geomorphological, geographical, and hydrological data. To understand the effects of waves and currents on the coastal topography of the study area, a bathymetry survey, land topographic survey, tide–wave–current observations, and sediment transport survey were carried out. Moreover, numerical modeling was conducted to investigate the mechanics of sedimentation and erosion in the study area. After gaining an understanding of the trend of sediment transport near Niaoyu Fishing Harbor and its navigation channel, silt mitigation plans were proposed and evaluated. The procedures for mitigation plan development and evaluation are shown in Figure 4. Firstly, the sea state, meteorology, hydrology, and geography data were collected, and the bathymetry survey and wave and current monitoring were conducted to access the characteristics and current status of the study area. Then, numerical models were developed based on designed silt mitigation measures and their locations. Following this, the simulation results were used as references for developing multiple silt mitigation plans. Finally, the mitigation plans were evaluated based on factors such as silt mitigation efficiency, engineering cost, public acceptance, and effects on the surrounding landscape.

3.1. Field Survey and Data Collection and Analysis

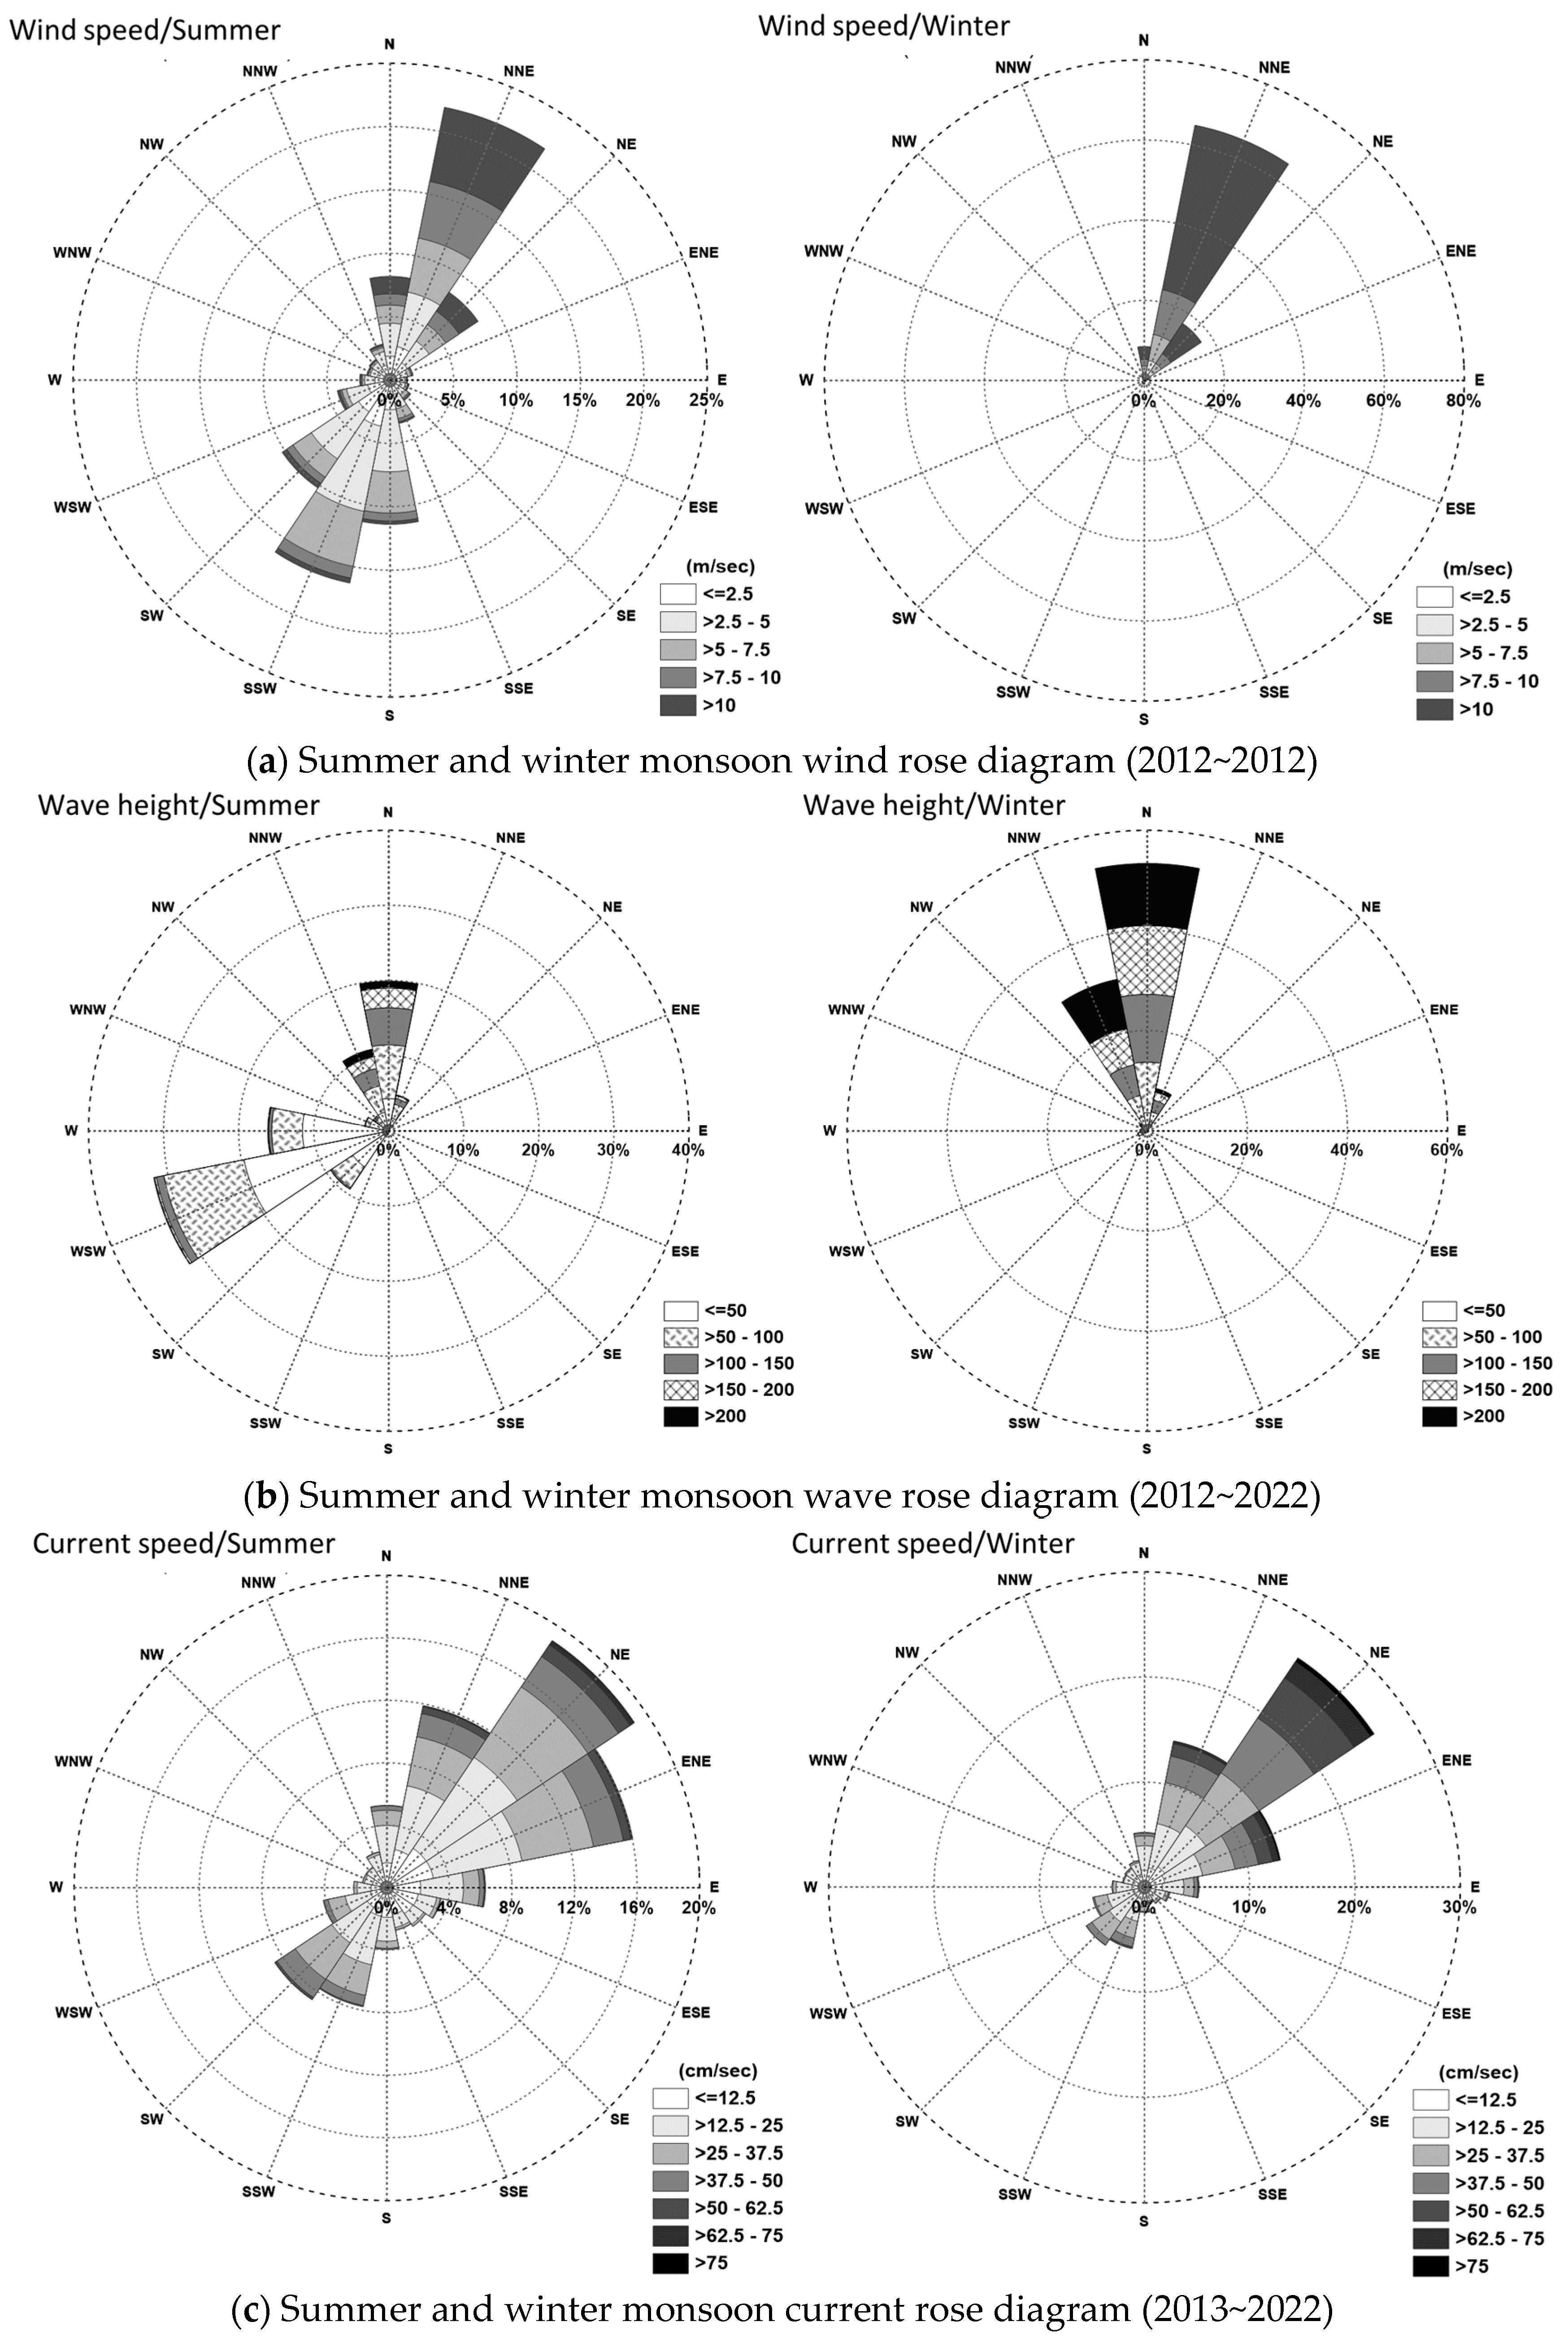
This study was based on a comprehensive analysis of the study area, including waves and currents, sediment transport, and coast characteristics. The wind, wave, and current data are collected from the Gupoyu and Niaoyu data buoys near the study area as shown in Figure 5. The statistical characteristics of the monitored sea state data are presented in rose diagrams as shown in Figure 6 and Figure 7 (note that here we define the current direction as the direction where the current comes from, so that the pattern shown in the rose chart is easier to compare with the wind and wave data). Figure 6 shows that at the Niaoyu data buoy, the dominant direction of wind is NNE to SSW. As for wave data, the dominant direction is NE to SW. Figure 7 shows that at the Gupoyu data buoy, the dominant direction of wind is NNE to SSW. For current data, the dominant direction is NE to SW. For wave data, two dominant directions are shown in the summer, which are N to S and WSW to ENE. In contrast, the dominant wave direction is from N to S in the winter. Overall, the dominant directions of wind and wave and current are between N to S and NE to SW, which indicates that the source of sediments are brought from the north side of the study area.
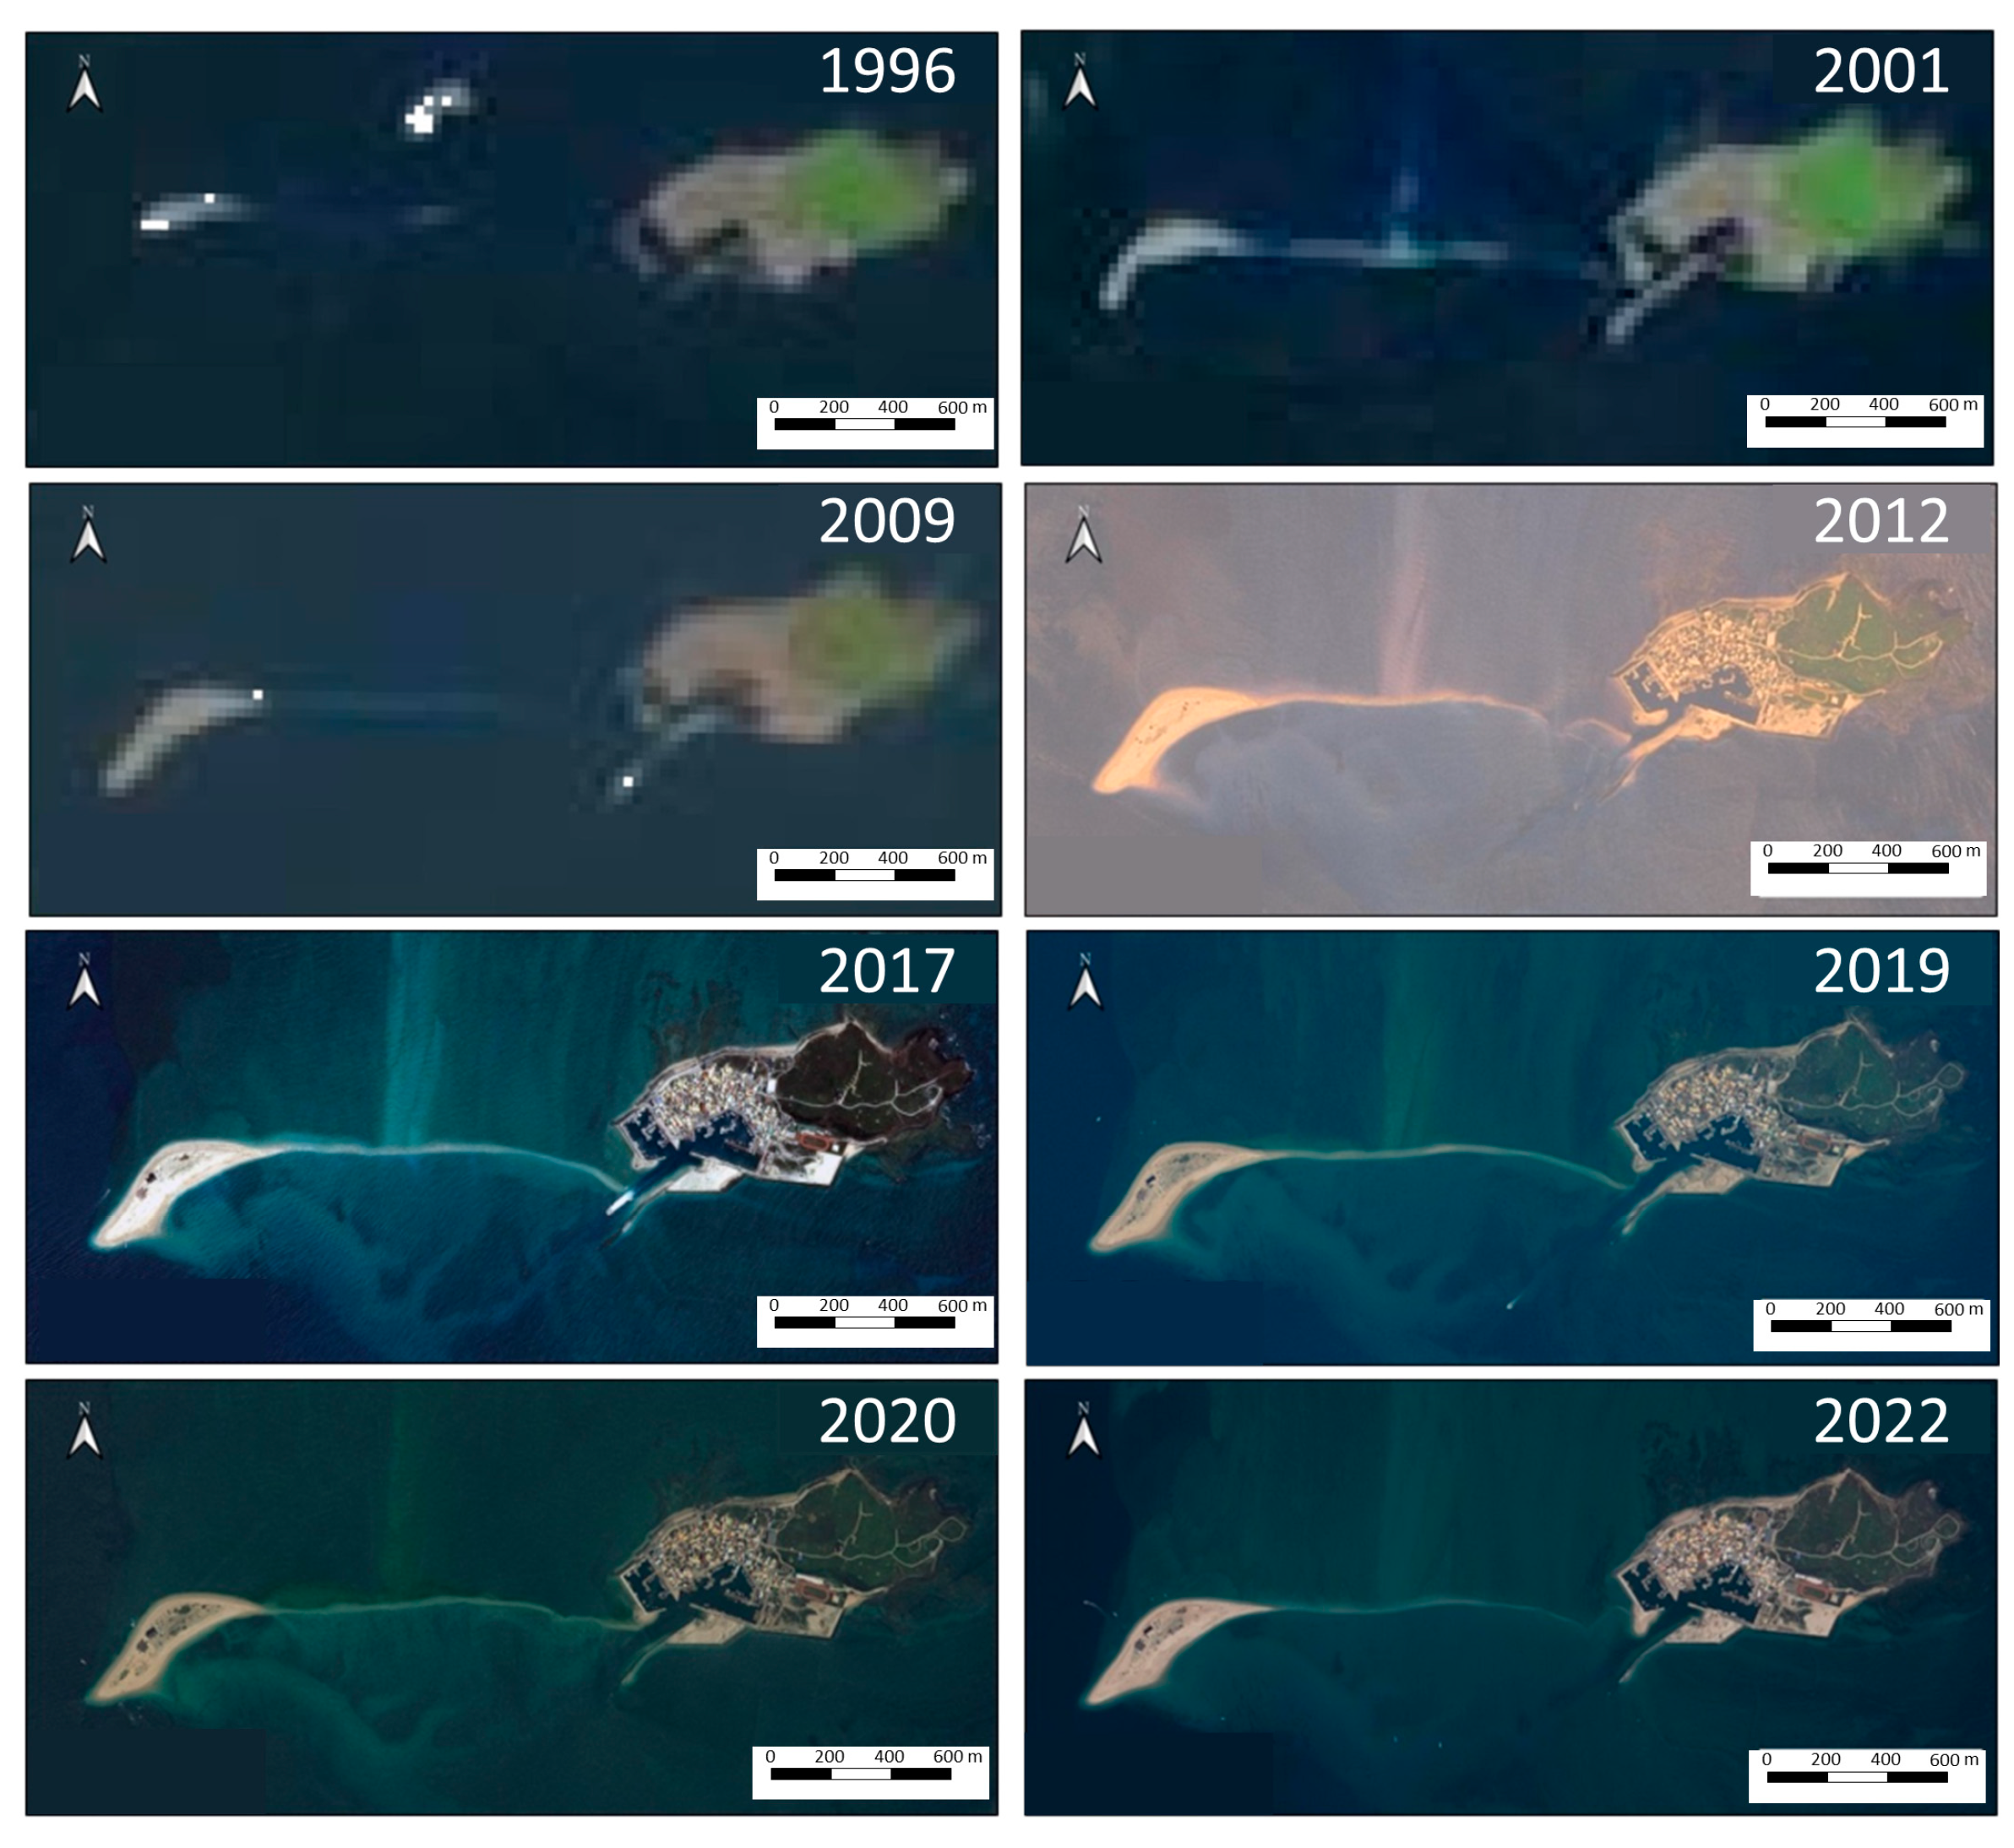
Landsat and SPOT satellite images taken from 1996 to 2022 were compared to examine the evolution of Pengpeng Beach and the siltation near Niaoyu Fishing Harbor (see Figure 8). The image selection criteria is based on NAO.99b tidal prediction model [16]. Images taken near the mean tide were selected, such that bias could be avoided when comparing the coastline and area among data at different years. The shoreline and area changes of Pengpeng Beach from 1996 to 2022 are shown in Figure 9 and Table 2. It can be seen that in 1996, Pengpeng Beach was located in a northern position with an area of 12,000 m2, then slightly expanded southwest in 2001. After 2009, Pengpeng Beach continued to grow to 50,000 m2 and moved southward. In 2012, compared to 2009, only the southern side had development toward the sea, and increased to 64,000 m2. In 2022, the trend of area increasing slowed down, reaching 65,675 m2, and only moved slightly southward. For the past 30 years, in general, the area of Pengpeng Beach has gradually increased, but the trend has slowed down from 2012 to 2022, and its position has a trend of moving southward.

3.2. Numerical Modeling

This study used MIKE21 software developed by the Danish Hydraulic Institute (DHI, 2022) to simulate the wave and current fields and topographic changes. MIKE21 can simulate complex seabed characteristics through the distribution of bottom grain sizes, rather than traditional methods that use a single median grain size to represent the characteristics of the seabed. The model configuration, validation, and modeling approach for this study are described as follows.

3.2.1. Bathymetry and Computational Grid Configuration

The bathymetry data used in numerical modeling were obtained from the Navy Oceanographic Office, while the offshore region used the global elevation data ETOPO2v2 [17] published by the National Geophysical Data Center. The bathymetry data have a resolution of 2’ × 2’ (approximately 4 × 4 km). The simulation employs an unstructured triangular grid method for computation, with the simulation range extending from approximately 14° south latitude to 30° north latitude, 111° west longitude to 135° east longitude, covering southeast China, Taiwan, and north Philippines (see Figure 10). In order to obtain higher resolution results, the coastal areas near Taiwan, Penghu, Kinmen, and Matsu were simulated with finer grids, while the offshore areas used coarser grids. In total, there are 3445 nodes and 5924 elements.
In order to achieve higher precision modeling results, the bathymetry data used in the nearshore area are based on in situ measurements. Moreover, finer grids are used for the study area, while coarser grids are used for the area outside of the study area (Figure 11).

3.2.2. Spectral Wind Wave Model

The driving force for the wave modeling is the NCEP wind fields. The NCEP wind field data are developed by the National Centers for Environmental Prediction (NCEP) and the National Centers for Atmospheric Research (NCAR) as part of the NCEP/NCAR Reanalysis Project [18]. This project began in 1989 and aims to reanalyze existing climate data from 1948 to the present day and develop a climate data assimilation system (CDAS) to analyze current atmospheric conditions. The system incorporates various types of observational data, including surface observations, ship and aircraft observations, radiosonde observations, satellite observations, etc., and goes through data quality control procedures, to develop this climate data assimilation system. The NCEP/NCAR project has data from 1948 to the present, with data time scales including 6-hourly, daily, and monthly, with data items including temperature, surface temperature, subsurface temperature, pressure, humidity, wind speed, etc. This study uses NCEP’s 6-hourly wind speed data 10 m above sea level for the area spans latitude 88.542º~−88.542º, longitude 0º~358.125º. The wind field data have a resolution of 1.875º × 1.875º.

3.2.3. Boundary Conditions

The wave boundary conditions for the topographic change numerical modeling in this study are extracted from the results of the wave model calculations as the offshore wave conditions, while the flow boundary conditions are based on the output results of the NAO.99b model proposed by Matsumoto et al. [16] as the dynamic boundary conditions required for astronomical tide calculations using the MIKE21 model.

3.2.4. Model Validation

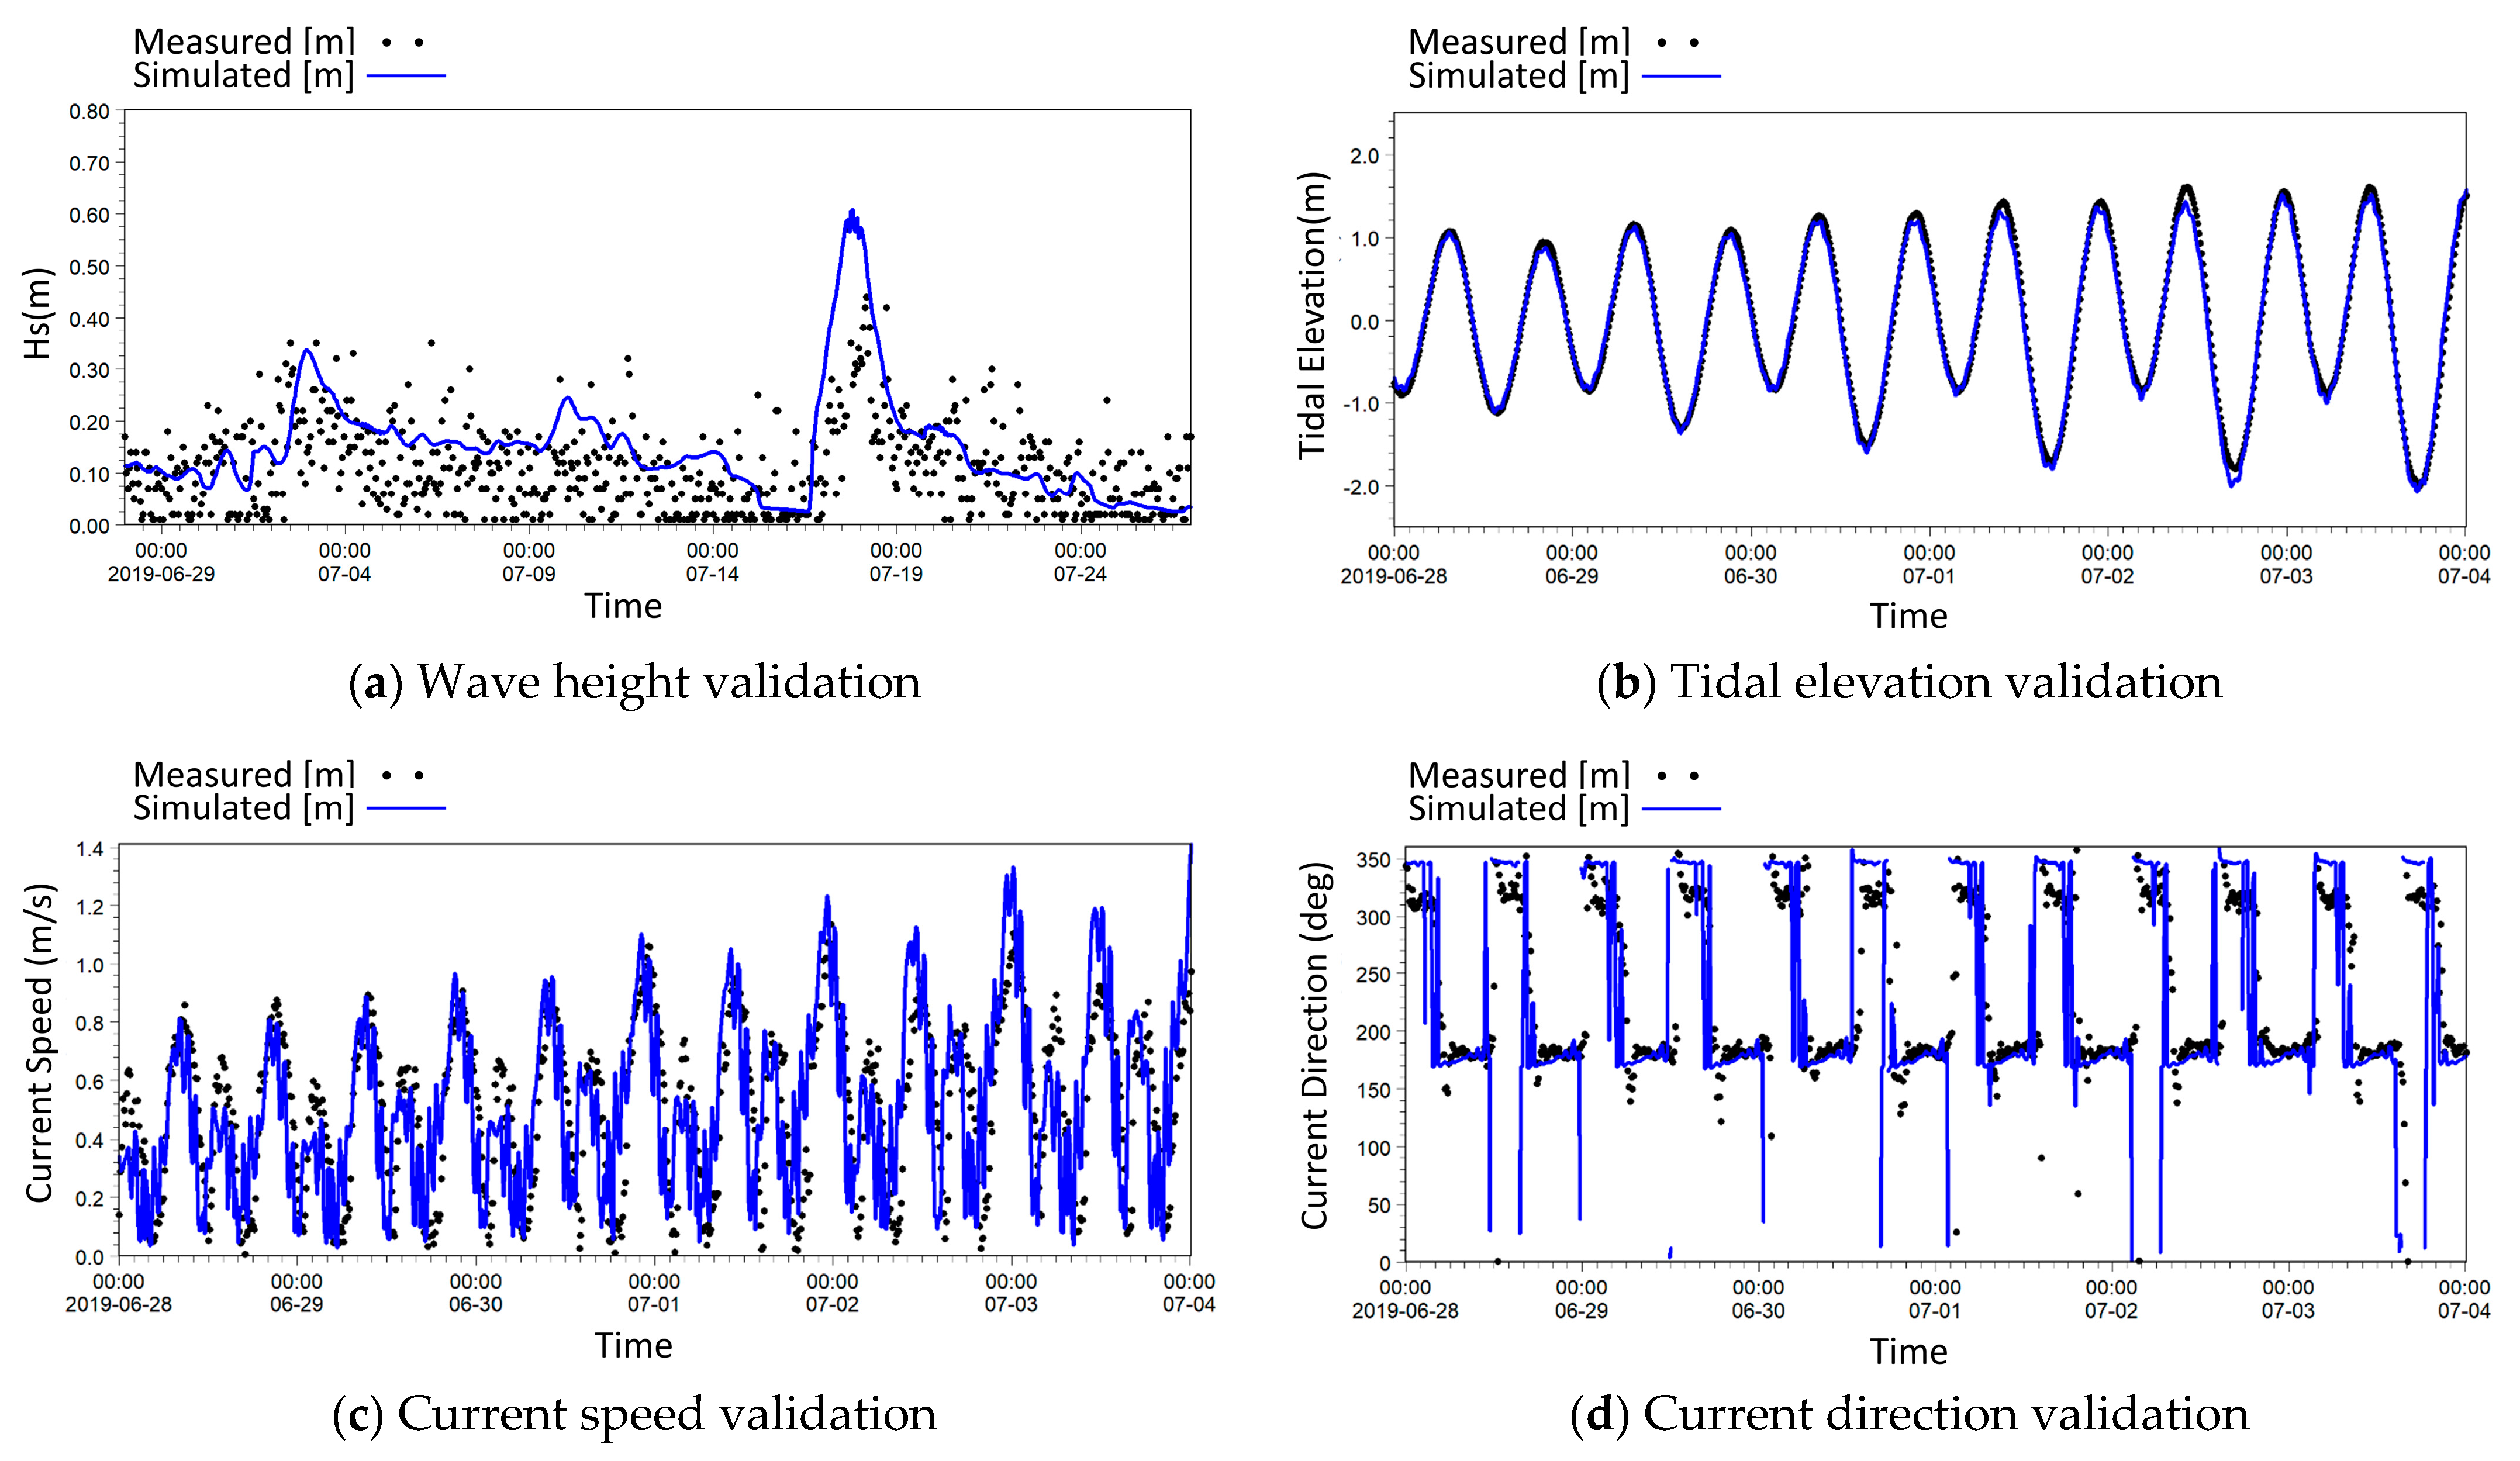
The model validation was undertaken by comparing the field measured sea state data and simulated values. Figure 12 shows the results of significant wave height, tidal elevation, current speed, and current direction. MIKE21, used in conjunction with the boundary settings of this project, was able to present the overall characteristics and distribution trend of the tide level and tide time in the study area. The scenario with wind and wave action for one year in the study area was used to simulate the topographic changes for each of the developed silt mitigation plans.

3.2.5. Short-Term Erosion Trend Numerical Modeling

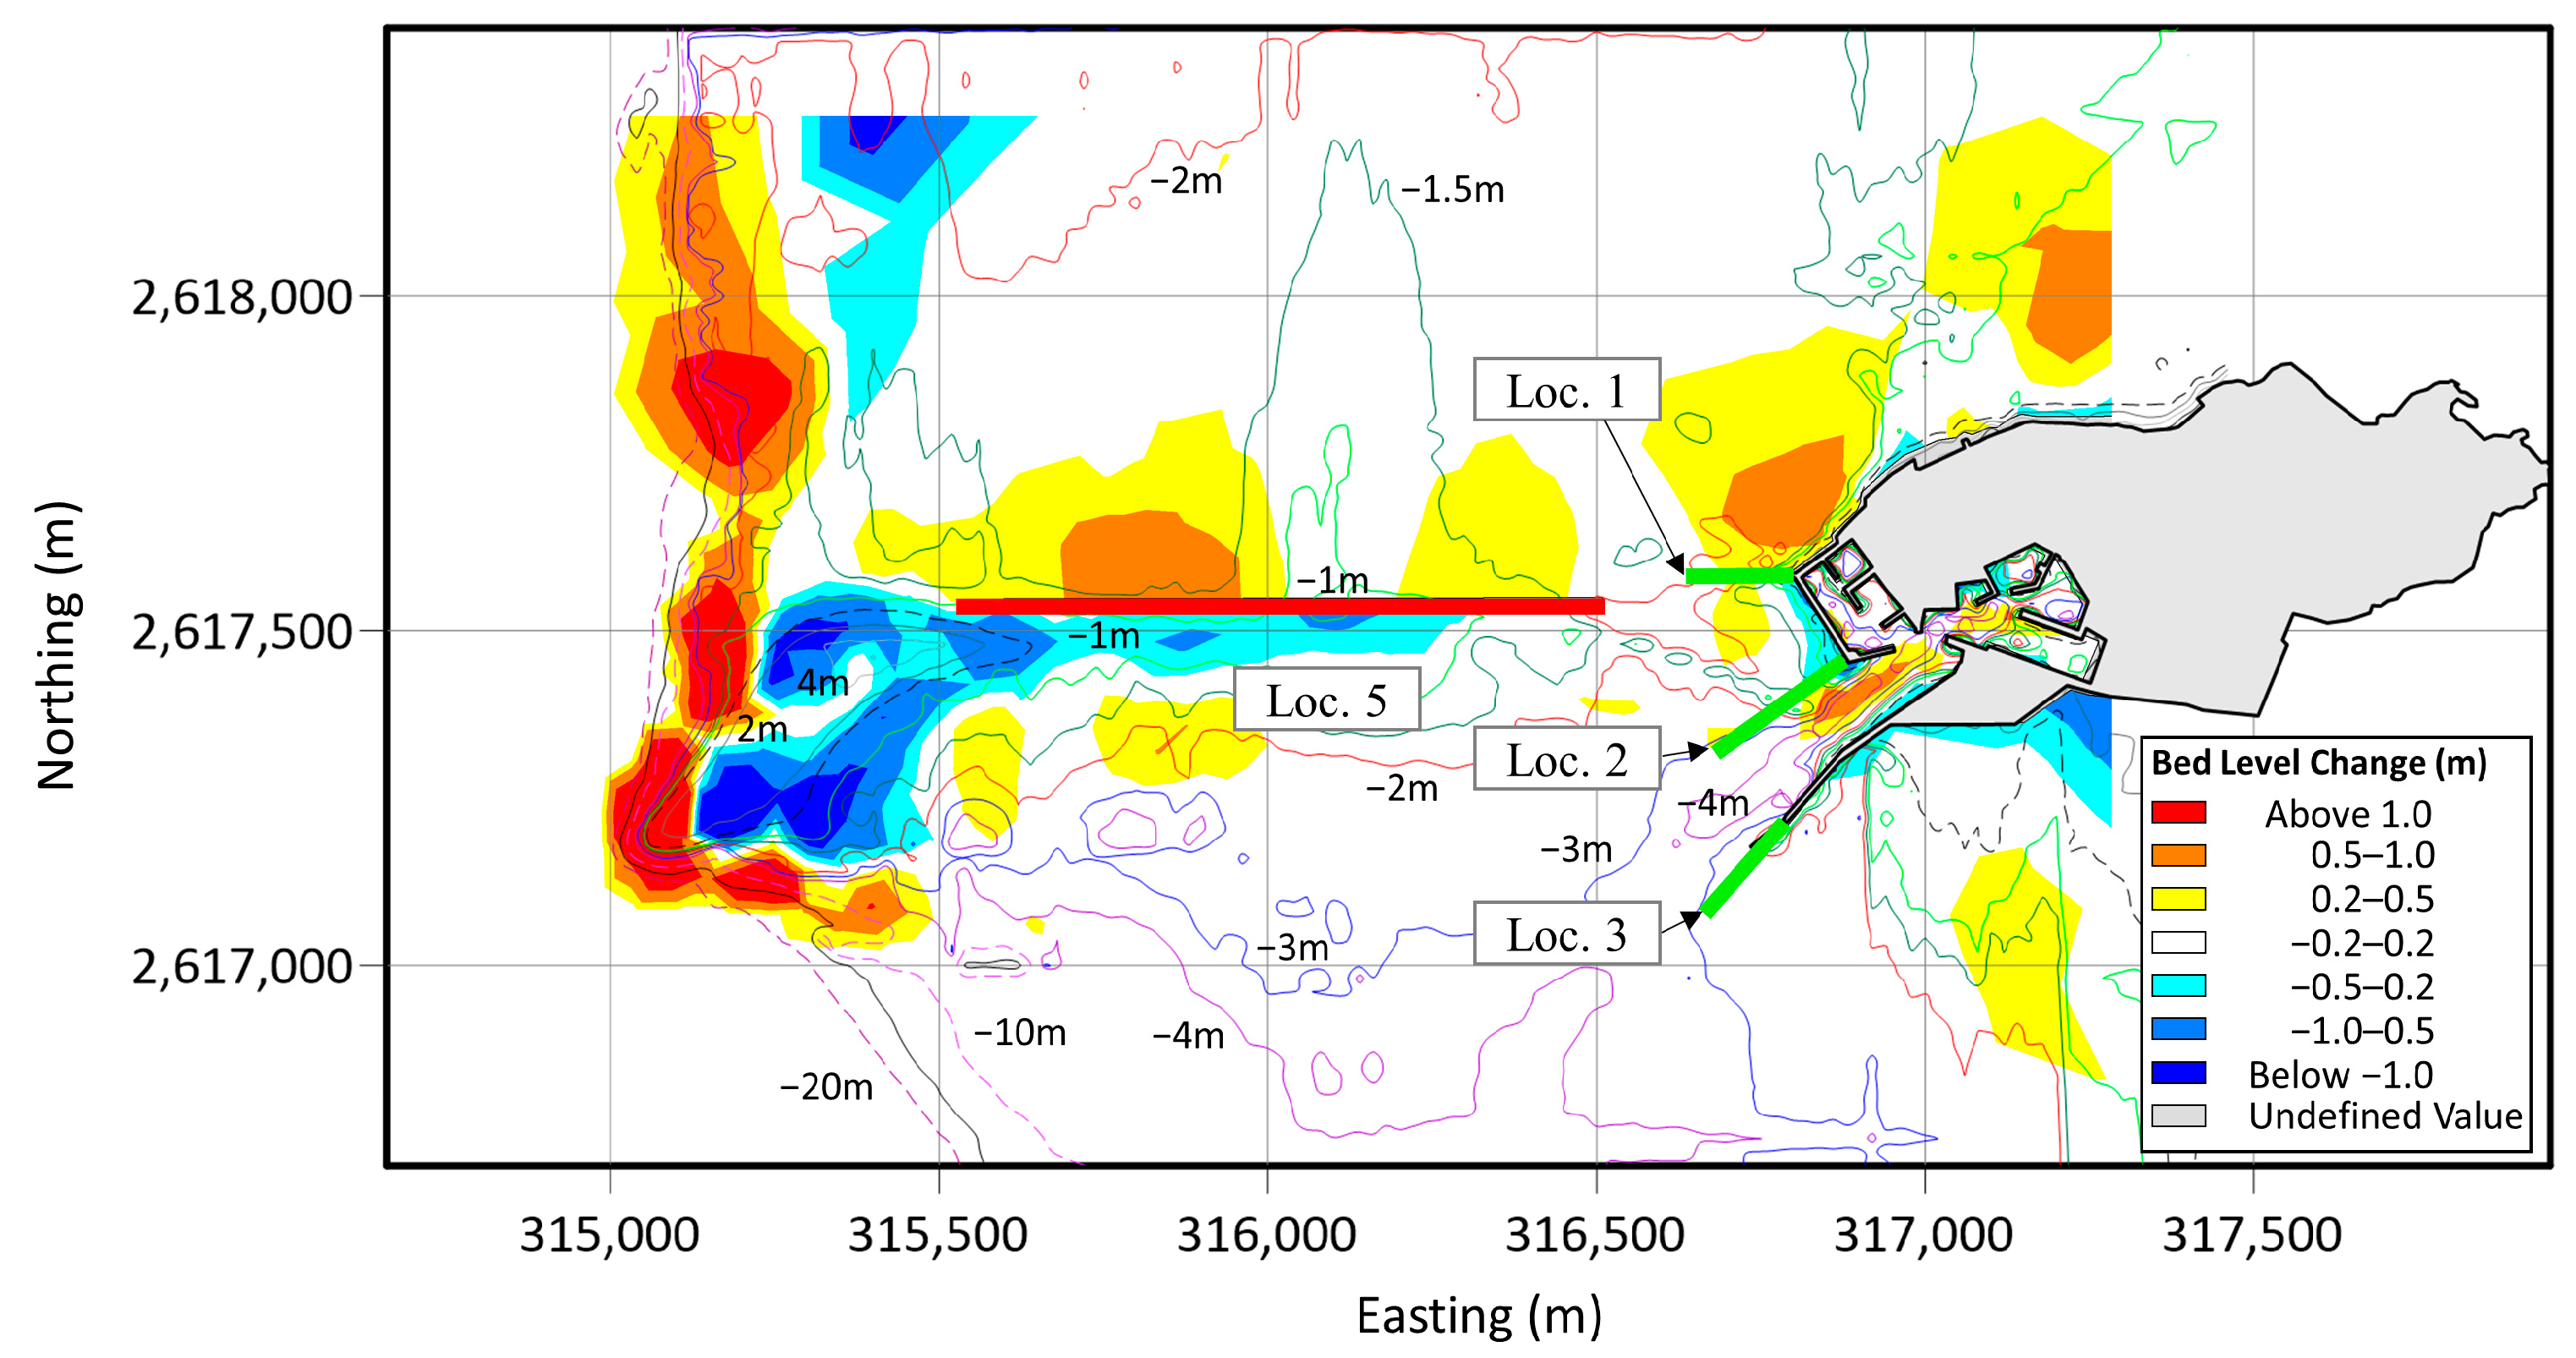
Firstly, the wave prediction model is used to simulate the wave field for an entire year from 1 August 2018 to 1 August 2019, including the actual effects of seasonal winds and typhoons. Then, in conjunction with the wave prediction model’s results and the NAO.99b model’s tide simulation results, we simulate the characteristics of topographic changes caused by the hydrodynamics and waves in the area. In the simulation process, the topography changes at each time step and the wave field and flow field are recalculated after the topography has changed at the next time step. Figure 13 shows that after a year of wave action, Pengpeng Beach shows a trend of erosion near the coast and siltation far from the coast. The area between Pengpeng Beach and Niaoyu Fishing Harbor, including the navigation channel, shows a trend of siltation.

3.3. Silt Mitigation Measures

Common methods for silt mitigation for ports and navigation channels are (1) installing silt trap facilities, such as submerged breakwaters, and (2) performing periodic (or non-periodic) dredging. In this study, geotextile tubes or rubble mound breakwaters with geotextile tube cores with proper shape design were used as the silt mitigation measure for trapping the sediments. This composite measure has three characteristics: (1) the submerged breakwater structure can achieve silt trapping functionality; (2) the use of geotextile tubes can resolve the problems of transportation of the dredged sediments by using them as the fill material; (3) the design shape of the breakwater is in line with the stone weirs nearby, which reduces the impact on the surrounding landscape.

3.4. Engineering Costs Estimation

Based on the developed silt mitigation plans, which include the facilities layouts and breakwater design cross-sections, and the materials used, the engineering costs were estimated and used as one of the evaluation factors.

4. Results

4.1. Silt Trap Facilities Allocation

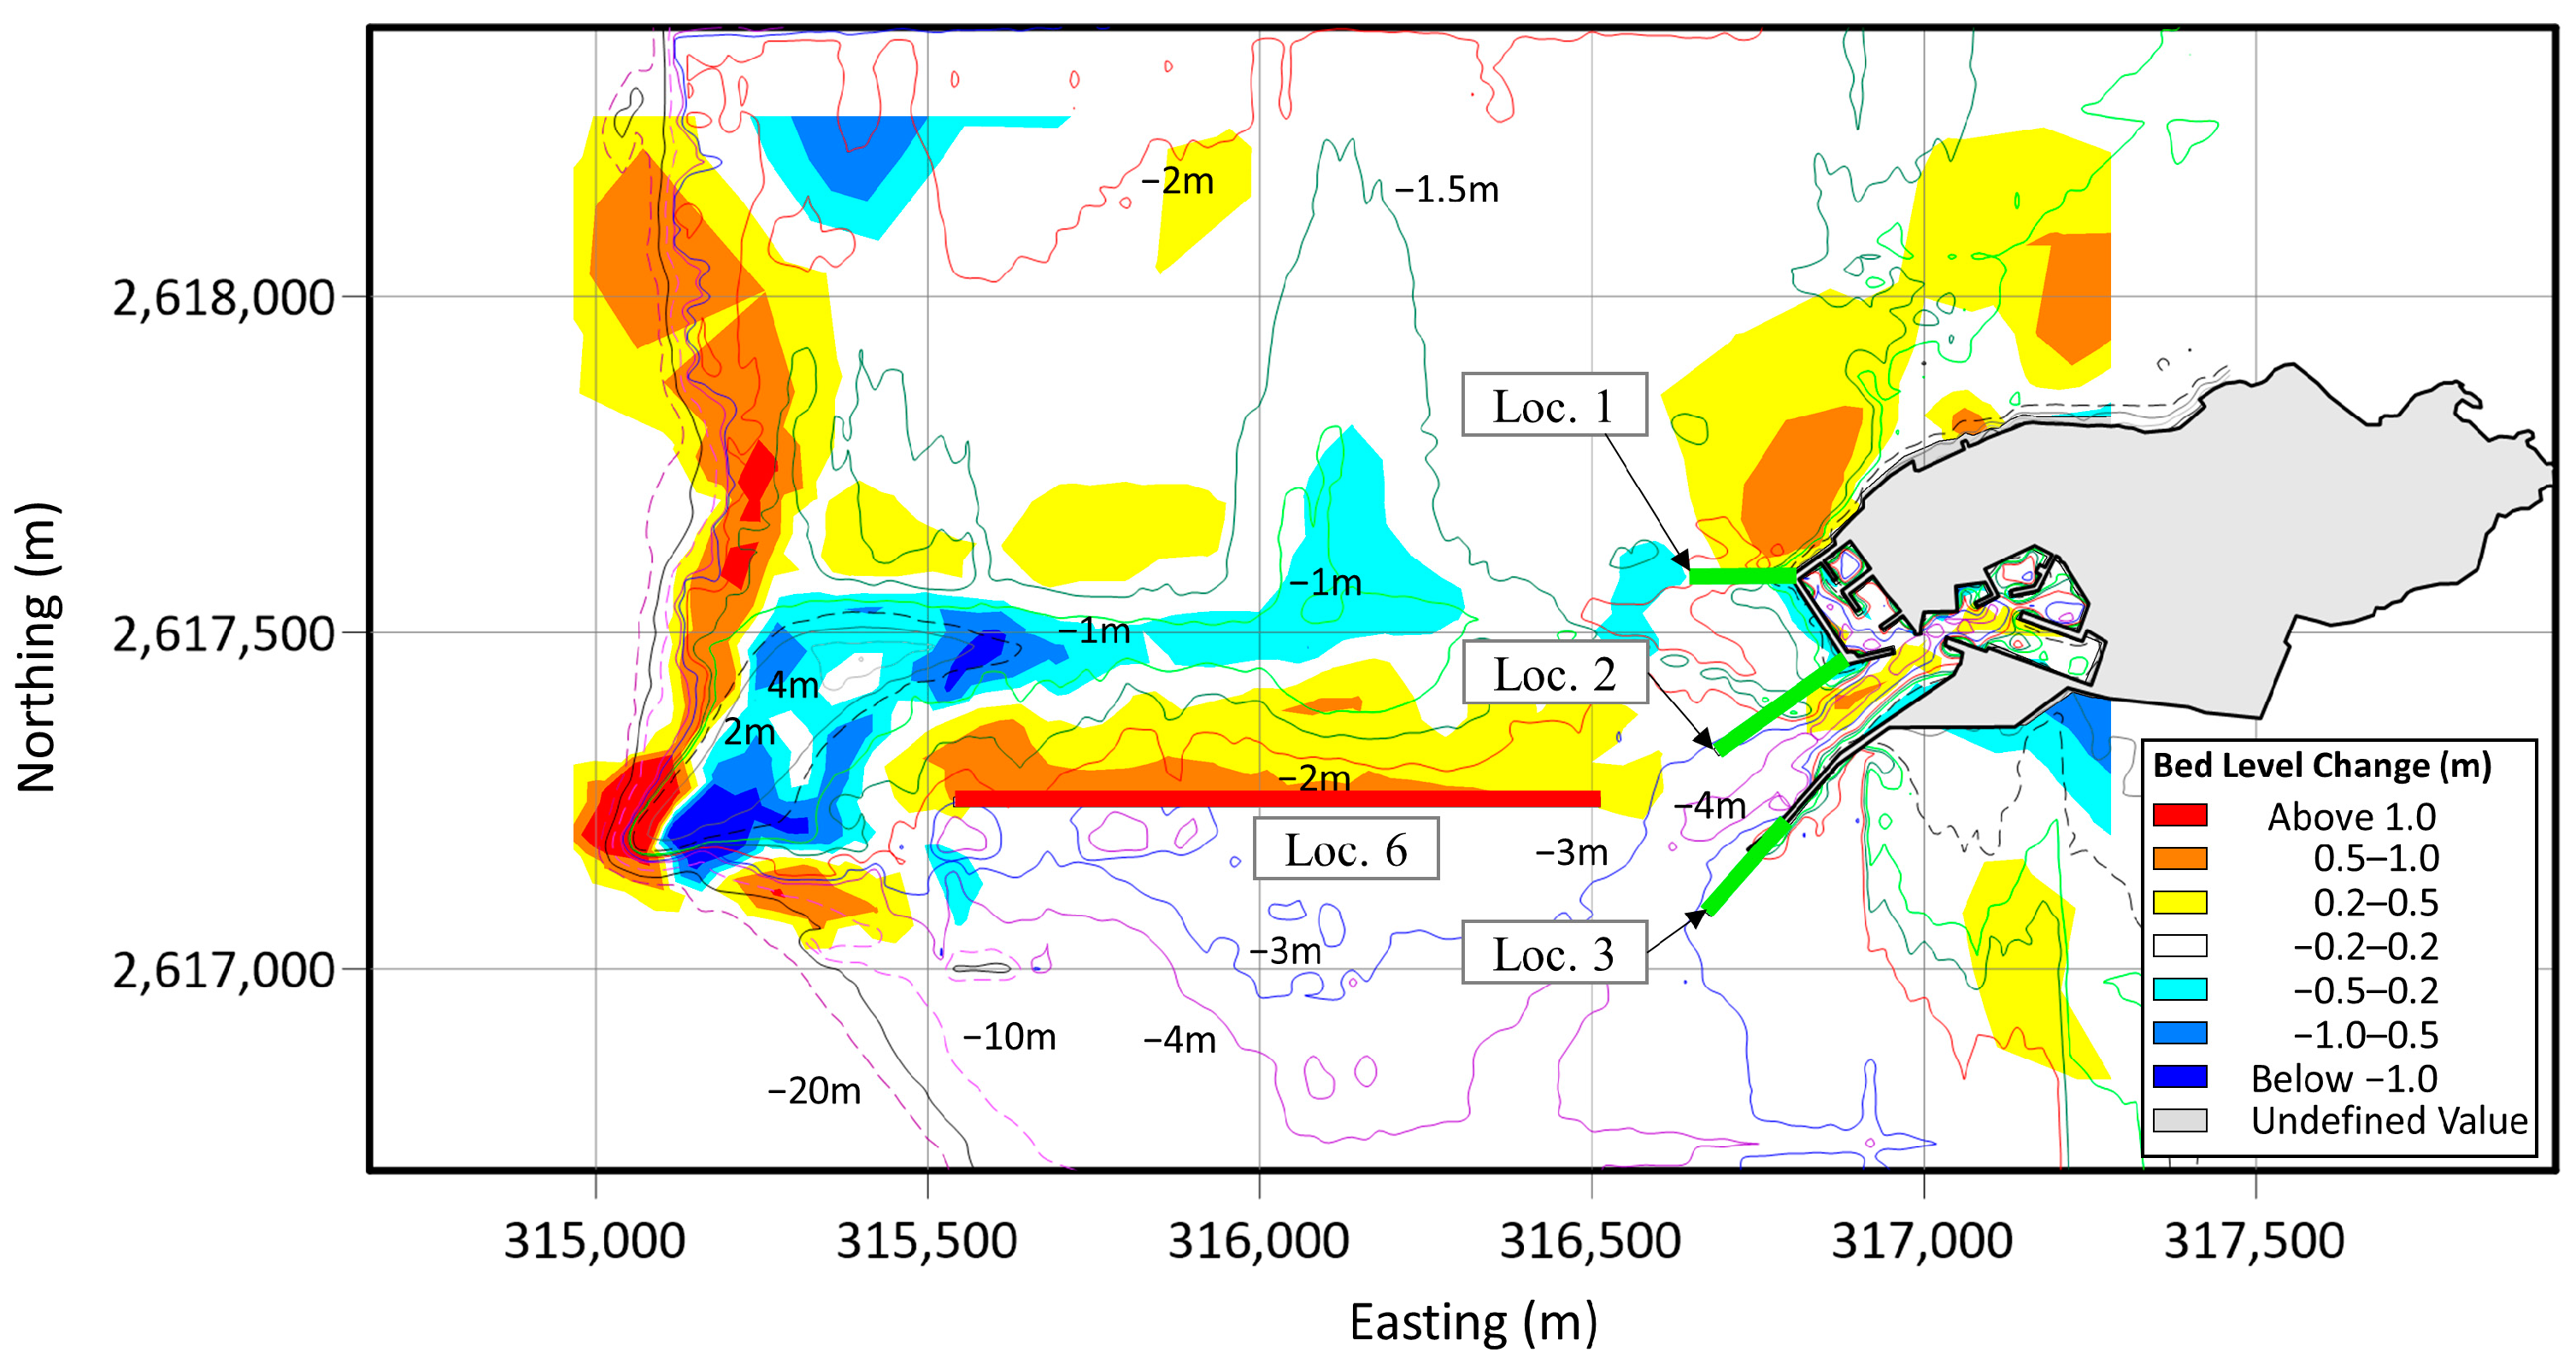
To develop a proper silt mitigation plan for Niaoyu Fishing Harbor, various locations for silt mitigation facilities were selected for evaluation. To prevent drift sand from entering Niaoyu Fishing Harbor, silt trap facilities were placed at locations 1, 2, and 3. Additionally, based on the dominant sand drift direction, silt trap facilities were placed at alternative locations 4, 5, and 6 (see Figure 14). The basic profile of the silt trap facility is shown at the top-right corner of Figure 14, in which the top elevation of the geotextile tubes was −0.5 m. Three configurations were tested: (1) Configuration 1: silt facilities were placed at locations 1, 2, and 3, and an additional silt facility was placed at location 4; (2) Configuration 2: silt facilities were placed at locations 1, 2, and 3, and an additional silt facility was placed at location 5; and (3) Configuration 3: silt facilities were placed at locations 1, 2, and 3, and an additional silt facility was placed at location 6. The results are shown in Figure 15, Figure 16 and Figure 17, and described below.

4.1.1. Near Pengpeng Beach (x = 315,000~315,500 m)

When the additional silt trap facility was placed at location 4, it showed a trend of erosion at the north side of Pengpeng Beach, which was because the drift sand from the north was blocked by the sand trap facility. When the additional silt trap facility was placed at location 5, it showed a trend of erosion at the north side of Pengpeng Beach as well; however, the erosion trend at the north side of the sandbar was mitigated. When the additional silt trap facility was placed at location 6, the erosion trends at Pengpeng Beach and its north side were all mitigated. In summary, placing a silt trap facility at location 6 achieved the best silt trap efficiency for Pengpeng Beach.

4.1.2. At the Niaoyu Harbor Entrance and Its Navigation Channel (x = 316,700~317,200 m)

The simulation results showed that the sedimentation at the port entrance and navigation channel decreased when the additional silt trap facility was placed at locations 4, 5, and 6, respectively.

4.1.3. At the South and North Sides of Niaoyu Island

For Configuration 3, the sedimentation trends were similar to each other. Overall, the simulation results showed that, with silt trap facilities placed at locations 1, 2, 3, and 6, the smallest erosion effect was achieved near Pengpeng Beach, and the least sedimentation entered the Niaoyu Harbor entrance and its navigation channel.

4.2. Silt Mitigation Plans

The above discussion showed that installing the silt trap facility at the south side of Pengpeng Beach, as well as the south and north sides of the Niaoyu Port entrance, is the most efficient way to mitigate the siltation problem in the study area. The proposed silt mitigation plans also took into account the local ecology, tourism, and fishery industry. The planning process incorporated the government’s policy of energy conservation and carbon reduction, and it integrated the unique stone weirs in this area. A submerged breakwater constructed using geotextile tubes, or a rubble mound breakwater with geotextile tubes as the core, was used as the silt trap facility. In addition, the shape of the submerged breakwater was designed to imitate the curved shape of the stone weir so that it did not conflict with the surrounding landscape. Workshops for residents and placeholders were held to achieve consensus, and, finally, the silt mitigation plans were developed.
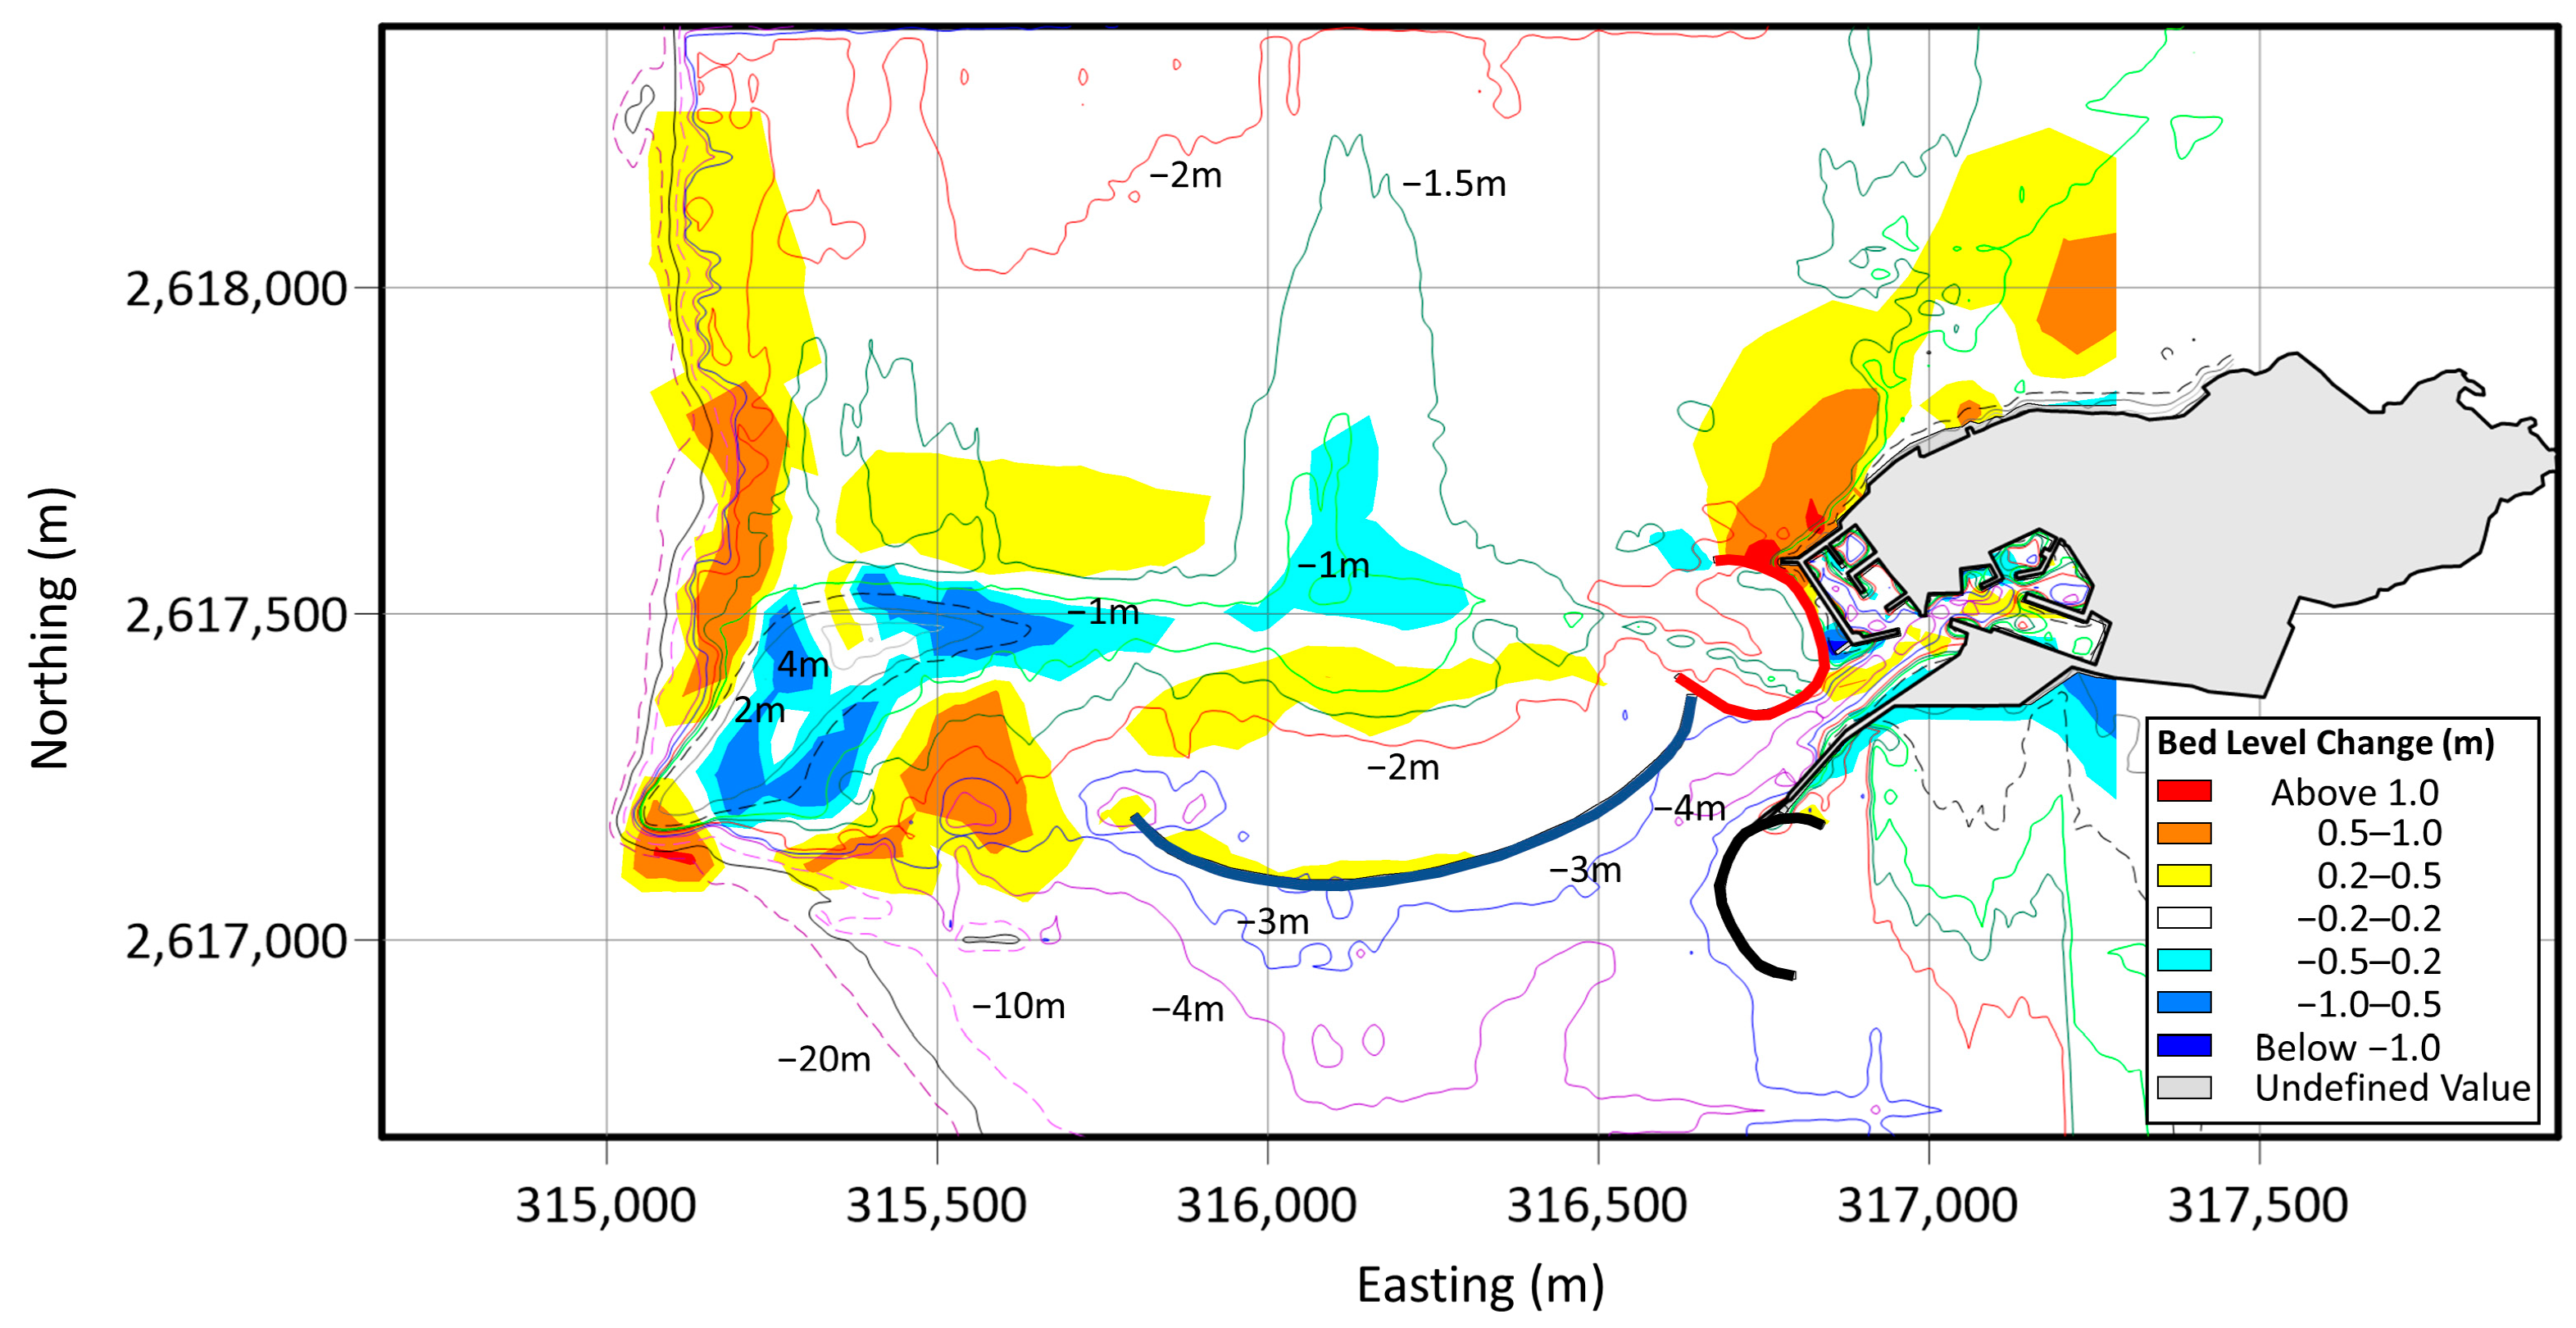
The layout of the design setup is shown in Figure 18. For each silt trap facility location illustrated, different cross-section design types were implemented. These design types and associated silt trap facility setups are listed in Table 3. The main design of the breakwater was geotextile tubes covered with rock armor. The design drawings of the cross-sections are shown in Table 4. In setup #1 and #2, the breakwaters with Type B and Type C designs were placed near the –2 m depth contour, and the elevation of the breakwater top was about −0.5 m, which meant it was able to block the silt from the north side of the port and the navigation channel, and the intercepted silt could form a beach to increase the tourism and recreation utilities.
In setup #3, the breakwater with the Type A design was placed near the –3 m depth contour, and the elevation of the breakwater top was about –1.0 m, blocking the silt from the south side of the port and the navigation channel. In setup #4, the breakwater with the Type A design was placed near the –3 m depth contour, blocking the silt from the south side of the sandbar to the navigation channel. The dredged sediments from the port and navigation channel were used as the fill material of the geotextile tubes, reducing the cost for dumping the sediments during the construction process. The developed silt mitigation plans were as follows:

4.2.1. Mitigation Plan 0

Maintain the status of the local environment. No construction work is implemented, but periodic (or non-periodic) dredging is continued as the silt mitigation measure.

4.2.2. Mitigation Plan 1 (Combination of Setup #1, #3, and #4)

Place a 500 m submerged breakwater (Type B design) on the north side of the navigation channel, another 500 m of submerged breakwater (Type A design) on the north side of the navigation channel, and another 1000 m of submerged breakwater (Type A design) on the south side of the Pengpeng Beach sand tail.

4.2.3. Mitigation Plan 2 (Combination of Setup #2, #3, and #4)

Place 500 m of submerged breakwater (Type C design) on the north side of the navigation channel, another 500 m of submerged breakwater (Type A design) on the north side of the navigation channel, and another 1000 m of submerged breakwater (Type A design) on the south side of the Pengpeng Beach sand tail.
Then, based on plan 1 and plan 2, numerical models were developed to simulate the topographic changes under the action of wind and waves for one year (see Figure 19). Compared to the simulations described in Section 4.1 (Figure 17), the silt trap efficiency was better. The accretion depth at the port entrance and navigation channel was less.

4.3. Mitigation Plan Evaluation

The evaluation of the plans was based on the following factors: (1) silt mitigation effect; (2) engineering cost; (3) public acceptance; and (4) impact on the surrounding landscape. A comprehensive evaluation of mitigation plans 1, 2, and 3 was carried out, and the best one was selected as the final proposed plan. The analysis results were as follows:

4.3.1. Silt Mitigation Efficiency

The comparison of the simulation results of mitigation plans 0, 1, and 2 ( see Figure 19; note that plan 1 and 2 have the same setups) showed that for mitigation plan 0, the accretion depth at the port entrance and navigation channel could reach 1 m. On the other hand, the accretion depths in mitigation plan 1 or 2 were approximately 0.2~0.5 m less than that in mitigation plan 0.

4.3.2. Engineering Costs

When evaluating the engineering costs of the silt mitigation plans, the main consideration was the total project cost and durability of the installed breakwater. The estimates of the cost required for each plan are shown in Table 5, Table 6, Table 7 and Table 8. The tables show that the total cost of mitigation plan 1 was NTD 53.1 million, which was slightly higher than that of mitigation plan 2 (NTD 47.5 million). However, in mitigation plan 1, setup #1 uses geotextile tubes covered with rock armor; therefore, it will be more durable, whereas in mitigation plan 2, setup #2 only uses geotextile tubes as the breakwater, which will be less durable and may increase the cost of maintenance. Although there is no engineering construction in mitigation plan 0, the periodic dredging of the port entrance and navigation channel still cost about NTD 8 million every other year.

4.3.3. Public Acceptance

The opinions gathered from the workshops for residents and stakeholders indicated an expectation for the plan to be carried out as soon as possible. To resolve the siltation problem, mitigation plans 1 and 2 were both accepted.

4.3.4. Impact on the Surrounding Landscape

The engineering measures adopted in the mitigation plans involved submerged breakwaters that use geotextiles with rock armor or geotextile tubes only. The shape of these breakwaters was designed to imitate the nearby stone weirs. Therefore, the impact on the surrounding landscape was reduced.

4.4. Mitigation Plan Selection

Taking the silt mitigation efficiency, public acceptance, and impact on the surrounding landscape as the benefit factors, and engineering cost as the cost factor, the weights of the four factors were set as 40, 25, 25, and 10, respectively. The score for each factor had a scale of 1 to 5, in which 1 represents very poor, 2 represents poor, 3 represents average, 4 represents good, and 5 represents excellent. After evaluating the factors by giving scores based on the above criteria, the scores of all factors were multiplied by their corresponding weights and then added together to calculate the final score for each mitigation plan. Finally, the plan with the highest final score was selected as the proposed plan. Table 9 shows the evaluation factors, corresponding weights, and the rating results of all plans. According to Table 9, mitigation plan 1 and plan 2 were both better than plan 0, while the construction method of plan 2 at the north side of the navigation channel only used geotextile tubes without the rock armor, which had less impact on the surrounding ecologic environment and landscape. The developed silt mitigation plan for the study was based on the collected and surveyed data, as well as the numerical modeling results. Related engineering measures require a detailed design and plan, and the actual cost is subject to change based on the cost of the materials and labor.

5. Discussion

Through data collection, analysis, numerical modeling, and communications with local residents and placeholders, three silt mitigation plans comprising various setups of submerged breakwaters as silt mitigation facilities were evaluated and compared. The results showed that plan 1 and plan 2 were better than plan 0, and plan 2 used less rock armor than plan 1, therefore having less impact on the surrounding ecological environment and landscape. Hence, plan 2 was chosen as the proposed silt mitigation plan. Considering the current siltation condition of Niaoyu Fishing Harbor and its navigation channel, it is suggested to install the silt mitigation facilities of plan 2 in the following order: (1) Setup #2: install a 500 m submerged breakwater on the north side of the navigation channel, (2) Setup #3: install a 500 m submerged breakwater on the south side of the navigation channel, and (3) Setup #4: install a 1000 m submerged breakwater on the south side of the Pengpeng Beach sand tail. The dredged sediment can be used as the fill material of the geotextile tubes, resolving the issue of finding a sediment dumping site and source of fill material. Consequently, the engineering cost for the fill material and its transportation will be reduced.

6. Conclusions

This paper presents a case study utilizing geotextile tubes to resolve siltation mitigation issues in Niaoyu Fishing Harbor. The benefits of using geotextile tubes rather than other materials and engineering measures which take into account the impacts on the ecological environment and recreational value of the study area were considered. Silt mitigation plans with selected silt trap facility allocations were proposed based on numerical modeling for sand trap efficiency. The layout of the submerged breakwater using geotextile tubes as the core, with or without rock armor, was designed, and the cost for each siltation plan was estimated. Communications with local residents and stakeholders received positive responses, and finally the plan with the highest rating score was selected. For future studies, a life cycle cost analysis for the alternative plans could be considered to make the study more robust. Although the major difference among the alternatives was the cross-section design, and the materials used were the same, different solutions could have different risks of failure and costs for maintenance. The construction of silt mitigation facilities near Niaoyu Fishing Harbor will require further administrative procedures; therefore, the actual effects of the engineering project will require more investigation in the future. The implementation of geotextile tubes in a recreational area with historical features, such as stone weirs, will be the first attempt of its kind in Taiwan. If this case is successful, it will encourage the use of geotextile tubes in similar implementations in the future.

Author Contributions

Conceptualization, I.-F.T. and C.-H.H.; methodology, I.-F.T.; software, H.-C.C.; validation, I.-F.T., C.-H.H., H.-C.C. and Y.-S.C.; formal analysis, H.-C.C.; resources, I.-F.T.; data curation, Y.-S.C.; writing—original draft preparation, C.-H.H.; writing—review and editing, Y.-S.C.; visualization, C.-H.H.; project administration, I.-F.T. All authors have read and agreed to the published version of the manuscript.

Funding

This research received no external funding.

Institutional Review Board Statement

Not applicable.

Informed Consent Statement

Not applicable.

Data Availability Statement

Restrictions apply to the availability of these data. Data were obtained from ACE Geosynthetics Enterprise Co., Ltd. and are available with the permission of ACE Geosynthetics Enterprise Co., Ltd.

Acknowledgments

This study was supported by ACE Geosynthetics Enterprise Co., Ltd. and Penghu County Government, Taiwan.

Conflicts of Interest

The authors declare no conflict of interest.

Appendix A

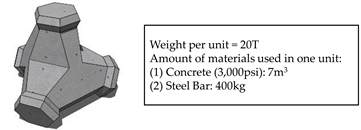
Comparison of carbon emissions for various engineering materials (Copyright by ACE Geosynthetics Enterprise Co., Ltd.).
Table A1. Armor Block.
Sustainability 15 02024 i004
ItemMaterialUnitAmountUnit CO2 Emissions (kg)Total CO2 Emissions (kg)
Armor BlockConcrete
(3000 psi)
m37253.7 11775.8
Rebarkg4000.97 2388.0
Unit Weight (T)20
CO2 Emissions (kg/T)108.2
1 The CO2 emissions of 3000 psi concrete are 253.68 kg/m3 ≅ 253.7 kg/m3, considering both the production and transportation stages. 2 The CO2 emissions of rebar are 964.75 kg/T ≅ 0.97 kg/kg, considering both the production and transportation stages.
Table A2. Geotextile Tubes.
Sustainability 15 02024 i005
ItemMaterialUnitAmountUnit CO2 Emissions (kg)Total CO2 Emissions (kg)
Geotextile TubePermeable
Geotextile
m2283.82.5 3709
Fill MaterialNatural Sandm315000
Unit Weight (T)300
CO2 Emissions (kg/T)2.4
3 According to the international carbon footprint certification data obtained from ACE Geosynthetics Enterprise Co., Ltd., the CO2 emissions during the production process are 2.479 kg/m2. The CO2 emissions during the transportation process are 34.25 kg/T. The unit weight of the woven fabric used for the geotextile tubes is about 0.5 kg/m2, so the conversion is = 34.25/1000*0.5 = 0.0172 kg/m2. Therefore, the CO2 emissions are 2.479 + 0.0172 = 2.4962 kg/m2 ≅ 2.5 kg/m3.
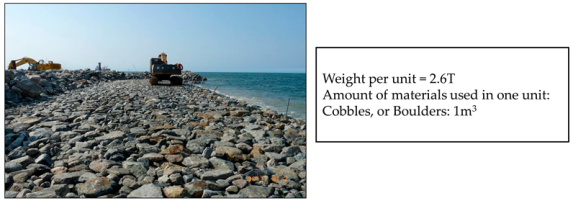
Table A3. Riprap.
Table A3. Riprap.
Sustainability 15 02024 i006
ItemMaterialUnitAmountUnit CO2 Emissions (kg)Total CO2 Emissions (kg)
RiprapCobbles or Bouldersm3172.3 472.3
Unit Weight (T)2.6
CO2 Emissions (kg/T)27.8
4 The CO2 emissions of riprap are 72.33 kg/m3 ≅ 72.3 kg/m3, considering both the production and transportation stages.

References

  1. Chien, A.; Wu, S.; Tseng, F.; Tang, A. Geotextile Tubes Application on Beach Nourishment in UAE. Int. J. Environ. Sci. Dev. 2014, 5, 506–509. [Google Scholar] [CrossRef] [Green Version]
  2. Tsai, C.-C.; Chen, Y.-M.; Tsai, C.-J.; Chang, M.-W.; Chen, Y.-S. Breakwater made of geotextile tubes in Ras Al-Khaimah City, UAE. In Proceedings of the 37th Ocean Engineering Conference in Taiwan, Taichung, Taiwan, 12–13 November 2015; Volume 1, pp. 505–510. [Google Scholar]
  3. Lin, Z.; Tseng, F.; Cheng, H.-C. Geotextile Tube solution for Dos Bocas beach erosion problem at Tabasco, Mexico. In Proceedings of the 32rd Ocean Engineering Conference in Taiwan, Keelung, Taiwan, 24 November 2010; Volume 1, pp. 629–634. [Google Scholar]
  4. Lim, A.L.K.; Siew, K.H. Geotextile Tube for Coastal Protection and Land Reclamation. In Scour- and Erosion-Related Issues; Reddy, C.N.V.S., Sassa, S., Eds.; Springer Singapore: Singapore, 2022; pp. 95–116. [Google Scholar]
  5. Kim, H.J.; Dinoy, P.R.; Kim, H.S. Tension force analysis of geotextile tubes by half cross-section test. Geotext. Geomembr. 2020, 48, 243–256. [Google Scholar] [CrossRef]
  6. Kim, H.J.; Dinoy, P.R. Two-dimensional consolidation analysis of geotextile tubes filled with fine-grained material. Geotext. Geomembr. 2021, 49, 1149–1164. [Google Scholar] [CrossRef]
  7. Kim, D.-J.; Kim, S.-C.; Lee, J.-S.; Byun, Y.-H.; Kang, B.-Y. Internal strength characterization of geotextile tube using miniature cone. Ocean. Eng. 2022, 266, 113157. [Google Scholar] [CrossRef]
  8. Ho, Y.-H.; Liu, C.-N.; Wang, T.-C.; Tseng, F. The case study of geotextile tube solution for tidal inlet restoration project in Tainan City. In Proceedings of the 35th Ocean Engineering Conference in Taiwan, Kaohsiung, Taiwan, 21–22 November 2013; Volume 1. [Google Scholar]
  9. Wu, C.-T.; Yao, W.-T.; Chan, C.-Y.; Li, J.-J.; Cheng, H.-C. Geotextile tubes application in Taichung harbor north side siltation area wind-blown sand remediation. In Proceedings of the 36th Ocean Engineering Conference in Taiwan, Hsinchu, Taiwan, 4–5 December 2014; Volume 1, pp. 591–596. [Google Scholar]
  10. Fowler, J.; Bagby, R.M.; Trainer, E. Dewatering sewage sludge with geotextile tubes. In Proceedings of the 49th Canadian Geotechnical Conference, St. John’s, NL, Canada, 23–25 September 1996; pp. 1–31. [Google Scholar]
  11. Moo-Young, H.K.; Myers, T.; Townsend, D.; Ochola, C. Contaminant migration through GeoContainers used in dredging operations. Eng. Geol. 1999, 53, 167–176. [Google Scholar] [CrossRef]
  12. Tseng, C.-J.; Lin, Z.; Tang, A. ACECONTAINER applied in high-polluting sludge. In Proceedings of the 33rd Ocean Engineering Conference in Taiwan, Kaohsiung, Taiwan, 1–2 December 2011; Volume 1, pp. 659–664. [Google Scholar]
  13. Tseng, I.-F.; Cheng, H.-C.; Lee, C.-P.; Lin, I.-F.; Lee, F.-C.; Wang, Y.-C.; Weng, J.-C. The application of geotextile tube for coastal protection. In Proceedings of the 38th Ocean Engineering Conference in Taiwan, Taipei, Taiwan, 8–9 December 2016; Volume 1, pp. 178–183. [Google Scholar]
  14. Qiu, J.-Q.; Tseng, I.-F.; Wang, Y.-C.; Weng, J.-C. Experimental study on geotextile tube applications for coastal protection. In Proceedings of the 40th Ocean Engineering Conference in Taiwan, Kaohsiung, Taiwan, 20–22 November 2018. [Google Scholar]
  15. Chang, Y.-S. Life Cycle Assessment on the Reduction of Carbon Dioxide Emission of Buildings. Ph.D. Thesis, National Cheng Kung University, Tainan City, Taiwan, 2002. [Google Scholar]
  16. Matsumoto, K.; Ooe, M.; Sato, T.; Segawa, J. Ocean tide model obtained from TOPEX/POSEIDON altimetry data. J. Geophys. Res. 1995, 100, 25319–25330. [Google Scholar] [CrossRef]
  17. NOAA National Geophysical Data Center. 2-Minute Gridded Global Relief Data (ETOPO2) v2. Available online: https://www.ncei.noaa.gov/access/metadata/landing-page/bin/iso?id=gov.noaa.ngdc.mgg.dem:301 (accessed on 11 November 2022).
  18. NOAA Physical Sciences Laboratory. The NCEP/NCAR Reanalysis Project. Available online: https://psl.noaa.gov/data/reanalysis/reanalysis.shtml (accessed on 11 November 2022).
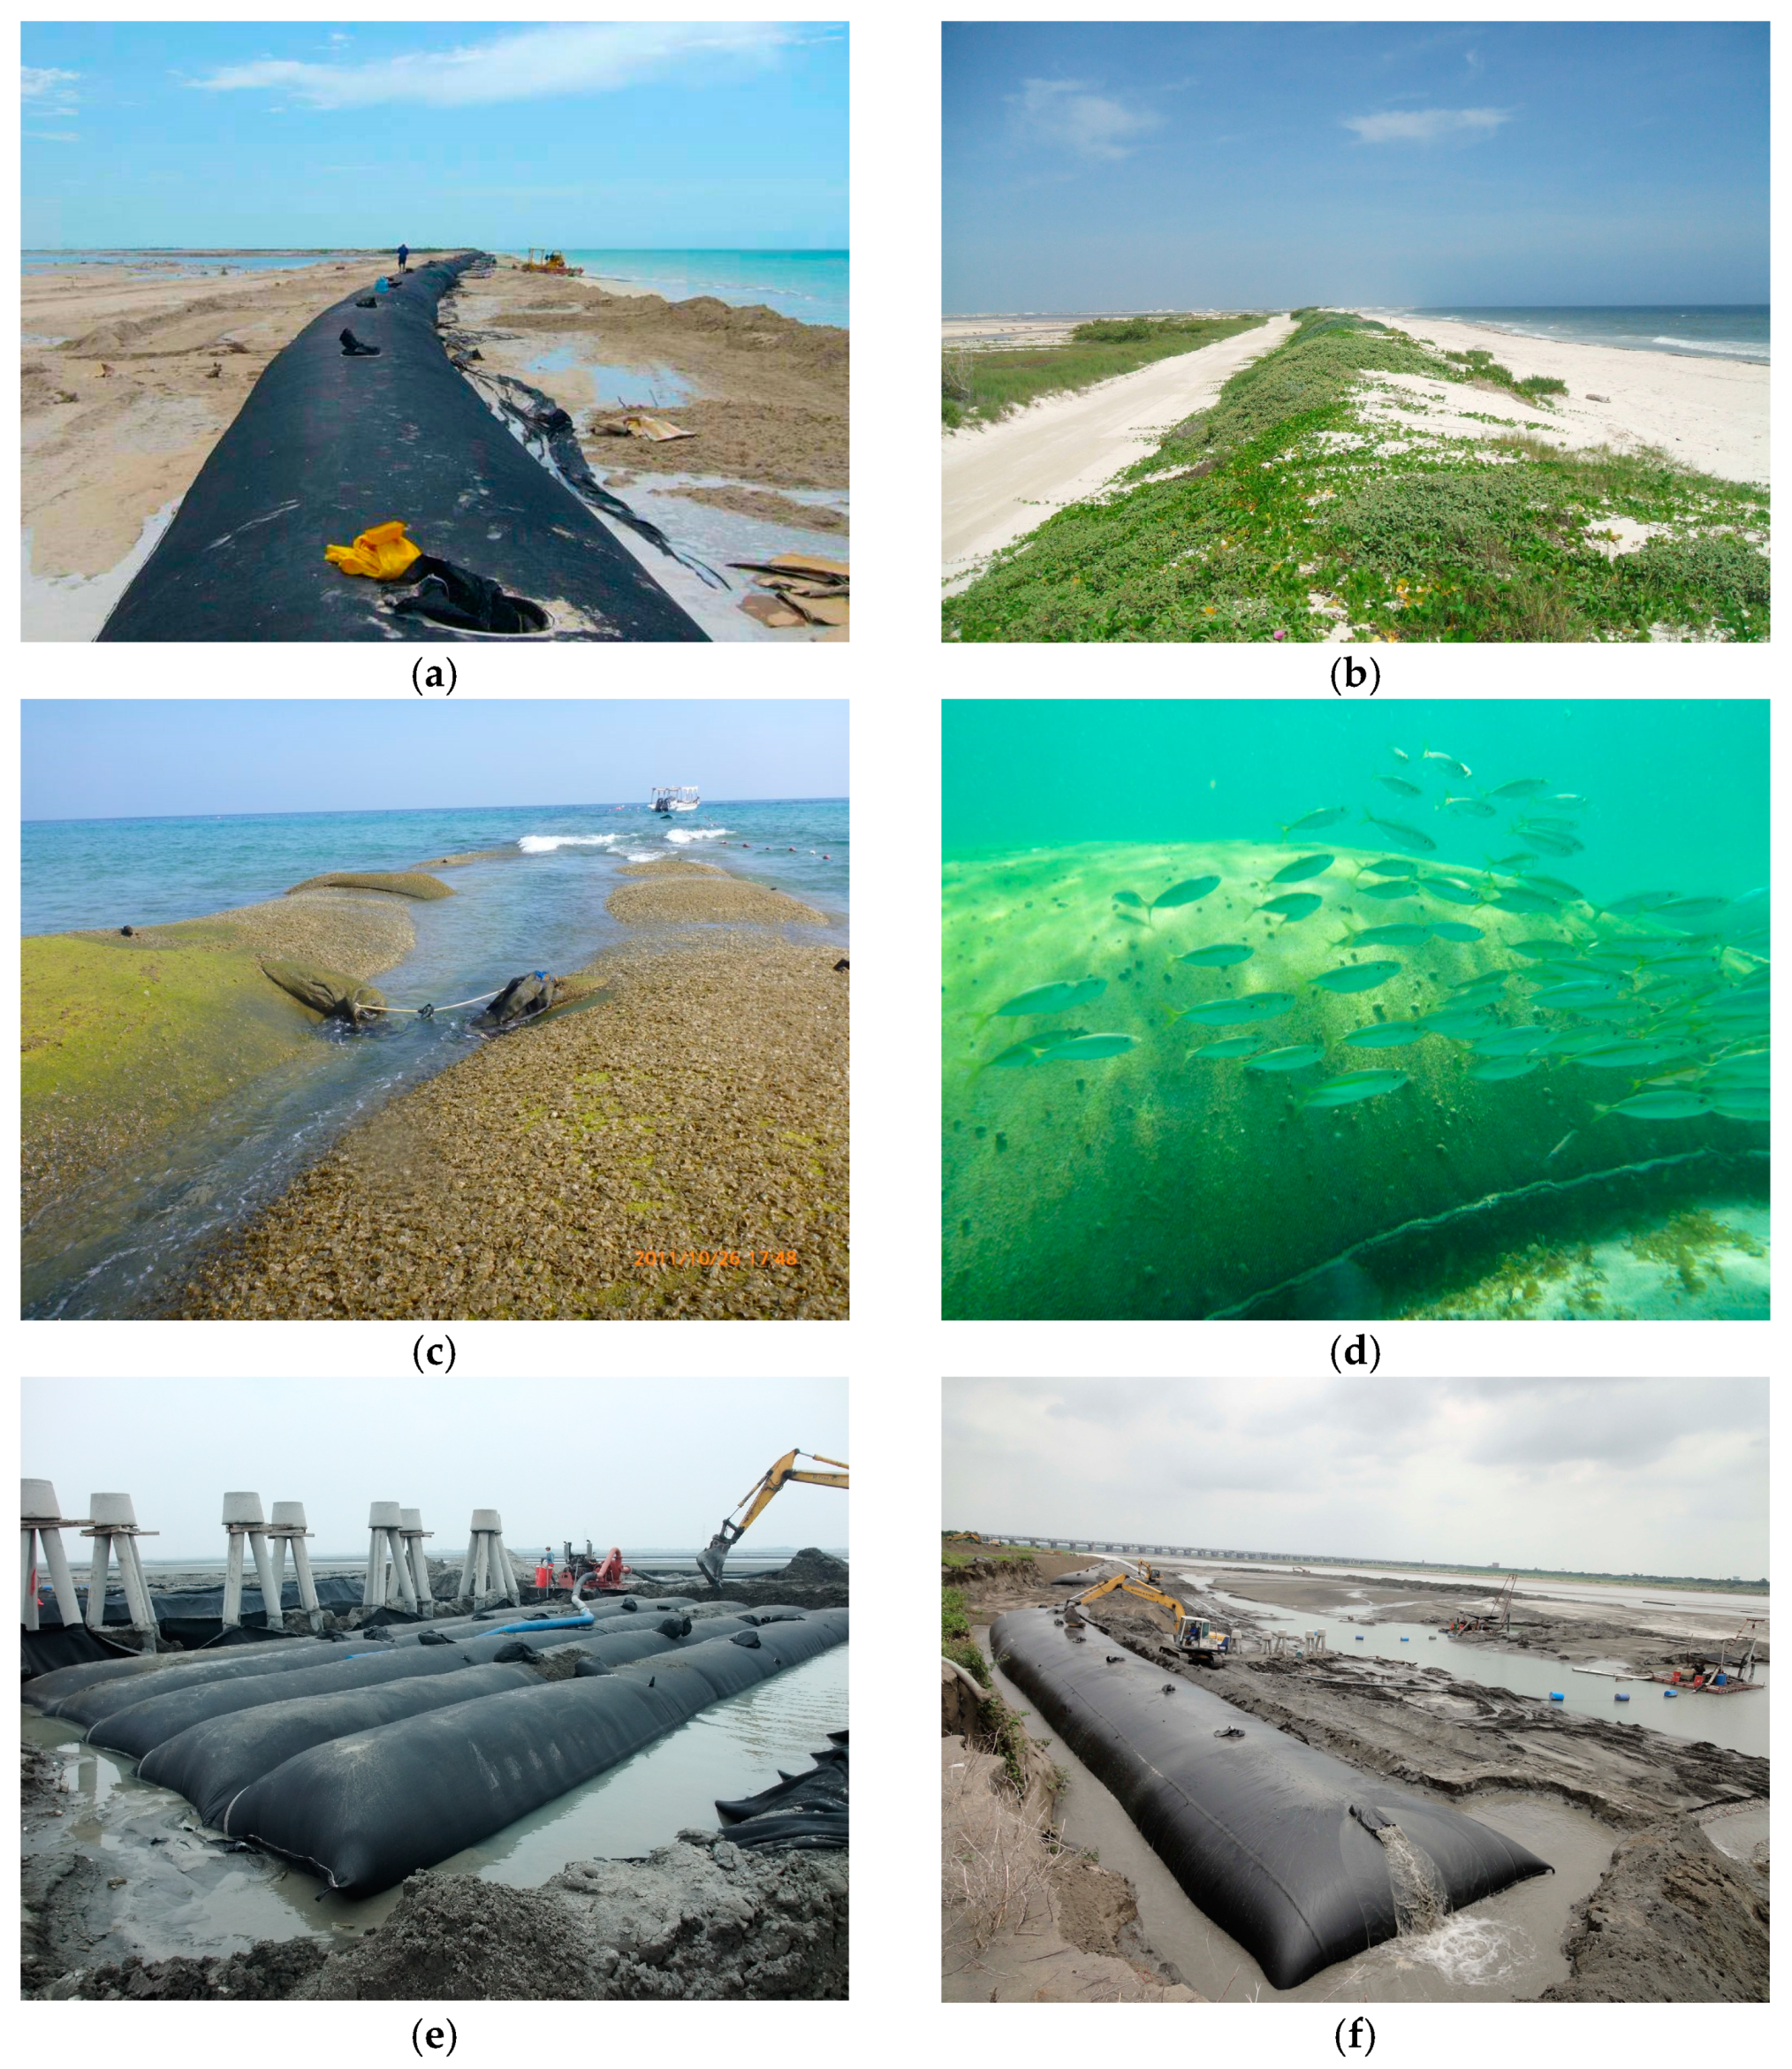
Figure 1. Implementation cases of geotextile tubes (photos copyright by ACE Geosynthetics Enterprise Co., Ltd., Taichung, Taiwan, used with permission). (a) Using geotextile tubes as the core of sand dunes, (b) Vegetation growing back after installing geotextile tubes in the sand dune, (c) Algae growing on the surface of geotextile tubes, (d) Geotextile tubes as an eco-friendly engineering material, (e) Installing geotextile tubes at a construction site, (f) Using nearby sand or sand slurry as the fill material for geotextile tubes.
Sustainability 15 02024 g001
Figure 2. Stone weirs near Niaoyu Island.
Sustainability 15 02024 g002
Figure 3. Location of Niaoyu Fishing Harbor and Pengpeng Beach.
Sustainability 15 02024 g003
Figure 4. Procedure for mitigation plan development and evaluation.
Sustainability 15 02024 g004
Figure 5. Location of the Gupoyu and Niaoyu data buoy.
Sustainability 15 02024 g005
Figure 6. Wind and wave rose diagrams of Niaoyu data buoy.
Sustainability 15 02024 g006
Figure 7. Wind, wave, and current rose diagrams of Gupoyu data buoy.
Sustainability 15 02024 g007
Figure 8. Satellite images of Niaoyu Island and Pengpeng Beach.
Sustainability 15 02024 g008
Figure 9. Historical shoreline change of Pengpeng Beach.
Sustainability 15 02024 g009
Figure 10. Bathymetry and computational grids for numerical modeling.
Sustainability 15 02024 g010
Figure 11. The bathymetry and extent for topographic change modeling.
Sustainability 15 02024 g011
Figure 12. MIKE21 model validation.
Sustainability 15 02024 g012
Figure 13. Simulated topographic change between Niaoyu Island and Pengpeng Beach under wave action for one year.
Sustainability 15 02024 g013
Figure 14. Location candidates of silt mitigation facilities.
Sustainability 15 02024 g014
Figure 15. Simulation results of Configuration 1.
Sustainability 15 02024 g015
Figure 16. Simulation results of Configuration 2.
Sustainability 15 02024 g016
Figure 17. Simulation results of Configuration 3.
Sustainability 15 02024 g017
Figure 18. Layout of the design setups for the silt trap facilities (the colors indicate different setup locations).
Sustainability 15 02024 g018
Figure 19. Simulation results for mitigation plans 1 and 2.
Sustainability 15 02024 g019
Table 1. Comparison of carbon emissions during the production and transportation of materials.
MethodMaterialCO2 Emissions (kg/T)Ratio *Carbon Reduction
Efficiency
Geotextile TubePermeable Fabric, Natural Sand2.41:1
Armor BlockConcrete, Steel Bar108.246:197.8%
RiprapSand, Boulder27.812:191.3%
* Ratio of CO2 emissions relative to geotextile tubes (Copyright byACE Geosynthetics Enterprise Co., Ltd.).
Table 2. Area change of Pengpeng Beach.
YearArea (m2)
199612,387
200140,509
200950,422
201264,219
201765,621
201978,192
202065,446
202265,675
Table 3. Setups for the siltation mitigation facilities.
Setup #LocationBreakwater Length (m)Cross-Section Type
1North side of the navigation channel (the red line in Figure 18)500Type B (Geotextile Tubes + Rock Armor)
2Type C (Geotextile Tubes)
3South side of the navigation channel (the black line in Figure 18)500Type A (Geotextile Tubes + Rock Armor)
4South side of the Pengpeng Beach sand tail (the blue line in Figure 18)1000Type A (Geotextile Tubes + Rock Armor)
Table 4. Cross-section design for the siltation mitigation facilities.
Cross-Section
Type
Design Drawing of the Breakwater Cross-Sections
Type ASustainability 15 02024 i001
Cross-Section Type: Geotextile Tubes + Armor Rock
Levee Dimension (Height/Length): 2.0 m/3.0 m
Geotextile Tube Dimension (Height/Length): 1.4 m/3.3 m
Type BSustainability 15 02024 i002
Cross-Section Type: Geotextile Tubes + Armor Rock
Levee Dimension (Height/Length): 1.5 m/3.0 m
Geotextile Tube Dimension (Height/Length): 1.1 m/3.6 m
Type CSustainability 15 02024 i003
Cross-Section Type: Geotextile Tubes
Geotextile Tube Dimension (Height/Length): 1.5 m/3.5 m
Table 5. Cost estimate of setup #1.
(Setup #1): North Side of Fish Harbor (2.0 M), 500 m
Item DescriptionUnit PriceQuantityAmount
  • Geotextile Type B Installation (C = 8.6 m)
6500 NTD/m500 m3,250,000
2.
10~100 kg Pebbles
2000 NTD/m3907.5 m31,815,000
3.
100~300 kg Boulders
2300 NTD/m32711.5 m36,236,450
4.
Protect Layer and Anti-Scouring Fabric and Anchoring Geotextile Tube Installation
400 NTD/m26490 m22,596,000
5.
Seabed Cleaning and Leveling
60 NTD/m26050 m2363,000
6.
Mobilization Fee for Equipment
500,000 NTD/Set1 set500,000
Total Cost (NTD)14,760,450
NTD/m29,521
Table 6. Cost estimate of setup #2.
(Setup #2): North Side of Fish Harbor (1.5 M), 500 m
Item Description and Unit PriceUnit PriceQuantityAmount
1.
Geotextile Type B Installation (C = 8.6 m)
6500 NTD/m500 m3,250,000
2.
Sand Cover
200 NTD/m5580 m31,116,000
3.
Protect Layer and Anti-Scouring Fabric and Anchoring Geotextile Tube Installation
400 NTD/m22750 m31,100,000
4.
Seabed Cleaning and Leveling
60 NTD/m24400 m2264,000
5.
Mobilization Fee for Equipment
500,000 NTD/Set1 Set500,000
Total Cost (NTD)6,230,000
NTD/m12,460
Table 7. Cost estimate of setup #3.
(Setup #3): North Side of Fish Harbor (1.5M), 500 m
Item Description and Unit PriceUnit PriceQuantityAmount
1.
Geotextile Type A Installation (C = 8.6 m)
6500 NTD/m500 m3,250,000
2.
10~100 kg Pebbles
2000 NTD/m32618 m35,236,000
3.
100~300 kg Boulders
2300 NTD/m33448.5 m37,931,550
4.
Protect Layer and Anti-Scouring Fabric and Anchoring Geotextile Tube Installation
400 NTD/m27700 m23,080,000
5.
Seabed Cleaning and Leveling
60 NTD/m26050 m2363,000
6.
Mobilization Fee for Equipment
500,000 NTD/Set1 Set500,000
Total Cost (NTD)20,360,550
NTD/m40,721
Table 8. Cost estimate of setup #4.
(Setup #4): South Side of Pengpeng Beach (2.0 M), 1000 m
Item Description and Unit PriceUnit PriceQuantityAmount
1.
Geotextile Type A Installation (C = 8.6 m)
6500 NTD/m1000 m6,500,000
2.
10~100 kg Pebbles
2000 NTD/m35236 m310,472,200
3.
100~300 kg Boulders
2300 NTD/m36897 m315,863,100
4.
Protect Layer and Anti-Scouring Fabric and Anchoring Geotextile Tube Installation
400 NTD/m215,400 m26,160,000
5.
Seabed Cleaning and Leveling
60 NTD/m212,100 m27,266,000
6.
Mobilization Fee for Equipment
500,000 NTD/Set1 Set500,000
Total Cost (NTD)40,221,100
NTD/m40,221
Table 9. Evaluation of alternative silt mitigation plans.
FactorSiltation Mitigation EfficiencyEngineering CostPublicAcceptanceImpact on Surrounding LandscapeWeighted
Score
Weight (%)40252510
Plan 0Maintain Current Status24242.7
Plan 1Setup #1, #3 and #454444.4
Plan 2Setup #2, #3 and #45444.54.5
Disclaimer/Publisher’s Note: The statements, opinions and data contained in all publications are solely those of the individual author(s) and contributor(s) and not of MDPI and/or the editor(s). MDPI and/or the editor(s) disclaim responsibility for any injury to people or property resulting from any ideas, methods, instructions or products referred to in the content.