
Assessing the Environmental Impacts of Household Water Supply: A Case Study Considering Consumption Patterns within a Life-Cycle Perspective

 and
and
Abstract
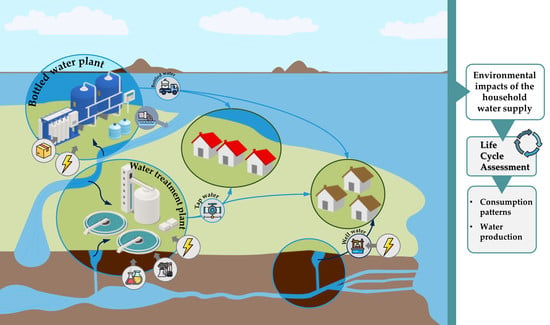
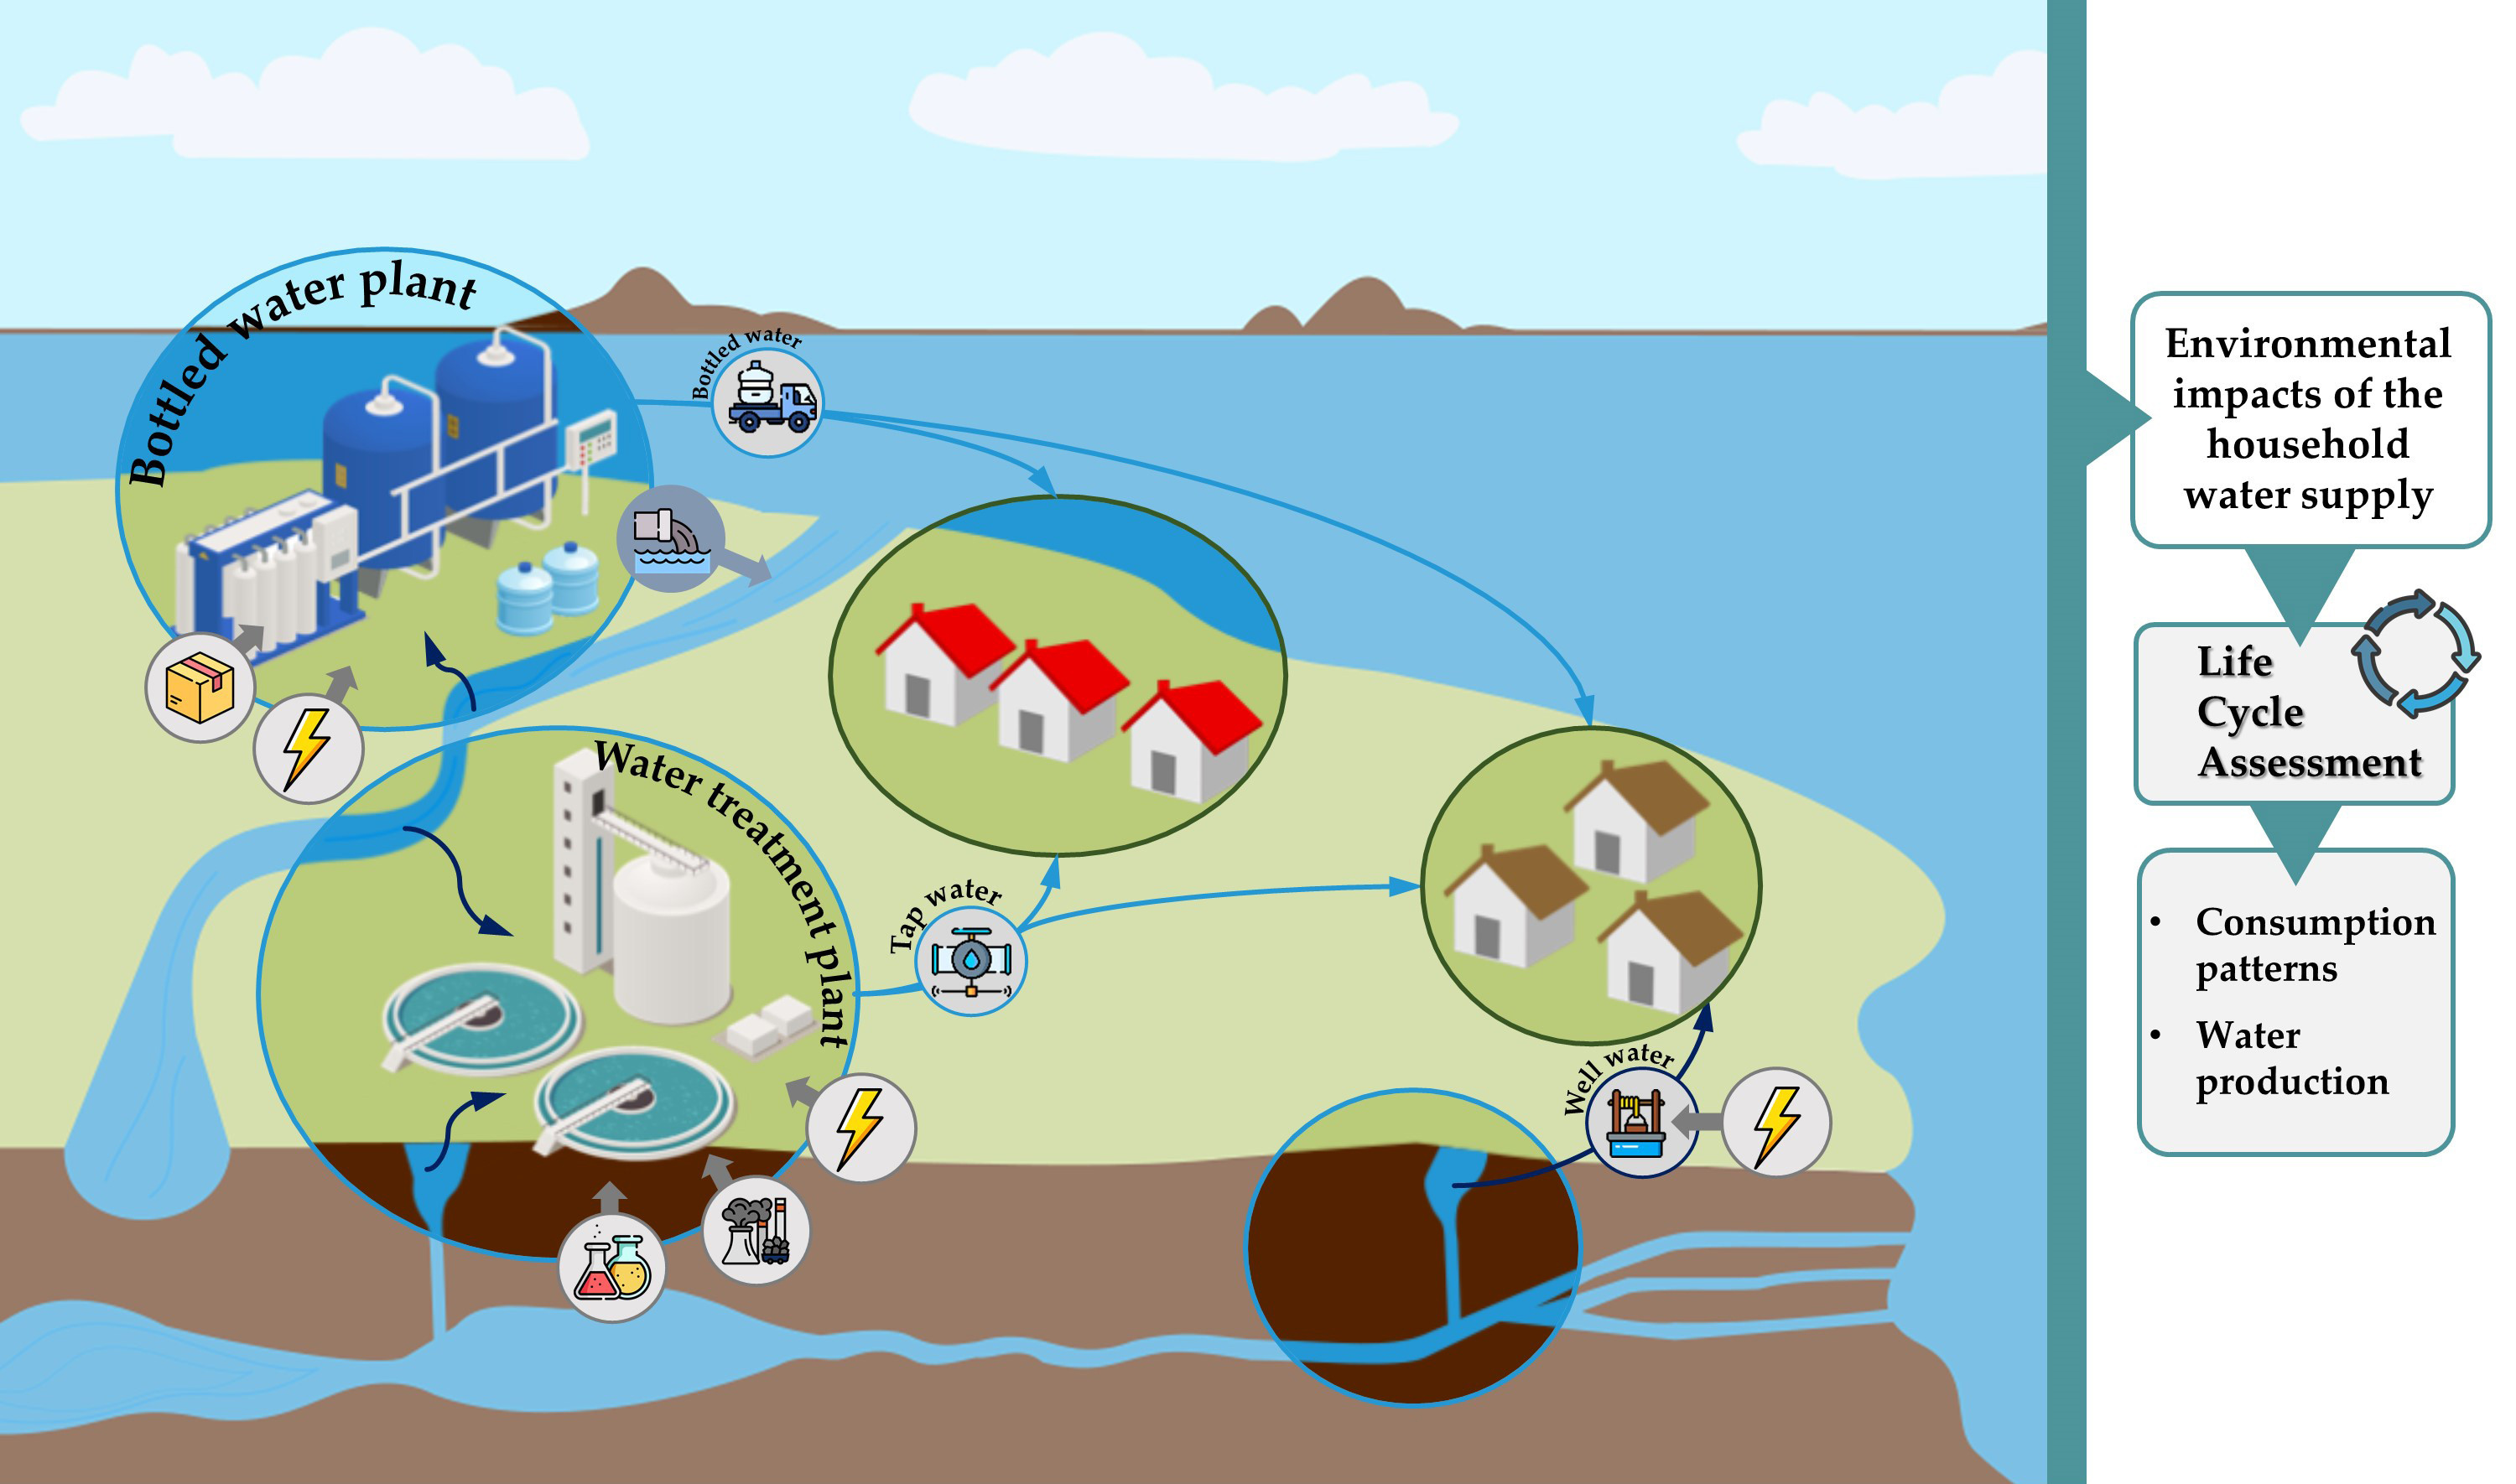
1. Introduction
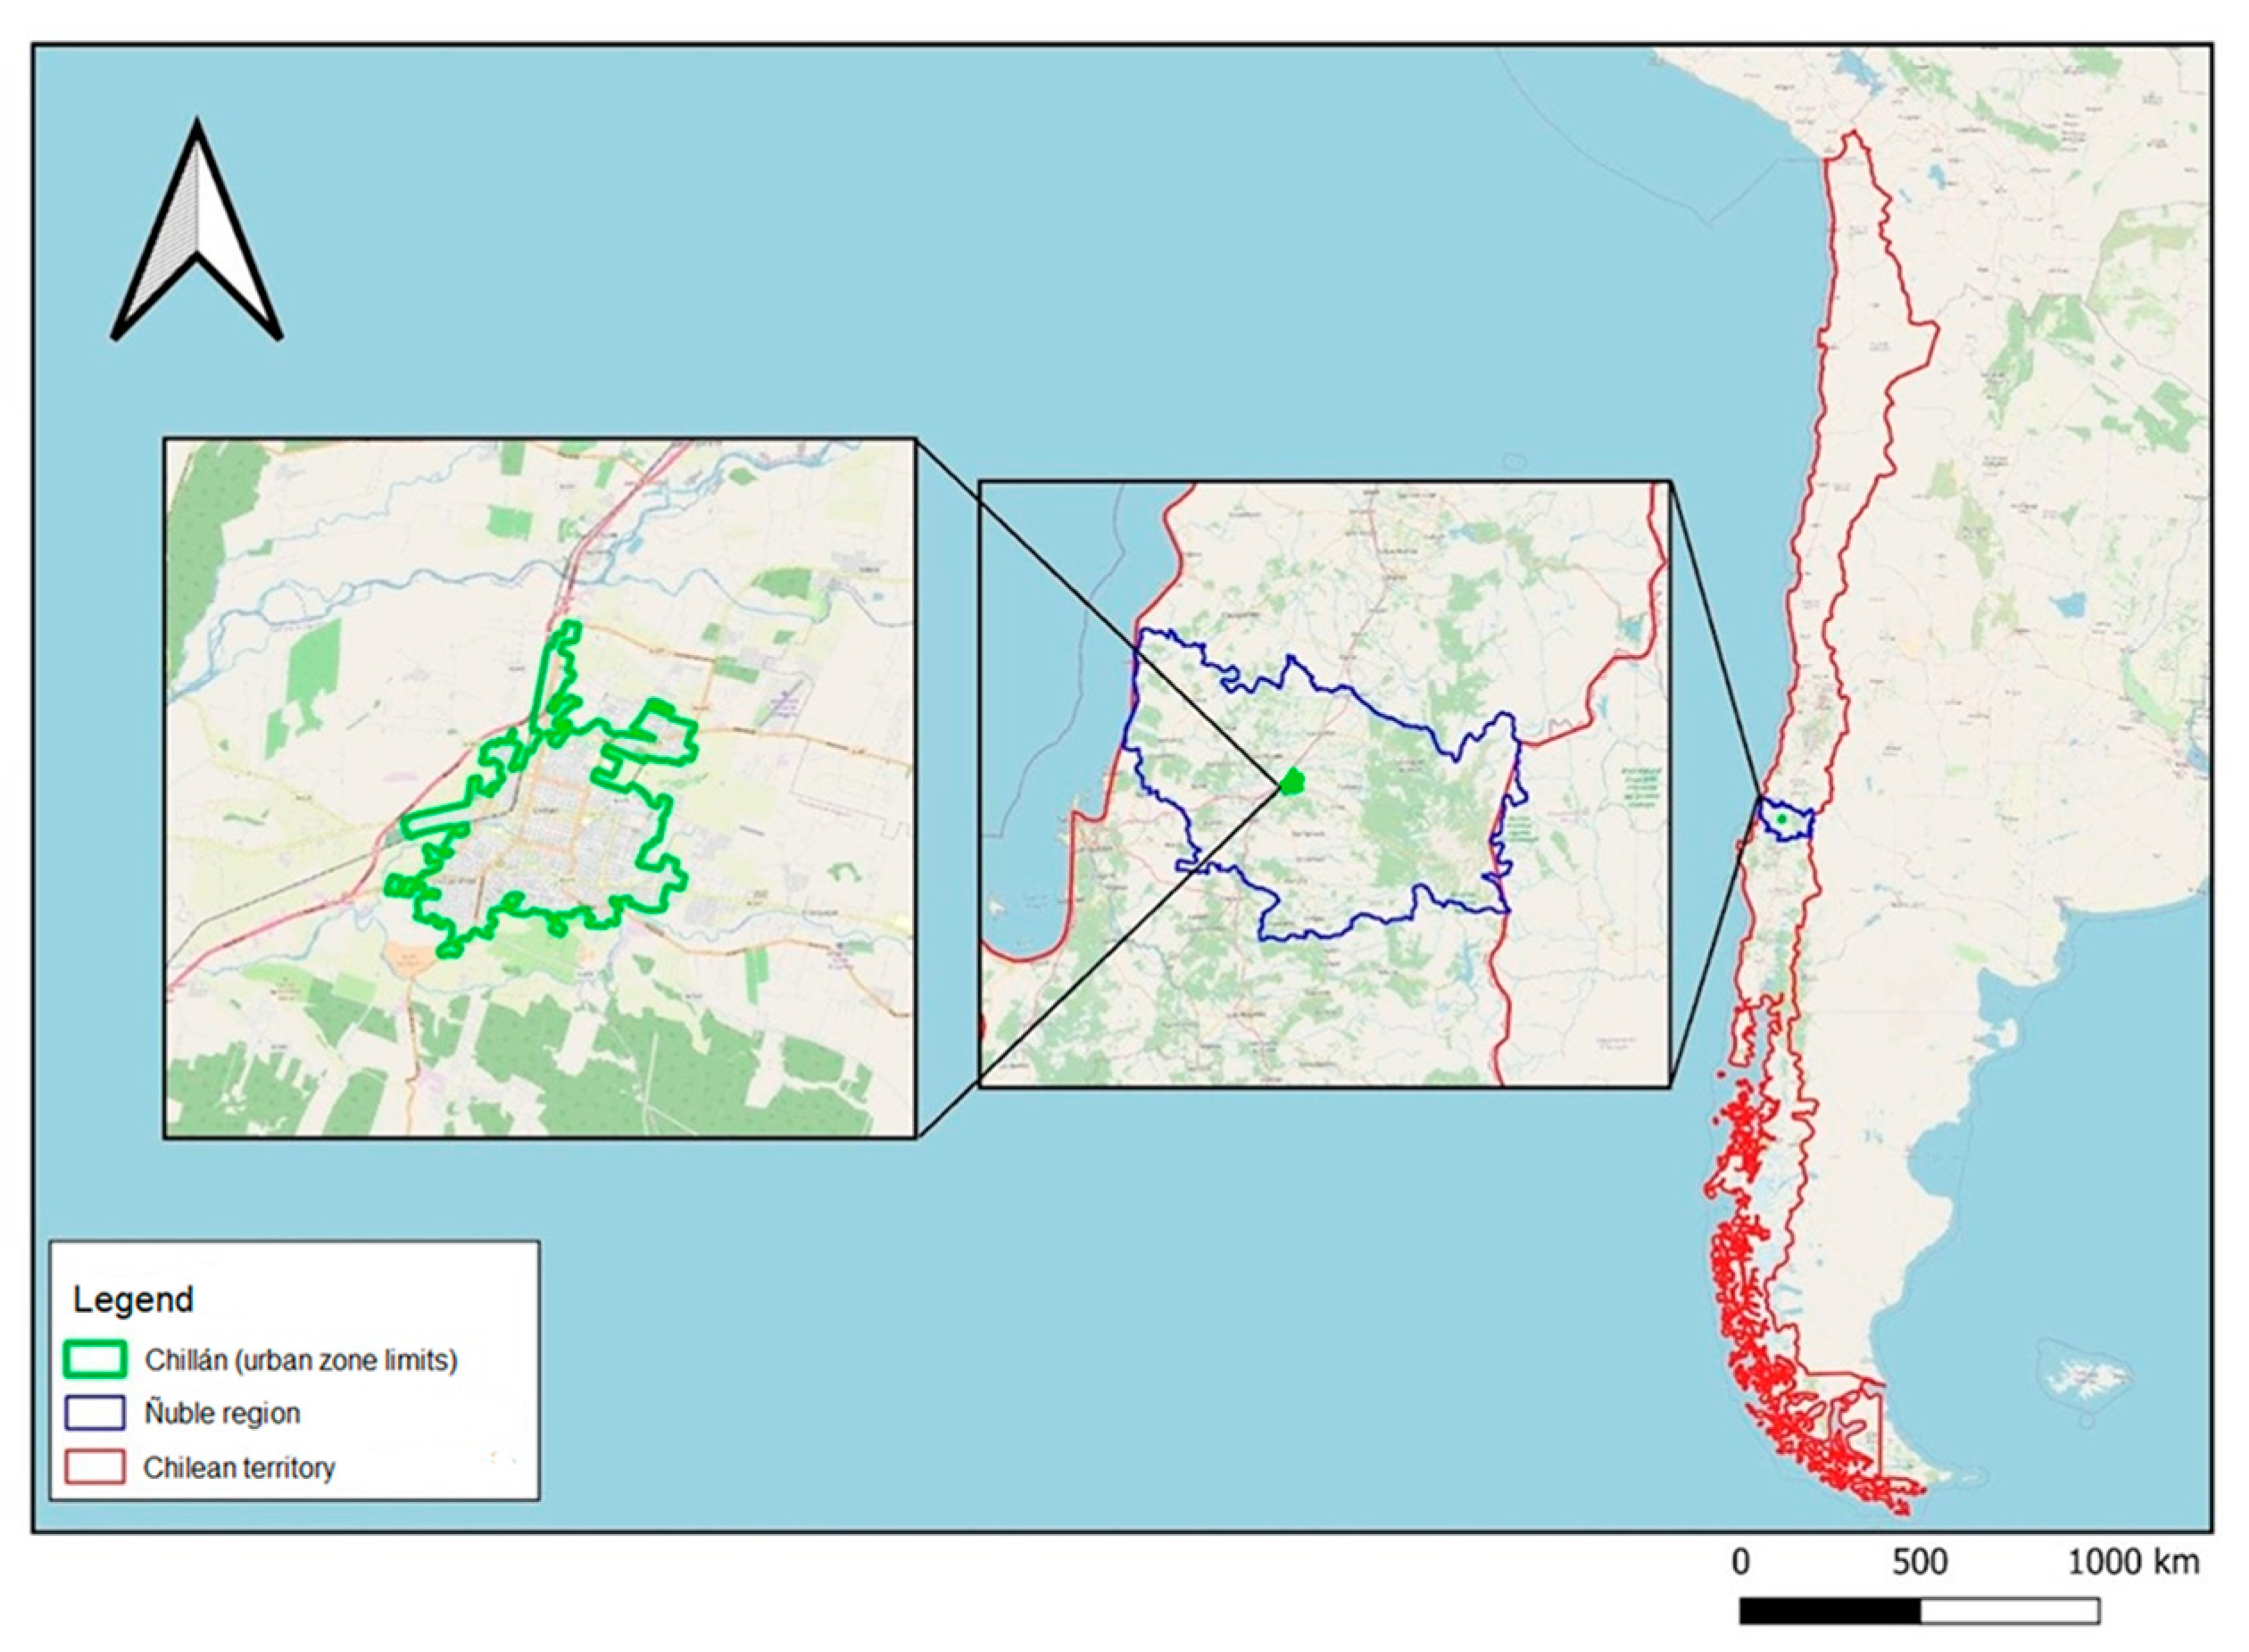
2. Materials and Methods
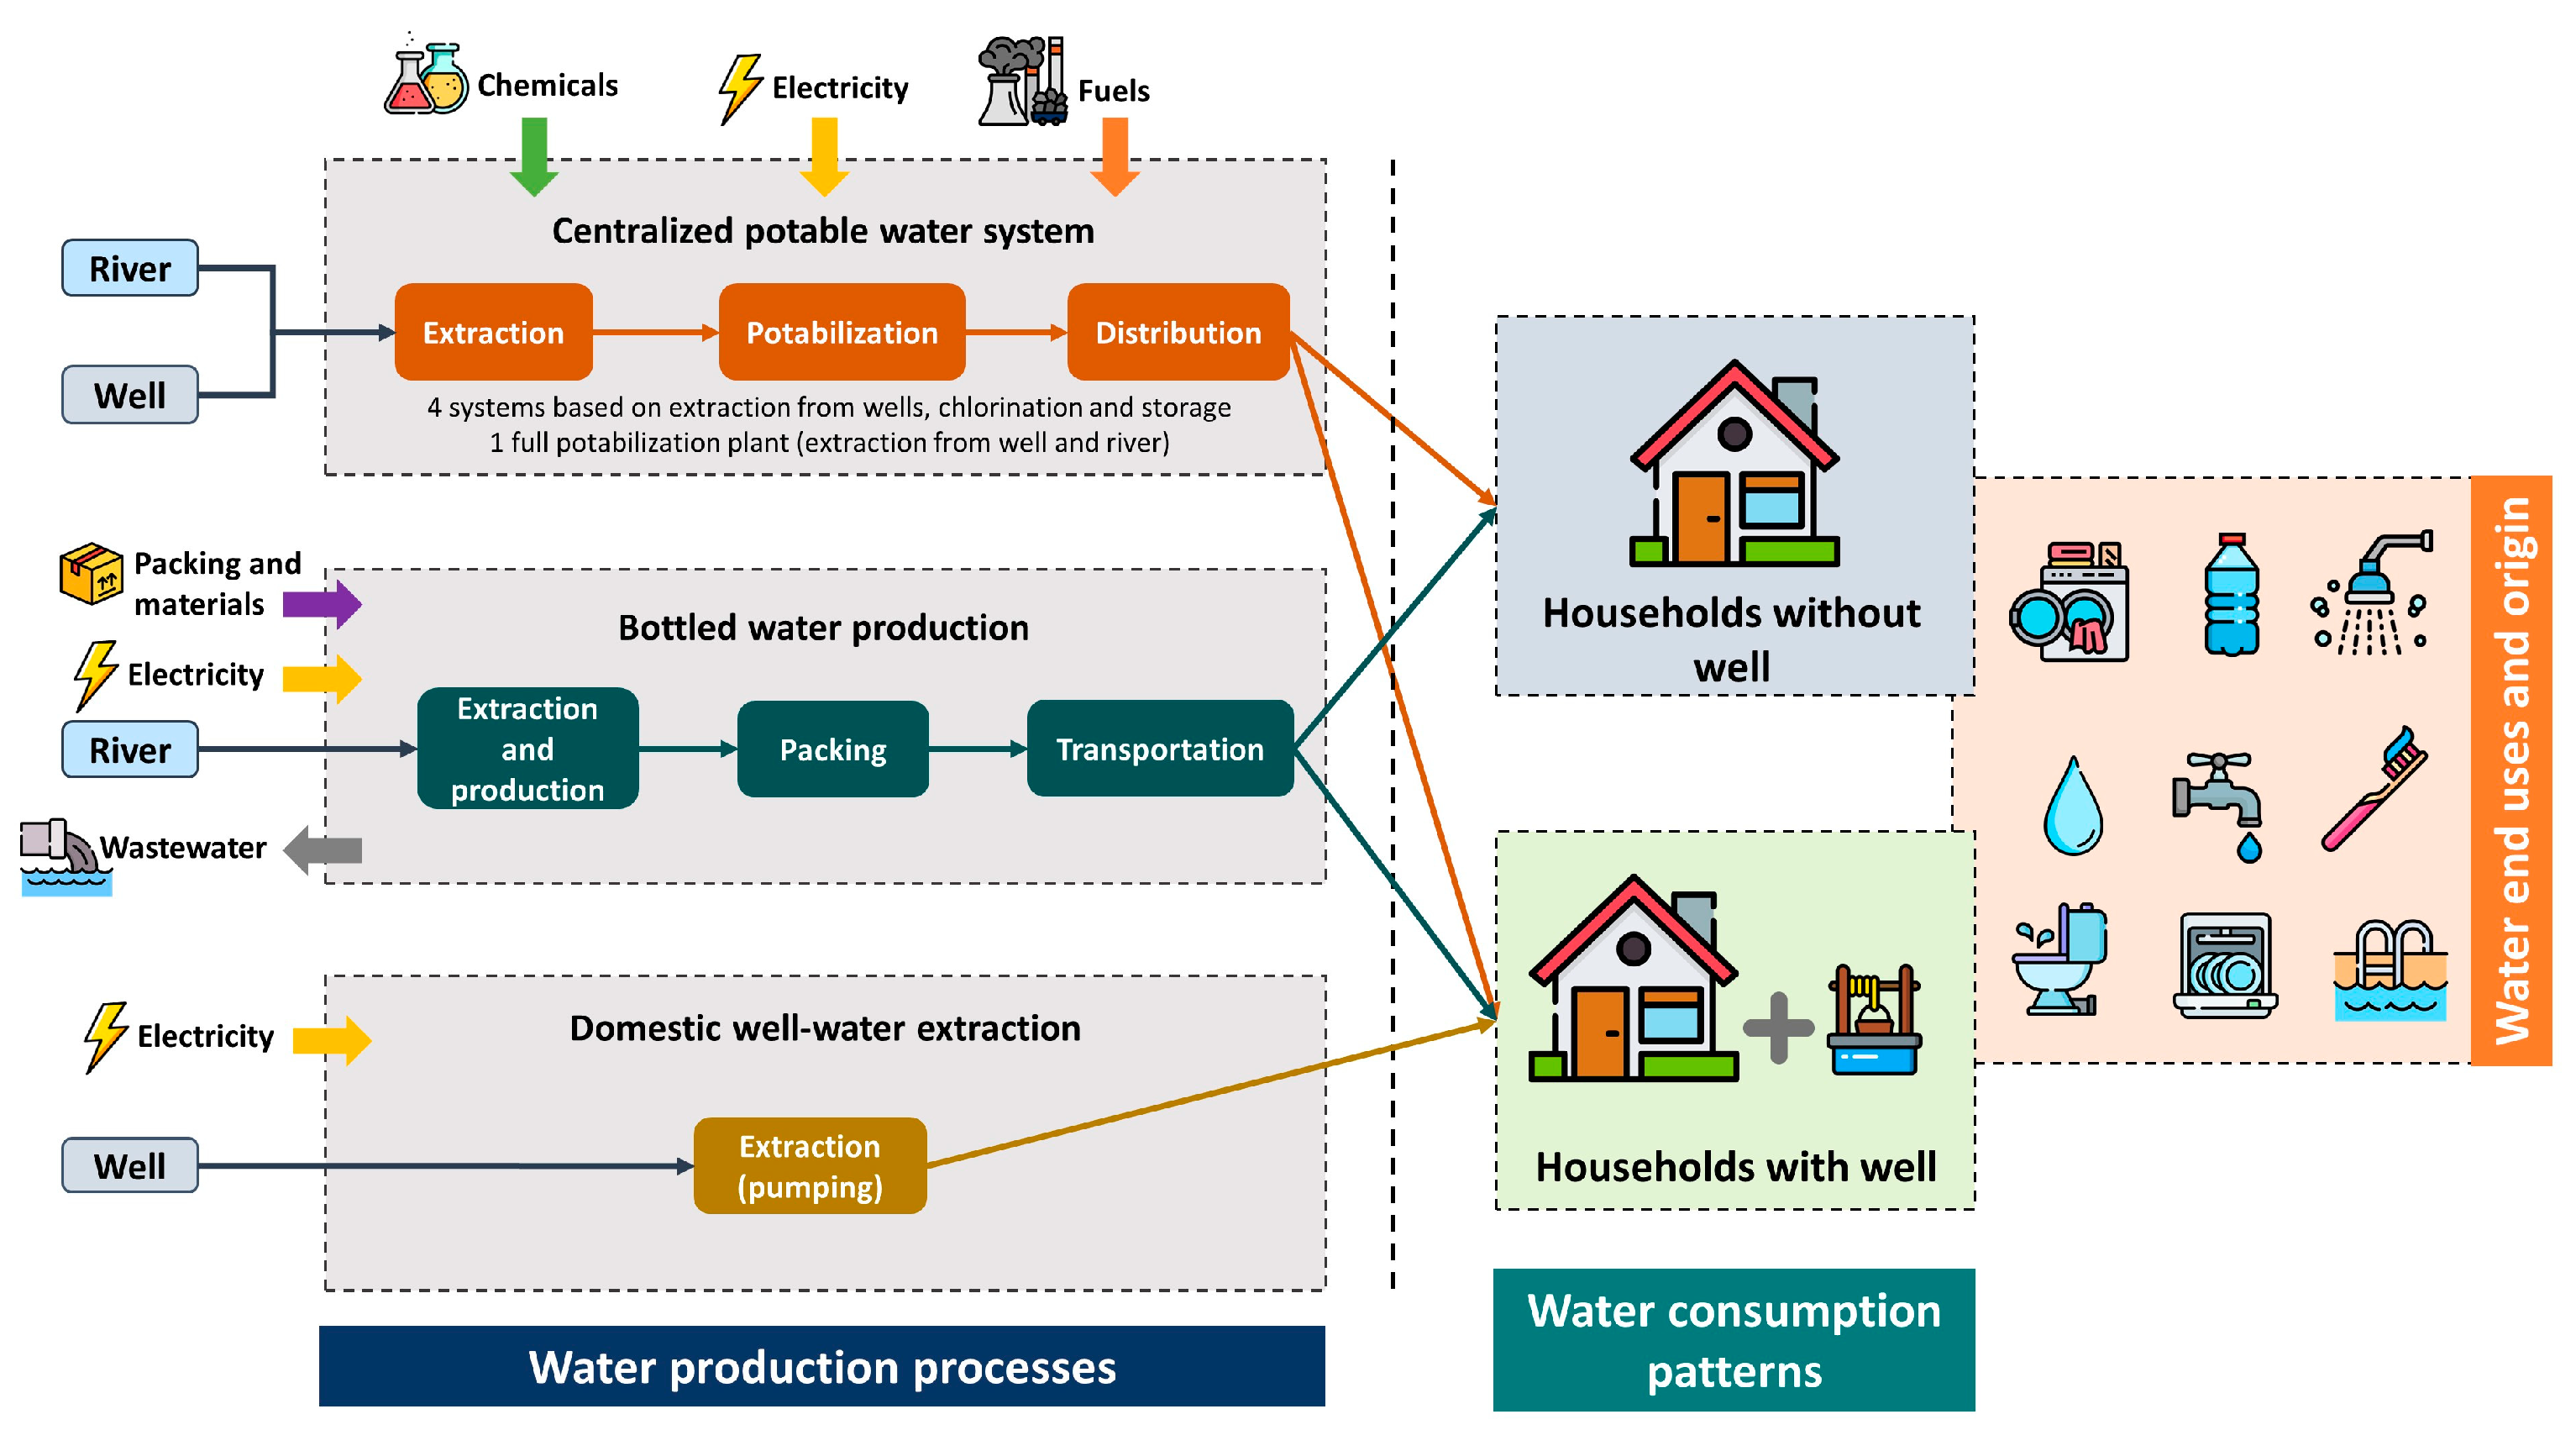
2.1. Life Cycle Inventories
- In the central purification system of Chillán (SCh), water is extracted from three points: one surface water intake in the Chillán River and two groundwater intakes. The purification process is based on conventional treatment processes, including flocculation, sedimentation, rapid filtration, and disinfection (chlorination).
- The northeastern extraction and storage system (NE) comprises two groundwater intake points, with a compact treatment process consisting of filtration and disinfection by chlorination.
- The northern extraction and storage system (N) comprises five groundwater intake points and a disinfection process by chlorination.
- The southern extraction and storage system (S) has three groundwater intake points and a disinfection process by chlorination.
- The southeastern extraction and storage system (SE) includes two groundwater intake points and a disinfection process by chlorination.
2.2. Life Cycle Impact Assessment
2.3. Consumption Profiles
2.4. Statistical Analysis and Estimation of the Variability of Results
3. Results and Discussion
3.1. Life Cycle Inventories
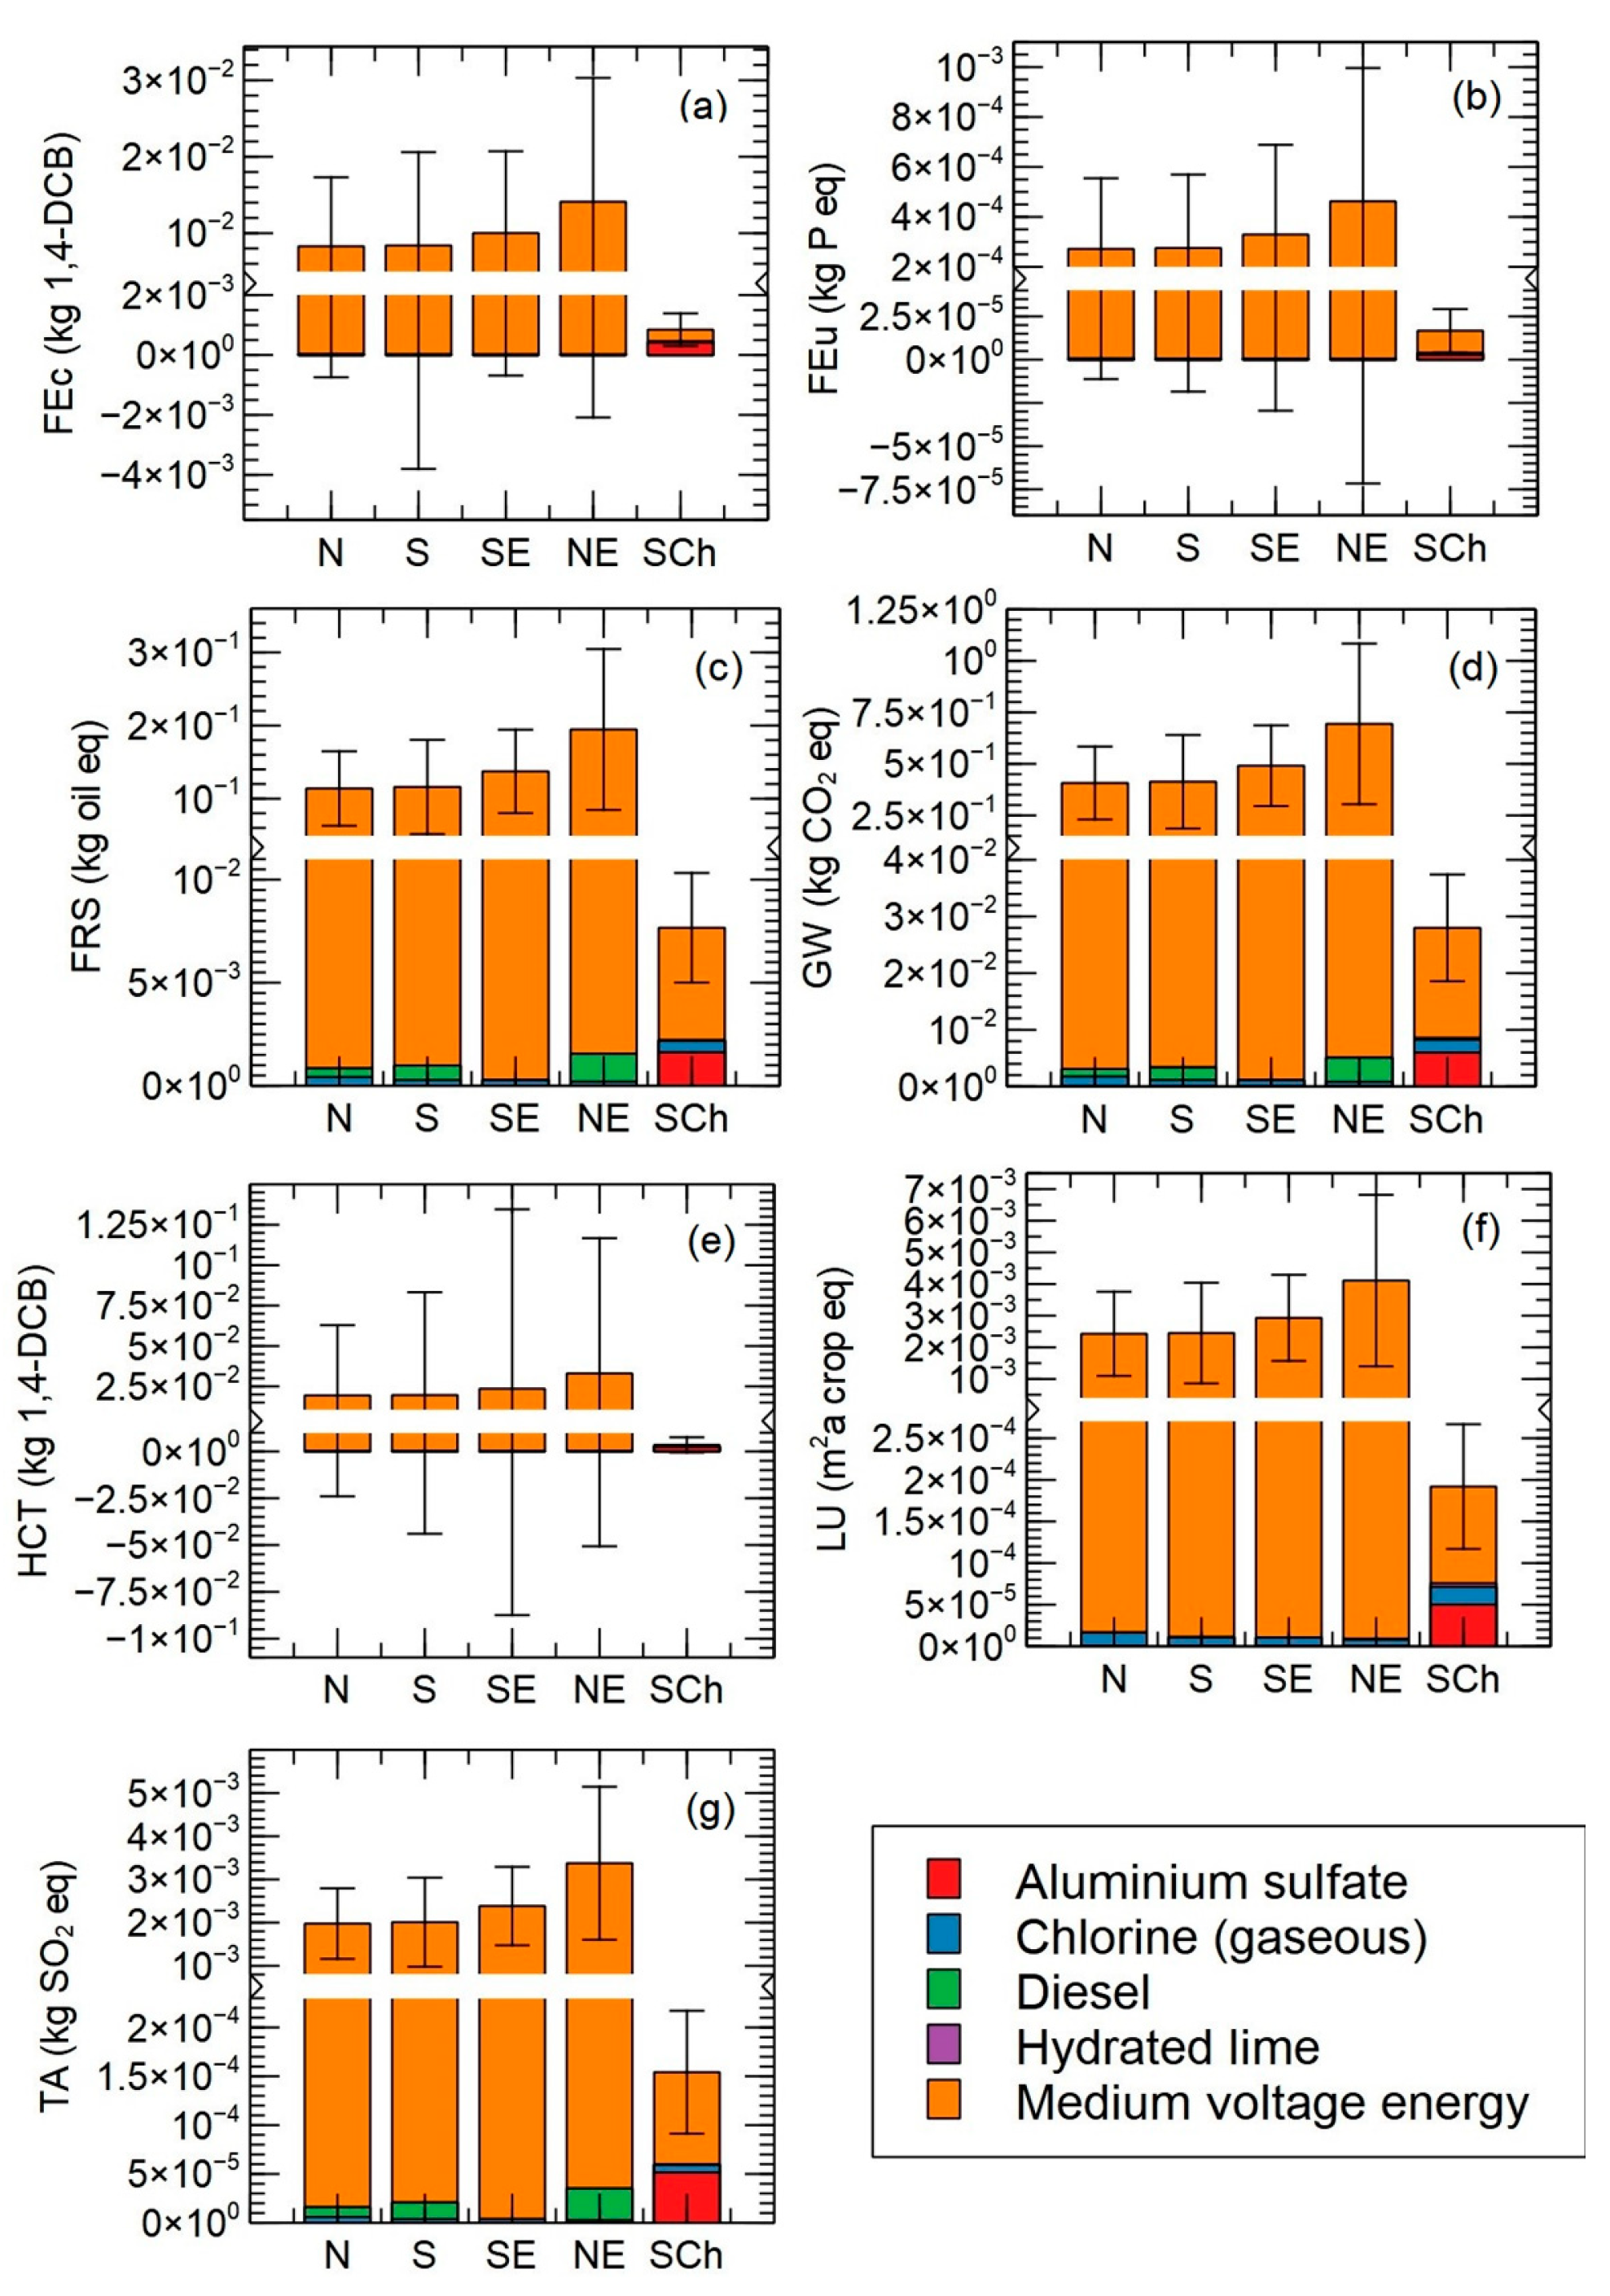
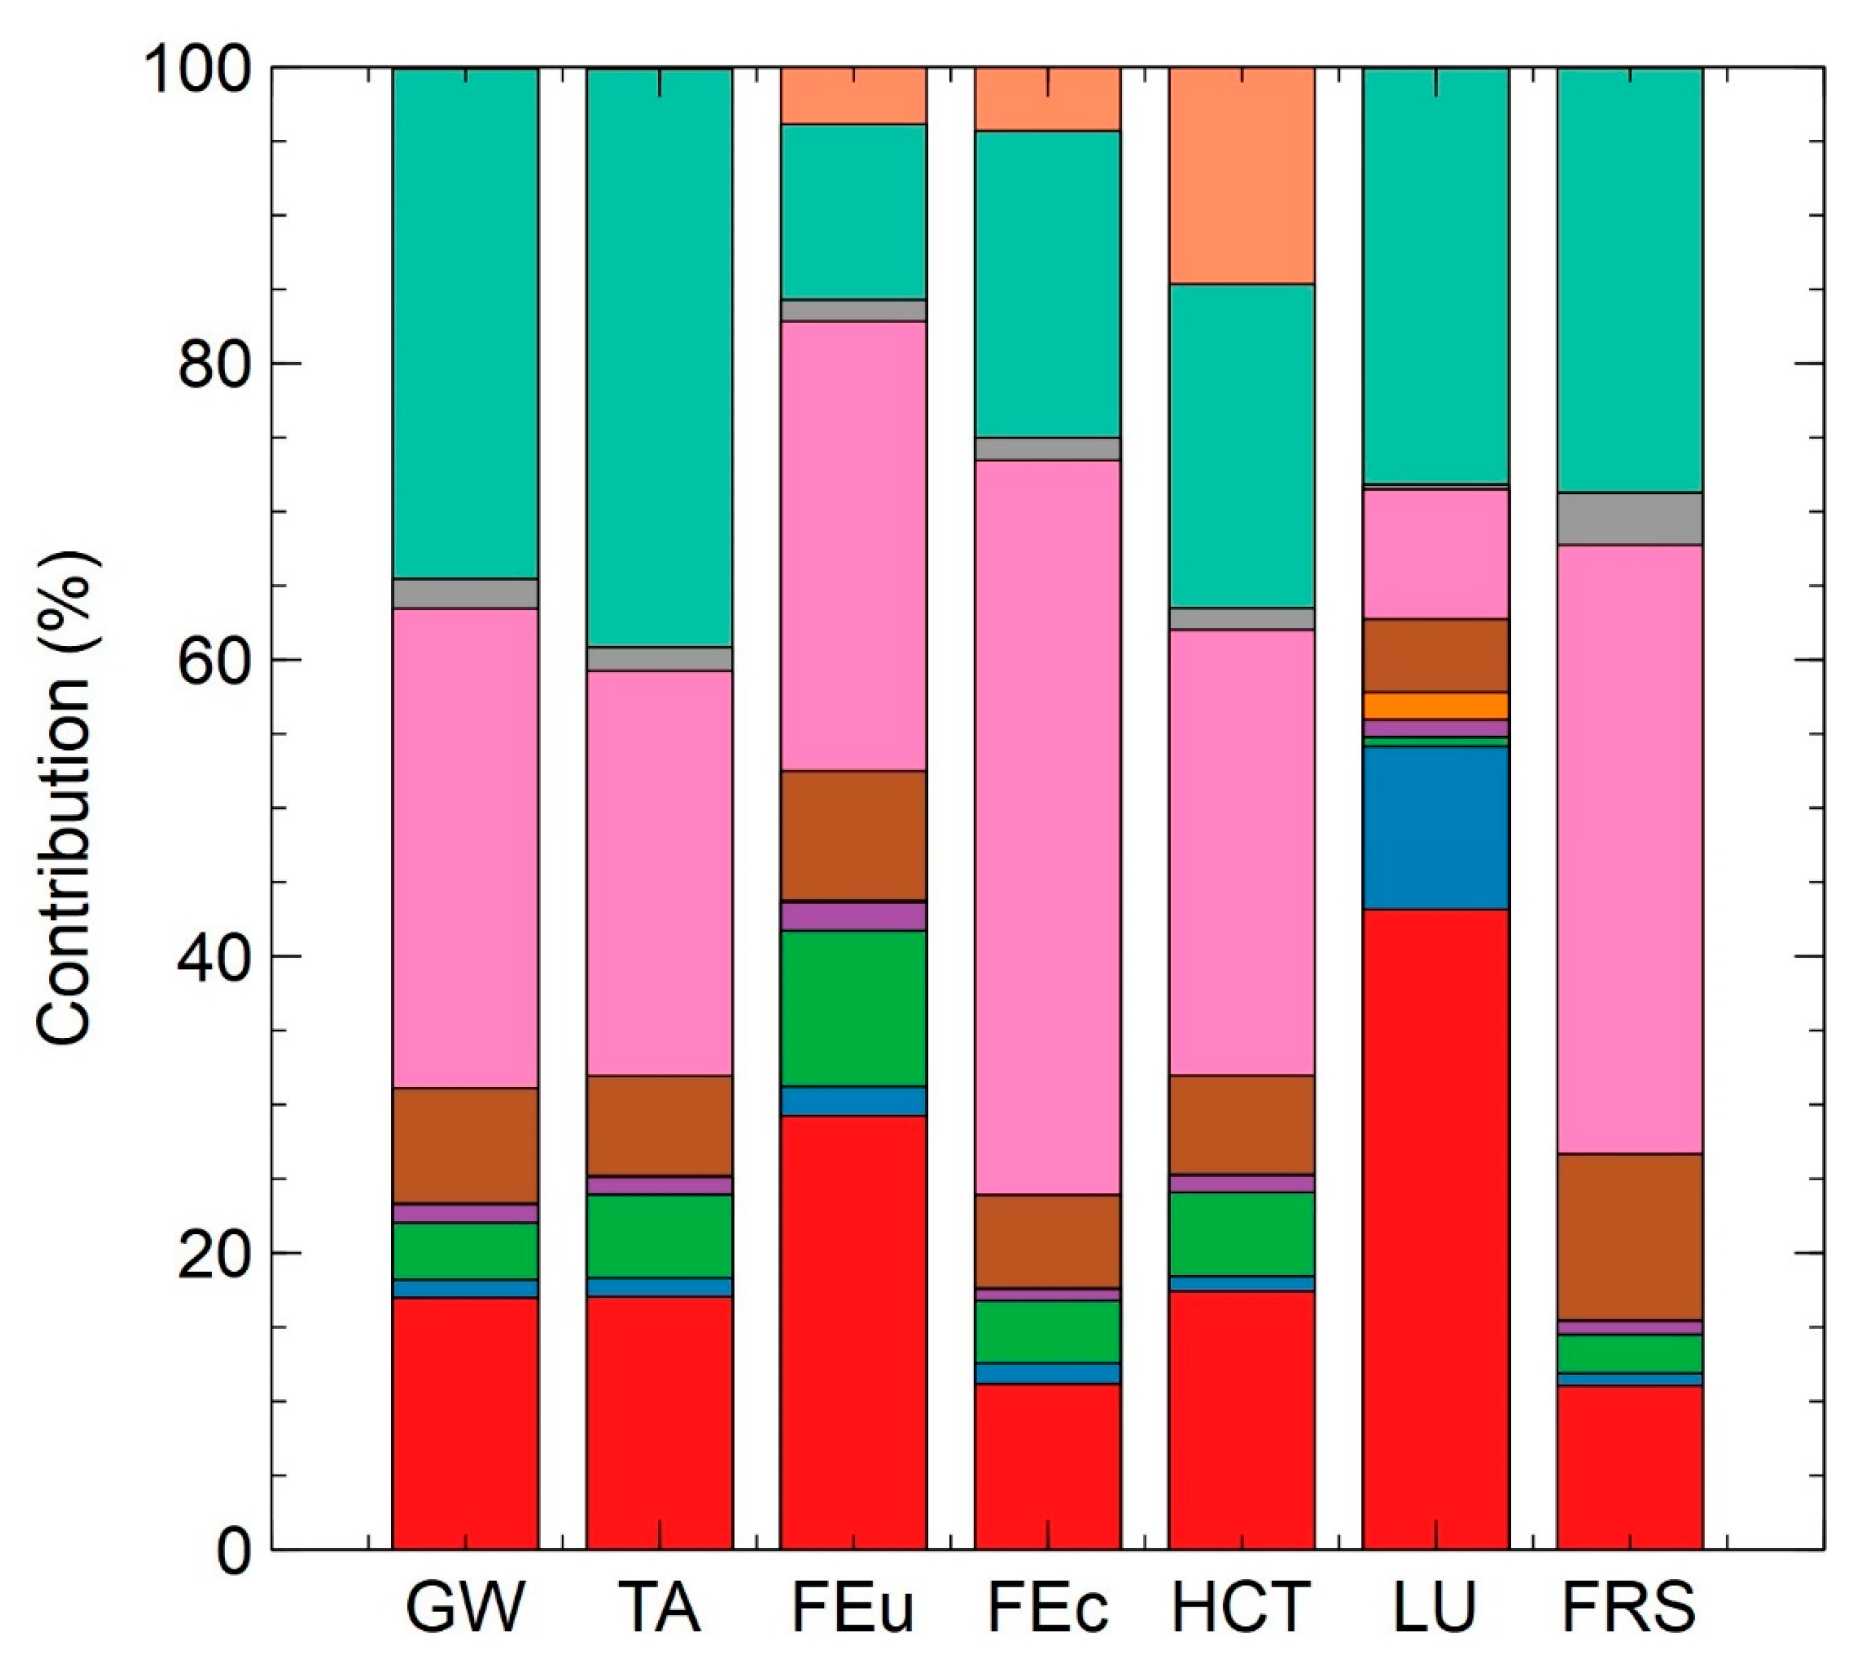
3.2. Environmental Impact Assessment: Production and Distribution Systems
3.3. Environmental Impact Assessment: Bottled Water
3.4. Comparison of the Environmental Impacts of Water Sources
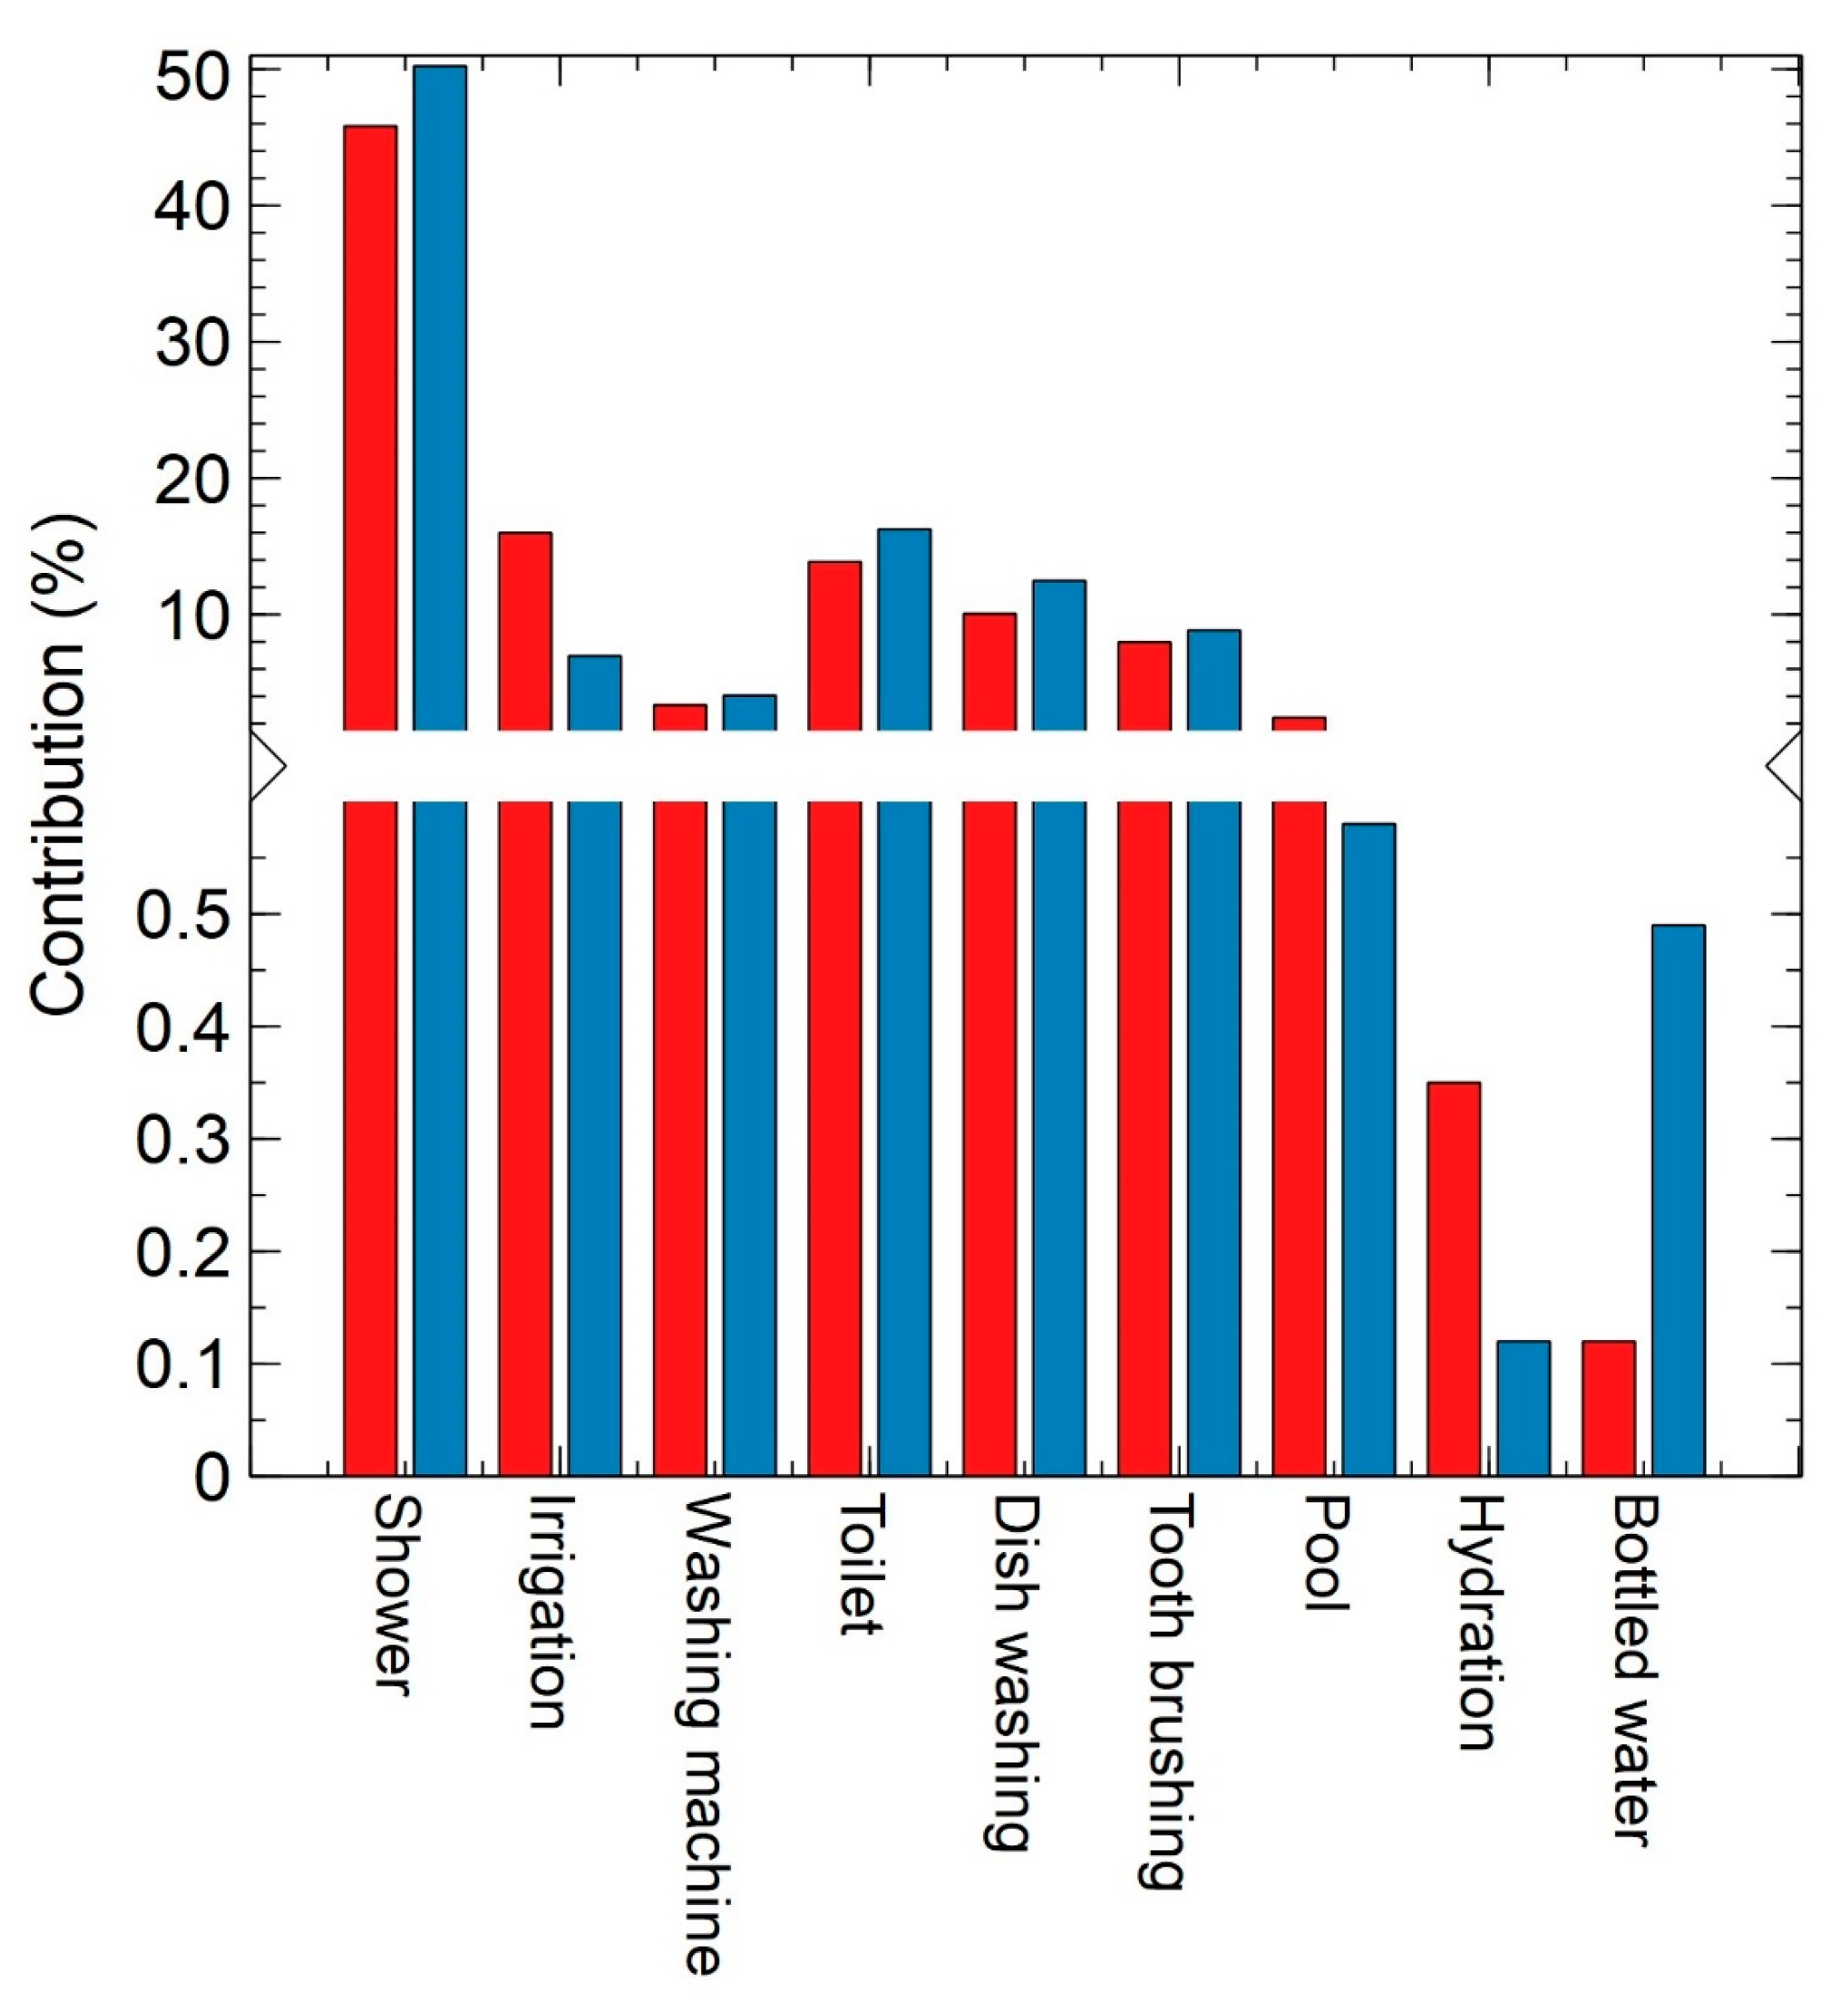
3.5. Consumption Profiles: End-Uses of Water in Households
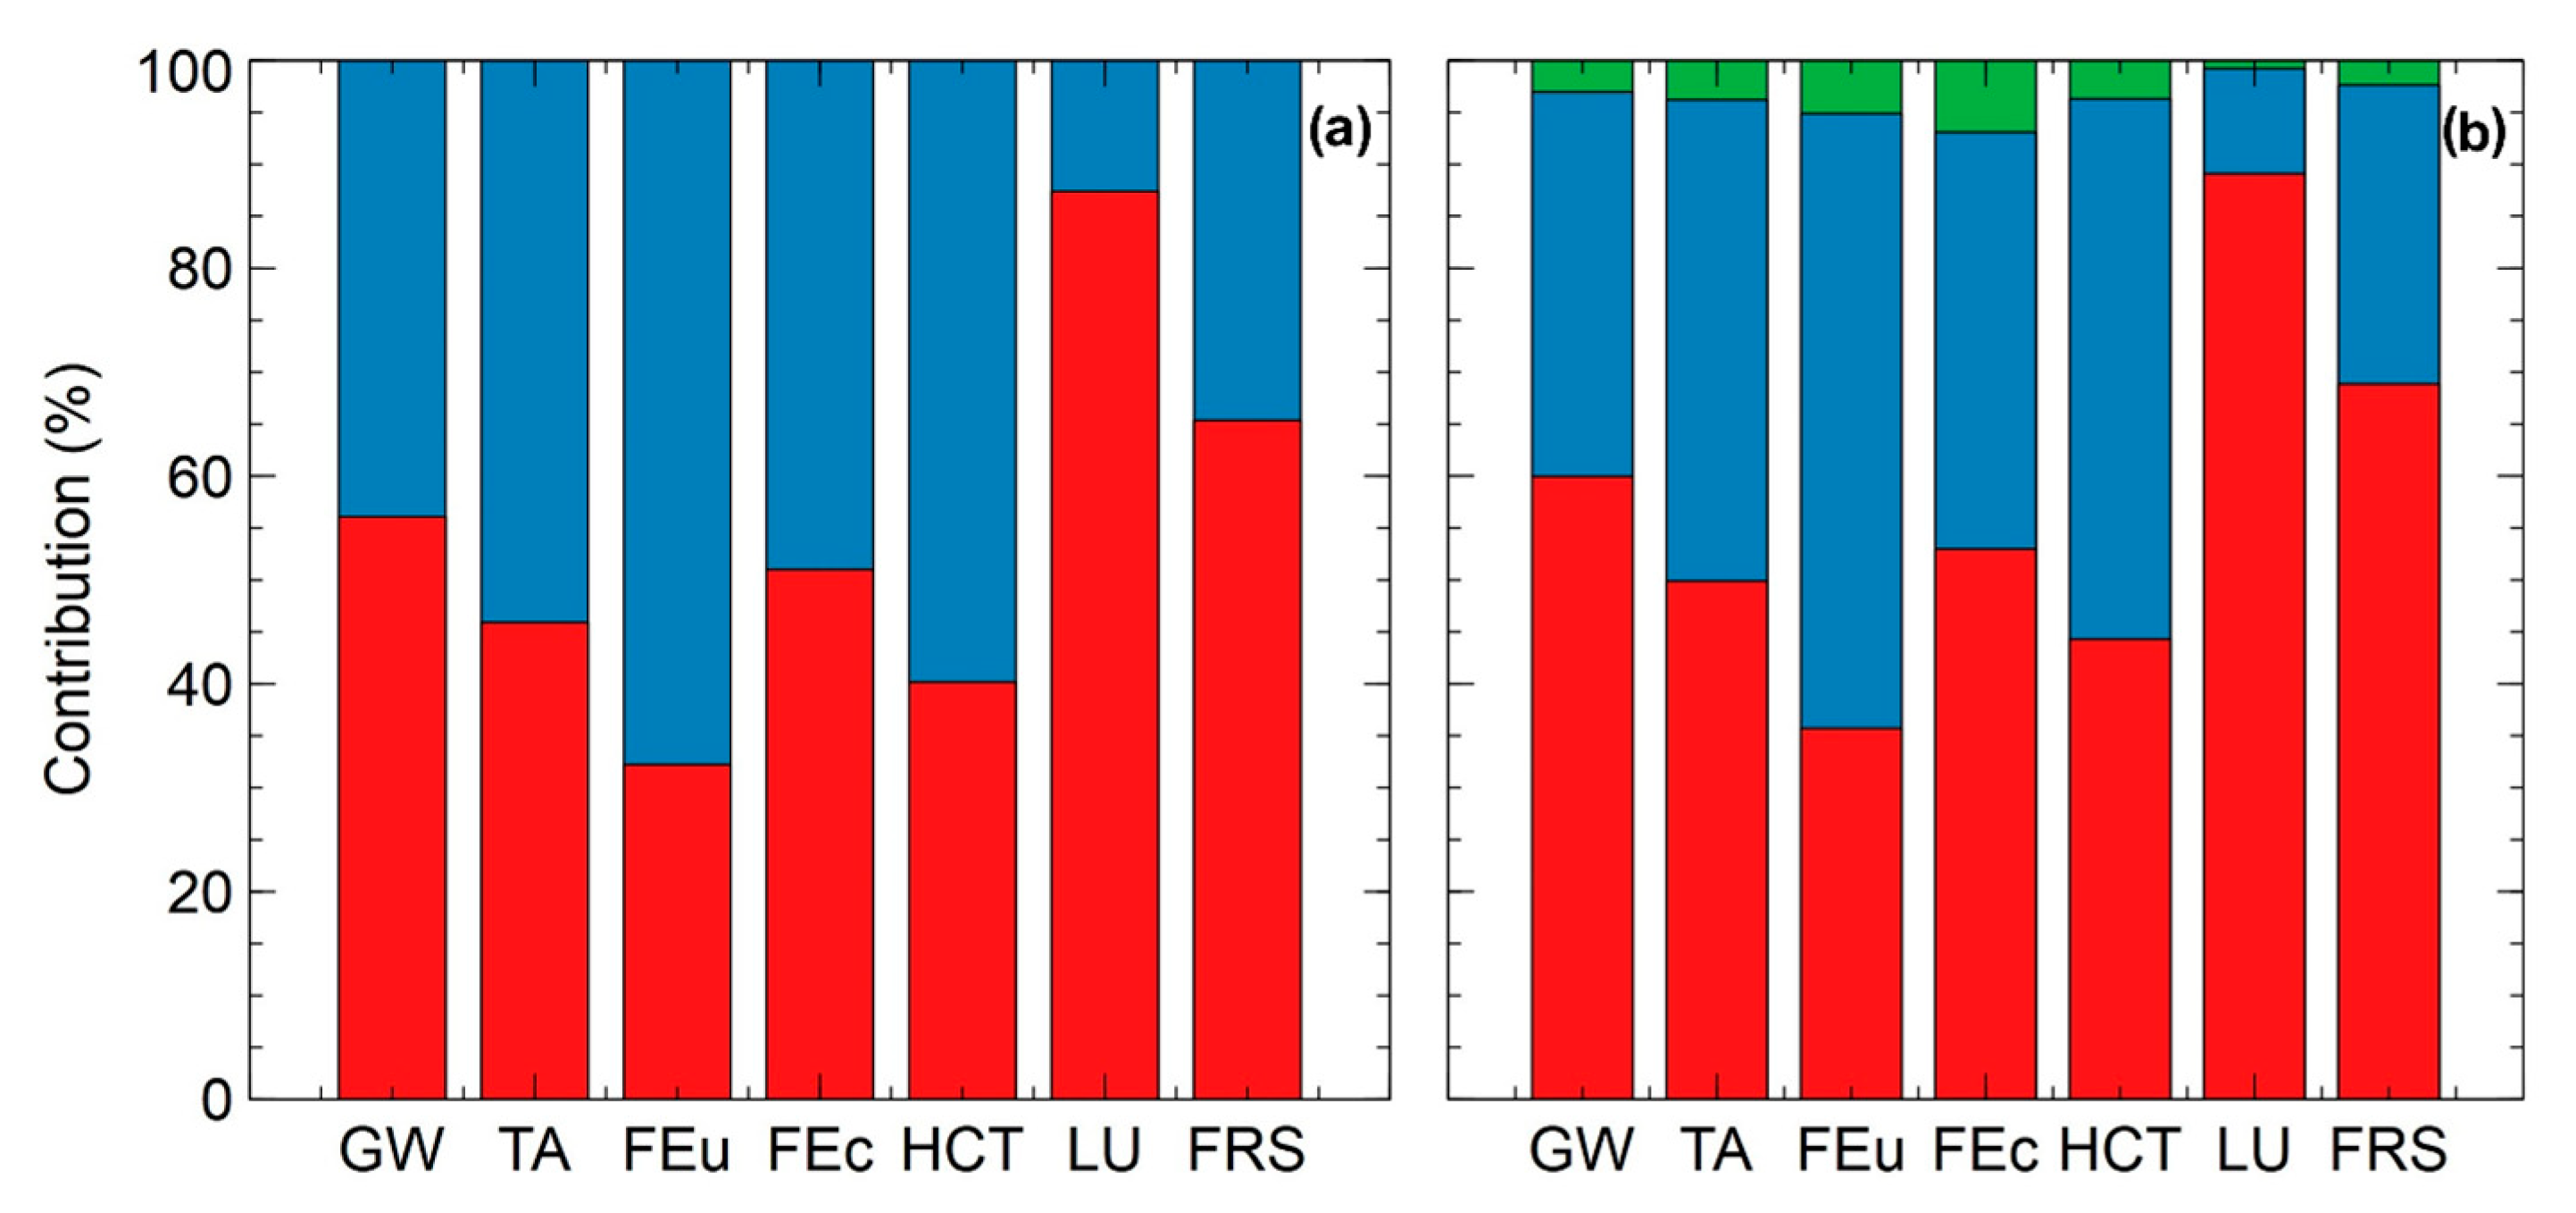
3.6. Comparison of Consumption Profiles and Their Environmental Impacts
4. Conclusions
Supplementary Materials
Author Contributions
Funding
Institutional Review Board Statement
Informed Consent Statement
Data Availability Statement
Acknowledgments
Conflicts of Interest
References
- United Nations (UN). The Sustainable Development Goals Report. 2019, pp. 1–64. Available online: https://unstats.un.org/sdgs/report/2019/The-Sustainable-Development-Goals-Report-2019.pdf (accessed on 13 December 2022).
- Bonton, A.; Bouchard, C.; Barbeau, B.; Jedrzejak, S. Comparative life cycle assessment of water treatment plants. Desalination 2012, 284, 42–54. [Google Scholar] [CrossRef]
- Superintendencia de Servicios Sanitarios (SISS). Informe de Gestión del Sector Sanitario. 2019, pp. 1–161. Available online: https://www.siss.gob.cl/586/articles-17955_recurso_1.pdf (accessed on 13 December 2022). (In Spanish).
- Thomassen, G.; Huysveld, S.; Boone, L.; Vilain, C.; Geysen, D.; Huysman, K.; Cools, B.; Dewulf, J. The environmental impact of household’s water use: A case study in Flanders assessing various water sources, production methods and consumption patterns. Sci. Total Environ. 2021, 770, 145398. [Google Scholar] [CrossRef] [PubMed]
- ISO 14040; Environmental Management—Life Cycle Assessment—Principles and Framework. International Organization for Standardization (ISO): Geneva, Switzerland, 2006.
- Polizzi di Sorrentino, E.; Woelbert, E.; Sala, S. Consumers and their behavior: State of the art in behavioral science supporting use phase modeling in LCA and ecodesign. Int. J. Life Cycle Assess. 2016, 21, 237–251. [Google Scholar] [CrossRef]
- Garfí, M.; Cadena, E.; Sanchez-Ramos, D.; Ferrer, I. Life cycle assessment of drinking water: Comparing conventional water treatment, reverse osmosis and mineral water in glass and plastic bottles. J. Clean. Prod. 2016, 137, 997–1003. [Google Scholar] [CrossRef]
- Makov, T.; Meylan, G.; Powell, J.T.; Shepon, A. Better than bottled water?—Energy and climate change impacts of on-the-go drinking water stations. Resour. Conserv. Recycl. 2019, 143, 320–328. [Google Scholar] [CrossRef]
- Nessi, S.; Rigamonti, L.; Grosso, M. LCA of waste prevention activities: A case study for drinking water in Italy. J. Environ. Manag. 2012, 108, 73–83. [Google Scholar] [CrossRef]
- Tamburini, E.; Costa, S.; Summa, D.; Battistella, L.; Fano, E.A.; Castaldelli, G. Plastic (PET) vs. bioplastic (PLA) or refillable aluminium bottles—What is the most sustainable choice for drinking water? A life-cycle (LCA) analysis. Environ. Res. 2021, 196, 110974. [Google Scholar] [CrossRef] [PubMed]
- Gato-Trinidad, S.; Jayasuriya, N.; Roberts, P. Understanding urban residential end uses of water. Water Sci. Technol. 2011, 64, 36–42. [Google Scholar] [CrossRef]
- Shan, Y.; Yang, L.; Perren, K.; Zhang, Y. Household water consumption: Insight from a survey in Greece and Poland. Procedia Eng. 2015, 119, 1409–1418. [Google Scholar] [CrossRef]
- Prasetiawan, T.; Nastiti, A.; Muntalif, B.S. ‘Bad’ Piped Water and Other Perceptual Drivers of Bottled Water Consumption in Indonesia. Wiley Interdiscip. Rev. Water 2017, 4, 1–12. [Google Scholar] [CrossRef]
- Li, L.; Araral, E.; Jeuland, M. The Drivers of Household Drinking Water Choices in Singapore: Evidence from Multivariable Regression Analysis of Perceptions and Household Characteristics. Sci. Total Environ. 2019, 671, 1116–1124. [Google Scholar] [CrossRef]
- Tröger, R.; Klöckner, P.; Ahrens, L.; Wiberg, K. Micropollutants in Drinking Water from Source to Tap—Method Development and Application of a Multiresidue Screening Method. Sci. Total Environ. 2018, 627, 1404–1432. [Google Scholar] [CrossRef] [PubMed]
- Instituto Nacional de Estadística (INE). Censo de Población y Vivienda. 2017. Available online: https://www.ine.cl/estadisticas/sociales/censos-de-poblacion-y-vivienda/censo-de-poblacion-y-vivienda (accessed on 13 December 2022). (In Spanish).
- Garcia-Suarez, T.; Kulak, M.; King, H.; Chatterton, J.; Gupta, A.; Saksena, S. Life cycle assessment of three safe drinking-water options in India: Boiled water, bottled water, and water purified with a domestic reverse-osmosis device. Sustainability 2019, 11, 6233. [Google Scholar] [CrossRef]
- Comisión Nacional de Energía (CNE). Datos del Sistema Energético Nacional. 2020. Available online: https://www.cne.cl/estadisticas/electricidad/ (accessed on 13 December 2022). (In Spanish).
- Ortiz-Rodríguez, O.O.; Villamizar-Gallardo, R.A.; García, R. Life cycle assessment of four potable water treatment plants in northeastern Colombia. Rev. Ambient. Água 2014, 9, 445–458. [Google Scholar] [CrossRef]
- Abraira, V. El índice kappa. Semergen 2001, 27, 247–249. (In Spanish) [Google Scholar] [CrossRef]
- Castillo-Ávalos, Y.; Rovira-Pinto, A. Eficiencia hídrica en la Vivienda. Tecnol. Cien. Agua 2013, 4, 159–171. (In Spanish) [Google Scholar]
- Ciroth, A.; Muller, S.; Weidema, B.; Lesage, P. Empirically based uncertainty factors for the pedigree matrix in ecoinvent. Int. J. Life Cycle Assess 2016, 21, 1338–1348. [Google Scholar] [CrossRef]
- Fantin, V.; Scalbi, S.; Ottaviano, G.; Masoni, P. A Method for Improving Reliability and Relevance of LCA Reviews: The Case of Life-Cycle Greenhouse Gas Emissions of Tap and Bottled Water. Sci. Total Environ. 2014, 476–477, 228–241. [Google Scholar] [CrossRef] [PubMed]
- Water Research Foundation. Residential End Uses of Water, Version 2: Executive Report; Water Research Foundation: Denver, CO, USA, 2016. [Google Scholar]
- Villanueva, C.M.; Garfí, M.; Milà, C.; Olmos, S.; Ferrer, I.; Tonne, C. Health and environmental impacts of drinking water choices in Barcelona, Spain: A modelling study. Sci. Total Environ. 2021, 795, 148884. [Google Scholar] [CrossRef] [PubMed]


| Parameter | Unit | Production System | ||||
|---|---|---|---|---|---|---|
| SCh | NE | N | S | SE | ||
| Electricity | kWh/m3 | 0.04 | 1.35 | 0.79 | 0.80 | 0.96 |
| Chlorine gas | kg/m3 | 2.4 × 10⁻³ | 8.10 × 10⁻⁴ | 1.9 × 10⁻³ | 1.2 × 10⁻³ | 1.2 × 10⁻³ |
| Calcium hydroxide | kg/m3 | 3.1 × 10⁻⁴ | - | - | - | - |
| Oil consumption | kWh/m3 | 5.6 × 10⁻⁵ | 4.9 × 10⁻³ | 1.5 × 10⁻³ | 2.6 × 10⁻³ | - |
| Aluminum sulphate | kg/m3 | 8.3 × 10⁻³ | - | - | - | - |
| Parameter | Unit | Mean | References | |
|---|---|---|---|---|
| Inputs | Surface water | m3 | 1.26 | Garcia-Suarez et al. (2019) [17] |
| Polypropylene (PP) | kg | 1.40 | Garcia-Suarez et al. (2019) [17] | |
| Corrugated carton boxes | kg | 3.01 | Garcia-Suarez et al. (2019) [17] | |
| Kraft paper | kg | 0.07 | Garcia-Suarez et al. (2019) [17] | |
| Ozone, liquid | kg | 0.35 | Garcia-Suarez et al. (2019) [17] | |
| Packaging film | kg | 4.03 | Garcia-Suarez et al. (2019) [17] | |
| Polyethylene Terephthalate (PET) | kg | 18 | Garcia-Suarez et al. (2019) [17] | |
| Auxiliary processes | Electricity | kWh | 20 | Garfí et al. (2016) [7] |
| Injection molding | kg | 1.4 | Garcia-Suarez et al. (2019) [17] | |
| Blow molding | kg | 18 | Garcia-Suarez et al. (2019) [17] | |
| Transport, truck | tkm | 321 | Garcia-Suarez et al. (2019) [17] | |
| Wastes | Wastewater | m3 | 0.26 | Garcia-Suarez et al. (2019) [17] |
| Impact Category | Unit | Well Water | Tap Water | Bottled Water | |||
|---|---|---|---|---|---|---|---|
| Average | SD | Average | SD | Average | SD | ||
| GW | kg CO2 eq | 0.05 | 0.01 | 0.11 | 0.03 | 165.99 | 5.81 |
| TA | kg SO2 eq | 2.4 × 10⁻⁴ | 1.0 × 10⁻⁴ | 5.6 × 10⁻⁴ | 1.3 × 10⁻⁴ | 0.56 | 0.02 |
| FEu | kg P eq | 3.3 × 10⁻⁵ | 0.00 | 7.3 × 10⁻⁵ | 3.19 × 10⁻⁵ | 0.04 | 0.00 |
| FEc | kg 1,4-DCB | 1.0 × 10⁻³ | 1.2 × 10⁻³ | 2.5 × 10⁻³ | 2.1 × 10⁻³ | 5.88 | 0.29 |
| HCT | kg 1,4-DCB | 2.3 × 10⁻³ | 7.8 × 10⁻³ | 7.1 × 10⁻³ | 0.02 | 4.99 | 0.65 |
| LU | m2a crop eq | 2.9 × 10⁻⁴ | 1.04 × 10⁻⁴ | 6.9 × 10⁻³ | 2.1 × 10⁻⁴ | 8.18 | 0.41 |
| FRS | kg oil eq | 0.01 | 3.9 × 10⁻³ | 0.03 | 8.1 × 10⁻³ | 67.75 | 2.46 |
| Water Source | Homes without Well | Homes with Well | ||||
|---|---|---|---|---|---|---|
| m3 inhab−1 year−1 | Percentage Contribution | US$ inhab−1 year−1 * | m3 inhab−1 year | Percentage Contribution | US$ inhab−1 year−1 * | |
| Tap water | 55.5 | 99.5% | 291.8 | 44.1 | 68.4% | 148.6 |
| Well water | - | - | 20.3 | 31.5% | ||
| Bottled water | 0.3 | 0.5% | 0.1 | 0.1% | ||
| Total | 55.8 | 100% | 64.5 | 100% | ||
Disclaimer/Publisher’s Note: The statements, opinions and data contained in all publications are solely those of the individual author(s) and contributor(s) and not of MDPI and/or the editor(s). MDPI and/or the editor(s) disclaim responsibility for any injury to people or property resulting from any ideas, methods, instructions or products referred to in the content. |
© 2023 by the authors. Licensee MDPI, Basel, Switzerland. This article is an open access article distributed under the terms and conditions of the Creative Commons Attribution (CC BY) license (https://creativecommons.org/licenses/by/4.0/).
Share and Cite
Zúñiga, V.; Leiva, S.; Riquelme, C.; Gómez, G.; Vidal, G.; Neumann, P. Assessing the Environmental Impacts of Household Water Supply: A Case Study Considering Consumption Patterns within a Life-Cycle Perspective. Sustainability 2023, 15, 1946. https://doi.org/10.3390/su15031946
Zúñiga V, Leiva S, Riquelme C, Gómez G, Vidal G, Neumann P. Assessing the Environmental Impacts of Household Water Supply: A Case Study Considering Consumption Patterns within a Life-Cycle Perspective. Sustainability. 2023; 15(3):1946. https://doi.org/10.3390/su15031946
Chicago/Turabian StyleZúñiga, Valentina, Sofía Leiva, Cristian Riquelme, Gloria Gómez, Gladys Vidal, and Patricio Neumann. 2023. "Assessing the Environmental Impacts of Household Water Supply: A Case Study Considering Consumption Patterns within a Life-Cycle Perspective" Sustainability 15, no. 3: 1946. https://doi.org/10.3390/su15031946
APA StyleZúñiga, V., Leiva, S., Riquelme, C., Gómez, G., Vidal, G., & Neumann, P. (2023). Assessing the Environmental Impacts of Household Water Supply: A Case Study Considering Consumption Patterns within a Life-Cycle Perspective. Sustainability, 15(3), 1946. https://doi.org/10.3390/su15031946