1. Introduction
Road safety is one of the fundamental requirements for achieving sustainable development goals, as outlined in documents published by a number of organizations, including the World Health Organization [
1], the European Commission [
2], and the Ministry of Transport [
3]. These documents clearly express the importance of planning and designing road safety facilities. Incidents on the road often result in unpredictable consequences, including a series of losses involving rescue personnel, vehicles, and road safety measures after the collision [
4]. Among these accidents, loss of vehicle control is one of the critical reasons for serious crashes, and vehicle braking problems is one of the 10 key factors leading to the loss of vehicle control [
5].
There can be many types of runaway vehicles on the highway, including but not limited to sedan cars, large buses, medium trucks, and even heavy trucks. Stopping a runaway vehicle without it impacting a hard object, such as a rigid barrier or sharp steel barrier, is the ideal option. There have been many studies on the impact of concrete barriers on Honda vehicles [
6], Chevrolet pickup trucks [
7], single-unit trucks [
8], and tractor-semitrailers [
9], which can cause serious damage to vehicles and occupants. Existing runaway vehicle deceleration measures can be roughly divided into four categories: a steep slope type, relying on the vehicle’s own gravity; an arrangement of sand and gravel for deceleration; an arrester-bed type; or a flexible interceptor rope or interception network structure. Several studies [
10,
11,
12] have reported effective tire controls for out-of-control vehicles, such as setting up gravel or fine sand to increase friction to stop vehicles. In addition, flexible devices are characterized by a high ratio of energy-dissipating ability to mass, and have been widely used for interception protection of fighter planes on aircraft carriers [
13,
14] and protection against falling rocks in mountainous areas [
15,
16]. The flexural interception structure is usually composed of a cable net or ring net, which bears the direct impact of the impacting object, transmitting stresses to the connecting components.
The dragnet system [
17] developed by Hudson, an American company, has attracted extensive attention. It uses energy absorbers and a series of staggered nets to stop runaway vehicles. However, the same interception resistance is adopted for different out-of-control vehicles, which may cause the situation that a small car has a serious impact, while a big car cannot be stopped, and the net needs to be replaced each time, resulting in wasted resources. Therefore, the development of a vehicle protective barrier system that is suitable for different vehicles and can be reused repeatedly is particularly important.
Based on the existing protective measures for runaway vehicles, a protective barrier system for different types of vehicles is proposed in this paper, which realizes different interception resistance control through adjustment of the worm-type damper. Finite element simulation (using LSDYNA) was conducted to optimize the parameters of the protective barrier system. Then, the effectiveness of the protective system was evaluated through a real vehicle crash test, and the accuracy of the simulation was verified. This study innovatively includes different interception resistance and interception methods according to different runaway vehicles, in order to basically achieve effective interception while maximizing the safety of passengers in the vehicle. Five sets of real impact tests and further accurate finite element simulations provide effective data support in the vehicle safety field. However, it should be noted that the effective interception of heavy high-speed vehicles still requires extensive and in-depth research. The article is dedicated to the contribution that the proposed protective barrier system can make to road safety, as well as to sustainable development.
2. Design of the Runaway Vehicle Protective Barrier System
For a runaway vehicle, the protective barrier system should first make its speed reduce to zero; that is, to be able to successfully stop the vehicle. Secondly, the passengers in the car should be protected; namely, the maximum acceleration of the runaway vehicle interception should not exceed the limit that the human body can withstand. Finally, the protective system should be able to be repeatedly recycled in order to reduce costs. Therefore, based on the above characteristics, an effective protective barrier system is developed that can produce different interception forces for different impact vehicles.
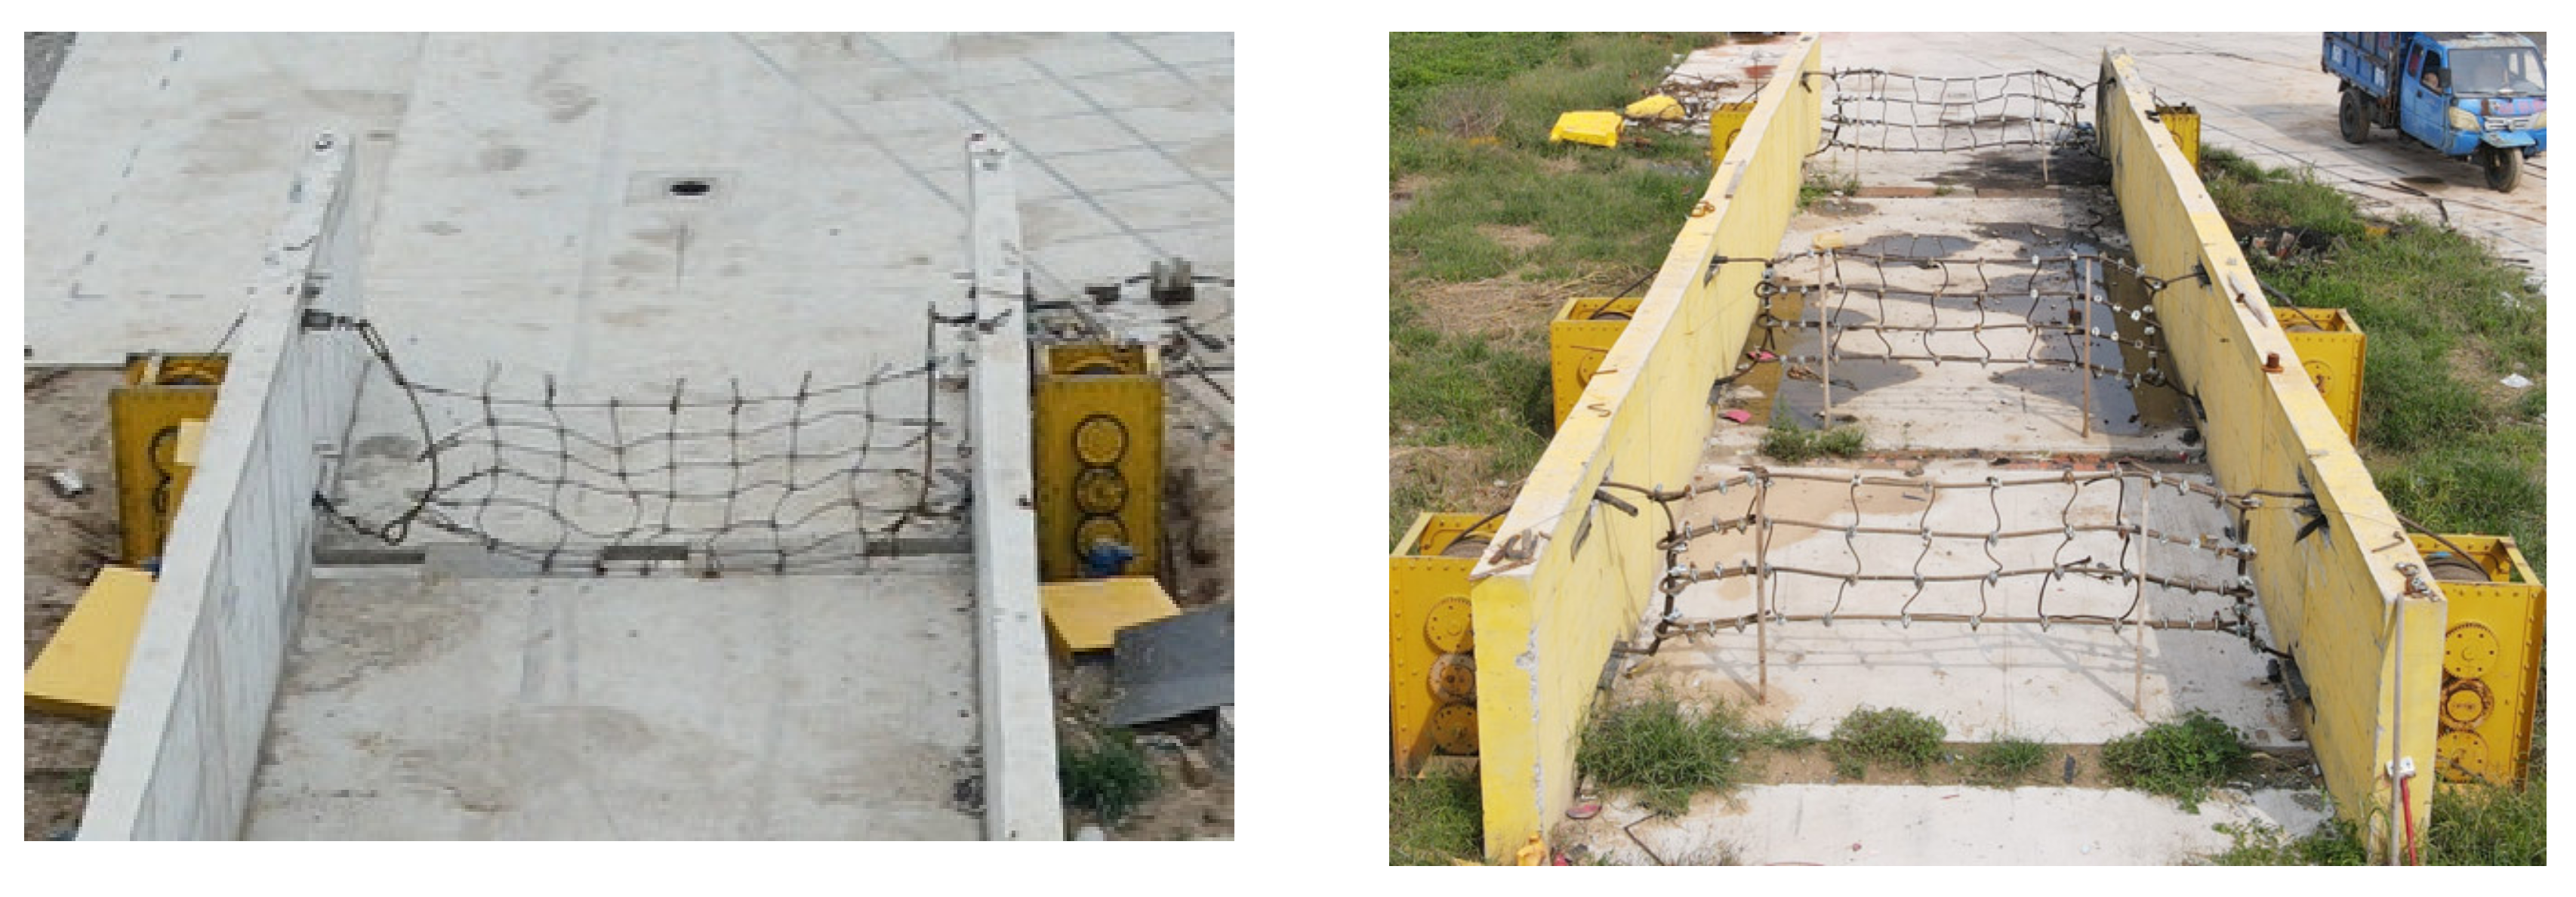
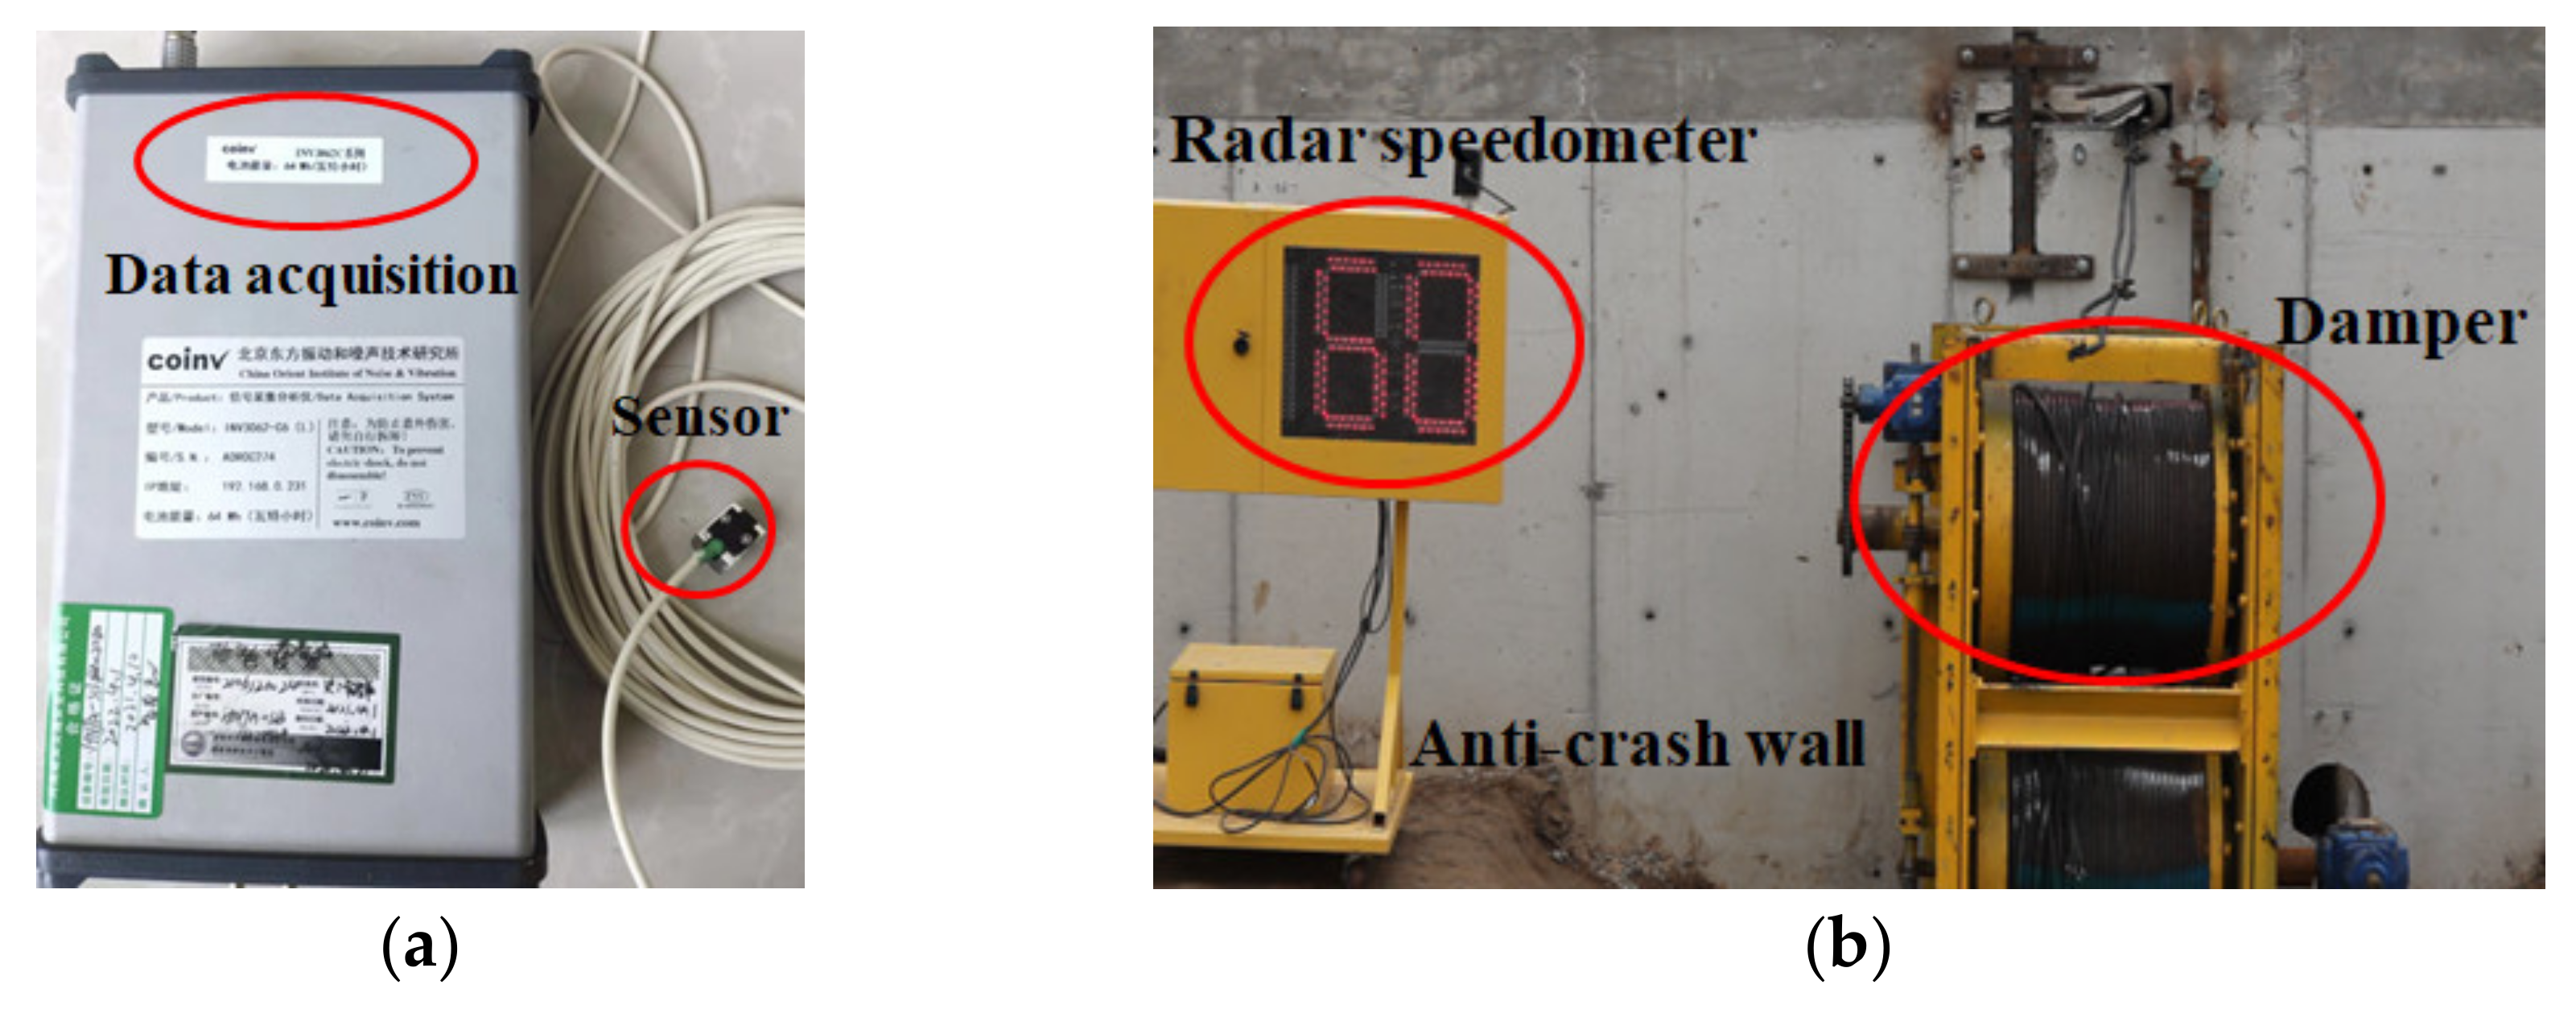
The protective barrier system is mainly made up of worm-type variable dampers and an arresting net, as shown in
Figure 1 and
Figure 2, respectively. The former consists of the planetary gear, brake drum, synchronizing shaft, and worm, while the latter is composed of multiple arresting cables. The planetary gear is used to drive the worm to extend and exert pressure on the expanding friction plates, thus increasing the rotational resistance of the drum-type winding wheel and gradually increasing the stopping resistance. When the expansion friction plate and the winding wheel reached the maximum dynamic friction, the arresting resistance reached its maximum value. The initial resistance of the arresting cable can be set by adjusting the initial position of the worm.
In order to facilitate the connection, positioning, and suspension of the arresting net, the damper adopts a vertical double drum parallel design. The upper and lower two arresting cables can be synchronized to extend the interceptor cable, in order to keep the arresting net elevation such that an effective arresting state is always maintained, while providing a more powerful arresting force. A double-drum damper was set up on the ground, with a total of four arresting cables, arranged as shown in
Figure 2. The damper and the arresting net were connected by pulleys. In addition, the synchronous shaft used in the previous equipment was retained, in order to ensure that both sides of the extension arresting cables were balanced and did not deviate from the direction, thus developing a new type of equipment that can adjust the mechanism of the cable force and extend the arresting cables synchronously.
When the arresting cable wrapped by the drum damper is dragged out by the vehicle, the resistance consists of three parts: the inertial resistance generated by the rotation of the damper, the impact resistance generated by the impact on the blocking net, and the braking resistance of the damper itself, defined as per Equation (1):
where
Z denotes the damper braking resistance,
Fg denotes the inertial resistance caused by the rotation of the damper, and
Fc denotes the impact resistance generated by the impact on the arresting net.
The three arresting forces are calculated as shown in Equations (2)–(5):
where
Z0 is the initial resistance of the dampers and
is the length X of the arresting cable being pulled out:
where
J is the moment of inertia of the drum roller as it rotates around the center of its cylinder,
R is the radius of the drum, and
ω is the angular acceleration of drum collision, and:
where
V0 is the speed of the vehicle before it reaches arresting net I,
m is the mass of the arresting net, and Δ
t is the time of collision.
According to Equations (2)–(5), the variable arresting resistance
F of a single damper can be written as per Equation (6):
According to Equation (6), the resistance F provided by the dampers in this project is not a constant force but, instead, a variable closely related to the collision speed and intercept time; namely, F(V, t, Z0, a, m, J,…).
The initial arresting net material was made of high-strength flexible fabric with a diameter of 20 mm. In the actual high-speed collision test, the high impact forces often caused the fabric to break, resulting in failure of the actual vehicle arresting test. Therefore, all subsequent tests of the arresting net were in the form of 50 mm diameter woven wire rope net (the size was finally determined after a large number of test experiments), consisting of steel wire, rope core, and grease. The wire rope was processed through a cold drawing process to give it high tensile strength and toughness, as shown in
Figure 3. To ensure that the test results were not affected by the fracture of the arresting net, the arresting net was replaced after each test, the rope buckle removed, and the arresting net loosened from the end of the damper. The wire rope used by the arresting net was the same as that used by the damper.
A sedan car (Santana 2000, model: SVW7182CFI) produced in 2010 and a heavy truck (China heavy-duty truck) produced in 2013 were used as collision vehicles. The total mass of the sedan car was 1.48 t without ballast, and it had an overall length, width, and height of 4.61, 1.69, and 1.47 m, respectively. The total mass of the heavy truck was 49 t, and it had an overall length, width, and height of 11.55, 2.33, and 4.4 m, respectively. To reduce the cost of the experiment, secondhand vehicles were used as collision vehicles, but both vehicles were structurally intact as a whole and could still be driven on the road.
3. Proposed Method
3.1. Overview
Unlike other new roadway safety barriers, the proposed protective barrier system is unique in its material (i.e., flexible arresting net) and deformation (i.e., sliding of the support ropes and shackles). Meanwhile, the setting parameters of the protective system must be considered comprehensively for different types of runaway vehicles (i.e., different bumper and engine heights). The proposed method utilizes these unique features to achieve a favorable runaway vehicle protective barrier system through finite element simulation analysis. The proposed method includes 3 steps: (1) protective barrier system modeling (e.g., steel wire ropes, energy dissipating devices, connections, and vehicle); (2) setting the parameters of the arresting net under frontal impact (i.e., height and number of arresting nets); and (3) protective evaluation of runaway vehicle interception performance under different collision angles.
3.2. Establishment of the Protective Barrier System Model
Considering the expensive cost of crash tests using real vehicles, along with the rapid development of computer-aided engineering (CAE) techniques, numerical simulation has become a desirable approach in dealing with damage and stress analyses, following which the reliability of the results can be verified by comparison with actual tests. Meanwhile, in order to simulate the complicated behavior of the flexural arresting net—which is characterized by fast-speed impact, as well as highly geometrical non-linearities and contact behaviors between the components—the nonlinear finite element software LS-DYNA was used for the numerical simulation to represent the vehicle failure during the arresting process. The computer used for calculation is a small workstation with 24 cores and 512G running memory, which can meet the calculation requirements of LS-DYNA. The finite element model of the protective barrier system is depicted in
Figure 4.
In order to simplify the calculation, only rigid wall modeling was used for the anti-collision wall. The steel wire ropes, including the support and anchor ropes, were modelled using discrete beam elements with cable material type (*MAT_CABLE_DISCRETE_BEAM), such that the ropes could be modeled as tension only and cannot take compression forces. After the mesh sensitivity analysis, the mesh size of the steel wire rope was determined to be 5 mm. Multiple steel wire ropes formed the arresting net. A bilinear elastoplastic model was used, with elastic and tangential moduli of 150 GPa and 150 MPa, respectively, and a yield stress of 1800 MPa.
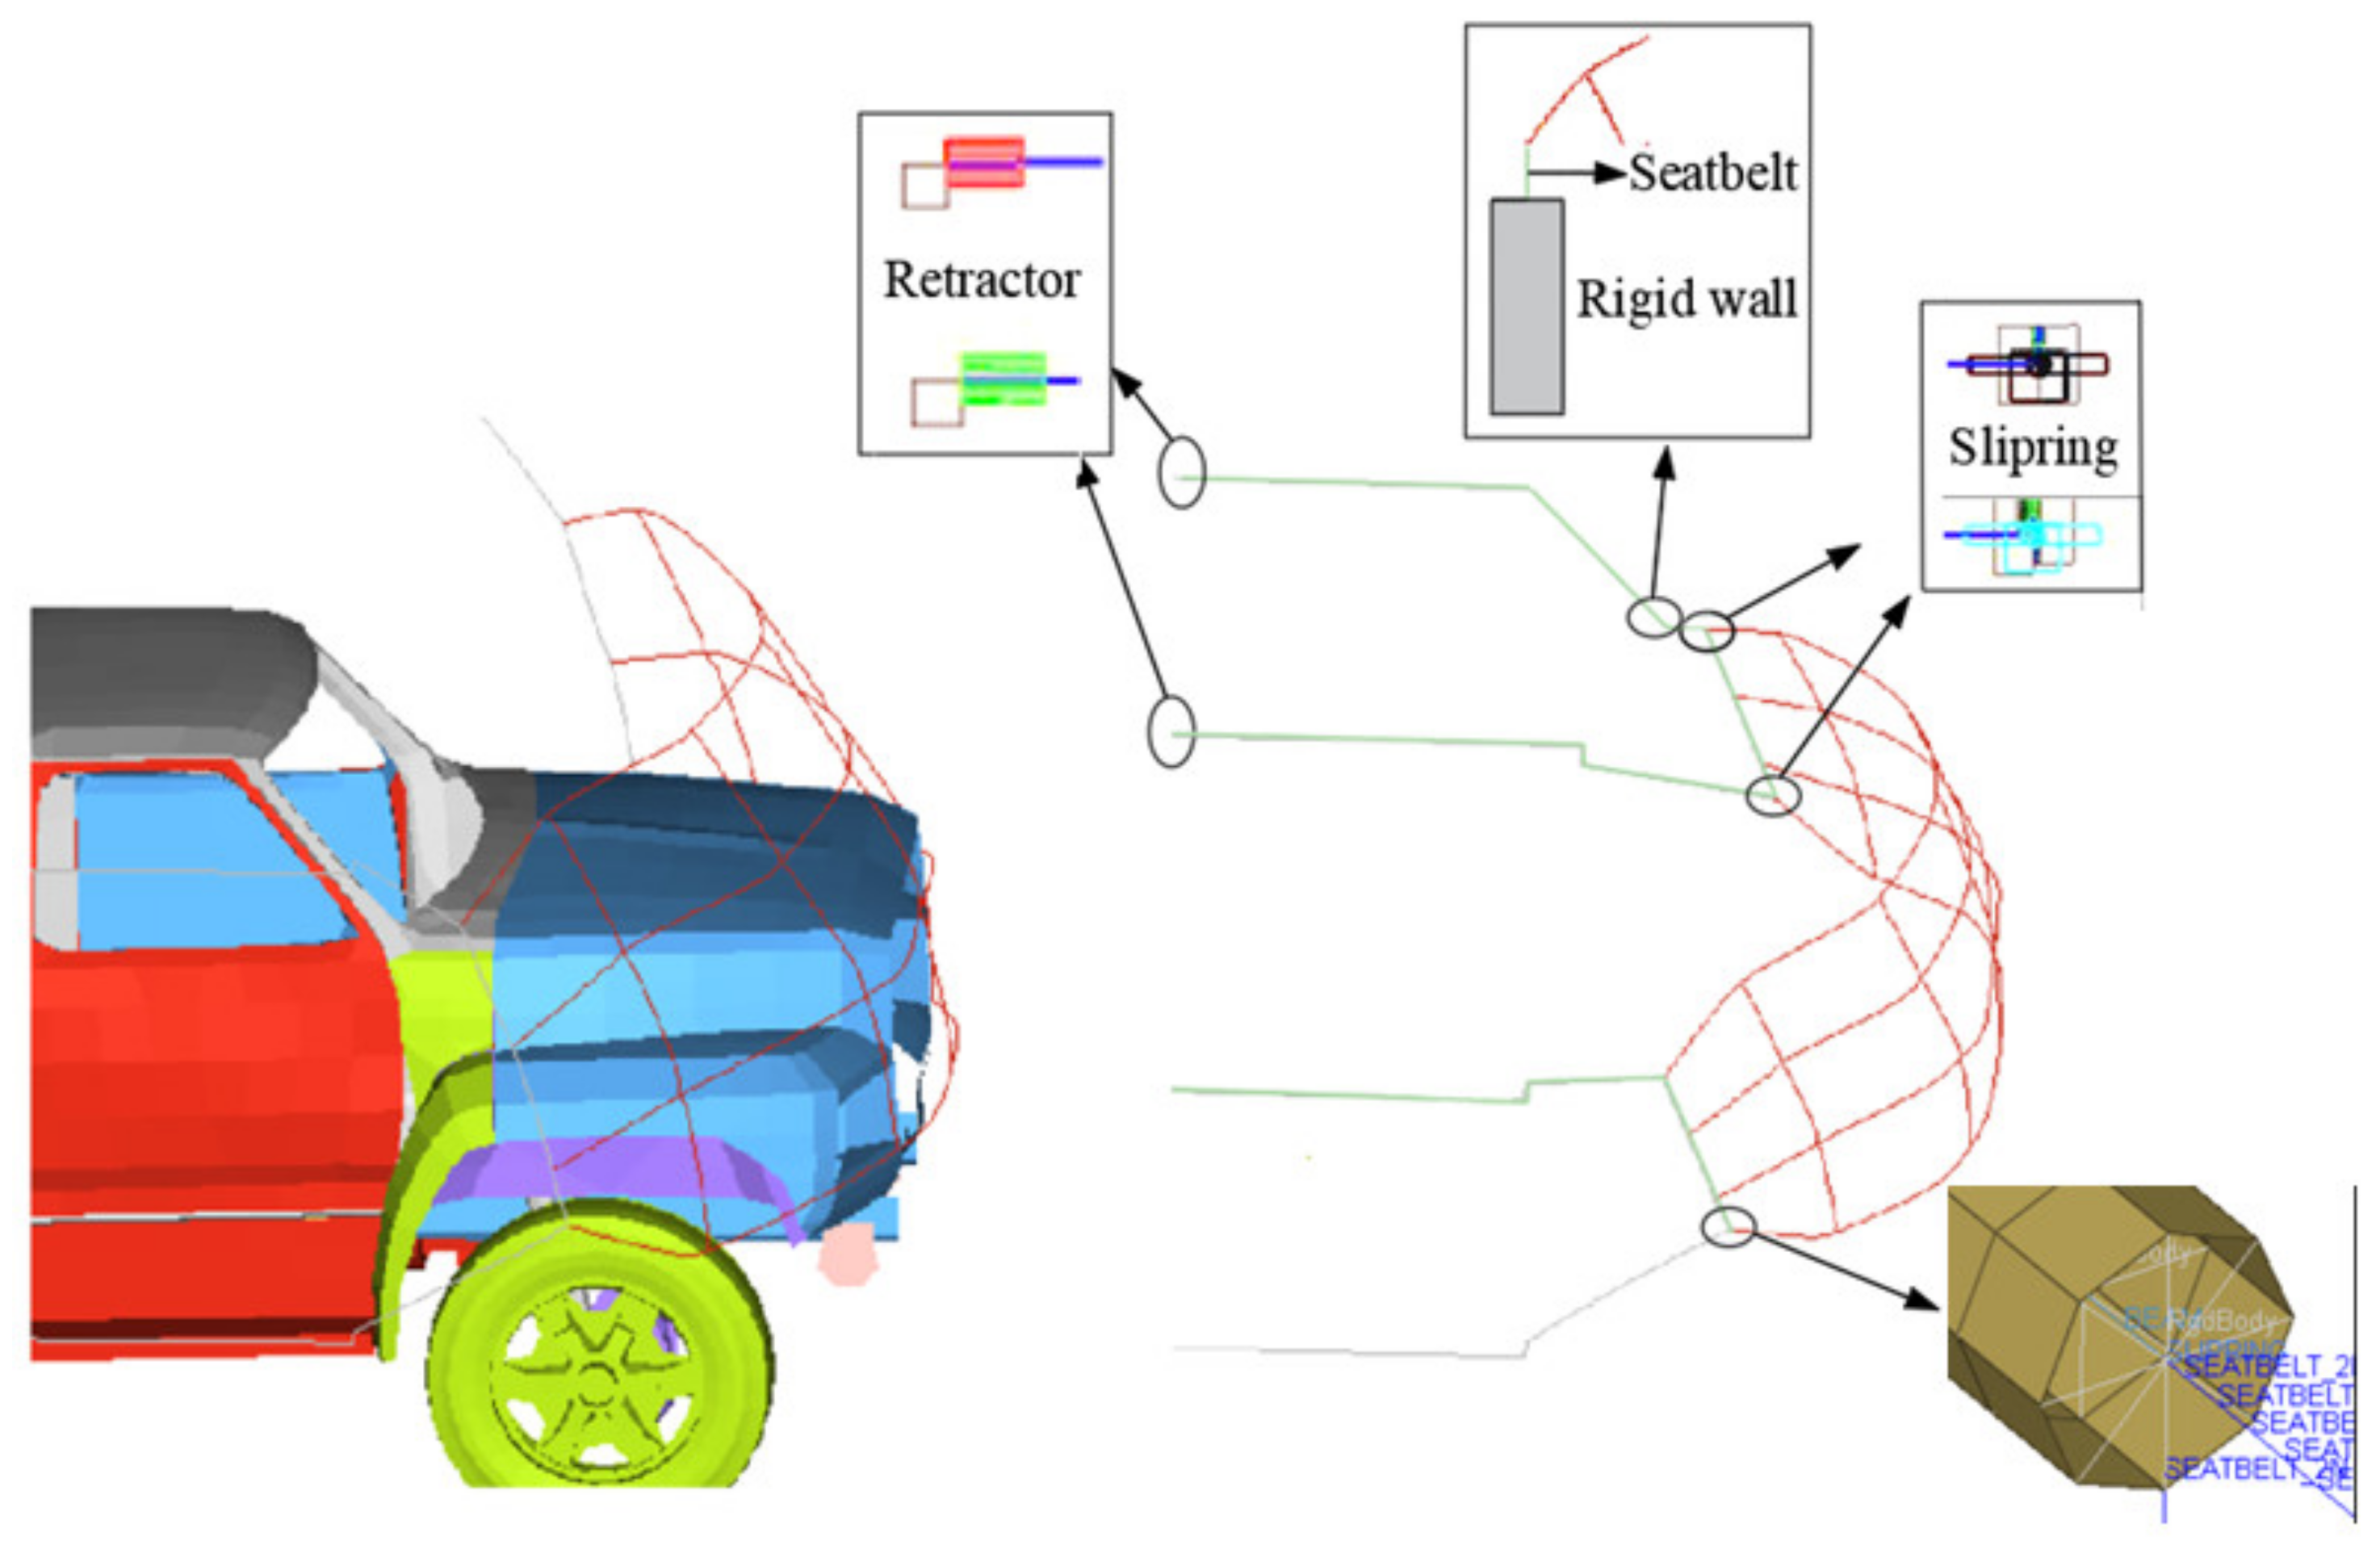
The energy dissipation devices are the most important part of the flexible barrier protective system, which not only absorb most of the energy, but also limit the peak load of the connected steel wire rope through large elastic–plastic deformation. In the actual experiment, the energy dissipation effect was realized by extension of the arresting cable on the damper. In the simulation, the traditional modeling method of translational spring elements was abandoned in favor of the retractor, which was defined using the keyword *ELEMENT_SEATBELT_RETRACTOR, in order to achieve the effect of energy dissipation; that is, to provide a limiting force effect such that the arresting cable can be extended to the maximum when the arresting resistance reaches a threshold. Moreover, seatbelt slip-ring elements were adopted in order to better simulate the cable-and-pulley system, as shown in
Figure 5. One-dimensional seatbelt elements (*MAT_SEATBELT) were placed on the inner and outer sides of the rigid wall, the initial length of which was determined according to the configuration of the barrier protective system. More specifically, on both inner sides of the rigid wall, the lengths of the seatbelt elements were estimated from the distance measures in the crash test without pulleys. On the outer side of the rigid wall, the lengths were determined based on the maximum elongation of the attached retractor devices. The coulomb static and dynamic friction coefficients were defined as 0.15 and 0.1, respectively [
15].
In the vehicular crash simulation performed for this study, a 2001 Ford Taurus and 1996 Ford F800 were adopted (seen
Figure 6), corresponding to the MASH Santana 2000 and China heavy-duty truck vehicles, respectively. The FE models of the 2001 Ford Taurus and 1996 Ford F800 were initially developed at NCAC and validated using frontal-impact tests [
18,
19]. The mass of the cargo inside the vehicle was adjusted to match the mass of the test model (i.e., 1.48 t for the small car and 49 t for the large truck). For the vehicular components, various element sectional types, including the beam, discrete, shell, solid, and mass elements, were included. For example, the engine and radiator of both vehicles were modeled with solid elements as well as the cargo box of the F800, while the bumpers, cabin, suspension, and wheels were modeled with shell elements. After the mesh sensitivity analysis, the most suitable mesh size was obtained for each component. The contact between the protective barrier system and the vehicle was defined as AUTOMATIC_SURFACE_TO_SURFACE. In addition, to capture the acceleration–time history of the vehicle during the impact process, the acceleration sensor (ELEMENT_SEATBELT_ACCELEROMETER) was set at the center of gravity of the vehicle. The initial speed of the vehicle was adjusted to 60 km/h using the keywords INITIAL_VELOCITY_GENERATION, and the friction coefficient between the vehicle tires and the ground was set to 0.25. Before the test, the mesh convergence of the vehicle and the arresting system were checked, and no major mesh defects were observed.
During the initial simulation, the arresting rope modeled with the beam unit did not break and the vehicle passed directly through the cable, thus not allowing for effective interception. In order to better simulate the contact between the arresting net and the runaway vehicle, outside the steel rope a shell unit was created. The shell unit outside the steel rope adopted the material *MAT_NULL (*MAT_009), in order to achieve contact effectiveness.
3.3. Determination of Parameters of the Arresting Net
In the process of protective barrier system modeling, the height of the lowest arresting net was considered to be adjusted properly, due to the difference in vehicle height. More specifically, when the arresting net was too high, the “lift the roof” phenomenon occurred; however, when the arresting net was too low, the vehicle was prone to overturning and rollover. In addition, the number of arresting nets was also evaluated, based on the different kinetic energy resulting from the mass and velocity of runaway vehicles.
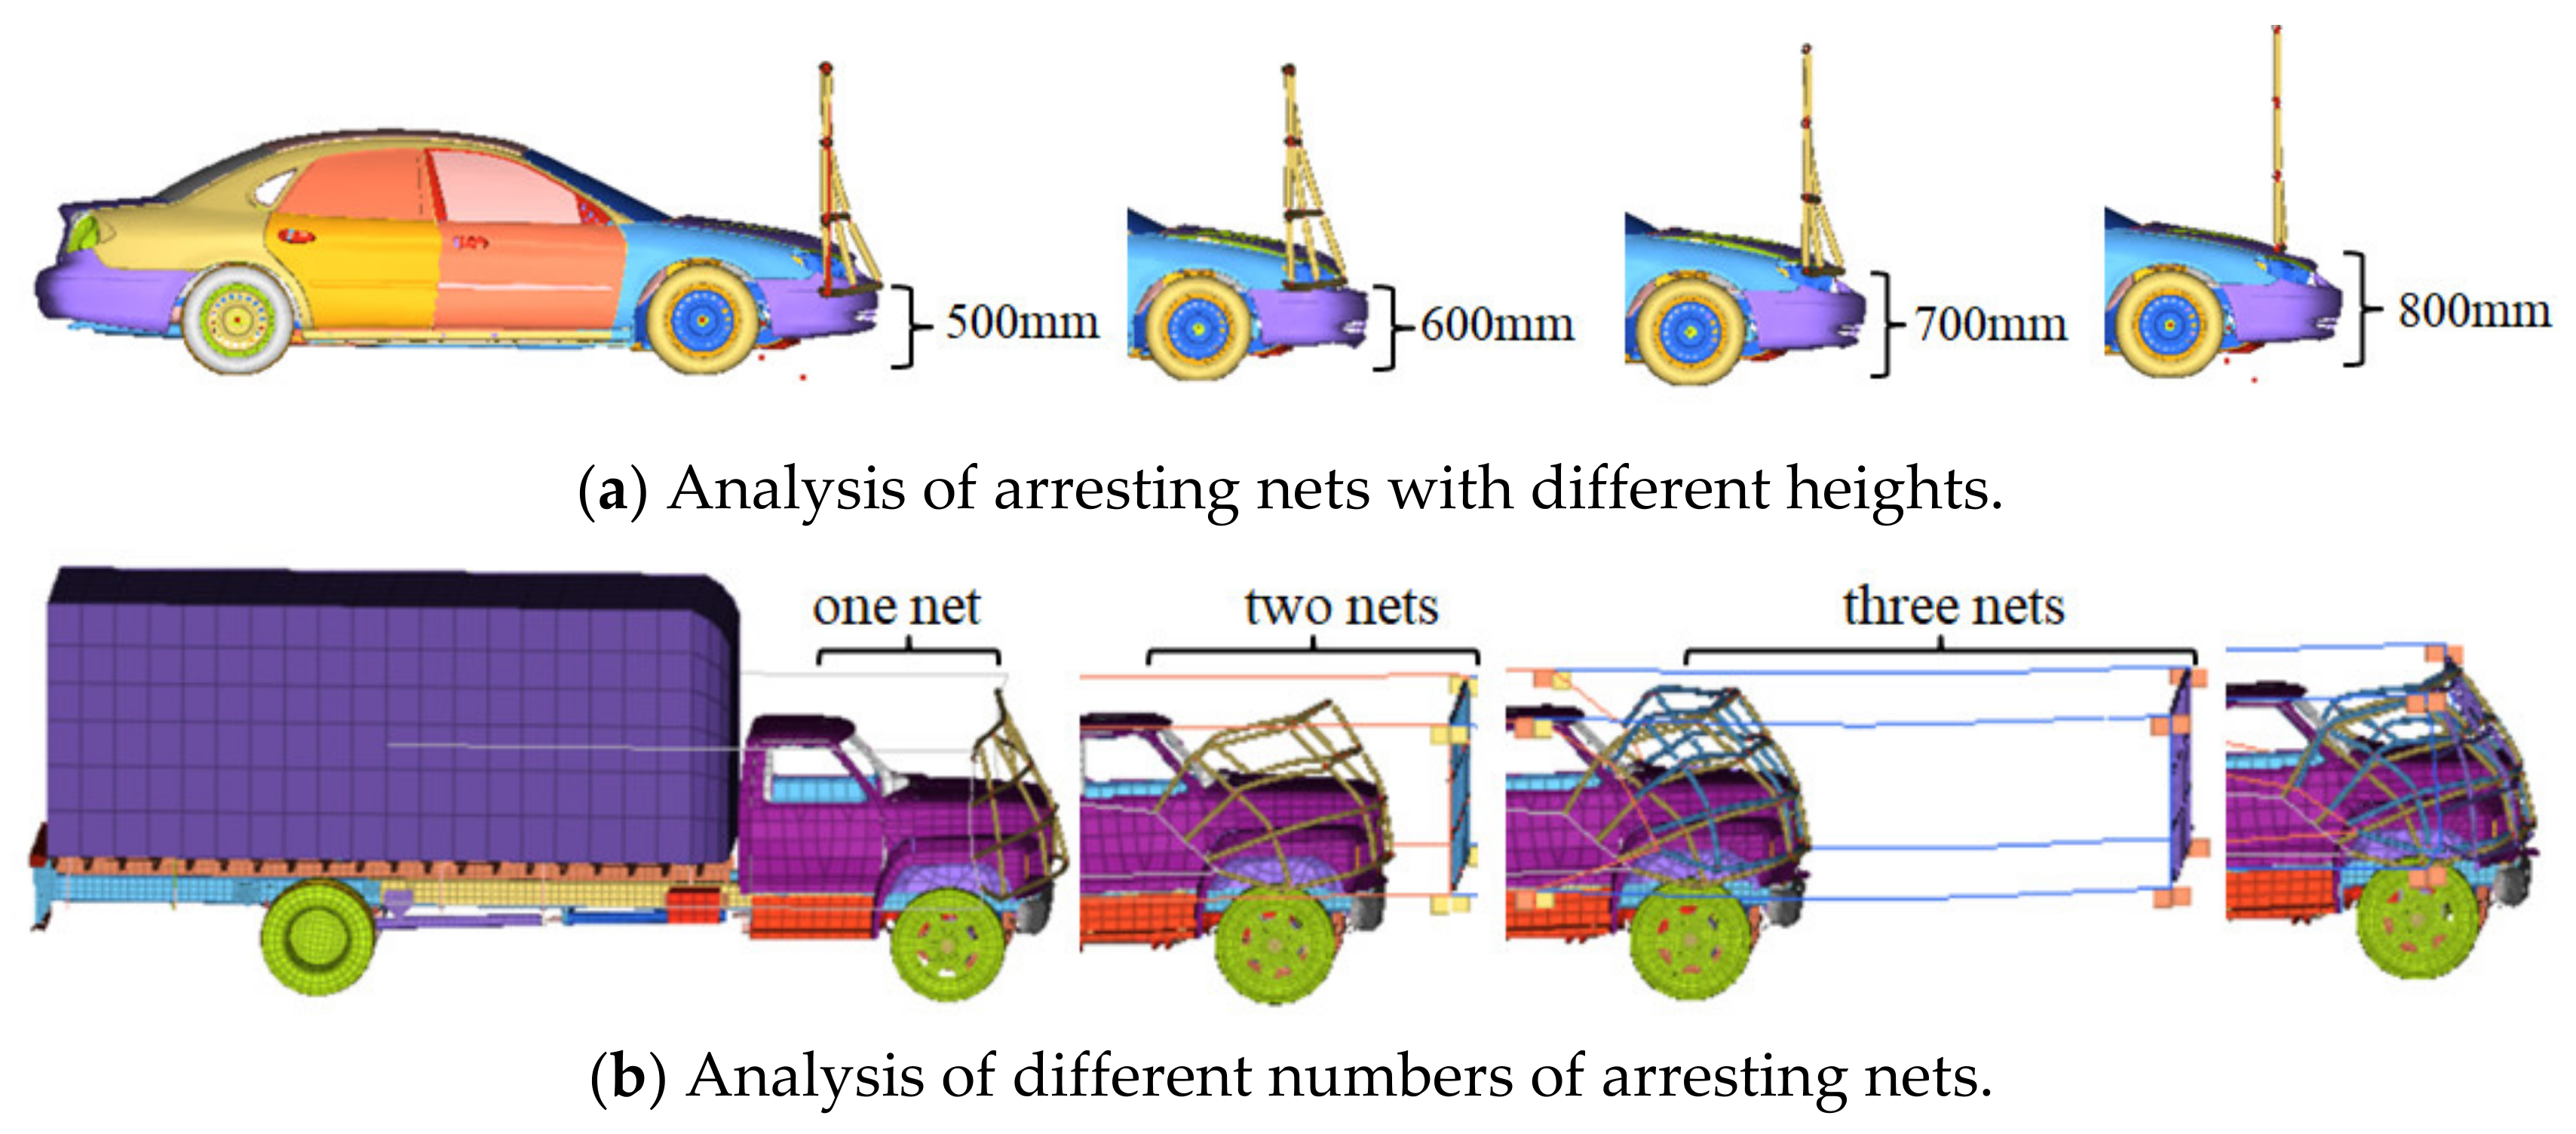
The response of the protective barrier system subjected to collision from the same vehicle velocity (60 km/h) at 4 different heights of the lowest arresting net—namely, 500 mm, 600 mm, 700 mm, and 800 mm—was compared, in order to investigate the optimal arrangement of the protective barrier system (as sketched in
Figure 7a). It can be clearly seen that, when the height of the lowest arresting net was greater than 600 mm, the small passenger vehicle’s bumper did not touch the arresting net and, therefore, a quick interception could not be achieved. The time-history curves of the rope force and the vehicular acceleration for the Ford Taurus vehicle are shown in
Figure 8.
In the case where the height of the lowest arresting net was set to 800 mm, the arresting cable functioned at 0.022 s. Subsequently, a large interception acceleration was generated near 0.04 s, making the interception effect poor. For the case where the height of the lowest arresting net was set to 500 mm, the interception cable produced peak cable force at only 0.01s. The maximum interception acceleration occurred at 0.015s, following which the vehicle decelerated rapidly, exhibiting a favorable interception effect. It was also observed that the maximum interception acceleration was still below the maximum acceptable threshold for individuals. Therefore, for small passenger vehicles, the best interception effect was achieved when the lowest arresting net height was set to 500 mm. The same analysis was used to perform FE simulations of a single-unit truck F800 impacting the arresting net at 60 km/h. The use of only one arresting net (with different setting heights) did not effectively stop the F800. However, when the height of the lowest arresting net was set to 970 mm, the protective barrier system functioned quickly and produced a larger stopping acceleration. Therefore, the optimal stopping height for single-unit trucks was 970 mm. In addition, it is worth mentioning that both vehicles maintained an upright position and maintained contact with the barrier until their velocity decreased.
For the situation of a small passenger vehicle running out of control at high speed (120 km/h), the use of an arresting net allowed for effective interception, and the peak impact acceleration met the specified requirements. However, in the situation of the heavy truck (49 t), whether at low speed (60 km/h) or high speed (120 km/h), 1 arresting net could not stop the runaway vehicle (see
Figure 7b).
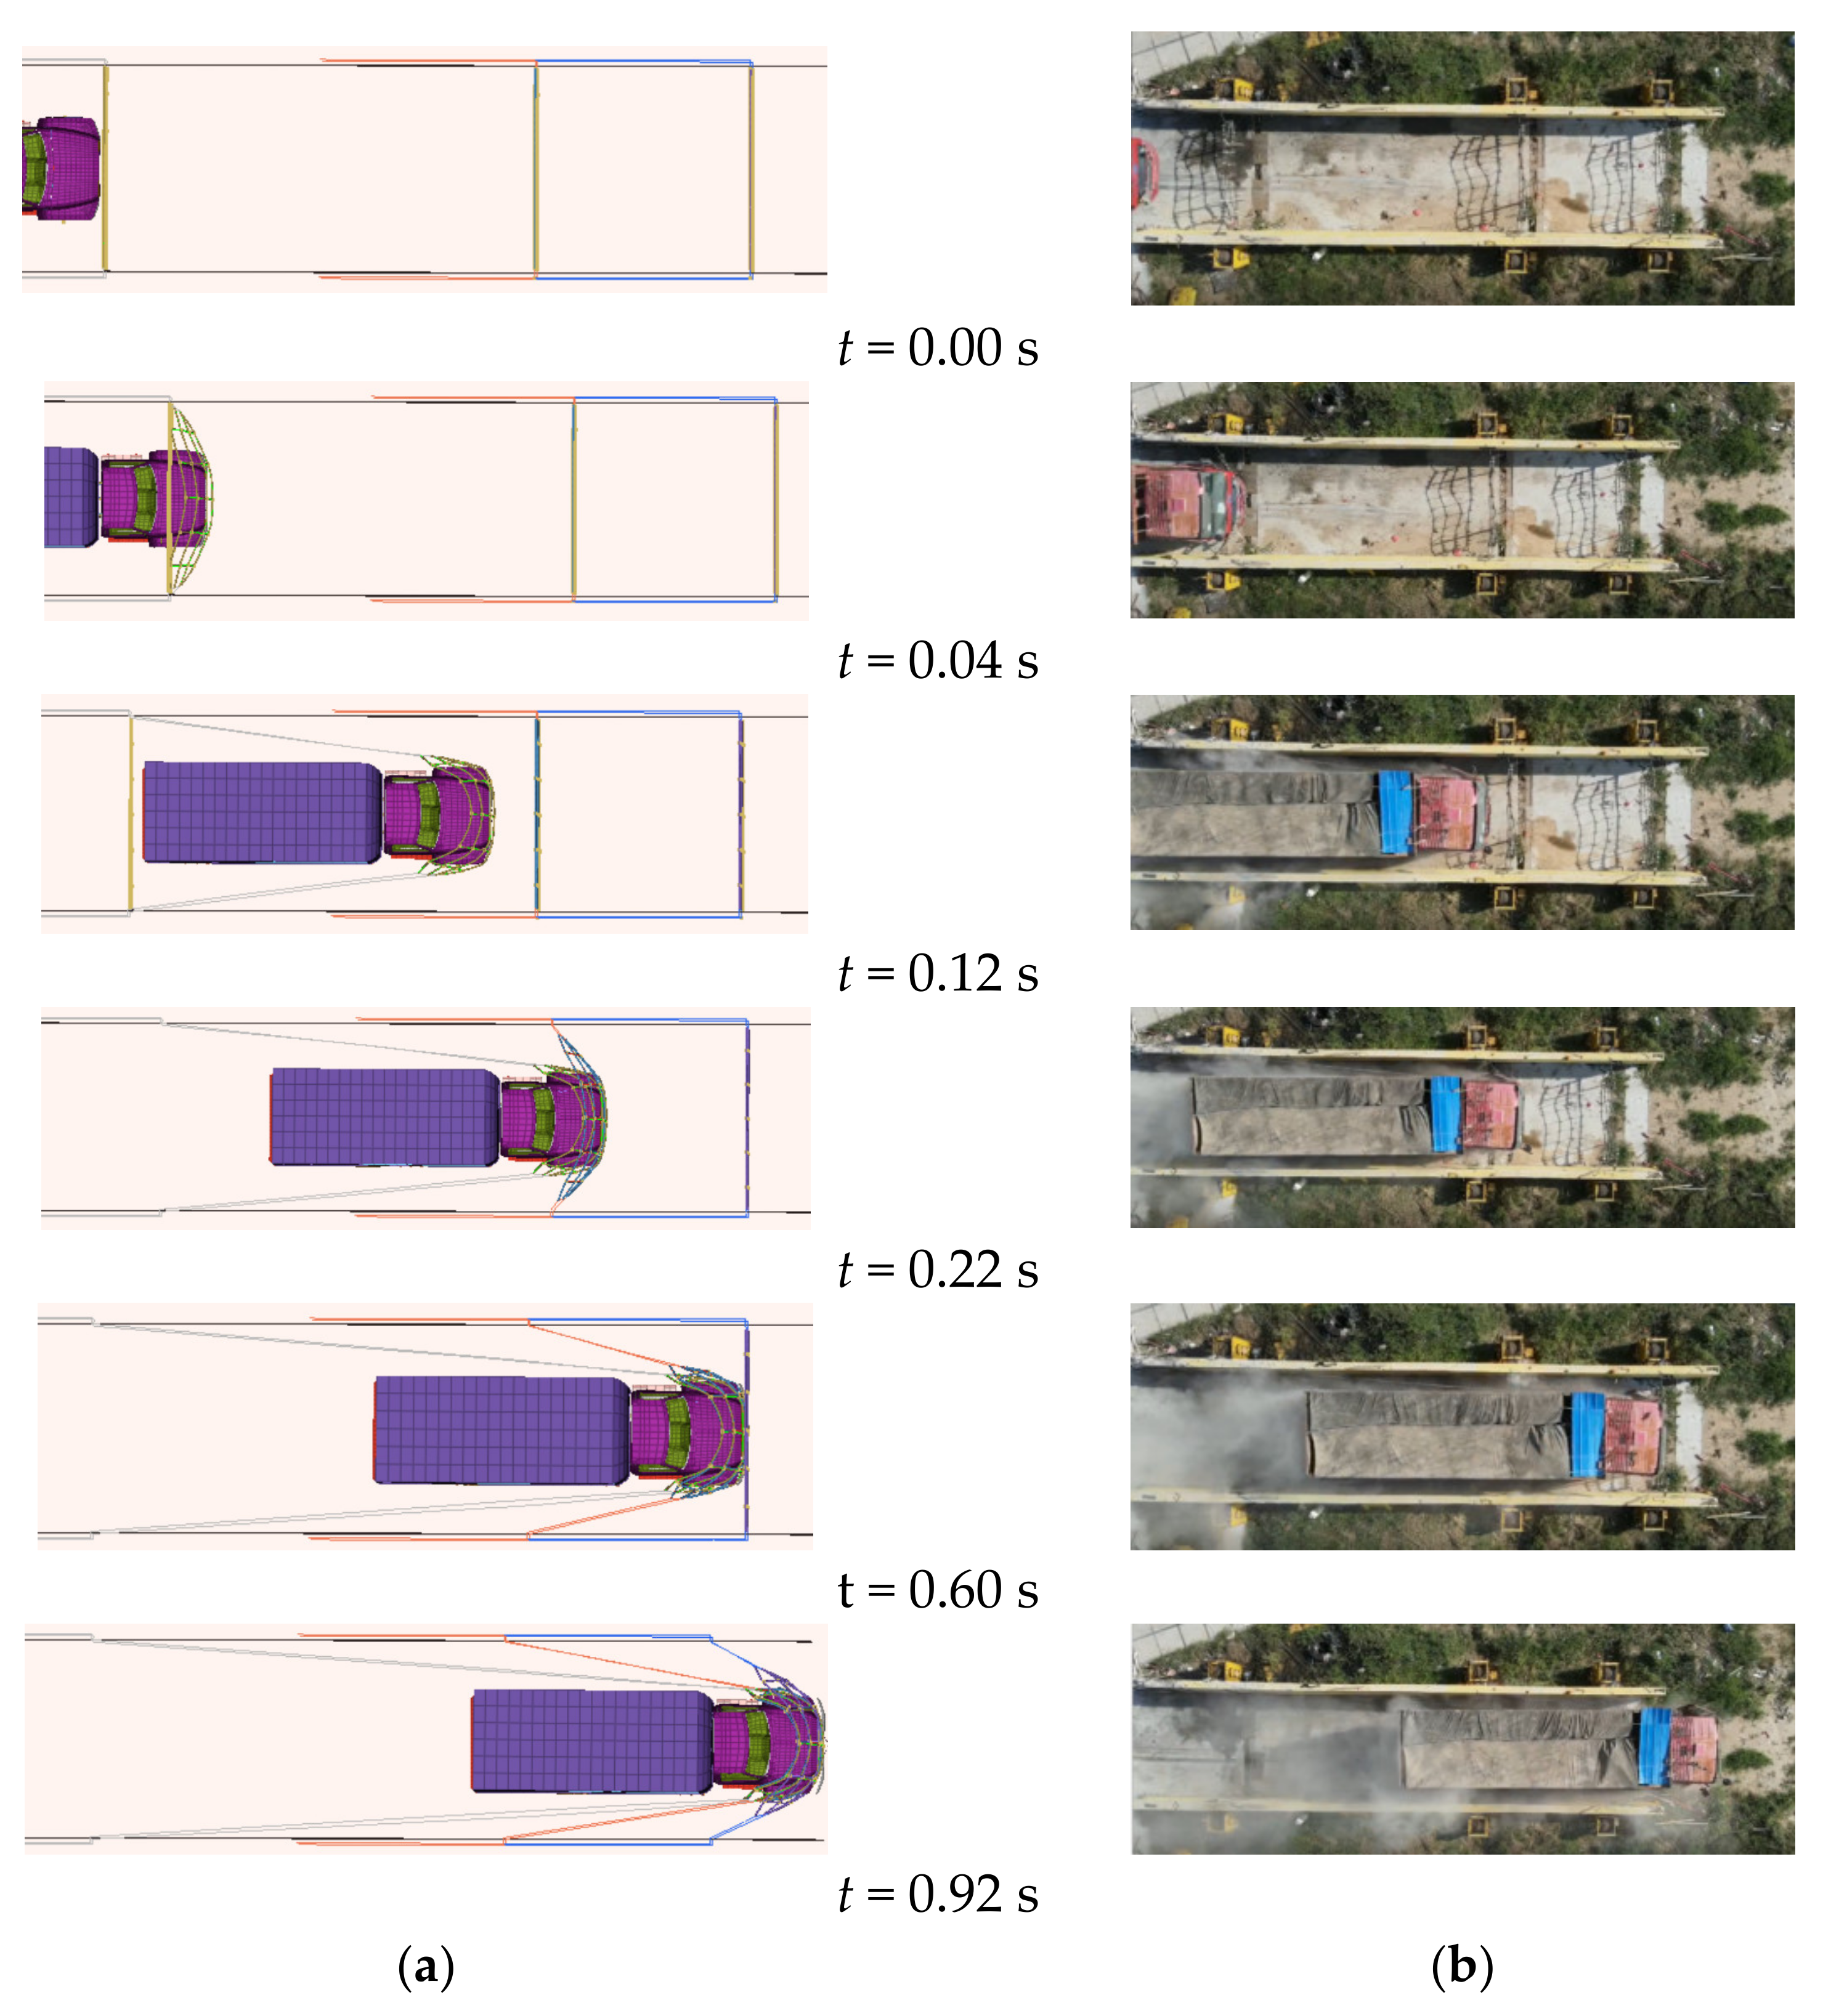
The low-speed stopping process of the F800 with 3 arresting nets is shown in
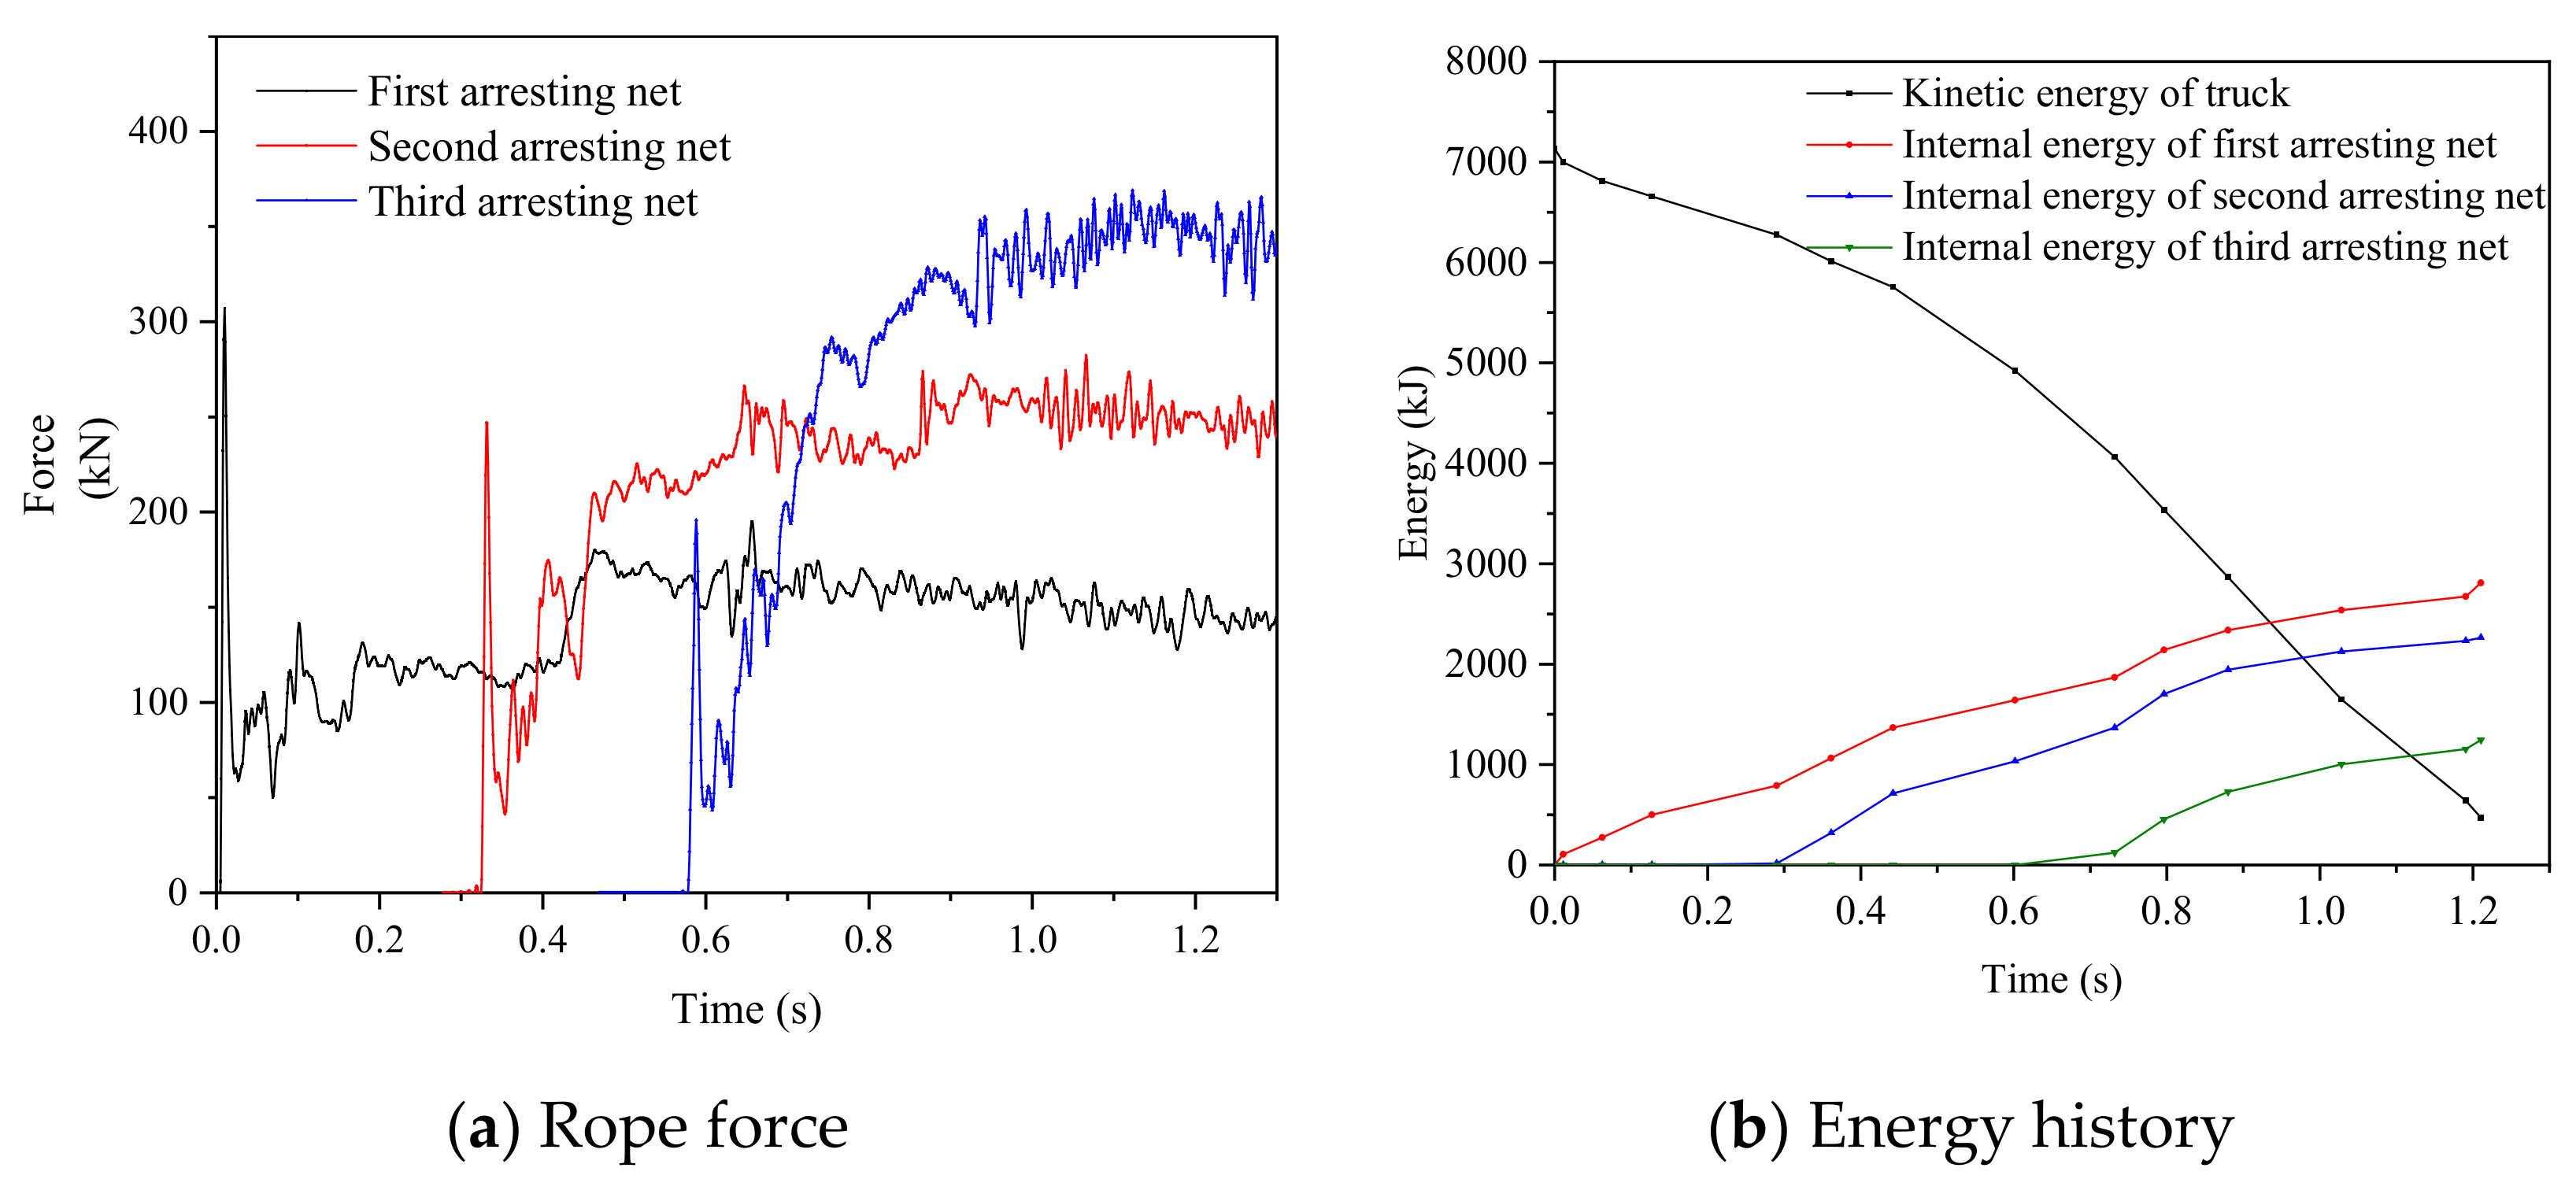
Figure 9, and the time histories of the rope force and energy in the vehicle barrier protective system at 60 km/h are shown in
Figure 10. When the truck impacted the barrier system, the first arresting net took the lead and consumed the kinetic energy of the vehicle through its internal energy increase (i.e., deformation elongation). When the time was approximately 0.2 s, the second arresting net started to play a role; at this point, the first arresting net could continue to extend, thus realizing double interception of the runaway vehicle. When the time reached 0.6 s, the third net started to intercept, while the first 2 nets still continued to elongate, thus playing a concerted role in interception until the vehicle had been successfully intercepted. Other studies on the change in rope force can be found in Qin et al. [
20], Yan et al. [
21], and Ma et al. [
22]. Unfortunately, the acceleration reached 417 m/s
2, far beyond the maximum acceleration suitable for human limits. Therefore, for the high-speed impact of heavy trucks, there was no use in arranging additional arresting nets, and the simulation analysis was not continued. More specifically, the excessive kinetic energy caused by the high-speed overweight vehicle would still likely cause irreversible damage to the human body at the moment of contact with the protective system. It is worth noting that the low-speed, heavy vehicle still maintained an upright position after impacting and kept contact with the barrier until its velocity decreased. In addition, for heavy trucks with mass less than 49 t (i.e., 20 t and 30 t), protective system simulation of 3 arresting nets was carried out. The obtained results indicated that the designed protective system could play a good intercepting role, as the maximum acceleration was not more than 20 g in these cases.
3.4. Evaluation of Runaway Vehicle Interception under Different Collision Angles
Post-impact vehicular responses play an important role in assessing the potential risk of a protective barrier system. Considering that an actual out-of-control vehicle may not be able to hit the blocking system head-on, different angles of impact simulations need to be fully taken into account.
Figure 11 shows the vehicle redirection characteristics for different impact angles of 10°, 15°, and 20°. Similar to the frontal impact of the runaway vehicle, the vehicle remained upright after the collision at the 3 different impact angles; however, the body inclined during the impact. More specifically, when the runaway vehicle struck the first and second arresting nets, the vehicle’s center of gravity rose vertically, where the rear wheels could rise by up to 0.31 m, as demonstrated in
Figure 12. Afterwards, it was not until the runaway vehicle made contact with the third arresting net that the inclination angle was gradually reduced, and the vehicle eventually returned to its upright position. The reason for this may be that the kinetic energy of the runaway vehicle was still large when hit the rigid wall. When the vehicle body is about to roll over, the first arresting net plays a key role, producing a large interception acceleration and raising the center of gravity of the vehicle. It is not until the vehicle slows down that the third arresting net comes into play, restoring the original position of the vehicle’s center of gravity and successfully bringing the vehicle to a stop.
The time histories of the vehicular acceleration of the impacting truck are shown in
Figure 13a. It can be observed that the acceleration curve associated with the impacting angle 10° was much smoother than the other curves. This is because the vehicle’s center of gravity deflection height was minimal when the F800 was impacted at an angle of 10°. In contrast, the acceleration curve associated with the impacting angles of 15° and 20° obviously fluctuated during the collision process. When the vehicle impacted with the protective barrier system, the peak acceleration at the different impacting angles reached 205 m/s
2, 294 m/s
2, and 312 m/s
2, respectively, which all exceeded the recommended maximum acceleration. However, it is worth mentioning that the maximum acceleration under the 3 different impact angles was lower than the acceleration during the frontal impact (417 m/s
2). Although all of the above scenarios may cause severe injuries to the human body and the vehicle, the protective barrier system was more effective in reducing the risk of occupants under an oblique impact than a frontal impact. In addition, the different peak values of vehicular acceleration occurred at the time when the head, front wheel, and body of the pickup truck contacted the rigid wall, respectively.
5. Discussion
In summary, the simulation and experimental tests in this study basically accomplished three research goals. First, the proposed protection system was capable of stopping most runaway vehicles, except for extreme conditions (i.e., heavy vehicles at high speed). Finite element simulation software was used to optimize the design of the protective system, as well as to quantify the interception cable force of the protective system and the vehicle interception deceleration, which made it possible to match different interception protection systems to different vehicles. Second, although there were no real passengers in the tests, the data measured by the accelerometer reflected that the protective system can well-protect the safety of occupants in the vehicle, again except for extreme situations (i.e., heavy vehicles at high speed). Similar studies can be found in [
23,
24]. Although there was no dummy model, the acceleration sensor or deformation of the cabin can determine the injury situation of personnel. Third, the arresting cable could still be reused after interception, and no damage was made to the damper, which is convenient for subsequent large-scale promotion.
Further studies should include extending the experiment (i.e., different impact angles and more vehicle types), in order to probe the applicability of the protective barrier system. Although we carried out a lot of simulation in this aspect, real car impact tests are still relatively lacking. Similar real car impact tests [
25] have typically adopted frontal impact, without considering the impact angle. For actual road runaway vehicles, although the impact angle specified in the specification is 20° [
3], the actual impact angle may vary and future research should also evaluate the deformation, reuse, and interception effect of the protective system under different angles. It is worth mentioning that the case of eccentric impact between the vehicle and the arresting system also needs to be considered [
26]. In addition, some extreme cases (e.g., overweight high-speed trucks) also need to be considered. Achieving successful interception and ensuring the safety of passengers in the vehicle has become an urgent problem to be solved by subsequent scholars.
Notably, the computational process of the simulation was very slow due to the complexity of the vehicle model. Therefore, subsequent simplification of the models can be considered in order to shorten the computation time based on the guaranteed test results [
26,
27].


