Abstract
In addition to the fact that the “ideal” fat mimetic should have all functional characteristics of fat, it is preferable to be from natural sources. Dietary fibers from different natural sources have large potential for fat mimetic roles in low-energy food products. This work observes the functional characteristics of wheat-fiber-based fat mimetics (microstructure, rheological and textural properties), as well as the influence of addition of small molecules of additives, which are usually necessary during the production of food products. Different concentrations of fat mimetics were analyzed (from 1–10% of fibers) alone and also in combination with a mixture of additives (sodium ascorbate, trisodium citrate and sodium acetate). The concentration of hydrated wheat fibers above 3% formed viscoelastic gel structures with an antithixotropic type of Newtonian flow, with a domination of elastic properties (G′) and ability for partial recover. Firmness and consistency were also stable at higher fiber concentration (5–10%). Thus, these fat mimetics have high ability to imitate fat functional properties and to provide the role of continuous phase in food systems. The application of food additives significantly reduced all observed properties of wheat fibers’ fat mimetics by disturbing the proper hydration process during gel formation and crosslinking of the three-dimensional structure of fat mimetics.
1. Introduction
The application of fat substitutes to produce low-energy food products leads to a significant problem, which is related to the satisfactory quality of the final product. The newly created low-energy food products with their rheological, sensory, physical, textural and microbiological properties must fully correspond to the full-fat food products. The applied fat replacer in a fat-reduced product has the role of imitating the various functions of fat. Considering that, it is necessary to find the agreement between the viscosity of these products, then the size and distribution of particle sizes in the system and the balance between the characteristics of the system in order to achieve the appropriate mouthfeel and sensory properties of the low-energy product [1]. Currently, there is no “ideal” fat replacer that can individually replace all the sensory and functional characteristics of fat. Therefore, a combination of fat replacer is often used in order to achieve the desired product quality [2]. The structure of fat replacers may include gums, pectin, dietary fibers (cellulose, hemicellulose, etc.), whose main sources are usually plants, cereals and their seeds. By stabilizing substantial quantities of water in a gel-like matrix, this group of fat replacers mimics some of the textural and functional characteristics of fat [2,3]. Important technological characteristics of dietary fibers that determine the possibilities of their application are: WHC(water-holding capacity), fat-binding capacity, chelating capacity, viscosity, gel-forming ability and influence on the texture of food products [4]. Other technological properties of the fibers are to control the crystallization of sugar and modify the aroma. Their important feature is that they prevent deformation and shrinkage of restructured products during cooking. Some have antioxidant properties. They are effective for quickly rancid products during cooling and freezing [4].
Natural sources of dietary fibers for fat replacers are always welcome and various raw materials can be used, such as soy, oats, sugar beets, wheat, peas, nuts and others [5,6]. Natural derivation of dietary fibers provides a continuous source, as well as a possibility for the utilization of different byproducts available in the food industry, such as cereal, legume cakes, oilseed cakes, bran, husk, trope, and generally, plant byproducts [7,8,9]. In addition to adequate technological properties, fiber-based fat replacers also have a positive effect on health, such as β-glycan and inulin, usually present in the composition of fibers, which reduce the level of cholesterol in the blood. According to the American Nutrition Association, the recommended intake of dietary fiber for adults is 25–30 g/day or 13 g/1000 Kcal, and the ratio of insoluble fiber to soluble fiber should be 3:1. In Europe, the recommended values are around 20 g/day per person, and in developing countries 60–120 g/day [10,11,12].
It is important to know the properties of the fat replacer, as well as the way it affects the properties of the food product in which it is used because the same fat replacer can be suitable for one type of product, but adversely affect the properties of another [13,14]. In order to imitate the physical and functional characteristics of fat, the manipulation of rheological properties plays a key role in the application of a suitable fat replacer [1]. Additionally, in many food products with reduced energy value, the basic difference compared to full-fat products of the same type is in the texture. Thus, fat replacers of biopolymeric origin are suitable for use in semi-solid and spreadable products because they provide the desired texture with their cross-linked structure [2,15,16]. The formulation of a new product, in addition to defining adequate constituent components and their quantity, also requires determining the sequence of adding raw materials in order to achieve the desired product quality. Certain raw materials achieve their functional properties only in the appropriate stages of production, while some components can reduce the functional properties of other constituent components [17].
The aim of this work was to investigate from a microstructural, rheological and textural aspect the fat mimetic that is mainly based on wheat fibers (70%) and maltodextrin (30%). This determination will provide insight to the functional properties of this fat mimetic of natural origin. Additionally, the influence of the addition of additives on the functional properties of wheat fiber fat mimetic was analyzed because the additives are usually necessary during the production of food products. That will show the functional ability of the analyzed fat mimetic, its interaction with other components and areas, and possibilities of their application in low-fat food products. Additionally, a secondary objective of this work is to determine the sequence of addition of raw materials during the realization of technological properties of wheat-fiber-based fat mimetics.
2. Materials and Methods
2.1. Materials
During the experimental part of this work, fat mimetic Vitacel WFG HS73 was used, produced by J. Rettenmaier & Sönhe GMBH+CO, Rosenberg, Germany. This fat mimetic consists of 70% of colloid wheat fibers and 30% of maltodextrin. It is a powder of micro-fibrillated wheat from wheat byproducts, co-processed with maltodextrin to aid dispersing in water medium.
Antimicrobial and antioxidant unwanted change of food products can be prevented by applying a mixture of additives consisting of the sodium salt of ascorbic acid E 301 (0.150 g), trisodium citrate E 331 (0.150 g) and sodium acetate E 262 (0.200 g) per 100 g of product [18,19]. Thus, a mixture of these additives was used.
Another used material was distilled water.
2.2. Microstructure Analysis of Fat Mimetics Fibers
The characteristics of microstructure were observed using a scanning electron microscope JSM-6460LV to 25 kV (SEM, JEOL Ltd., Tokyo, Japan). The samples were fixed to aluminum carriers and coated with a thin layer of gold over the surface, after which they were observed with at different magnifications 500–5000×.
2.3. Preparation of Wheat Fiber Fat Mimetics
The fat mimetic powder was dispersed in distilled water under high shear of 6500 min−1 for 4 min by a homogenizer with the dispersing tool S25N–18G (Ultraturax T–25, IKA, Werke GmbH & Co., Staufen, Germany). Five different concentrations of wheat fiber fat mimetic were prepared: 1%, 3%, 5%, 7% and 10%. The mixture of fat mimetics with the same fiber concentrations and added additives were additionally prepared. The dispersed systems were stored at 4 °C for 24 h to form a gel structure.
2.4. Particle Size Determination
The particle size distribution of the fat mimetics was determined by laser light diffraction method. The measurement was performed using Mastersizer 2000 (Malvern Instruments, Malvern, UK), equipped with Hydro 2000G dispersing unit and adequate software package.
2.5. Rheological Determination
The rheological behavior of the observed fat mimetics was defined by flow characteristics, dynamic oscillatory measurements and creep and recovery analysis. All measurements were performed using rotational viscometer HAAKE RheoStress RS600 (Thermo Electron Corporation, Karlsruhe, Germany) with plate–plate sensor PP60 Ti (plate diameter was 60 mm and gap 1 mm) [20].
Flow properties were described by the hysteresis loop method as dependence of shear stress (τ) over shear rate (γ). The samples were exposed for 3 min to shear rate ramped up from 0 to 100 s−1, then the shear rate was constant at 100 s−1 in the following 3 min and finally ramped down to 0 s−1 for 3 min. All measurements were conducted at 25 ± 0.1 °C [21].
Dynamic oscillatory measurements defined the elastic (storage) modulus (G′) and viscous (loss) modulus (G″) in the range of linear viscoelastic regime (LVE), where there is no destruction of the system and the values of applied shear stress depend on the strength of the system structure. The moduli were observed during increased frequency from 1 to 10 Hz and at constant shear stress of 5 Pa in the linear viscoelastic regime. The results were expressed as value tan δ = G″/G′ [22].
Creep and recovery test provided a determination of the viscoelastic response of the samples at a constant stress, and after removing the stress, accordingly, the compliance (J) of the samples. The creep and recovery tests were performed in the LVE regime in which the deformation amplitude was proportional to applied stress amplitude. The sample was exposed to constant stress (σ = 5 Pa) during creep time of 150 s. The recovery time after removing the stress was 450 s. Obtained data were fitted to Burger’s model, which is presented by Equation (1) for creep phase:
and by Equation (2) for recovery phase:
where the value J0 is the instantaneous compliance, J1 is retarded (viscoelastic) compliance, Jmax is maximum compliance, λ is mean retardation time and η0 is Newtonian viscosity. The part of the creep and recovery curve that describes the recovery of the system can also be described by contribution of elastic (Je) and viscous (Jv) deformations in the maximum compliance (Jmax) of the system. There is the amount of relative elastic deformations Je/Jmax (%) (part of the structure that recovered after removing the stress) and the amount of relative viscous deformation Jv/Jmax (%) (the part of the structure that was not recovered after removing the stress, the amount of lost deformation) [23,24,25,26,27].
2.6. Textural Determination
The textural properties of viscous liquid or semi-solid gel-like systems are commonly determined by methods of reverse or direct extrusion in order to define the firmness and consistency [28,29]. Textural characteristics were determined using the texture analyzer TA.HD Plus, Stable Micro Systems. The manufacturer’s specified method of Comparison of the consistencies by back extrusion was applied using the back extrusion cell (A/BE) accessory, which contains a base for positioning the sample container, sample containers with an internal diameter of 50 mm, a compression disk with a diameter of 35 mm and a disk holder with a length of 150 mm. The method was performed with the following parameters: speed during analysis 1 mm/s, distance 30 mm, contact force 5 g, measuring cell 5 kg. Using this method, the penetration force through the gel sample and subsequent return through the sample was simulated defining physical and viscous properties [30]. Defined textural parameters of fat mimetic are firmness, consistency, cohesiveness and index of viscosity.
2.7. Statistical Analysis
Measurements of all determined rheological parameters were performed in triplicate, and for textural parameters, five times. The obtained results were statistically analyzed by ANOVA statistical method. The mean values were compared by one-factor analysis of variance with post hoc test by Duncan’s test at 5% level of significance, using software Statistica 13.3 (TIBCO Software Inc., Paolo Alto, CA, USA, 2016).
3. Results and Discussion
3.1. Microstructural Characteristics of Wheat Fiber Fat Mimetics
The microstructural characteristics of WFG fibers fat mimetics observed by scanning electron microscopy are presented in Figure 1. Wheat fiber fat mimetics include 70% of colloidal wheat fibers and 30% of maltodextrin. Obviously, the spatial organization of WFG HS73 fibers tends towards a curled (globular) fiber structure (Figure 1a), where between long chains of wheat fibers the small maltodextrin molecules are fitted (Figure 1b,c).

Figure 1.
Microstructural and spatial organization of wheat fibers WFG HS73; Magnification (a) 500×, (b,c) 2000×.
3.2. Particle Size Distribution of Wheat Fiber Fat Mimetic
The particle size distribution of the WFG fat mimetic is specific because it does not depend on the wheat fibers’ concentration in the system (Figure 2). The width of particle size distribution of the wheat fiber fat mimetic is uniform (0.72–0.74), and for the observed fibers’ concentration of 1–10%, the value is in the range from 2.23–2.28 (Table 1). Volume weighted mean (D[4,3]) is in a narrow range from 86.60 to 92.31 μm.; a total of 90% of the volume distribution (d (0.9)) is below the value of ~180 μm and the median volume diameter d (0.5) pointed that 50% of the particles’ sizes are in the range from 72.06 to 73.91 μm for all observed wheat fiber fat mimetics. Small particles (d (0.1) ≈ 16 μm) are distributed in the interspace.
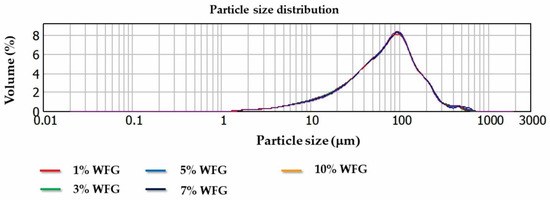
Figure 2.
Particle size distribution of wheat fiber fat mimetic with different fiber concentrations.

Table 1.
Mean particles diameter and particle size distribution of WFG fat mimetic with different fiber concentrations.
3.3. Rheological Properties of Wheat Fiber Fat Mimetics
Weakly gelling form of wheat fiber fat mimetic was obtained at wheat fiber concentration of 1%. Only at fiber concentration of 3% and higher were stable gel systems formed (Figure 3).
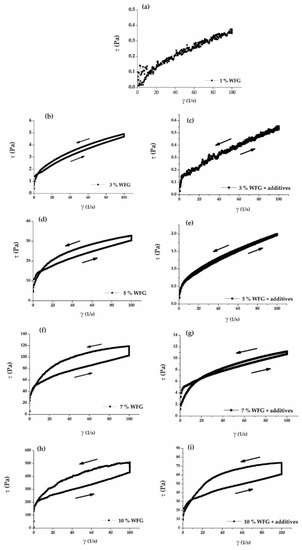
Figure 3.
Rheological flow curves of WFG fat mimetics at different fibers concentration (a,b,d,f,h) without additives and (c,e,g,i) with additives. The arrows mark ascending and descending direction of flow curves.
Flow curves of WFG gel concentrated above 1% are specific by antithixotropic behavior during shear stress (Figure 3). The antithixotropic type of flow is a non-Newtonian flow, the opposite of thixotropic behavior of dispersed systems, which is reflected by an increase in shear stress or viscosity over time. This behavior is caused by the establishment of certain internal structure by bonds that are released during shearing and during the initial limited destruction of the structure [31,32]. Inside globularly organized structures of WFG fibers, shown at Figure 1, the spherical globules tend to unroll under the shearing stress, which led to the linear orientation of the fibers, where the formation of secondary bonds was enabled.
Antithixotropic flow behavior is manifested as a negative value of the area of the hysteresis loop, which indicates that the descending curve is above the ascending curve at the diagram of the dependence of shear stress over shear rates [33]. With the increasing concentration of WFG fibers, the absolute value of the area of the hysteresis loop also increased. This behavior was expected because the higher level of wheat fibers in the system provided more fiber interaction and increased the degree of their networking during gel formation.
The inclusion of small molecules of additives led to competition between functional groups, and disturbed the wheat fibers’ interaction. Thus, a decrease in the absolute values of the hysteresis loop area was noticed for the fat mimetics with additives compared to the WFG fat mimetics without additives, at the same fiber concentration (Figure 4).
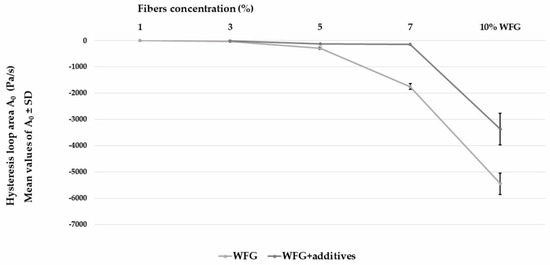
Figure 4.
Hysteresis loop area of flow curves for WFG fat mimetics with and without additives.
The flow model described by the Herschel–Bulkley equation:
was applied to obtained curves [22,34], where τ is shear stress (Pa), is shear rate (1/s), τ0 is yield stress (Pa), Κ is consistency coefficient (Pasn) i n je dimensionless flow index [35]. All flow curves of WFG gels corresponded to the Herschel–Bulkley model of flow with high coefficients of determination (r), both in the ascending and descending part of the curves. Rheological parameters relevant for flow determination of these gels are shown in Table 2.

Table 2.
Rheological parameters for flow curves of wheat fibers fat mimetic without and with additives.
Based on the consistency coefficient K, an increase in the viscosity of the systems was noticed with an increase in the concentration of WFG fibers, as it was expected. While an increase in the value of the yield stress, τ0, indicated an increase in the initial flow resistance of the system. The initial flow resistance also describes the degree of arrangement in the system and is conditioned by mechanical (frictional) interactions of particles [36]. The globular organization of WFG fibers in an aqueous medium with uniform size distribution contributed to the increase in the yield stress with increasing wheat fibers concentration. However, these rheological parameters statistically significantly decreased (p < 0.05) with the application of additives. A flow curve of 1% wheat fiber gel could not be registered by the sensor element because the viscosity was too low. The values of yield stress decreased for 55.61–93.49% for WFG fat mimetics with additives compared with gels without additives at the same fiber concentrations.
Specifically, the flow index, n, decreased with the increasing fiber concentration, which means that non-Newtonian character of the system increase [37]. By the addition of the additives in the structure of the wheat fiber gel, the non-Newtonian character decreased and the observed fat mimetics had a weaker gel structure.
Viscoelastic Properties
The viscoelastic behavior of the wheat fiber fat mimetics is defined by dynamic oscillatory measurements and creep and recovery analysis. Both types of measurements were performed in a linear viscoelastic regime (LVE) at stress values that do not act destructively on the structure of the system. The dependence of elastic (storage) modulus G′ and viscous (loss) modulus G″ on frequency is characteristic for all observed systems by the increase in the value of these moduli with an increase in frequency. That is characteristic of viscoelastic gel systems [27]. Changes of modulus G′ and G″ with the increasing frequency of certain disperse systems of wheat fiber fat mimetics are presented at Figure 5.
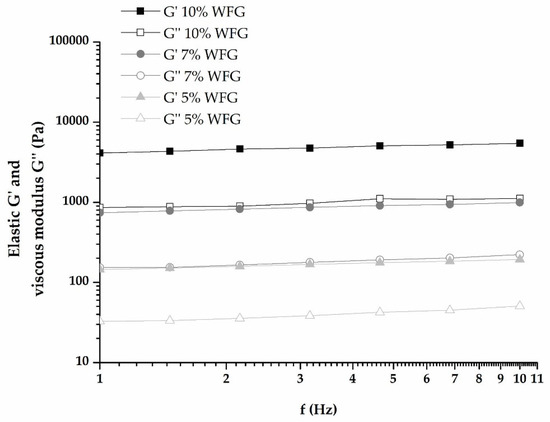
Figure 5.
Elastic and viscous modulus (G′ and G″) of wheat fibers fat mimetic with a stable gel structure.
An additional parameter for describing the viscoelastic nature of the system is tan δ, which is defined as the ratio G″/G′ and is a measure of the relative magnitude of the viscous and elastic parts of the system. The nature of the system is more elastic the lower the values of tan δ are [38]. The values of the tan δ viscoelastic parameter depend on the wheat fibers’ concentration and on the addition of additives, which are shown at Figure 6.
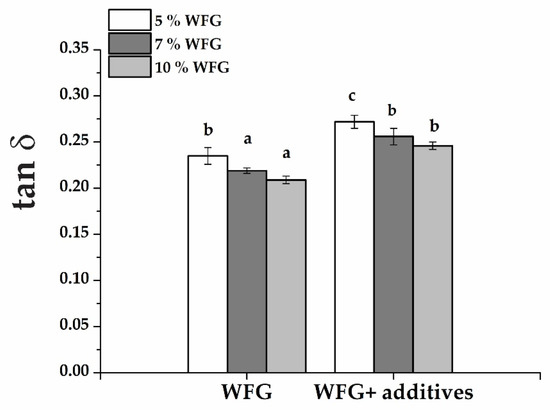
Figure 6.
Mean values of tan δ ± SD for wheat fibers fat mimetics with and without additives. Bar’s values with the same letter (a–c) are not significantly different (p > 0.05) according to Duncan’s test.
The ratio between elastic and viscous bonds (tan δ) in these systems was less than 1, which pointed to the dominance of the elastic modulus as a consequence of hydrodynamic forces and particle interaction [39]. With an increase in the volume fraction of particles; accordingly, in the solid phase of the gel system, there is a marked increase in the modulus of elasticity and its dominance [40]. A higher concentration of wheat fibers in the system allows greater intermolecular interaction, contributes to cross-linking, increasing the amount of elastic components in the system and indicates the formation of stable cross-linked gel structures [41].
The application of additives during the hydration process of the wheat fiber fat mimetic caused a statistically significant (p < 0.05) increase in the values of tan δ for gels with the same wheat fiber concentrations, and reduced the elastic nature of fat mimetics.
The viscoelastic properties of observed fat mimetics under the influence of constant stress are determined by creep and recovery curves. Under the influence of constant stress, the intermolecular bonds in the sample are stretched. The initial compliance (J0) is related to initial elastic deformations, and the subsequent compliance of the system (J1) to viscoelastic deformations. This phase is described by the first part of the creep curve. Creep phase is followed by a recovery phase in which there is no stress and during which the balance between intermolecular bonds is established; a so called equilibrium. During the recovery phase the system is partially recovered from the effect of stress. The resistance of viscoelastic materials to the constant stress is usually non-linear and the permanent deformation of these systems is usually smaller than the total deformations applied to the system due to their ability to recover a significant part of structures with stored energy [23,42]. Creep and recovery curves of wheat fiber fat mimetics shown in Figure 7 correspond to typical creep and recovery curves of viscoelastic systems. Obtained creep and recovery curves correspond to the equations of the Burger’s model with a high coefficient of determination, r = 0.9986 – 0.9997.
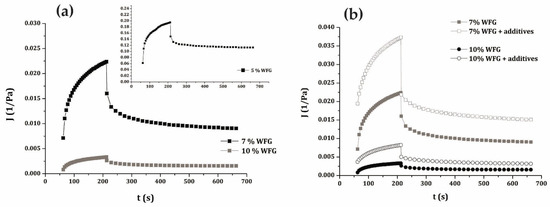
Figure 7.
Creep and recovery curves of wheat fibers fat mimetics (a) influenced by wheat fibers concentration and (b) influenced by additives addition.
Based on this, observed fat mimetics had some resistance to the applied constant stress and exhibited specific compliance. During the relaxation phase, they showed a significant recovery ability. Figure 7a shows that increased fiber concentration in fat mimetic reduced the compliance of the gel system, pointing to their higher viscosity. The structure of WFG fat mimetics with additives had higher values of compliance compared to the same fiber concentrations; accordingly, they are more susceptible to deformation than WFG fat mimetics without additives (Figure 7b).
This was additionally confirmed by the contribution of the elastic and viscous deformation in maximum compliance, shown in Figure 8. The addition of additives increased the amount of viscous lost deformation after the recovery phase at all observed fiber concentrations.
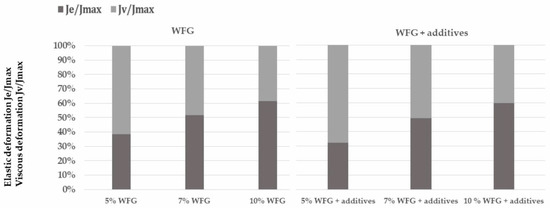
Figure 8.
Amount of elastic and viscous deformations of WFG fat mimetics in dependence of fibers concentration and influence of additives.
3.4. Textural Properties of Wheat Fiber Fat Mimetics
Analyses of the viscoelastic properties of the gel structure were performed at small deformations and in conditions where the structure was not damaged. Industrial processes, as well as the application of gel systems such as wheat fiber fat mimetics, often require the application of high stress. Therefore, the large deformation tests are very useful in characterizing gel systems, especially in combination with fundamental rheological analysis. Large deformation analysis includes textural methods and is based on the deformation of the sample to the point of permanent structural change [28]. The textural characteristics of wheat fiber fat mimetics were investigated by the reverse extrusion method. Texture parameters, which indicate the susceptibility of the investigated systems to large deformations, are shown in Table 3.

Table 3.
Textural parameters of wheat fiber fat mimetics without and with additives.
All presented textural parameters of the systems with additives are reduced compared to the texture parameters of fat mimetics without additives. The measurements of systems at a low fibers content (1% and 3% of fibers) with additives were not achievable due to the extremely weak and liquid consistency of those systems.
The consistency of the fat mimetics with additives decreased in the range for 24.66 up to 44.42% compared to WFG fat mimetics without additives. A decrease in firmness and consistency led to a decrease in the cohesiveness and viscosity of the gel systems with additives. Higher fibers concentrations (7 and 10%) contributed to the texture of fat mimetics; thus, reduced the negative effect of additives in smaller amounts.
The presence of small molecules of additives, also of a hydrophilic nature, interferes with hydration and physically prevents the cross-linking of fibers [43]. The structural interactions in the mixture of wheat fiber fat mimetics and additives affected the rheological and functional properties of the fat mimetic gel, reducing the degree of cross-linking and stability of the formed structures.
4. Conclusions
This analysis of fiber fat mimetic, based on mainly wheat fibers (70%) and on smaller amounts of maltodextrin, determined observed WFG fat mimetic as an antithixotropic gel system with a non-Newtonian type of flow from the rheological aspect of determination. Viscoelastic properties of this fat mimetic are exhibited at fiber concentrations above 3%. In those gel systems the dominance of the elastic component is highly manifested and the observed fat mimetic exhibited adequate resistance to applied stress and a good ability to recover after the stress. The good flow properties of highly concentrated WFG gels are partly achieved by the specific globular spatial structure of wheat fibers and by the fine mainly uniform particle size distribution.
Textural characteristics of WFG fat mimetic increased with the fiber concentration and confirmed less susceptibility to large deformation conditions at higher fiber concentrations.
Thus, these highly concentrated gel systems showed adequate hydration and gel-forming ability, good flow ability, good compliance with small deformation, and sufficient resistance to large deformation. All these properties of WFG fat mimetics at a concentration above 3% provide adequate functional properties of fat mimetic and an ability to achieve the role of continuous phase in food products such as fat.
The application of additives, which are small molecules, had negative influence on rheological and textural properties of WFG fat mimetics. The polar hydrophilic molecules of additives compete with hydrophilic wheat fibers during hydration, and thus, disturb their adequate networking. That was reflected by the significant reduction in all observed functional properties of WFG fat mimetic. The obtained results indicate that the application of additives in the mixture with wheat fibers fat mimetics is undesirable. The additives cannot be applied before or during the formation of the fat mimetic gel to obtain a stable cross-linked gel with adequate rheological, textural and functional properties.
The possible application of wheat fiber fat mimetics in the development of low or no-fat food products is in accordance with the increasing demand for utilization of industry byproducts and sustainable food production, considering that the wheat fibers originate from wheat byproducts (wheat plant, wheat bran, husk, etc.). The behavior of wheat fiber fat mimetics in real food systems should be examined trough the rheological, textural and sensory analysis during application in certain low fat food products in some further experimental work.
Author Contributions
Conceptualization: I.N., B.P., I.L. and J.P.; methodology: I.N., L.D., I.L. and J.P.; D.Š.-S. software: I.N.; formal analysis: Z.Š., L.D. and D.Š.-S.; investigation: I.N., J.P. and I.L.; data curation: A.J. and A.L.; writing—original draft preparation: I.N., B.P., I.L. and J.P.; writing—review and editing: B.P., D.Š. and Z.Š.; visualization: I.N., A.J. and A.L.; supervision: B.P. and D.Š.; funding acquisition: B.P. and D.Š. All authors have read and agreed to the published version of the manuscript.
Funding
This research received no external funding.
Institutional Review Board Statement
Not applicable.
Informed Consent Statement
Not applicable.
Data Availability Statement
Not applicable.
Acknowledgments
This research was supported by the Ministry of Agriculture, Forestry and Water Management, Republic of Serbia, by the project named “Creation of new functional food products by knowledge transfer between scientific and research organizations and small food producers” (project number: 680–00–00099/4/2022–02) and by the Ministry of Education, Science and Technological Development, Republic of Serbia, Program (number: 451-03-68/2022-14/200134).
Conflicts of Interest
The authors declare no conflict of interest.
References
- Jones, A.S. Physical, Chemical and Sensory Aspects of Fat Replacement. In Handbook of Fat Replacers; Roller, S., Jones, S., Eds.; CRC Press: Boca Raton, NY, USA, 1996; Chapter 4. [Google Scholar]
- Cho, S.S.; Prosky, L. Application of complex carbohydrates to food products fat mimetics. In Complex Carbohydrates in Food; Cho, S., Prosky, L., Dreher, M., Eds.; Marcel Dekker Inc.: New York, NY, USA, 1999; pp. 411–429. [Google Scholar]
- Omayma, E.S.; Youssef, M.M. Fat replacers and their applications in food products: A review. J. Food Sci. Tech. 2007, 4, 29–44. [Google Scholar]
- Borderias, A.J.; Sanchez–Alonso, I.; Perez–Mateos, M. New Applications of Fibres in Foods: Addition to Fishery products. Trends Food Sci. Tech. 2005, 16, 458–465. [Google Scholar] [CrossRef]
- Vatanasuchart, N.; Stonsaovapak, S. Oatrim–5 as Fat Substitute in Low Calorie Salad Cream: Nutritional and Microbiological Qualities. Agric. Nat. Resour. 2000, 34, 500–509. [Google Scholar]
- Warner, K.; Inglett, G.E. Flavor and Texture Characteristics of Foods Containing Z-Trim Corn and Oat Fibers as Fat and Flour Replacers. CFW 1997, 42, 821–825. [Google Scholar]
- Yilmaz, I.; Daghoglu, O. The Effect of Replacing Fat with Oat Bran on Fatty Acid Composition and Physicochemical Properties of Meatballs. Meat Sci. 2003, 65, 819–823. [Google Scholar] [CrossRef]
- Choi, Y.S. Characteristics of Low-Fat Meat Emulsion Systems with Pork Fat Replaced by Vegetable Oils and Rice Bran Fiber. Meat Sci. 2009, 82, 266–271. [Google Scholar] [CrossRef]
- Yilmaz, I. Effects of Rye Bran on Fatty Acid Composition and Quality Characteristics of Low-Fat Meatballs. Meat Sci. 2004, 67, 245–249. [Google Scholar] [CrossRef]
- Kalinga, D.; Mishra, K. Rheological and Physical Properties of Low-Fat Cakes Produced by Addition of Cereal β-Glucan Concentrates. J. Food Process Preserv. 2009, 33, 384–400. [Google Scholar] [CrossRef]
- Carreras, B.E.; Belloso, M.O. Influence of the Addition of Peach Dietary Fiber in Composition, Physical Properties and Acceptability of Reduced-Fat Muffins. Food Sci. Techol. Int. 2001, 7, 425–431. [Google Scholar] [CrossRef]
- Seker, I.T.; Gokbulut, I.; Ozturk, S. Utilization of Apricot Kernel Flour as Fat Replacer in Cookies. J. Food Process Preserv. 2010, 34, 15–26. [Google Scholar] [CrossRef]
- Akoh, C.C. Fat replacers. Food Technol.–Chic. 1998, 52, 47–53. [Google Scholar]
- Ognen, C.F.; Darie, N.; Ognean, M. Fat Replacers. J. Agroaliment. Process Technol. 2006, 12, 433–442. [Google Scholar]
- BeMiller, J.N. Carbohydrate Chemistry for Food Scientists; AACC International: Eagan, MN, USA, 2007; pp. 222–243. [Google Scholar]
- Humphreys, W.M. Fiber–Based Fat Mimetics: Microcrystalline Cellulose. In Handbook of Fat Replacers; Chapter 7A; Roller, S., Jones, S., Eds.; CRC Press: New York, NY, USA; Boca Raton, FA, USA, 1996. [Google Scholar]
- Avramenko, V.; Kraslawski, A. Product design: Food product formulation. In Case Based Design: Applications in Process Engineering; Springer: Berlin/Heidelberg, Germany, 2008; pp. 109–116. [Google Scholar] [CrossRef]
- Konzervansi, Uvod i Klasifikacija. Available online: https://www.tehnologijahrane.com/enciklopedija/konzervansi-uvod-i-podela (accessed on 2 December 2022).
- Available online: https://www.paragraf.rs/propisi/pravilnik-o-prehrambenim-aditivima-republike-srbije.html (accessed on 29 November 2022).
- Rudrarajua, V.S.; Wyandtb, C.M. Rheological characterization of Microcrystalline Cellulose/Sodiumcarboxymethyl cellulose hydrogels using a controlled stress rheometer: Part I. Int. J. Pharmaceut. 2005, 292, 53–61. [Google Scholar] [CrossRef] [PubMed]
- Nikolić, I.; Dokić, L.; Rakić, D.; Tomović, V.; Maravić, N.; Vidosavljević, S.; Šereš, Z.; Šoronja-Simović, D. The role of two types of continuous phases based on cellulose during textural, color, and sensory characterization of novel food spread with pumpkin seed flour. J. Food Process Preserv. 2018, 42, e13684. [Google Scholar] [CrossRef]
- Mezger, T. The Rheology Handbook: For Users of Rotational and Oscillation Rheometers; Vincentz Verlag: Hanover, Germany, 2002. [Google Scholar]
- Steffe, F.J. Rheological methods in Food Process Engineering, 2nd ed.; Freeman Press: Dallas, TX, USA, 1996. [Google Scholar]
- Sozer, N. Rheological properties of rice pasta dough supplemented with proteins and gums. Food Hydrocoll. 2009, 23, 849–855. [Google Scholar] [CrossRef]
- Vithanage, C.R.; Grimson, M.J.; Smith, B.G. The effect of temperature on the rheology of butter, a spreadable blend and spreads. J. Texture Stud. 2009, 40, 346–369. [Google Scholar] [CrossRef]
- Lazaridou, A.; Biliaderis, C. Gluten–free doughs: Rheological properties, testing procedures–methods and potential problems. In Gluten–Free Food Science and Technology; Gallagher, E., Ed.; Blackwell Publishing Ltd.: Oxford, UK, 2009; pp. 52–83. [Google Scholar]
- Selaković, A.; Nikolić, I.; Dokić, L.; Šoronja-Simović, D.; Šimurina, O.; Zahorec, J.; Šereš, Z. Enhancing rheological performance of laminated dough with whole wheat flour by vital gluten addition. LWT-Food Sci. Technol. 2021, 138, 110604. [Google Scholar] [CrossRef]
- Angioloni, A.; Collar, C. Small and large deformation viscoelastic behaviour of selected fibre blends with gelling properties. Food Hydrocoll. 2009, 23, 742–748. [Google Scholar] [CrossRef]
- Bourne, M.C. Texture, Viscosity and Food. In Food Texture and Viscosity: Concept and Measurement; Chapter 1; Elsevier Science & Technology Books: Amsterdam, The Netherlands, 2002. [Google Scholar]
- TA.HD. Texture Analyser Product Specification; Stable Micro Systems, Ltd.: Godalming Surrey, UK; Vienna, Austria, 2004. [Google Scholar]
- Wang, B.; Wang, L.; Dong, L.; Zhou, Y.; Özkan, N. Shear–thickening properties of waxy maize starch dispersions. J. Food Eng. 2011, 107, 415–423. [Google Scholar] [CrossRef]
- Đaković, L. Koloidna Hemija; Tehnološki fakultet Novi Sad, Univerzitet u Novom Sadu: Novi Sad, Serbia, 1990. [Google Scholar]
- Ghannam, M.T.; Esmail, M.N. Rheological properties of carboxymethyl cellulose. J. Appl. Polym. Sci. 1997, 64, 289–301. [Google Scholar] [CrossRef]
- Luukkonen, P.; Newton, J.M.; Podczeck, F.; Yliruusi, J. Use of a capillary rheometer to evaluate the rheological properties of microcrystalline cellulose and silicified microcrystalline cellulose wet masses. Int. J. Pharm. 2001, 216, 147–157. [Google Scholar] [CrossRef] [PubMed]
- Maache–Rezzoug, Z.; Zarguili, I.; Loisel, C.; Doublier, J.-L. Study of DIC hydrothermal treatment effect on rheological properties of standard maize (SMS), waxy maize (WMS), wheat (WTS) and potato (PTS) starches. J. Food Eng. 2010, 99, 452–458. [Google Scholar] [CrossRef]
- Servais, C.; Jones, R.; Roberts, I. The influence of particle size distribution on the processing of food. J. Food Eng. 2002, 51, 201–208. [Google Scholar] [CrossRef]
- Dokić, L.; Dapčević, T.; Krstonošić, V.; Dokić, P.; Hadnađev, M. Rheological characterization of corn starch isolated by alkali method. Food Hydrocoll. 2010, 24, 172–177. [Google Scholar] [CrossRef]
- Tadros, T. Application of rheology for assessment and prediction of the long–term physical stability of emulsions. Adv. Colloid Interfac. 2004, 108–109, 227–258. [Google Scholar] [CrossRef] [PubMed]
- Tomić, J.; Škrobot, D.; Dapčević-Hadnađev, T.; Maravić, N.; Rakita, S.; Hadnađev, M. Chia Seed Hydrogel as a Solid Fat Replacer and Structure Forming Agent in Gluten-Free Cookies. Gels 2022, 8, 774. [Google Scholar] [CrossRef] [PubMed]
- Luckham, P.F.; Ukeje, M.A. Effect of Particle Size Distribution on the Rheology of Dispersed Systems. J. Colloid Interface Sci. 1999, 220, 347–356. [Google Scholar] [CrossRef]
- Milićević, N.; Sakač, M.; Hadnađev, M.; Škrobot, D.; Šarić, B.; Hadnađev, T.D.; Jovanov, P.; Pezo, L. Physico-chemical properties of low-fat cookies containing wheat and oat bran gels as fat replacers. J. Cereal Sci. 2020, 95, 103056. [Google Scholar] [CrossRef]
- Evageliou, V.; Alevisopoulos, S.; Kasapis, S. Application of stress-controlled analysis to the development of low fat spreads. J. Texture Stud. 1997, 28, 319–335. [Google Scholar] [CrossRef]
- Sánchez-González, I.; Rodríguez–Casado, A.; Careche, M.; Carmona, P. Raman analysis of surimi gelation by addition of wheat dietary fibre. Food Chem. 2009, 112, 162–168. [Google Scholar] [CrossRef]
Disclaimer/Publisher’s Note: The statements, opinions and data contained in all publications are solely those of the individual author(s) and contributor(s) and not of MDPI and/or the editor(s). MDPI and/or the editor(s) disclaim responsibility for any injury to people or property resulting from any ideas, methods, instructions or products referred to in the content. |
© 2023 by the authors. Licensee MDPI, Basel, Switzerland. This article is an open access article distributed under the terms and conditions of the Creative Commons Attribution (CC BY) license (https://creativecommons.org/licenses/by/4.0/).