Article

Can Low-Carbon Pilot City Policies Improve Energy Efficiency? Evidence from China

1
School of Management Science and Engineering, Nanjing University of Information Science & Technology, Nanjing 210044, China
2
School of Humanities and Social Sciences, Macao Polytechnic Institute, Macao 999078, China
3
Department of Accounting Economics Finance, Slippery Rock University, Slippery Rock, PA 16057, USA
*
Author to whom correspondence should be addressed.
Sustainability 2023, 15(3), 1857; https://doi.org/10.3390/su15031857
Submission received: 2 December 2022 / Revised: 10 January 2023 / Accepted: 16 January 2023 / Published: 18 January 2023
(This article belongs to the Section Energy Sustainability)

Abstract

:
This study examines how the low-carbon pilot city policy (LCPCP) affects energy efficiency from the angles of green technology innovation and upgrading industrial structure by using panel data collected from Chinese cities between 2007 and 2019. The research results include: (1) Based on the time-varying difference-in-differences method, LCPCP has significantly improved energy efficiency, while such results remain significant after replacing the method of measuring the dependent variable and testing with the placebo test and the method of PSM-DID. (2) The heterogeneity analysis shows that compared to resource-based cities (RBC), LCPCP has a greater impact in non-resource-based cities (NRBC). Compared to the Central regions (CR) and Western regions (WR), LCPCP has a stronger impact in the Eastern region (ER). (3) A mechanism inspection shows that LCPCP can promote energy efficiency through both upgrading industrial structure and green technology innovation. LCPCP is of great importance for improving energy efficiency.

1. Introduction

Since the industrial revolution, a series of extreme climate problems caused by carbon emissions have brought great challenges to human survival and development [1]. According to recent statistics, the global urban carbon emissions account for up to 75% of the total emissions, and cities are crucial to the effort to reduce carbon emissions globally [2]. In order to effectively mitigate carbon dioxide emissions, countries around the world began to look for new development models. As a major carbon emitting country in the world, China places a high value on reducing carbon emissions. The National Climate Change Plan (2014–2020), the thirteenth Five-Year Plan for Controlling Greenhouse Gas Emissions and other policies have been introduced to promote the transition from a traditional economy to a low-carbon economy. Under the background of economic globalization and climate change, along with the issue of making the transition to a low-carbon economy, governments worldwide also struggle with the issue of steadily rising energy consumption [3]. According to the World Energy Statistics Review, carbon emissions rose by 2.0% while the world’s energy consumption rose by 2.9% in 2018, the highest growth rate it has experienced since 2012 [4]. In 2021, the world’s energy use increased by 5.8%, exceeding the pre-epidemic level. China is a country with high energy usage, primarily from coal. Long-term energy efficiency declines have been caused by the extensive economic development paradigm [5]. The efficiency of energy usage must be raised if China is to meet its goals for long-term, high-quality economic development.
In recent years, energy efficiency and emissions reduction have been two areas where the Chinese government has given considerable focus. The first group of LCPCPs were established by the National Development and Reform Commission in 2010, with a strong focus on lowering energy consumption per unit of economic value. In order to further implement the LCPCP, in 2012 and 2017, China refined the pilot areas from provinces to cities, districts and counties, and average land transfer of energy intensive industries in the LCPCP decreased by 26.271 hectares and 29.158 hectares, respectively [6].
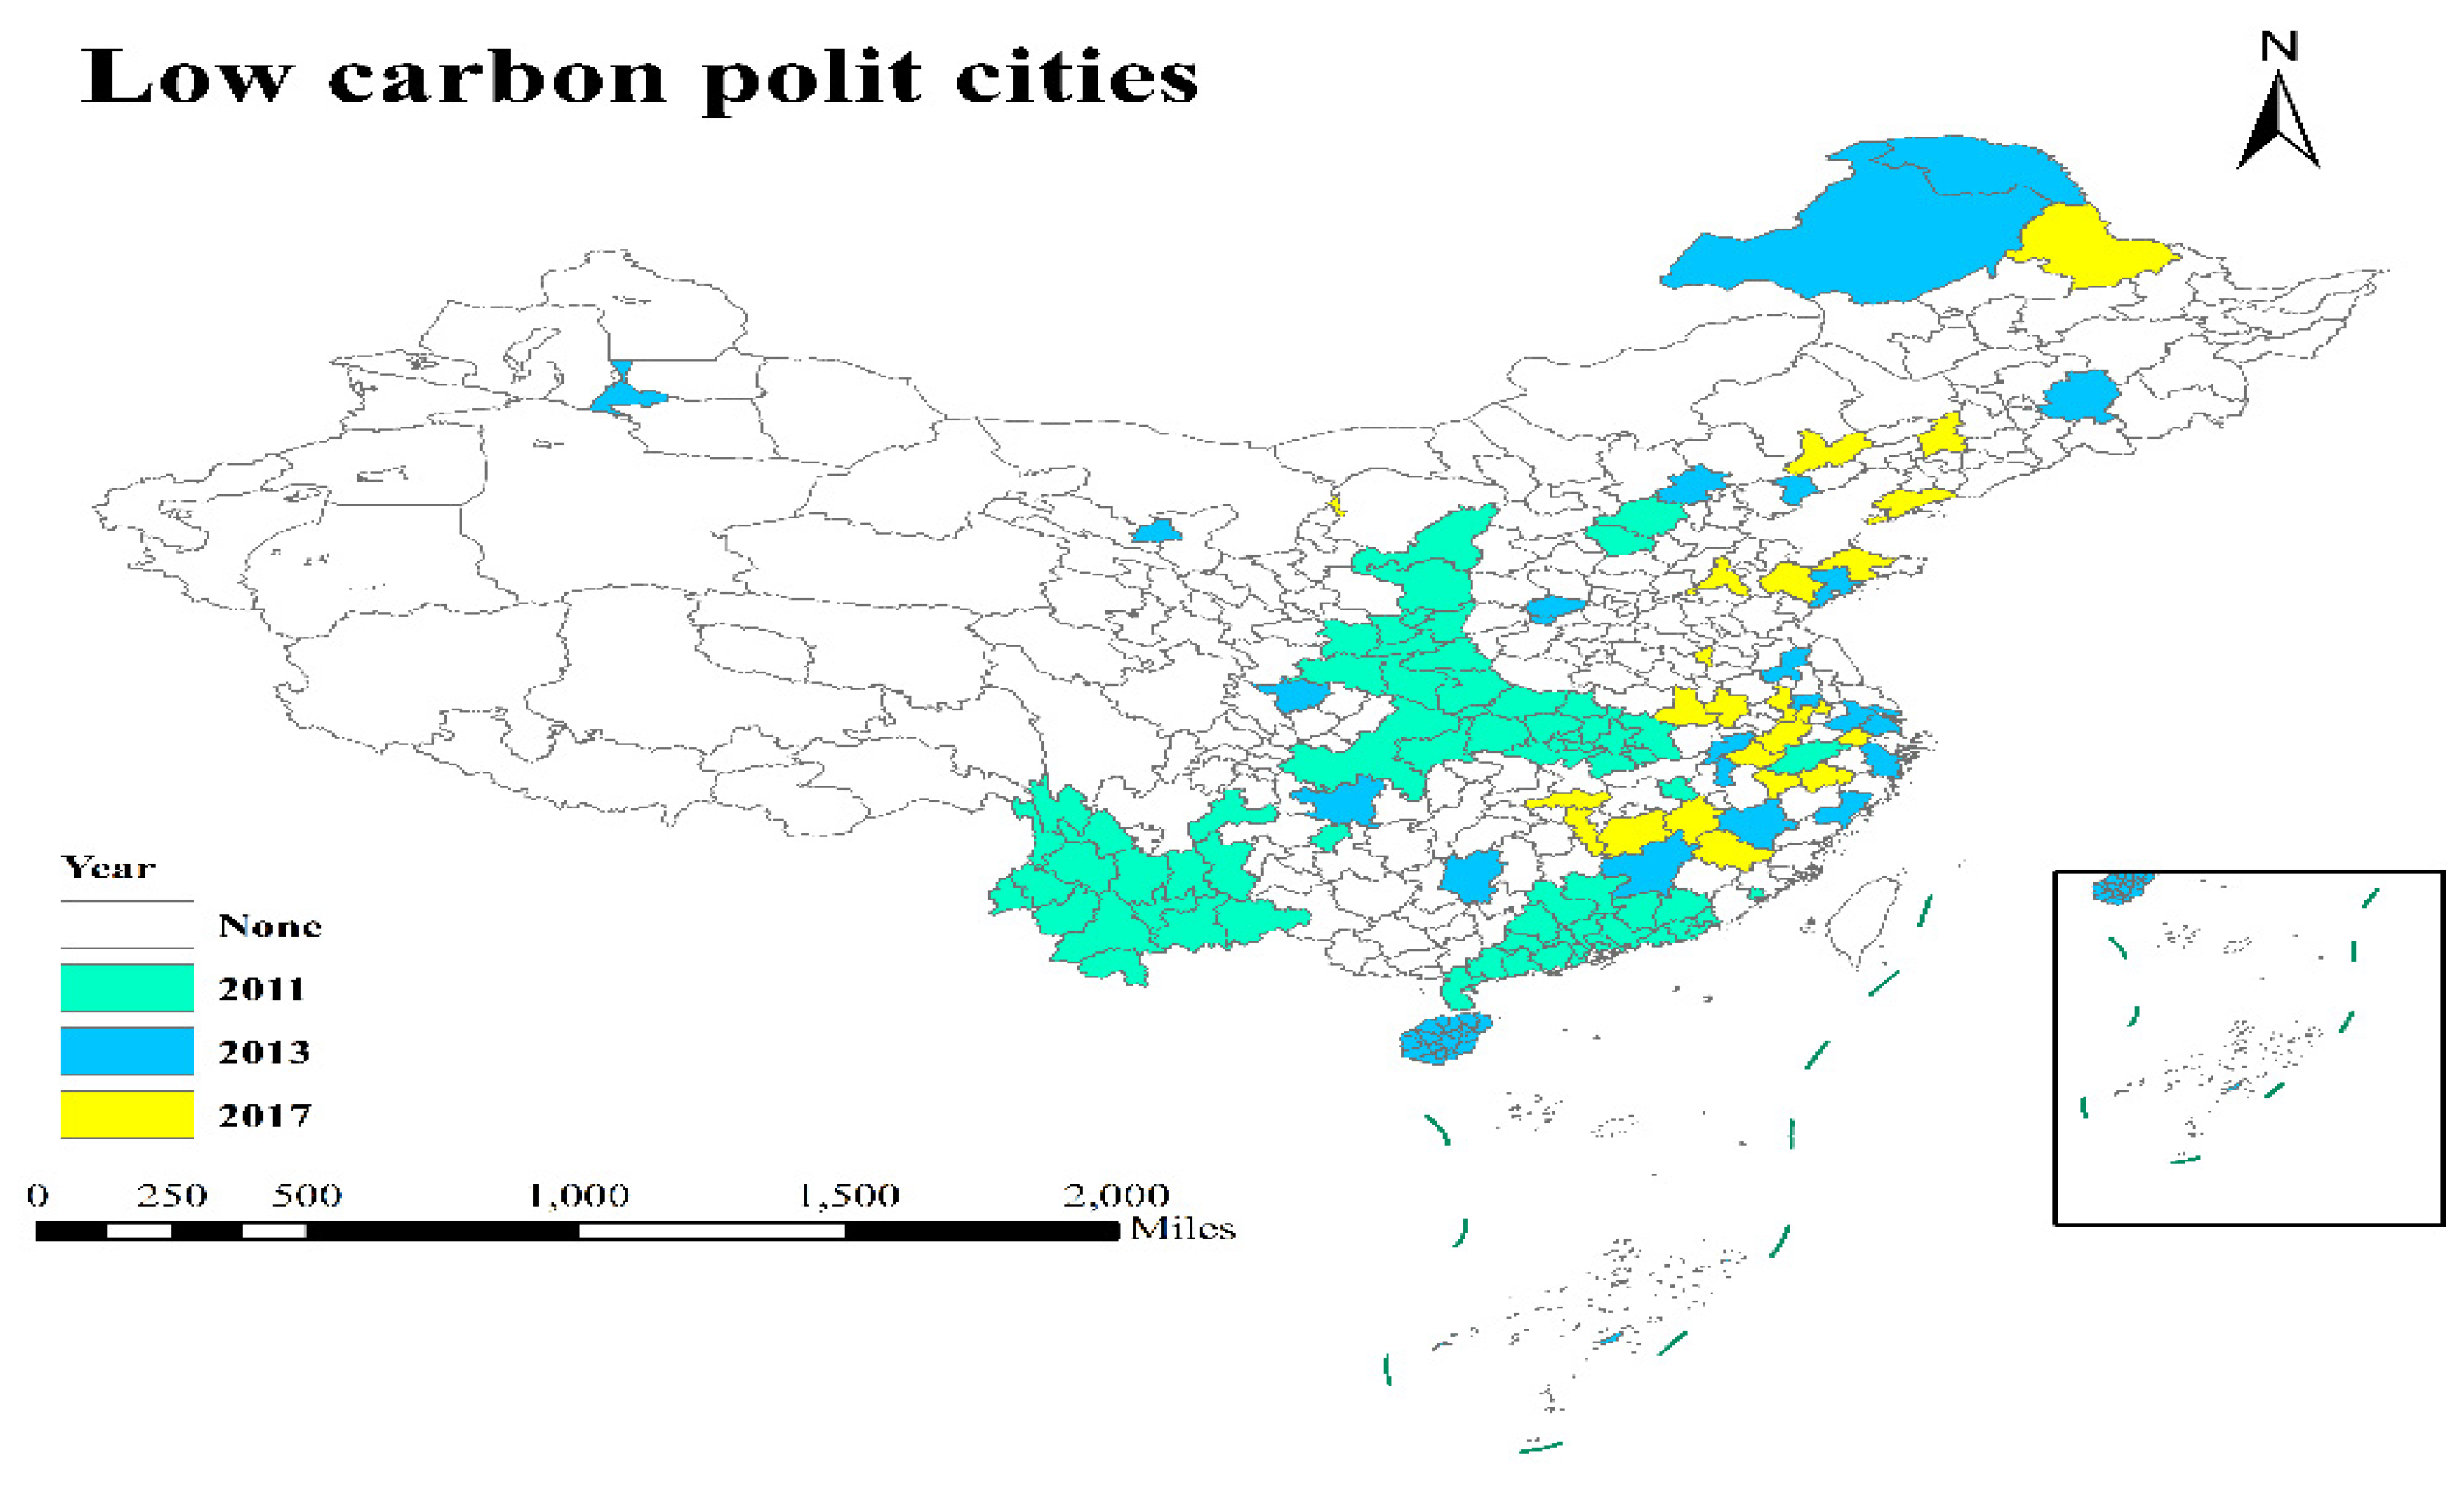
The LCPCP is an important tool for combating climate change and is crucial for advancing the transformation of city economies into low-carbon ones [7]. The establishment of LCPCPs has clearly set the per unit output values of reduction of energy consumption as the policy goal, which has a certain influence on establishing a low-carbon economy and increasing energy efficiency. Since the announcement of the policy, China has been actively assisting the development of low-carbon cities from various aspects, such as that of low-carbon demonstration zones and that of formulating the overall plan for low-carbon cities [8]. At present, few articles have been written regarding how LCPCPs affect energy efficiency. Zhou et al. [9] believe that the LCPCP program in China has greatly decreased both the use of coal and the coal intensity of businesses. Gao et al. [10] found that the LCPCP program could increase the energy efficiency of all urban green factors. Figure 1 shows the spatial distribution of LCPCP areas.
Compared to previous research, the following is the paper’s marginal contribution: First, it tests the effects of LCPCP from the standpoint of energy efficiency, which enriches the current research on LCPCP. Second, we specifically analyze the impact path about industrial structures by looking at the following three major industries: agriculture, service and manufacturing, while Gao et al.’s [10] description of the impact was from the perspective of factor input and industrial development. Finally, the policy impact of LCPCP on energy efficiency is tested using the time-varying difference-in-differences method. Other than exploring resource endowment and spatial heterogeneity, we provide suggestions for LCPCP to increase energy efficiency according to specific local conditions. In contrast, Gao et al. [10] discussed the heterogeneity from urban economic development and urban scale.
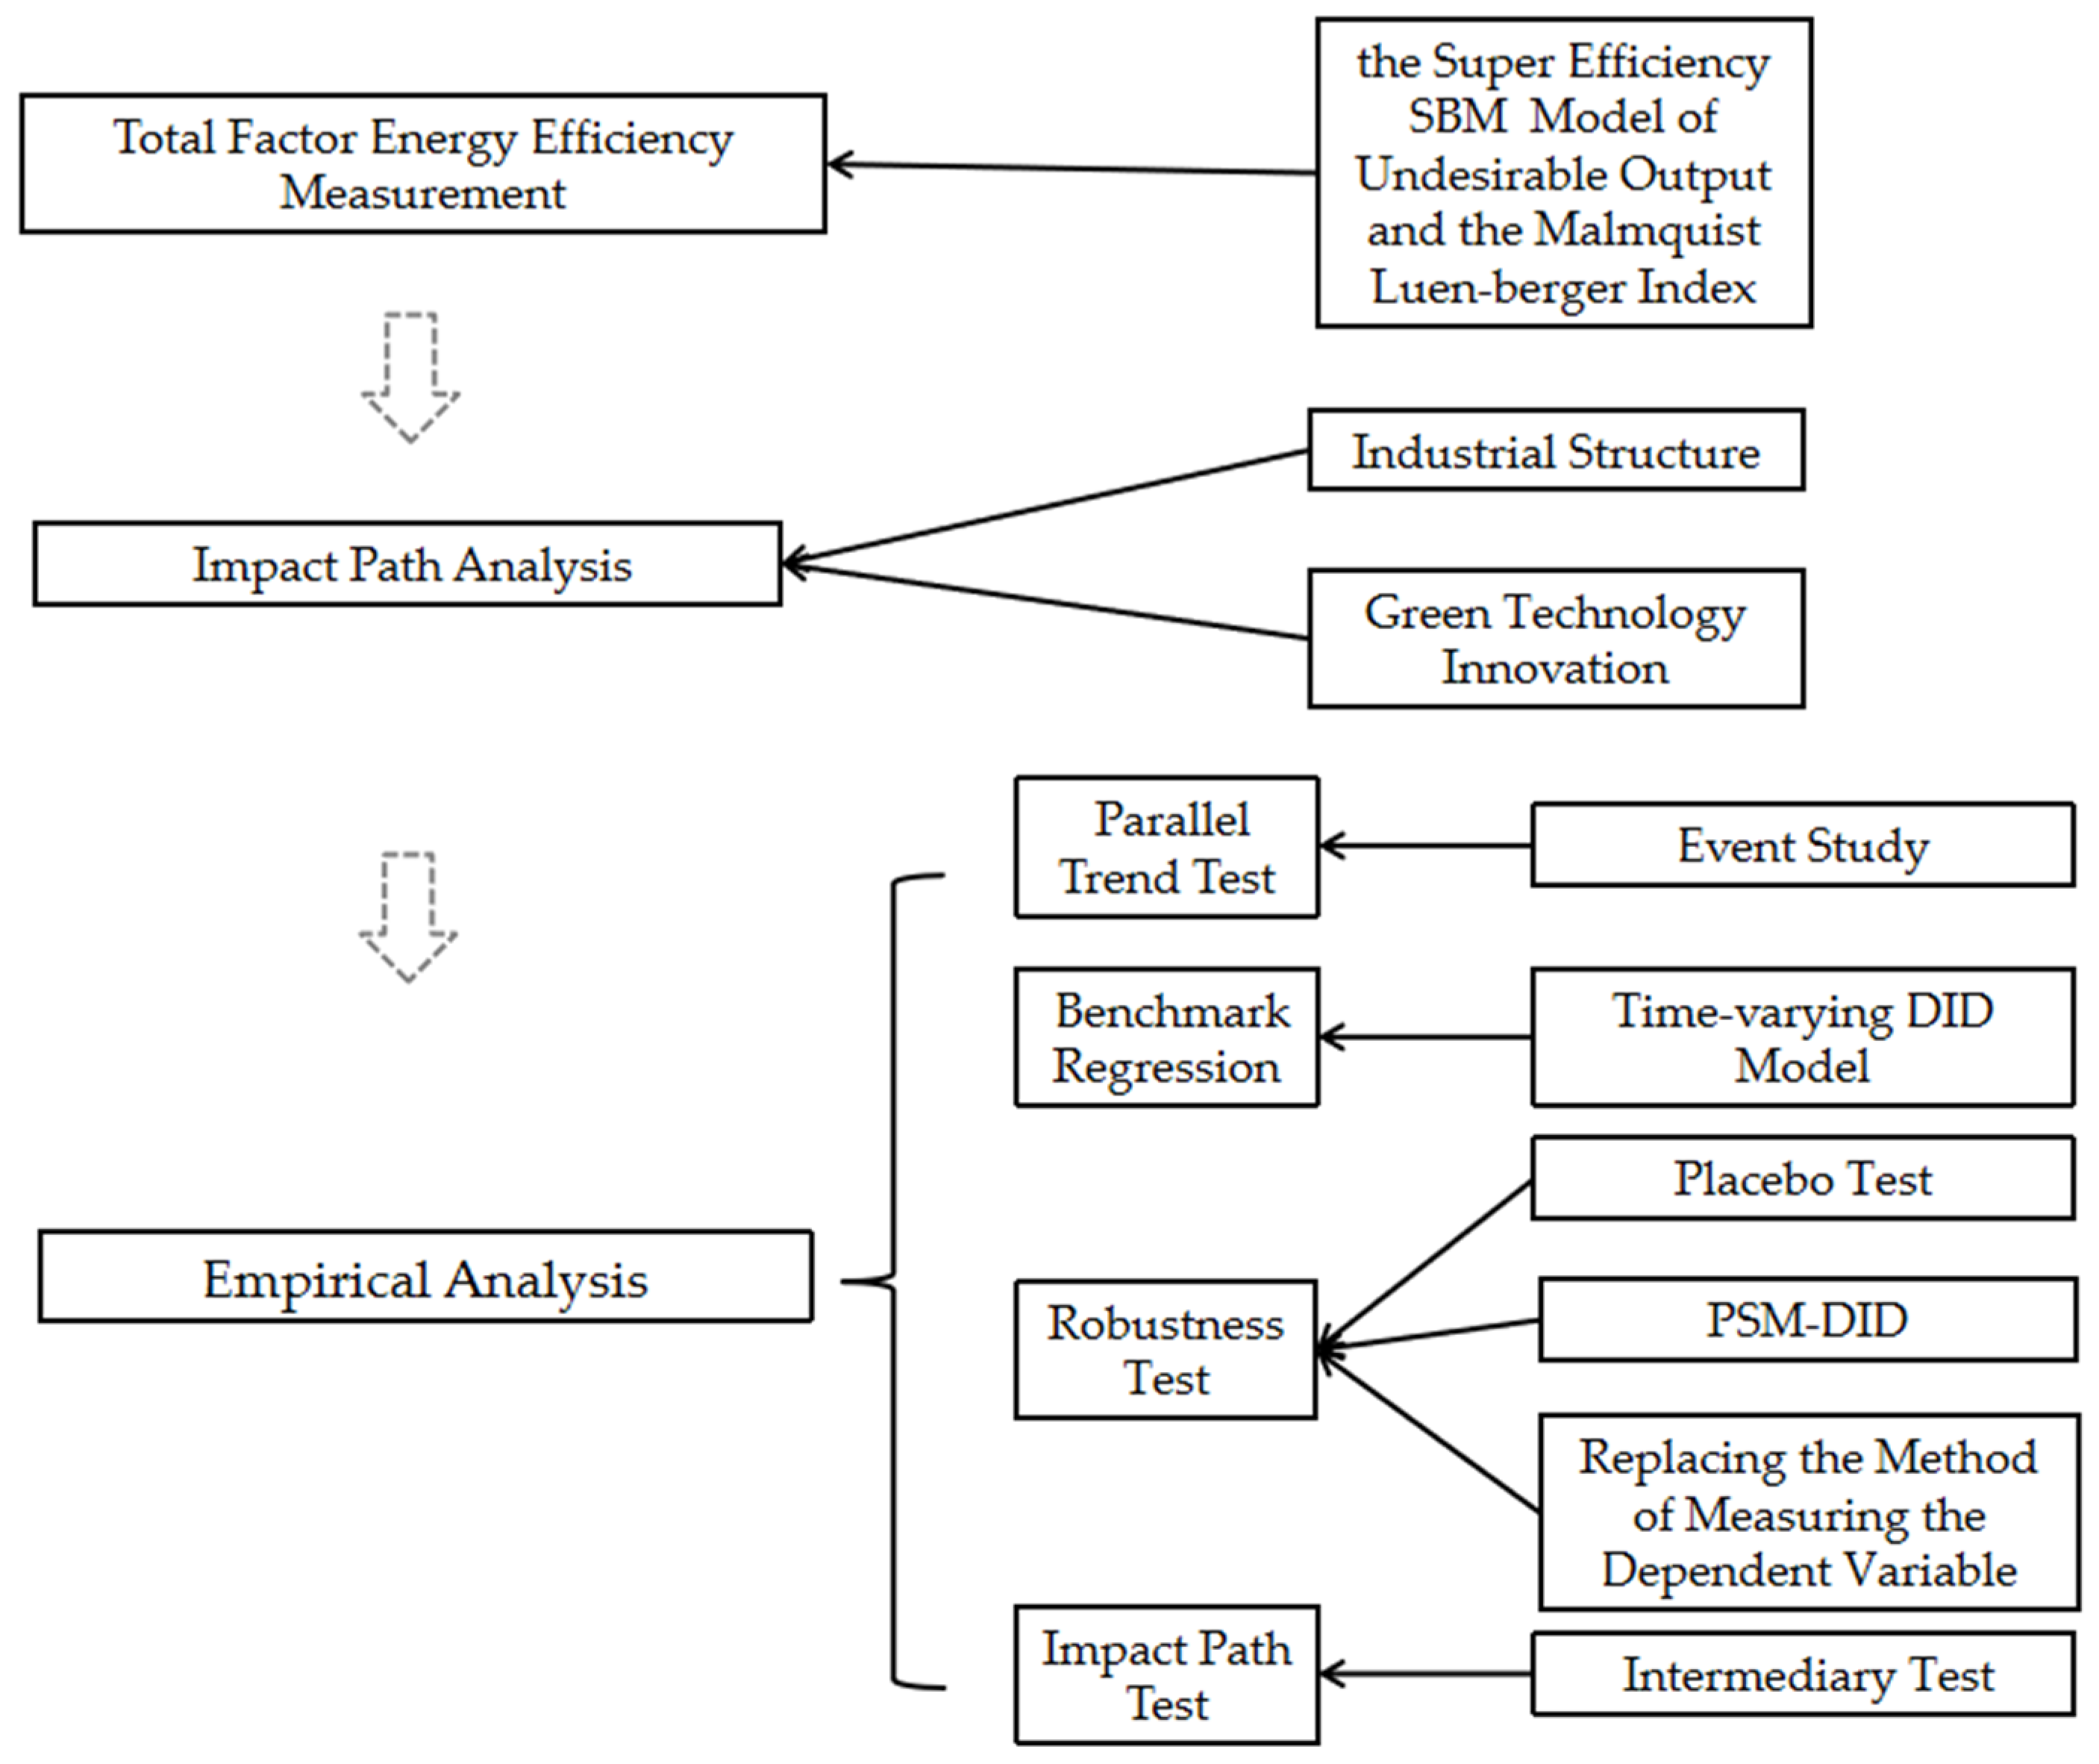
This essay is organized as follows: Section 2 is the impact path analysis. Section 3 is the study design. Section 4 is the empirical analysis. Section 5 is the conclusion and policy suggestions. Figure 2 is our research roadmap.

2. Impact Path Analysis

LCPCP mainly affects energy efficiency through updating industrial structure and green technology innovation, which is this research’s premise:
(1) LCPCP improves energy efficiency by optimizing industrial structure.
In order to improve energy efficiency, LCPCP eliminates backward production capacity and develops a low-carbon industrial system that focuses on recycling, environmental preservation and low-carbon, green energy.
First, developing modern agriculture and increasing the percentage of contemporary service industries promote the update of industrial structure. In agriculture, LCPCP focuses on low-carbon outputs, recycling and ecology to construct a modern agricultural industrial system. Developing renewable energy sources in rural areas, popularizing bio-gas for agriculture and solar water heaters and promoting the construction of large and medium-sized bio-gas projects and centralized gas supply projects for straw gasification have all helped to save energy and reduce energy consumption. By way of the service industry, LCPCP guides the upgrading and transformation of the traditional service industry and encourages the continuation of productive service industries to further high-end value chain and specialization and the transformation of the living service industry to greater refinement and high quality. The modern service industry mostly provides technical and knowledge services and has less demand for energy than the traditional service industry. The transformation from the traditional service industry to a modern one is favorable to decrease energy consumption.
Secondly, promoting low-carbon productions transforms and modernizes legacy industries and streamlines the industrial structure. The adjustment and upgrading of the manufacturing industry structure can promote a substantial reduction of energy consumption per unit of manufacturing value-added. LCPCP encourages the low-carbon transformation of traditional industries, such as coal and electricity, through promoting supply side structural reform, using low-carbon technology that is high-tech, advanced and practically applicable. At the same time, LCPCP replaces the new capacities of cement, coal and other industries by the same amounts or reduced amounts to eliminate excess capacities and outdated capacities. In addition, LCPCP promotes low-carbon transformation and upgrading of traditional industries by implementing energy-saving, transformational industrial boiler projects, motor system transformation for energy savings, optimization of energy systems, use of lingering heat and pressure, cogeneration, saving and replacing oil and other key energy-saving technologies. For example, from 2010 to 2020, the proportion of manufacturing added value in Shenzhen’s GDP fell from 37.4% to 32.1%, the proportion of energy consumption decreased from 43% to 31%, a 12% drop in the percentage, and the output of unit energy consumption increased by 1.2 times.
Hypothesis 1:
LCPCP improves energy efficiency through upgrading industrial structure.
(2) LCPCP improves energy efficiency though promoting green technology innovation.
LCPCP carries out research and development of zero carbon, low-carbon, negative carbon and other new technologies, and improves energy saving and efficiency enhancing technologies through green low-carbon technology innovation. Research shows that energy input can be decreased by low-carbon technological advancement [10]. Under the guidance of policies, LCPCP gradually forms strategic emerging industry clusters according to the layout of major emerging industry projects and major emerging industry bases. This is conducive to promoting low-carbon technology R&D to break through the key restrictions that industrial development faces and increase the degree of green technology innovation. The government has established a low-carbon industry investment fund to attract competent and qualified domestic and foreign capital to participate in low-carbon industry projects, guided various financial institutions in order to promote the expansion of low-carbon industries and supported companies and platforms with innovative low-carbon technologies. LCPCP stimulates universities to cooperate with authoritative institutions, establishes “Double Carbon” research centers and promotes green technology trading. They strengthen basic research on cutting-edge technologies in clean energy, energy storage and other fields that improve energy conservation and efficiency enhancing technologies in energy intensive industries. In addition, LCPCP also strengthens the construction of carbon accounts, which is conducive to further understand the intensity and total amount of energy consumption while improving energy efficiency.
Hypothesis 2:
LCPCP improves energy efficiency though promoting green technology innovation.

3. Research Design

3.1. Benchmark Model

By comparing the differences between the control group and the experimental group, before and following the adoption of the policy, the difference-in-differences method (DID) constructs statistics reflecting policy effects. This statistic can accurately estimate this effect. The DID model is frequently used to assess the influence of a policy [11]. The standard DID model generally aims at the same time point of policy implementation. Since there are three batches of LCPCPs in China, the LCPCP implementation time point is inconsistent, and the standard DID model is not applicable. The time-varying DID model can examine the policy effects of different periods when policy implementation points are different [12,13]. Beck et al. [14] evaluated how bank deregulation affected the distribution of income in the US using time-varying DID. As different LCPCPs have different time points (Zhou et al. [9] and Gao et al. [10]), this paper chooses the time-varying DID method to study LCPCP’s effect on energy efficiency. The basic model is as follows:
GTEEE it = β 0 + β 1 ( treat it × time it ) + β 2 Control it + μ i + τ t + ε it
where GTFEEit represents green all factor energy efficiency; treatit × timeit is the product of the time grouping variable time and the experimental grouping variable treat; “experimental group” is LCPCP with a value of one; and the “control group” is not LCPCP. The time grouping is assigned a value of one according to the policy implementation year and the years following it, and it is assigned zero before the policy implementation year. Controlit represents the control variable that changes with time and individuals; τt represents the fixed impact of time; μi represents the individual fixed effect; εit represents the random disturbance term; the subscript i stands for city; and t stands for year.

3.2. Variable Selection

(1) Dependent variable—green total factor energy efficiency (GTFEE).
To measure energy efficiency, the SBM model of undesirable output exceeding efficiency and the Malmquist–Luenberger index are chosen to measure undesirable output (i.e., industrial smoke emissions, industrial sulfur dioxide emissions as well as wastewater emissions) of the process of consuming energy.
(i) Measurement method: total factor energy efficiency (TFEE) and single factor energy efficiency (SEE) are two examples of techniques useful for measuring energy efficiency. SEE is uncomplicated to measure and compare, but it only measures a single input factor of energy consumption without considering the impact of other input factors on economic output. This method of measurement has certain limitations. Hu and Wang introduced TFEE which calculates energy efficiency under the framework of TFEE [15]. With the development of the economy, researchers further brought environmental elements into the total factor framework. The undesirable output super efficiency SBM-ML model can include undesirable output and dynamically analyze energy efficiency. The complicated situation can be resolved by using the super-efficient model. In this case, the efficiency of multiple decision-making units is one. This paper uses MAXDEA software to measure energy efficiency. The input–output index is set as below with reference to Wu et al. [16] and Hao et al. [17]. (a) Input: total energy consumption, labor input (towards the conclusion of the year, the real number of employees in each city), and capital input (calculated by perpetual inventory K it = K it 1 ( 1 δ ) + I it , with the depreciation rate δ = 9.6%). (b) Expected output: constant price GDP (use the urban GDP deflator to reduce the 2007 urban GDP at constant prices). (c) Undesirable output: it includes the emissions of industrial wastewater, industrial smoke and sulfur dioxide.
The super efficiency SBM model is non-radial and proposed by Tone [18]. In contrast to the conventional DEA model, the super efficiency SBM model contains relaxation variables, examining energy efficiency with output and input dimensions. It can also distinguish multiple effective DMUs. Undesirable output can be incorporated into the efficiency measurement process by using the SBM model with undesirable output. The energy efficiency will become more reasonable [19]. Referencing the research of Sun et al. [19], the undesirable output super efficiency SBM model is constructed as follows:
ρ * = 1 m i = 1 m ( x ¯ x i k ) 1 ( s 1 + s 2 ) ( r = 1 s 1 y d ¯ y r k d + t = 1 s 2 y u ¯ y r k u )
s . t . { x ¯ j = 1 , k n x i j λ j ; i = 1 , 2 , , m y d ¯ j = 1 , k n y r j d λ j ; r = 1 , 2 , , s 1 y u ¯ j = 1 , k n y t j u λ j ; t = 1 , 2 , , s 2 λ j 0 , j = 1 , 2 , , n , j 0 x ¯ x i k ; y d ¯ y r k d ; y u ¯ y t k u
where ρ * stands for the efficiency value, x ¯ stands for the input, y d ¯ stands for the expected output, y u ¯ stands for the undesirable output, and λ j is the weight vector. If ρ * ≥ 1, DMU is effective.
Chung et al. [20] renamed the Malmquist index the Malmquist–Luenberger index It can dynamically analyze the effectiveness of each decision-making unit and contains the direction distance function of undesirable output. Refer to Färe et al.’s method, Malmquist–Luenberger index can be divided into efficiency change index and the technological change index [21].
The ML index from t to t + 1 is shown in Equation (3).
M L t t + 1 = 1 + D 0 t ( x t , y t , b t ; y t , b t ) 1 + D 0 t ( x t + 1 , y t + 1 , b t + 1 ; y t + 1 , b t + 1 ) × 1 + D 0 t + 1 ( x t , y t , b t ; y t , b t ) 1 + D 0 t + 1 ( x t + 1 , y t + 1 , b t + 1 ; y t + 1 , b t + 1 )
(ii) Measurement data: Referring to the research of Li et al. [22], the conversion coefficient of energy consumption is calculated by provincial level’s Liquefied Petroleum Gas (LPG), Natural Gas (NG), the Consumption of Electricity (CE) and Energy Consumption (EC). These data are available from the China Energy Statistical Yearbook (2008–2020), issued by the National Bureau of Statistics. The municipal EC is calculated by municipal level’s LPG, NG, and CE, available from the China Urban Statistical Yearbook (2008–2020), issued by the National Bureau of Statistics. The units of various EC are uniformly converted into 10,000 tons of standard coal.
First, we divide the LPG, NG and CE of each province by the total EC of the province to obtain the coefficient CEI. Second, we divide the LPG, NG and CE of each city by the coefficient CEI to calculate the total EC of the city. The formulas for these calculations are given in Equations (4) and (5).
C E I = P E i t + P G i t + P L i t P E E i t
C C E i t = C E i t + C G i t + C L i t C E I
where CEI represents the conversion coefficient of EC, t the year, PEit province i’s CE at time t, PGit the NG consumption of province i at time t, PLit the LPG consumption of province i at time t and PEEit the EC of province i at time t. The symbol CCEit represents the EC of city i at time t, CEit the CE of city i at time t, CGit the NG consumption of city i at time t and CLit the LPG consumption of city i at time t.
(2) Independent variable.
treatit × timeit: The product of the time grouping variable “time” and the experimental grouping variable “treat”. If city i is a LCPCP in year t, the assigned value is one. The other assigned values are zero. In this paper, three batches of LCPCPs had been respectively chosen in 2010, 2012 and 2017 as the experimental group, and other cities have been chosen as the control year.
(3) Control variables.
(a) Human capital (EDU): The enhancement of EDU is conducive to application, the R&D and promotion of energy-saving technologies, thereby improving energy efficiency [23]. This study measures EDU by comparing the quantity of students enrolled in middle schools and universities to the entire populace at the conclusion of the school year.
(b) Government intervention (GOV): The market’s ability to allocate resources effectively is often distorted by excessive GOV in the economy. It may also result in resource waste and recurrent building; these are detrimental to the advancement of energy efficiency [23]. Our study measures the level of GOV by the ratio of local fiscal budget expenditure to GDP.
(c) Foreign direct investment (FDI): FDI’s technology spillover effect, international competition effect, import and export commodity structure, energy price changes, international technology trade and other channels affect the efficiency of energy utilization. This paper measures FDI as a percentage of regional real GDP.
(d) Urbanization level (Citylevel): The improvement of Citylevel can slow down per capita residential energy consumption and promote production energy consumption. Urbanization’s effect on energy use varies depending on income levels as well. In low-income groups, urbanization reduced energy consumption; urbanization was not likely to have a significant impact on energy use for high-income groups [24]. The percentage of urban residents in the population of a location is used in this study to gauge Citylevel.
(e) Economic development level (Rgdp): The advancement of energy efficiency is influenced by the degree of Rgdp. High levels of Rgdp are typically accompanied by greater financial policy support for the advancement of energy efficiency. Economic growth also reduced the energy consumption intensity of high-income and upper middle-income countries [25]. In this study, per capita GDP is used to gauge the level of economic progress. For related discussions, refer to Wang and Wang [26]. In order to deflate the urban GDP at the constant prices observed in 2006, the urban GDP deflator is utilized.
This research’s data come from the China Energy Statistical Yearbook (2008–2020), the China Urban Statistical Yearbook (2008–2020) and the China Statistical Yearbook (2008–2020). All these yearbooks are issued by the National Bureau of Statistics.
3.3. Descriptive Statistics and Multicollinearity Test

The influence of LCPCP on energy efficiency is examined in this work by urban panel data collected from 2007 to 2019. The Table 1 below displays a descriptive statistical analysis of each variable.
The variance expansion coefficient (VIF) is used in this study to examine the possibility of multicollinearity between the independent variable and the control variables. When the value of VIF is close to 1, the multicollinearity between variables is small. Generally, 10 is used as the judgment boundary. Table 2 demonstrates that the maximum variance expansion coefficient of the variables obtained is 1.72, proving that the independent and control variables are not collinear with one another.

4. Empirical Analysis

4.1. Parallel Trend Test

The prerequisite for applying the time-varying DID approach is the parallel trend. Prior to the implementation of the policy, it is used to determine whether the changing trend in energy efficiency of LCPCP is consistent with other cities. In this paper, Moser and Voena’s [27] research is used for reference to carry out time-varying DID parallel trend test by using an Event Study. The estimation formula employed here is as follows:
Y i t = α + 3 K = 4 β k × D i , t 0 + k + η i + γ t + ε i t
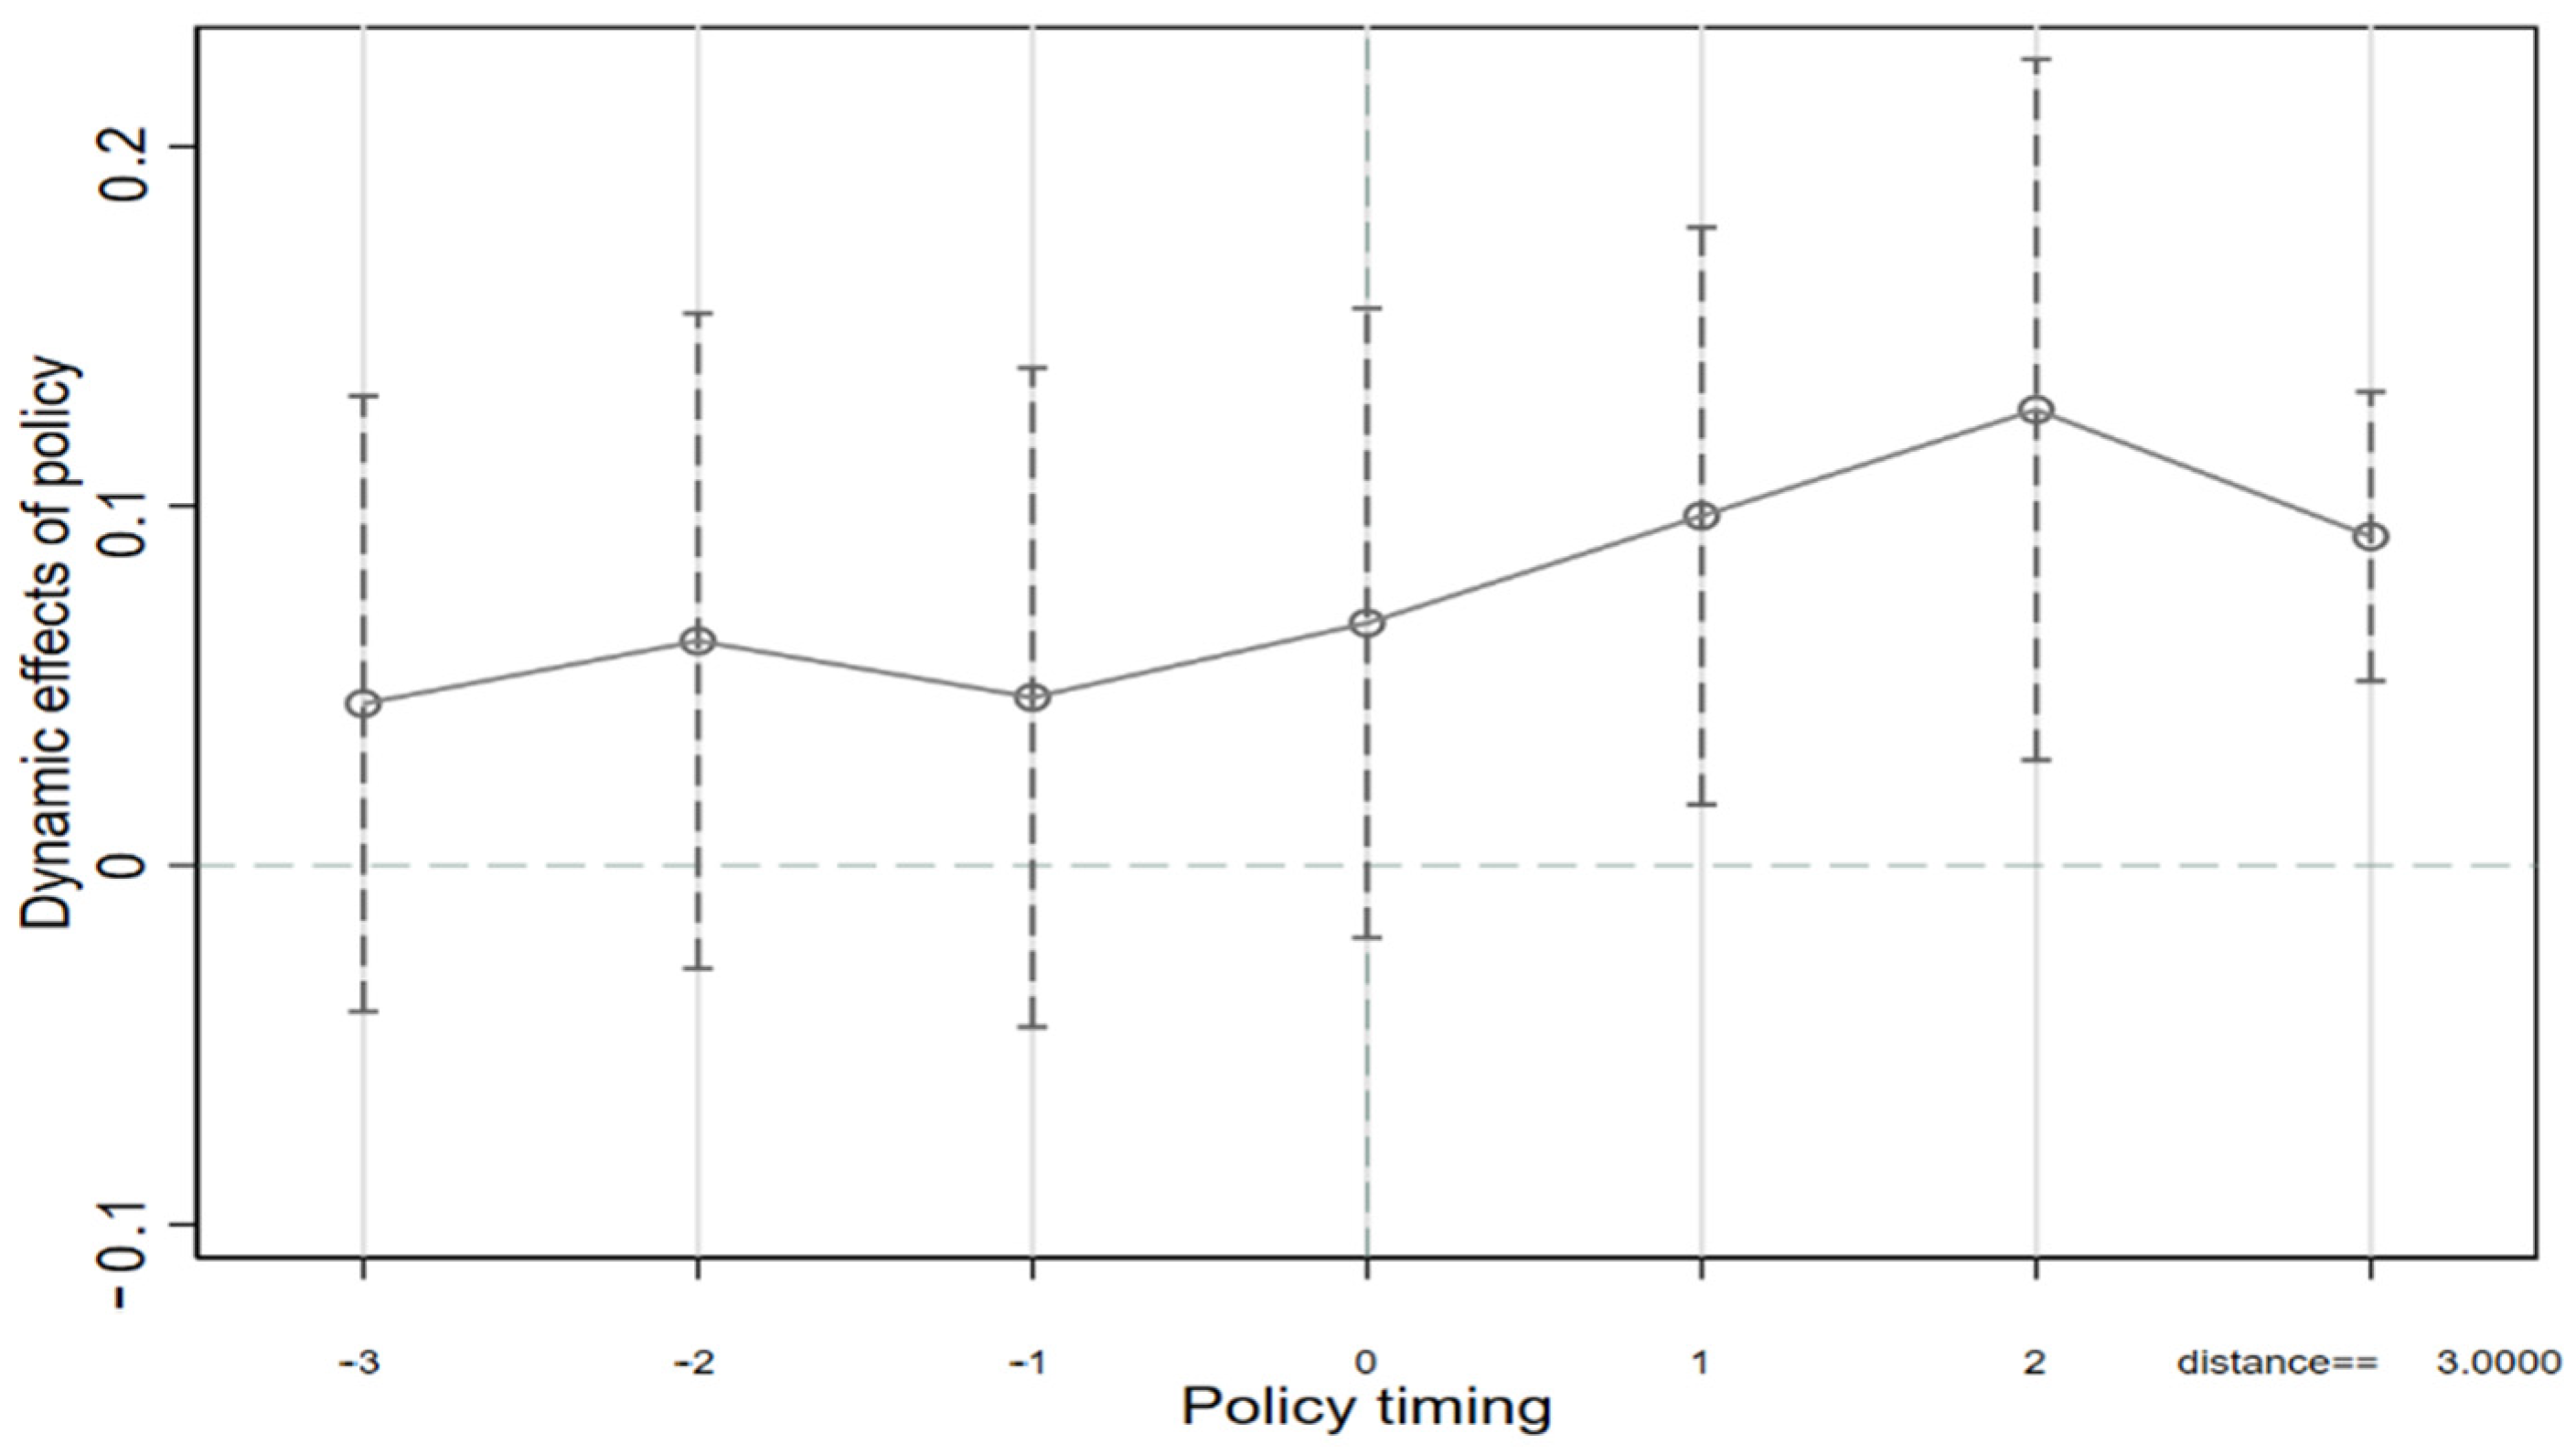
where D i , t 0 + k groups of dummy variables, representing LCPCP establishes in year k. To be specific, t0 is the first year of establishing a LCPCP for city i and k is the k-th year after LCPCP’s establishment. The study intercepts the three years before the policy’s implementation and the three years after the implementation. The variables concerned in this paper are βk. When the “LCPCP” is generated in the k-th year, it illustrates the difference in energy efficiency between control groups and experimental groups. If the coefficient of βk in the period of k < 0 is not significant, that is the confidence interval contains 0, it demonstrates the validity of the parallel trend assumption. On the contrary, if the coefficient in the period of k < 0 is significant, it demonstrates that there was a sizable gap between the experimental group and the control group prior to the implementation of the policy. That is, it does not match the notion of a parallel progression. In Figure 3, the dynamic effect is displayed.
Figure 3 demonstrates that, during the initial three years of implementing, the dummy variable’s coefficient is not significant because that the confidence interval contains 0. Before the policy’s execution, the change trend of two groups’ data is consistent. After the implementation of the policy, the coefficient of the dummy variable is higher than 0, indicating that the energy efficiency of two groups has changed significantly under the impact of the policy, meeting the conditions of using time-varying DID.

4.2. Benchmark Regression Results

To learn more about how LCPCP affects energy efficiency, this paper conducts a time-varying DID regression.
As shown in Table 3, Equation (1) does not include any control variables and the independent variable coefficient passes 5% significance, indicating that LCPCP plays an important role in improving energy efficiency. In Equation (2), the control variable is added to further exclude the influence of other possible factors. At this time, the 5% significance test is passed by the independent variable’s coefficient, which is 0.0279. Equation (3) further increases the temporal and urban fixed effects. The independent variable’s coefficient passes the 10% significance test. Therefore, after a series of benchmark regressions, we conclude that energy efficiency is significantly improved with LCPCP.

4.3. Robustness Test

(1) Alternative measurement method of the dependent variable.
This research performs a robustness test by altering the measurement technique of the dependent variable to see whether the influence is robust. TFEE and SEE are the two methods for calculating energy efficiency. Known as energy intensity, SEE refers to the energy consumed per unit of GDP. Based on Antonietti and Fontini [28], the ratio of energy consumption to GDP is used to measure SEE.
The regression’s findings are shown in Table 4. After alternating measurement method of the dependent variable, the coefficient of independent variable is still considerably negative and passes the 1% significance test. Therefore, LCPCP can stably lower energy consumption intensity.
(2) Placebo test.
To further evaluate the impact of alternating measurement techniques, we employ a placebo effect by excluding the impact caused by other random factors and obtain a more credible causal identification effect. The experimental group was randomly constructed and simulated 1000 times. Then, the independent variable’s coefficients and t values were noted. Table 5 displays the coefficients and t values of the regression findings.
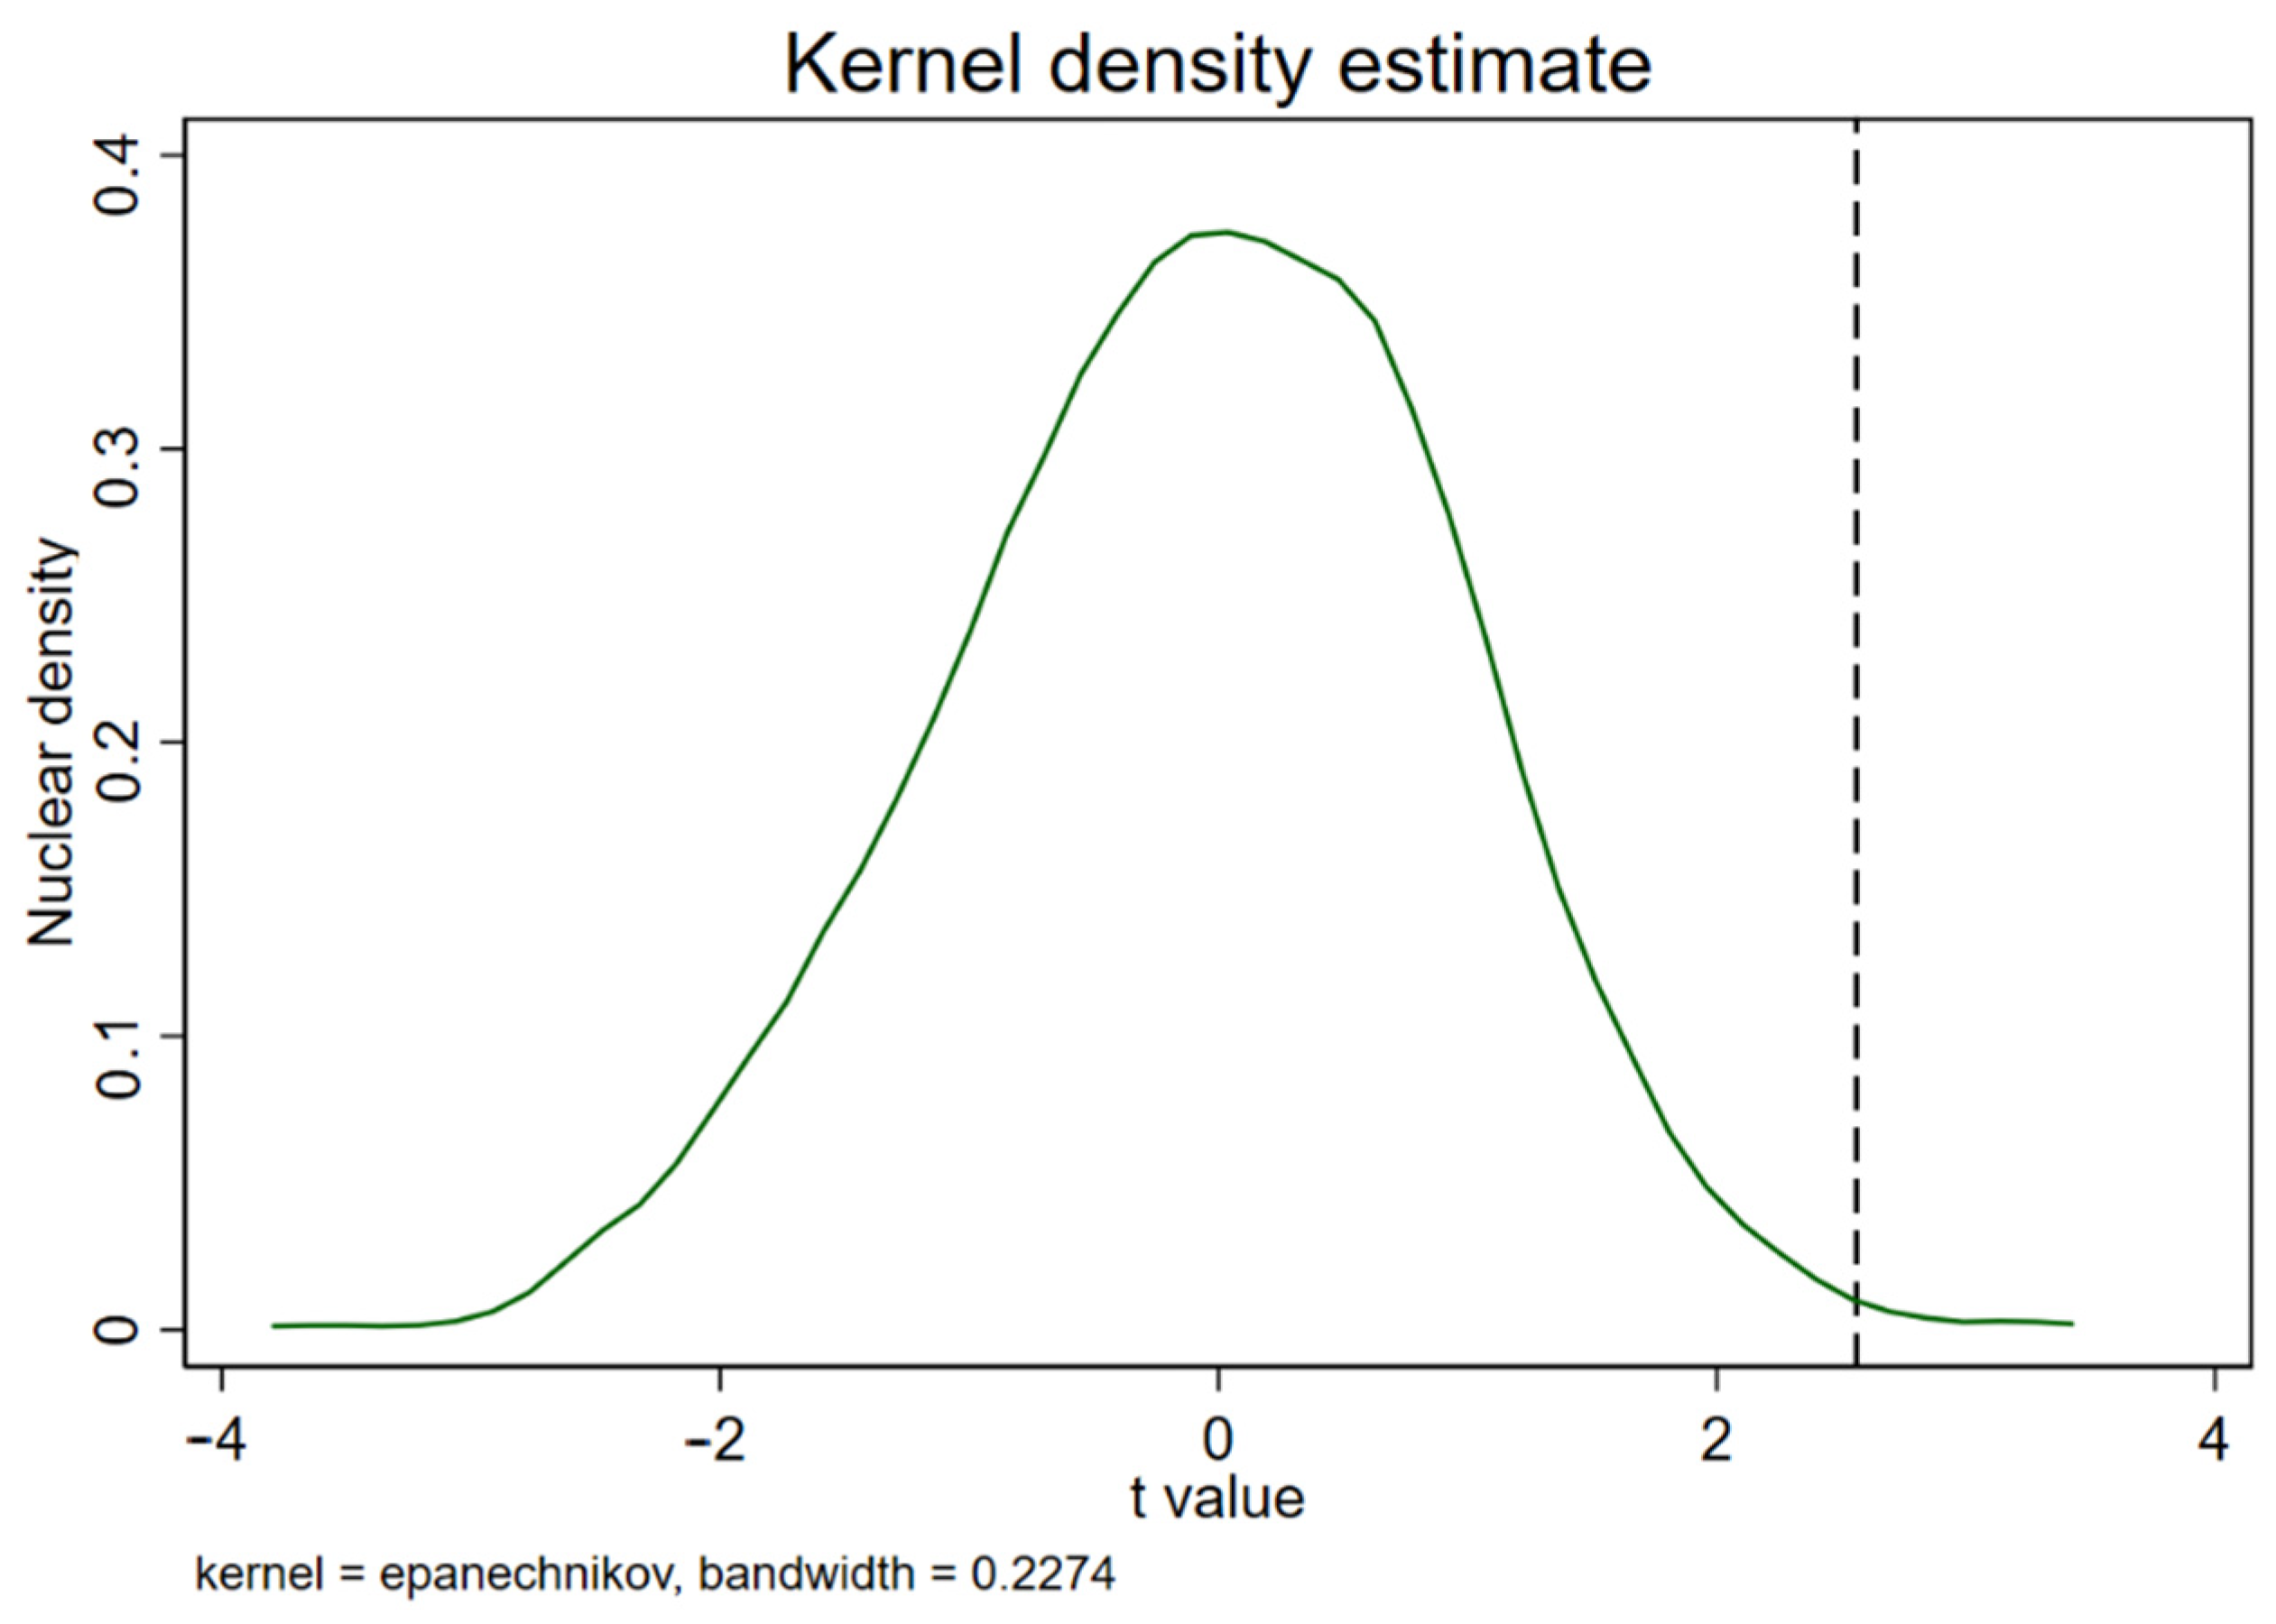
In order to display the outcomes of the placebo test, we have drawn the nuclear density estimation chart of t value in Figure 4.
It is evident from Figure 4 that most of the t values obtained after randomly constructing the experimental group and simulating 1000 times are concentrated around 0, with a mean value of −0.0116, which is far from the t value of 1.96 as regressed by the experimental group of LCPCPs. This shows that the difference between the results of randomly constructing the experimental group of LCPCPs and the regression results of real LCPCPs after simulating 1000 regressions is substantial. Therefore, our regression results of the LCPCP on energy efficiency are robust.
(3) PSM-DID.
Propensity score matching (PSM) difference-in-differences is also used in this study to test the robustness. By using the PSM approach, control groups and experimental groups are matched annually. The difference-in-differences model is then used based on the matched samples. Specifically, EDU, GOV, FDI, Citylevel and Rgdp are selected as matching variables for propensity score matching.
Based on the matched samples and the benchmark regression model, the results in Table 6 are obtained. The matching methods of regression are nearest neighbor matching, radius matching and kernel matching. The independent variable’s regression coefficients pass the 1% significance test, demonstrating the robustness of the impact.

4.4. Heterogeneity Analysis

We examine heterogeneity from two perspectives: resource endowment and spatial heterogeneity. First, cities with different resource endowments may affect the influence of LCPCP on enhancing energy efficiency. The relative price of resources in regions with abundant natural resources is relatively low, which is easy to lead to abuse of resources, resulting in low efficiency of resource use. Resources’ abundance can make energy input processes more technologically inefficient and decrease the effectiveness of energy use. The division of cities refers to the National Sustainable Development Plan for resource-based cities published by the State Council.
Second, different regions may affect the influence on energy efficiency. The growth of China’s economy is unbalanced. Due to slow economic development, the energy demand of cities in remote areas is relatively low compared with that of coastal areas and the energy use status and utilization level are quite different. Therefore, according to the geographical locations, for the heterogeneity test in this research, the sample is divided into eastern, central, and western areas. Table 7 displays the corresponding results.
The regression outcomes in Table 7 show that cities with varying resource endowments might benefit from LCPCP in different ways when it comes to increasing urban energy efficiency. It passes the 10% significance test and significantly contributes to the impact in NRBC, while the impact is not immediately apparent for RBC.
RBC have a high dependence on energy due to their rich natural resources, and the relatively low energy prices lead to abuse of resources. That makes it difficult to boost energy efficiency. For NRBC, the relatively high prices of energy, due to the lack of natural resources, raise the cost of energy waste, mitigating the problem of energy abuse and making it easier to increase energy efficiency than in RBC. Therefore, LCPCP has a greater impact on increasing energy efficiency in NRBC than it does in RBC.
In addition, improvements in urban energy efficiency in different regions are impacted differently by LCPCPs. The LCPCP significantly contributes to enhancing ER’s energy efficiency and passes the 1% significance test. Cities in CR and WR are not impacted much. Together with the outcomes and information on energy use data, this research suggests that due to its location in the coastal area with convenient transportation and rapid economic development and its better low-carbon urban infrastructure construction, the ER experiences greater improvement in energy efficiency. However, on the contrary, WR and CR are located in remote areas with relatively backward economic development and poor low-carbon urban infrastructure, all of which make it difficult for these regions to enhance their energy efficiencies. Therefore, the impact in ER is higher than those experienced in WR and CR.

4.5. Impact Path Test

The empirical results above indicate that LCPCP can significantly improve energy efficiency, while the impact path remains to be tested. In Section 2, this paper believes that the impact is mainly through industrial structure upgrading and green innovation technology. To confirm this belief, we use the intermediary test to examine whether this impact mechanism is significant.
The three step intermediary test method is as follows: the first step is to test whether the construction of LCPCP can significantly improve energy efficiency; the second step is to test whether the construction of LCPCP can optimize the industrial structure and improve green innovation technology; and the third step is to test whether the construction of LCPCP can improve energy efficiency by optimizing industrial structure and promoting green innovative technologies. The model settings are given as follows:
G T F E E i t = β 0 + β 1 D i d i t + β 2 C o n t r o l i t + μ i + τ t + ε i t
M e d i a t i o n i t = α 0 + α 1 D i d i t + α 2 C o n t r o l i t + ν i + ω t + η i t
G T F E E i t = δ 0 + δ 1 D i d i t + δ 2 M e d i a t i o n i t + δ 3 C o n t r o l i t + ρ i + υ t + θ i t
where Mediationit represents the intermediary variable. This study measures the industrial structure by using the ratio of secondary industry output value to the total industry output value (TS); it measures green technical innovation by using green patent licensing (Gpat). Table 8 and Table 9 show the results.
Equation (1) shows the influence of LCPCP on energy efficiency. Passing the 10% significance test indicates that the coefficient is positive. Equation (2) is used to test the effect of LCPCP on the industrial structure. Passing the 10% significance test signals that LCPCP can effectively optimize the industrial structure. Equation (3) is used to test how LCPCP optimizes the industrial structure to increase energy efficiency. The coefficient is positive and passes the 10% significance test. By enhancing the industrial structure, LCPCP can increase energy efficiency. Hence, hypothesis one is confirmed statistically.
Equation (1) shows the influence of LCPCP on energy efficiency. The coefficient passes the 1% significance test and is considerably positive. Using Equation (2), the effect of LCPCP on the advancement of green technologies is investigated. The test passes with 1% significance, and because the coefficient is positive, it indicates that LCPCP can effectively improve the innovation and entrepreneurship index. Equation (3) is used to test whether LCPCP can innovate with green technologies to increase energy efficiency. The correlation is insignificant, so we use bootstrap test to further do our confirmation.
Table 10 shows that the confidence interval of indirect effect is [0.0077, 0.0199]. This confidence interval excludes the value of zero, and the significance of p value is 1%, indicating that innovation in green technology has a large indirect impact. Therefore, LCPCP can improve energy efficiency through green technology innovation. That is, hypothesis two is established statistically.

5. Conclusions and Policy Suggestions

This work employs the time-varying DID model to experimentally examine the effect of LCPCP on energy efficiency using panel data available for Chinese cities between 2007 and 2019. The research concluded: (1) LCPCP can improve energy efficiency through upgrading green technology innovation and industrial structure. (2) Empirical results show that LCPCP can significantly improve energy efficiency. To this end, we carried out robustness testing by replacing the method of measurement of the dependent variable, placebo test, PSM-DID and other methods with resultant outcomes remaining significant. (3) By analyzing the heterogeneity of LCPCP impacts on energy efficiency from the perspectives of urban resource endowment and geographical location, we find that LCPCP improves energy efficiency more for NRBC than for RBC, and the effect on the improvement of energy efficiency is more obvious on ER than WR and CR.
The derived conclusions of this research lead to the following specific suggestions: (1) Improve the construction level of LCPCP. LCPCP can actively stimulate the introduction of advanced energy-saving, clean energy, renewable energy, carbon capture, utilization and storage and other low-carbon technologies. It can dynamically promote investment in and capital selection for cleaner development projects, such as renewable energy, alternative fuels, agricultural methane and nitrous oxide emissions reduction, industrial emissions reduction and carbon sinks. (2) Build LCPCP according to local conditions and regional characteristics. The government can select parks with better comprehensive utilization of resources, park ecological environment, public service facilities and other conveniences to demonstrate low-carbon parks in combination with industrial clusters and regional characteristics. It can do this in combination with the construction of beautiful villages and select villages and towns that are better equipped in new energy utilization, energy-saving product promotion, garbage classification, recycling and ecological construction to demonstrate low-carbon villages and towns.
Although, in this essay, the effect and its effect path of LCPCP on energy efficiency is examined, due to the short implementation time of the third batch of LCPCPs and limited energy efficiency data, this analysis may not be comprehensive.. In the future, we will continue to focus on the long-term impact of LCPCP on energy efficiency, use other methods to explore the impact and discover other paths of the impact.

Author Contributions

Methodology, Y.L.; Software, Y.L.; Validation, J.L., X.W. and J.Y.-L.F.; Resources, Y.L.; Writing–original draft, Y.L.; Writing–review & editing, J.L., X.W. and J.Y.-L.F.; Supervision, X.W. and J.Y.-L.F. All authors have read and agreed to the published version of the manuscript.

Funding

This study was funded by the National Natural Science Foundation of China [Grant No. 71973068].

Institutional Review Board Statement

Not applicable.

Informed Consent Statement

Not applicable.

Data Availability Statement

The data provided in this study are publicly available in China Statistical Yearbooks and CEIC China database at https://www.ceicdata.com/.

Conflicts of Interest

The authors declare no conflict of interest.

References

  1. Yuan, Y.H.; Zhang, B.W.; Wang, L.; Wang, L. Low-Carbon Strategies Considering Corporate Environmental Responsibility: Based on Carbon Trading and Carbon Reduction Technology Investment. Sustainability 2022, 14, 6683. [Google Scholar] [CrossRef]
  2. Su, M.; Zheng, Y.; Yin, X.; Zhang, M.; Wei, X.; Chang, X.; Qin, Y. Practice of low-carbon city in China: The status quo and prospect. Energy Procedia. 2016, 88, 44–51. [Google Scholar] [CrossRef] [Green Version]
  3. Cheng, W. BP pointed out in the 2019 statistical review of world energy that the world is on an unsustainable path. Pet. Process. Petrochem. 2019, 50, 96. [Google Scholar]
  4. Hong, Q.; Cui, L.; Hong, P. The impact of carbon emissions trading on energy efficiency: Evidence from quasi-experiment in China’s carbon emissions trading pilot. Energy Econ. 2022, 110, 106025. [Google Scholar] [CrossRef]
  5. Wang, X.; Wang, H.; Liang, S.; Xu, S. The Influence of Energy Price Distortion on Region Energy Efficiency in China’s Energy-Intensive Industries from the Perspectives of Urban Heterogeneity. Sustainability 2021, 14, 88. [Google Scholar] [CrossRef]
  6. Tang, P.C.; Yang, S.W.; Shen, J.; Fu, S.K. Does China’s low-carbon pilot programme really take off? Evidence from land transfer of energy-intensive industry. Energy Policy 2018, 114, 482–491. [Google Scholar] [CrossRef]
  7. Wang, Z.; Dou, X.; Wu, P.; Liang, S.; Cai, B.; Cao, L.; Pang, L.; Bo, X.; Wei, L. Who is a good neighbor? Analysis of frontrunner cities with comparative advantages in low-carbon development. J. Environ. Manag. 2020, 269, 110804. [Google Scholar] [CrossRef]
  8. Gao, L.; Zhao, Z.; Li, C.; Wang, C. Factors facilitating the development of low-carbon cities: Evidence from China’s pilot cities. Heliyon 2022, 8, e11445. [Google Scholar] [CrossRef]
  9. Zhou, Q.; Cui, X.; Ni, H.; Gong, L. The impact of environmental regulation policy on firms’ energy-saving behavior: A quasi-natural experiment based on China’s low-carbon pilot city policy. Resour. Policy 2022, 76, 102538. [Google Scholar] [CrossRef]
  10. Gao, D.; Li, Y.; Li, G. Boosting the green total factor energy efficiency in urban China: Does low-carbon city policy matter? Environ. Sci. Pollut. Res. 2022, 29, 56341–56356. [Google Scholar] [CrossRef]
  11. Pan, X.; Li, M.; Wang, M.; Zong, T.; Song, M. The effects of a Smart Logistics policy on carbon emissions in China: A difference-in-differences analysis. Transp. Res. Part E Logist. Transp. Rev. 2020, 137, 101939. [Google Scholar] [CrossRef]
  12. Cerulli, G.; Ventura, M. TVDIFF: Stata module to compute pre-and post-treatment estimation of the Average Treatment Effect (ATE) with binary time-varying treatment. Stat. Softw. Compon. 2018, 11, S458384. [Google Scholar]
  13. Qiu, S.; Wang, Z.; Liu, S. The policy outcomes of low-carbon city construction on urban green development: Evidence from a quasi-natural experiment conducted in China. Sustain. Cities Soc. 2021, 66, 102699. [Google Scholar] [CrossRef]
  14. Beck, T.; Levine, R.; Levkov, A. Big bad banks? The winners and losers from bank deregulation in the United States. J. Financ. 2010, 65, 1637–1667. [Google Scholar] [CrossRef] [Green Version]
  15. Hu, J.-L.; Wang, S.-C. Total-factor energy efficiency of regions in China. Energy Policy 2006, 34, 3206–3217. [Google Scholar] [CrossRef]
  16. Wu, H.; Hao, Y.; Ren, S. How do environmental regulation and environmental decentralization affect green total factor energy efficiency: Evidence from China. Energy Econ. 2020, 91, 104880. [Google Scholar] [CrossRef]
  17. Hao, Y.; Gai, Z.; Wu, H. How do resource misallocation and government corruption affect green total factor energy efficiency? Evidence from China. Energy Policy 2020, 143, 111562. [Google Scholar] [CrossRef]
  18. Tone, K. Dealing with Undesirable Outputs in DEA: A Slacks-based Measure (SBM) Approach. GRIPS Res. Rep. Ser. 2004, 2004, 44–45. [Google Scholar]
  19. Sun, P.; Liu, L.; Qayyum, M. Energy efficiency comparison amongst service industry in Chinese provinces from the perspective of heterogeneous resource endowment: Analysis using undesirable super efficiency SBM-ML model. J. Clean. Prod. 2021, 328, 129535. [Google Scholar] [CrossRef]
  20. Chung, Y.H.; Färe, R.; Grosskopf, S. Productivity and undesirable outputs: A directional distance function approach. J. Environ. Manag. 1997, 51, 229–240. [Google Scholar] [CrossRef] [Green Version]
  21. Färe, R.; Grosskopf, S.; Lindgren, B.; Roos, P. Productivity Changes in Swedish Pharamacies 1980–1989: A Non-Parametric Malmquist Approach. J. Product. Anal. 1992, 3, 81–97. [Google Scholar] [CrossRef]
  22. Li, M.; Pan, X.; Yuan, S. Do the national industrial relocation demonstration zones have higher regional energy efficiency? Appl. Energy 2022, 306, 117914. [Google Scholar] [CrossRef]
  23. Liu, J.; Cheng, Z.; Zhang, H. Does industrial agglomeration promote the increase of energy efficiency in China? J. Clean. Prod. 2017, 164, 30–37. [Google Scholar] [CrossRef]
  24. Li, K.; Lin, B. Impacts of urbanization and industrialization on energy consumption/CO2 emissions: Does the level of development matter? Renew. Sustain. Energy Rev. 2015, 52, 1107–1122. [Google Scholar] [CrossRef]
  25. Sener, S.; Karakas, A.T. The effect of economic growth on energy efficiency: Evidence from high, upper-middle and lower-middle income countries. Procedia Comput. Sci. 2019, 158, 523–532. [Google Scholar] [CrossRef]
  26. Wang, H.; Wang, M. Effects of technological innovation on energy efficiency in China: Evidence from dynamic panel of 284 cities. Sci. Total. Environ. 2019, 709, 136172. [Google Scholar] [CrossRef]
  27. Moser, P.; Voena, A. Compulsory Licensing: Evidence from the Trading with the Enemy Act. Am. Econ. Rev. 2012, 102, 396–427. [Google Scholar] [CrossRef] [Green Version]
  28. Antonietti, R.; Fontini, F. Does energy price affect energy efficiency? Cross-country panel evidence. Energy Policy 2019, 129, 896–906. [Google Scholar] [CrossRef]
Figure 1. Spatial distribution of LCPCP Areas.
Sustainability 15 01857 g001
Figure 2. Research roadmap.
Sustainability 15 01857 g002
Figure 3. Parallel trend chart.
Sustainability 15 01857 g003
Figure 4. Nuclear density estimation chart of placebo test.
Sustainability 15 01857 g004
Table 1. Descriptive statistical analysis.
VariablesNMeansdMinMax
GTFEE36010.5160.2320.1522.397
FDI3601−2.9271.444−9.3890.367
GOV3601−1.7470.547−4.1761.799
EDU3601−4.6081.087−8.574−1.049
Rgdp360110.360.8156.38813.03
Citylevel3601−0.3310.621−3.8221.279
Gpat36012.5761.76808.828
TS360145.1015.350.090090.97
Table 2. Multiple collinearity analysis.
VariableVIF1/VIF
FDI1.400.712596
GOV1.720.580734
EDU1.610.619622
Rgdp1.690.591356
Citylevel1.040.957099
Gpat1.290.776812
TS1.400.713927
Mean VIF1.42
Table 3. Benchmark Regression Analysis.
(1)(2)(3)
VARIABLESGTFEEGTFEEGTFEE
treatit × timeit0.0319 **0.0279 **0.0217 *
(0.0125)(0.0142)(0.0122)
Constant0.513 ***−1.035 ***−0.558 **
(0.00408)(0.0976)(0.235)
Controlnoyesyes
City-Fenonoyes
Year-Fenonoyes
Observations360128763014
R-squared0.0020.1550.718
Note: ***, **, * respectively show that the relevant coefficient passes the significance test of 1%, 5% and 10%.
Table 4. Robustness Test.
(1)(2)
VARIABLESGTFEETE
treatit × timeit0.0217 *−0.133 ***
(0.0122)(0.0423)
Constant−0.558 **−13.10 ***
(0.235)(0.381)
Controlyesyes
City-Feyesyes
Year-Feyesyes
Observations30143014
R-squared0.7180.257
Note: ***, **, * respectively show that the relevant coefficient passes the significance test of 1%, 5% and 10%.
Table 5. Placebo test.
VariableObsMeanStd. Dev.MinMax
Coefficient10000.00040.0134−0.04670.0582
t-value1000−0.01161.0036−4.21053.6995
Table 6. PSM-DID regression results.
Nearest Neighbor MatchingRadius MatchingNuclear Matching
VARIABLESGTFEEGTFEEGTFEE
treatit × timeit0.0220 ***0.0220 ***0.0220 **
(0.0029)(0.0028)(0.0110)
Constant0.598 ***0.598 ***0.488 ***
(0.0087)(0.0084)(0.0321)
Controlyesyesyes
City-Feyesyesyes
Year-Feyesyesyes
Observations341334143601
R-squared0.6740.6740.674
Note: ***, ** respectively show that the relevant coefficient passes the significance test of 1%, 5% and 10%.
Table 7. Resource endowment and spatial heterogeneity analysis.
NRBCRBCERCRWR
VARIABLESGTFEEGTFEEGTFEEGTFEEGTFEE
treatit × timeit0.0252 *0.002940.0413 **−0.0254−0.00898
(0.0148)(0.0215)(0.0187)(0.0235)(0.0227)
Constant22.76 *−15.28 ***−3.0300.0886−15.31
(13.17)(5.090)(25,080)(18,118)(31.66)
Controlyesyesyesyesyes
City-Feyesyesyesyesyes
Year-Feyesyesyesyesyes
Observations1803121110981090826
R-squared0.7370.6850.7450.6560.702
Note: ***, **, * respectively show that the relevant coefficient passes the significance test of 1%, 5% and 10%.
Table 8. Inspection results of industrial structure path.
(1)(2)(3)
VARIABLESGTFEETSGTFEE
treatit × timeit0.0217 *−0.0165 *0.0207 *
(0.0122)(0.00940)(0.0122)
TS −0.0020 ***
(0.0007)
Constant−0.558 **1.218 ***−0.618 **
(0.235)(0.146)(0.241)
Controlyesyesyes
City-Feyesyesyes
Year-Feyesyesyes
Observations301430143014
R-squared0.7180.8790.719
Note: ***, **, * respectively show that the relevant coefficient passes the significance test of 1%, 5% and 10%.
Table 9. Inspection results of green technology innovation path.
(1)(2)(3)
VARIABLESGTFEEGpatGTFEE
treatit × timeit0.0217 *206.2 ***0.0139
(0.0122)(32.14)(0.0125)
Gpat 3.62 × 10⁻⁵ **
(1.67 × 10⁻⁵)
Constant−0.558 **1203 ***−0.491 *
(0.235)(246.9)(0.282)
Controlyesyesyes
City-Feyesyesyes
Year-Feyesyesyes
Observations301428942976
R-squared0.7180.7250.720
Note: ***, **, * respectively show that the relevant coefficient passes the significance test of 1%, 5% and 10%.
Table 10. Bootstrap test of green technology innovation.
ObservedBootstrap Normal-Based
Coef.Std. Err.zp > |z|[95% Conf. Interval]
_bs_10.01370.00314.460.000[0.0077,0.0199]
Disclaimer/Publisher’s Note: The statements, opinions and data contained in all publications are solely those of the individual author(s) and contributor(s) and not of MDPI and/or the editor(s). MDPI and/or the editor(s) disclaim responsibility for any injury to people or property resulting from any ideas, methods, instructions or products referred to in the content.