Article

The Collaboration Patterns of Institution during the COVID-19 Pandemic

1
The Institute of Cyberspace Security, Zhejiang University of Technology, Hangzhou 310023, China
2
Binjiang Cyberspace Security Institute of ZJUT, Hangzhou 310056, China
3
College of Information Engineering, Zhejiang University of Technology, Hangzhou 310023, China
4
The Computational Communication Research Center, Beijing Normal University, Zhuhai 519087, China
5
The School of Journalism and Communication, Beijing Normal University, Beijing 100875, China
*
Authors to whom correspondence should be addressed.
Sustainability 2023, 15(24), 16915; https://doi.org/10.3390/su152416915
Submission received: 2 November 2023 / Revised: 30 November 2023 / Accepted: 4 December 2023 / Published: 17 December 2023

Abstract

:
During the COVID-19 pandemic, scientific collaboration has profoundly influenced the sustainability of human science. The pandemic has exposed the fragility of the global health system, forcing various research institutions to cooperate more actively and giving rise to a pressing inquiry regarding its implications on the patterns of scientific institution collaboration. With this in mind, we investigate 2,252,016 scientific papers between 2019 and 2020 to study this issue from an institution cooperation view. Specifically, by proposing a novel weighted cooperation network and utilizing institution cooperation freshness, we investigate different collaboration patterns and strategies when institutions respond to the pandemic. The results show that the crisis generally promotes both fresh and stable cooperation relationships among institutions, and different fields (e.g., STEM and Humanities) demonstrate different collaboration patterns. During the pandemic, institutions with a strong influence have a variety of cooperation strategies, while institutions with a low influence prefer a conservative strategy. Moreover, institutions participating in COVID-19 research are very cautious in choosing partners, which may originate from the risk of cooperation, e.g., the fluctuation of influence, and the causal inference results also verify this conclusion. Overall, our study reveals the impact of the COVID-19 pandemic on scientific research work, which may pave the way for designing policy when other global crises occur again.

1. Introduction

The global emergence of COVID-19 has promoted unprecedented responses from the government [1], medical units [2], and scientific enterprises [3]. Scientists transcending national boundaries to exchange data, research outcomes, and best practices have expedited scientific progress. This collaborative spirit has propelled the rapid accumulation of scientific knowledge, fostering technological innovation. More than 200,000 COVID-19-related papers were estimated to be published from 2020 to 2021 [4,5]. Despite collaboration ensuring the sustainability of scientific research during the pandemic, COVID-19 has hindered offline work and forced people to work remotely or online [6]. To investigate the difference in cooperative patterns between the pre-COVID-19 and COVID-19 periods, especially from the scientific institution view, we analyze the scientific institution collaboration networks and Institution Cooperation Freshness (ICF) to understand how the scientific institutions have fostered sustainability by collaborating during the pandemic.
Collaboration is an essential scientific activity and plays an important role in academic research. The high benefits of collaboration (e.g., team collaboration produces more high-quality outputs and attracts more citations than individuals [7,8,9]) increase the number and size of team collaborations and become more and more dominant. Furthermore, the emergence of modern science’s large-scale and complex trend has forced researchers to expand their knowledge and share high-precision instruments, making collaborations the inevitable choice [10,11]. For example, more than 10,000 scientists and engineers from more than 100 countries work together at CERN to investigate nuclear research [12]. Additionally, the considerable knowledge capacity of big science also promotes the increasing scale of collaboration. Team collaborations possess enough different expertise to integrate novel combinations into acquainted areas of knowledge, effectively combining knowledge to promote the development of science [13,14,15]. However, while team collaborations can help scientists generate novel inspiration and hypotheses across disciplinary boundaries, collaboration’s time and energy costs must be addressed, which may outweigh the benefits of collaborative research [16,17]. Therefore, large and small cooperation are common behaviors in scientific activities because they each have their benefits. Wu et al. [18] have found that small teams disrupt science and technology as they explore and enrich promising ideas from more traditional and less popular research; in contrast, large teams engage in research based on recent research findings by solving known problems and improving existing designs. Collaboration also has a positive impact on junior scientists. For example, cooperating with elite scientists could positively impact junior scientists’ careers in the future, even if only once [19]. Junior scientists who receive guidance from expert mentors with a broad social and academic background in the early stage of their careers may tend to achieve success easier than others in the future [19], which also can help their mentors recruit talented students [20,21]. Moreover, stable and long-term collaboration with elite scientists could effectively improve the output of the results and the citation of the papers [22]. In summary, collaboration allows scientists in different fields to share responsibilities and risks, gain complementary knowledge, accumulate academic experience, and facilitate the communication of knowledge and experience, which becomes a primary way to promote the sustainability of scientific research [23,24].
The COVID-19 pandemic has affected many aspects of human life and work [25], which has prompted global collaborations to respond to the urgency of this pandemic, e.g., diagnosis, vaccine and treatment development, viral genome sequencing, clinical experiments, and more. In academics, COVID-19-related works usually receive more attention. Aviv-Reuven et al. [26] found that in biomedical, the average time to acceptance of COVID-19-related papers is significantly reduced and there is an exponential increase in the number of COVID-19-related papers published and cited. However, many scientists have encountered negative impacts during the COVID-19 pandemic. Myers et al. [27] found that during the COVID-19 pandemic, female scientists and scientists engaged in “bench science” spent significantly less time on scientific research, and the phenomenon is more serious for scientists with children [28]. Similarly, the COVID-19 pandemic is not friendly to junior scientists. Any prolonged interruption in early career for junior scientists can lead to serious consequences, such as hindering their ability to complete the research program they have proposed and potentially jeopardizing their chances of acquiring future employment [6,29].
However, crises often contribute to changes because they can disrupt the current status. To quickly address the COVID-19 crisis, scientists tend to rely on fewer team members and less international collaboration to reduce communication costs and speed up the research and collaboration [30]. Research during COVID-19 has fostered multidisciplinary collaborations across various fields, bridging barriers between disciplines and spurring innovative partnerships [31,32,33]. Therefore, in-depth research into scientific cooperation patterns during the COVID-19 pandemic contributes to an enhanced comprehension of diverse institutional collaborative approaches, thereby facilitating the sustainable development of human science [34]. This comprehension supports the dissemination of best practices, improvement of collaboration, and efficient resource allocation and furnishes a robust foundation for policymaking to promote progress and sustainability in the realm of science.
In this work, we aim to study the impact of the COVID-19 pandemic on the collaboration of scientific institutions. Specifically, the pre-pandemic year of 2019 and the pandemic year of 2020 serve as distinct periods for comparison. We investigate the evolution of the institution collaboration network across different pandemic stages and propose a novel weighting method to quantify the attention paid to institution cooperation. Furthermore, by utilizing ICF, we investigate the institutions’ collaboration strategies and analyze how these strategies (i.e., ICF) vary across different fields and whether institutions participated in COVID-19-related research. Finally, we explore the causal relationship between institution collaboration strategies (i.e., ICF) and the fluctuation of institutions’ influence in the cooperation network during the pandemic.
The rest of this work is organized as follows. Section 2 introduces the dataset and method. Section 3 constructs institution cooperation networks and investigates the institution collaboration patterns with/without the pandemic, the causal relationship between institution collaboration strategies (i.e., ICF), and the fluctuation of institutions’ influence in the cooperation network during the pandemic. Finally, the conclusion and discussion are given in Section 4.

2. Data and Methods

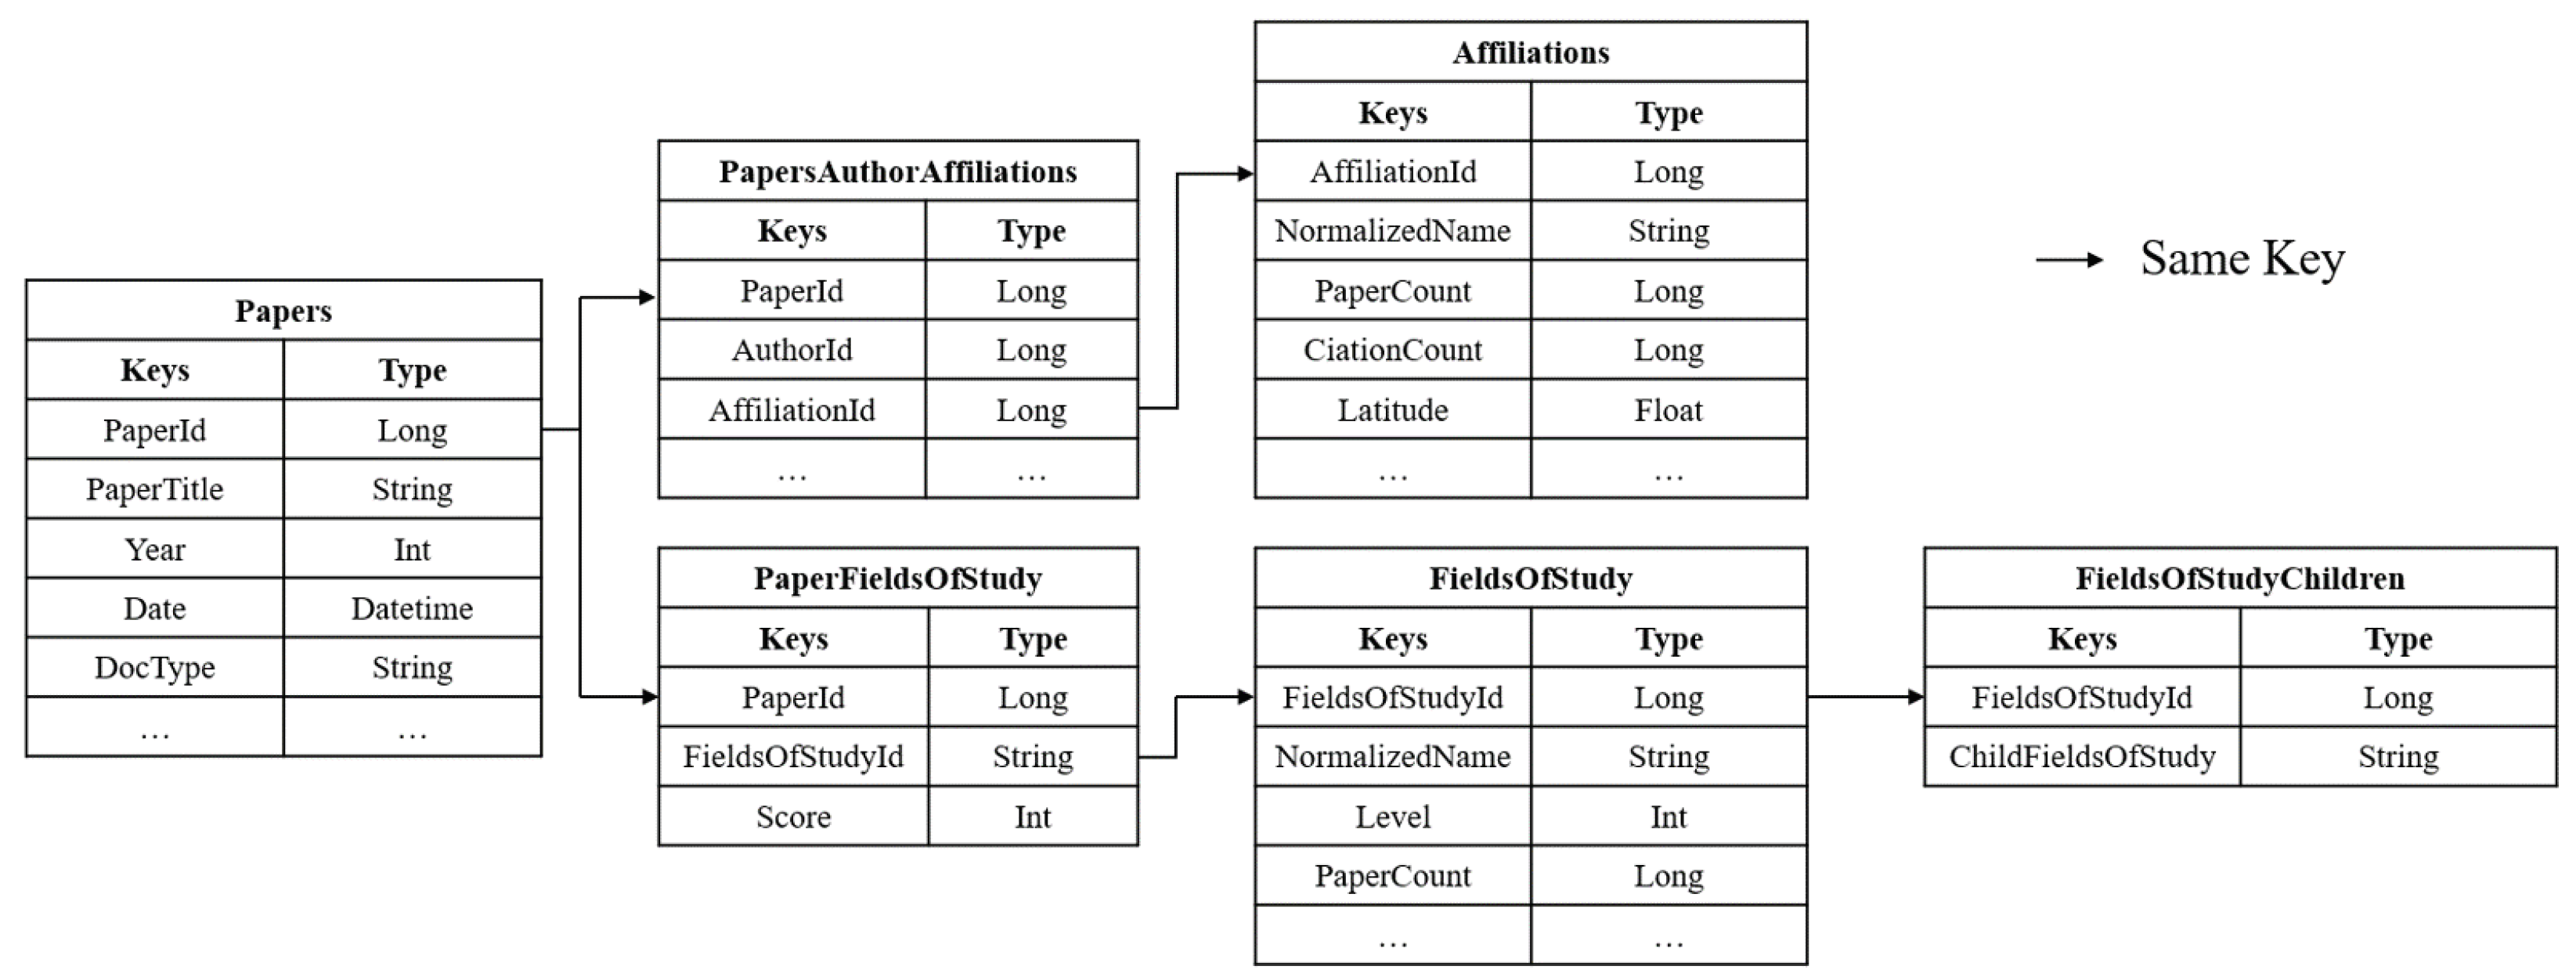
2.1. Data Description

This work employs the Microsoft Academic Graph (MAG) to obtain the cooperation and institution data. MAG is one of the largest open-source citation databases and contains 209 million documents, including journal and conference papers, books, patents, etc. [35,36]. As shown in Figure 1, our study includes six distinct data tables sourced from the MAG database, namely Papers, PapersAuthorAffiliations, PaperFieldsOfStudy, Affiliations, FieldsOfStudy, and FieldsOfStudyChildren. The essential attributes associated with authorship, affiliation, affiliation name, publication year, document type, and field of study information of each paper are refined and consolidated by utilizing the unique keys (e.g., PaperId). Furthermore, this work only considers 2,252,016 journal papers published from 2019 to 2020, including 1,050,861 papers in 2019 and 1,201,155 papers in 2020. Moreover, our study uses the field information (FoS) of the MAG dataset to classify journal papers. Specifically, MAG uses a hierarchical topic model to identify and allocate research fields, including more than 700,000 research topics and 6 hierarchies (from L0 to L5). Each paper could be allocated one or more specific research topics, and each topic has a corresponding score. According to the score, we allocate research topics to each paper, where the topic score threshold equals 0.3. Moreover, L1–L5 research topics are mapped to L0, which leads to a total of nineteen fields in the datasets.
Additionally, papers published in 2020 are classified into 2 groups according to whether the title contains keywords related to COVID-19, i.e., related or unrelated to COVID-19 research, which includes 4422 papers related to COVID-19 and 1,196,733 papers related to non-COVID-19. The keywords include “COVID”, “COVID-19”, “Coronavirus”, “2019-nCoV”, “SARS-CoV”, “MERS-CoV”, “Severe Acute Respiratory Syndrome”, and “Middle East Respiratory Syndrome”.

2.2. Institution Cooperation Network

The scientific cooperation network is a network that forms naturally during scientific research. It is widely used to study the formation and evolution of collaboration [37,38,39], the measurement of contribution in cooperation [40,41], the influence of cooperative team composition on scientific research performance [18,42], predicting the possible coauthors for scientists [43], etc. In the scientific cooperation network, nodes represent cooperators and links represent cooperation relationships [44]. However, most studies focus on unweighted networks, only considering whether a relationship exists, which means these networks cannot to reveal essential underlying details, such as the number of cooperation [44] and the cumulative contribution of cooperators [45]. Thus, link weights are often required to describe the cooperation network in more detail. For example, if two authors co-authored n papers, there is a link between them, and the weight is n, which can describe the number of cooperation. For cumulative contribution, if a paper has k cooperators, there are links among k cooperators, and the weight is 1 / ( k 1 ) for each link. This weight (contribution) will increase with the increase of cooperation time. The cooperation time represents the number of cooperation between institutions during a certain period. However, these weighted networks assume that the contributions of all cooperators are consistent. When considering that the cooperator is a larger subject, such as an institution, then differences in the number of participants will lead to heterogeneity in the institution’s contribution and the impact among institutions. For example, consider a scenario where two institutions, A and B, collaborate on a research paper. If institution A has only one author involved, while institution B has three authors, then the attention of institution B would be greater than that of institution A in this paper.
To address this issue, we propose a new weighted approach inspired by effective distance [46], which considers the difference in attention caused by different numbers of participants from institutions. By denoting the institution’s attention in each paper as A T T and the maximum probability of the institution’s shift attention as P, the weight from one institution to another can be calculated as Equations (1)–(3).
W A , B = n = 1 k A T T A i · P A , B i
A T T A i = N A i N i
P A , B i = N B i N i N A i
where A, B represent different institutions, N i is the author number of paper i, k is the number of cooperative papers, N i is the author number of paper i, and N A i ( N B i ) is the number of authors who belongs to institution A ( B ) in paper i. A T T A i is the total attention of institution A in paper i, which is calculated as Equation (2). Moreover, P A , B i is the proportion of institution B in paper i except institution A. If the possibility of institution A attention shifting to institution B (i.e., P A , B i ) is small, this implies that institution A pays little attention to institution B. In other words, institution A has little impact on institution B. Note that W A , B W B , A , for example, if institution A and B only cooperate with one paper, while institution A has a large fraction of participants. In this situation, W A , B is large because institution A pays more attention than institution B. However, W B , A is small, as only a small fraction of participants participate in this paper.

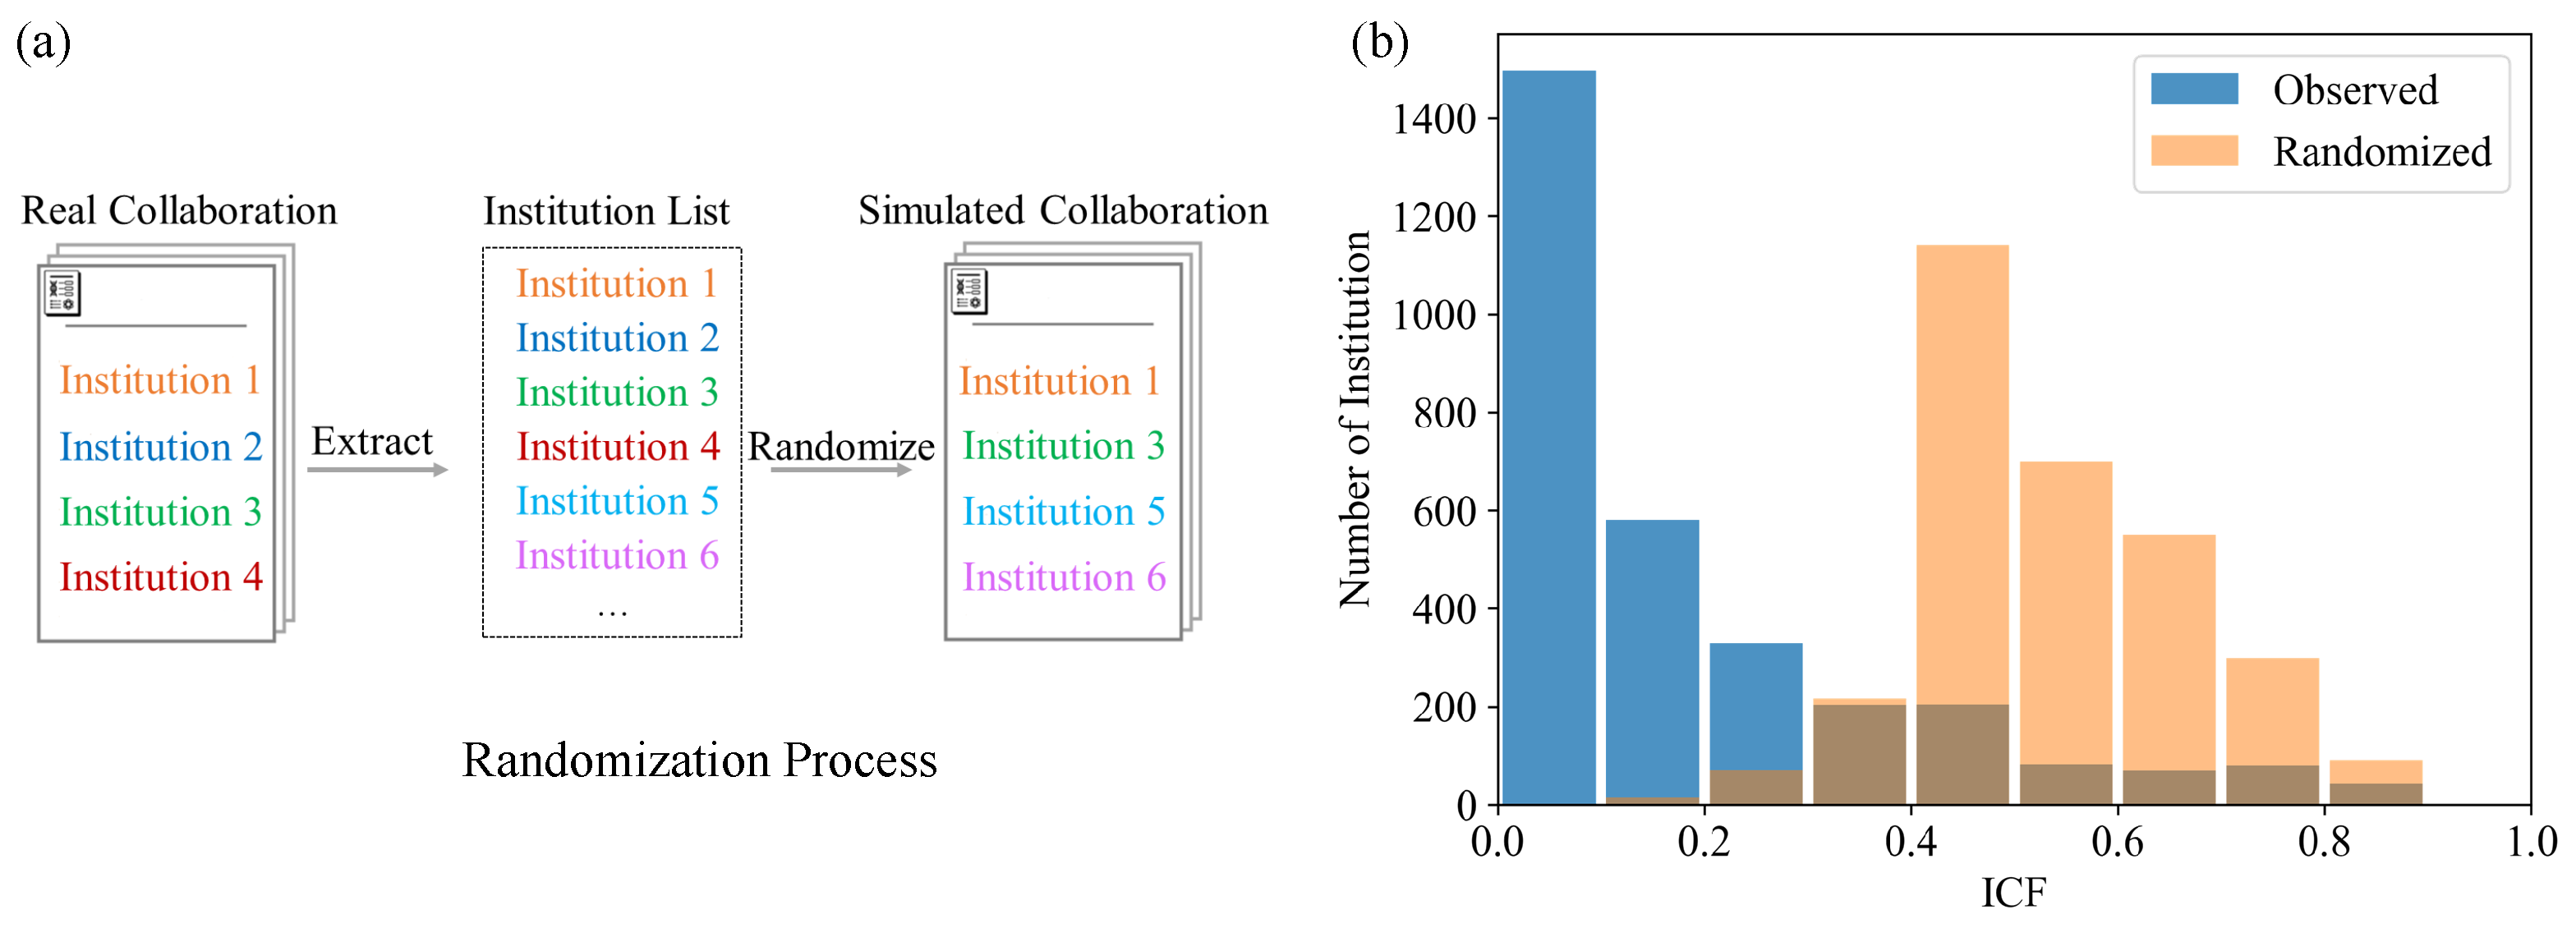
2.3. Institution Cooperation Freshness (ICF)

Freshness is originally from measuring the impact of individuals on the team [47], defined as the proportion of team members who have yet to cooperate with other team members before current cooperation. In this work, we extend the concept of freshness from authors to their affiliated institutions and calculate the freshness of institutions. Specifically, considering the institution as the basic unit and setting the time window as one month, we construct the scientific cooperation network and calculate the cooperation freshness of each scientific institution. The ICF is defined as the proportion of new institutions among all cooperation institutions of an institution in the current month, as shown in Equation (4):
I C F = N I C N I L I C N I C
where I C is the set of institutions that cooperate in the current time window, I L is the set of institutions that cooperated in the last time window, and I L I C is the set of institutions that cooperate with other team members both in the current and last time window. N is the number of the set.
We employ ICF to measure the institution’s collaboration pattern. As shown in Figure 2, the blue dotted line indicates collaboration in the current time window, and the black solid line indicates collaboration in the last time window. Figure 2a suggests that the institution A (orange) collaborated with the institutions B and C (gray) in the last time window and the current time window, thus, the ICF is ( 2 2 ) / 2 = 0 . In Figure 2b, the institution A (orange) did not collaborate with the institution D (blue) in last time window, which causes the ICF to be ( 3 2 ) / 3 = 1 3 . In Figure 2c, the institution A (orange) did not collaborate with any institution in the last time window, so the ICF is ( 3 0 ) / 3 = 1 . In our work, there is a total of 1,201,155 papers and a total of 18,568 institutions during the period of the pandemic (2020).

2.4. Causal Inference

Randomized trials are regarded as the gold standard for evaluating causal relationships. The samples are usually divided into treatment and control groups, and the difference in performance between the two groups of samples can be considered as “treatment effect” [48]. In statistics, randomization ensures that two groups are homogeneous from the same population so that the potential interferences are the same, which theoretically excludes the influence of all potential factors and satisfies the independence assumption. However, randomization is an idealized research method rarely used in practice. In most cases, the differences in treatment effects are due to the observable features of individuals. Thus, treatment effects can be estimated by eliminating the differences in observable individual features in practice.
Matching is an intuitive way to estimate treatment effects by finding the untreated individuals with the same observable features as the treated individuals, then estimating the treatment effects by comparing the differences in the observation results. In 1983, Rosenbaum and Rubin [49] proposed Propensity Score Matching (PSM), which transforms multidimensional variables into a one-dimensional propensity score through a function transformation and then matches samples according to the propensity score. However, the propensity match score has a disadvantage, requiring the treatment variable to be a discrete binary variable. To overcome this limitation, Imbens and Hirano [50] proposed Generalized Propensity Score Matching (GPSM), which could estimate the treatment effect of continuous variables [51].
Since the treatment variable in our study (i.e., ICF) is a continuous variable, we employ the GPSM method in causal inference to explore the causal relationship between institution collaboration strategies (i.e., ICF) and the fluctuation of institutions’ influence in the cooperation network during the pandemic. Here, the fluctuation of institutions’ influence in the cooperation network refers to the difference in PageRank of each institution in the institution cooperation network in 2020 and 2019. GPSM requires three kinds of variables, named the treatment variable, the independent variable, and the covariate (also named the control variable or the matching variable). Furthermore, causal analysis requires that covariates and treatment variables must be independent of each other. Therefore, we selected the three kinds of variables as shown in Table 1. The evaluation model can be expressed as:
D p a g e r a n k = μ + 20 + β 1 p a p e r 19 + β 2 p a p e r 20 + β 3 o r g t i m e + β 4 m e m b e r + β 5 d i s t a n c e + ε
where μ is the intercept, α are the coefficients of the treatment variable, β i are the coefficients of the control variables, and ε is the unobservable variable.

3. Results

3.1. Institutions Cooperation Network Analysis

Taking 2020 as a critical year for the pandemic outbreak, we construct institution cooperation networks for the pre-outbreak (2019) and the spread of the pandemic (2020). The node represents the scientific institution, and the link represents the cooperation relationship if two scientific institutions coauthor in one paper. Table 2 demonstrates the basic attributes of institution cooperation networks for 2019 and 2020. As shown in Table 2, compared to 2019, the number of institutions in the 2020 cooperation network has increased by 235, with a growth rate of 1.2%, and the number of new cooperative relationships has increased by 561,026, with a growth rate of 19.4%, which indicates that some institutions are trying to start new cooperative relationships during COVID-19 to generate novel ideas [31]. In Figure 3, we demonstrate scientific institutions’ distribution of cooperation frequency before and during COVID-19. As shown in Figure 3, compared to 2019, cooperation frequency increased in 2020 both in low and high cooperation times, implying that COVID-19 affects cooperation, making cooperation between institutions closer and associated with some new cooperative relationships.
As mentioned in Section 2.2, the difference between the number of authors from various institutions in a paper may cause heterogeneity in the institutions’ contribution. Thus, we construct direct and weighted institution cooperation networks in 2019 and 2020 and visualize them in Figure 4. Figure 4 only demonstrates the top 50 institutions with high PageRank scores (Kendall’s tau coefficient = 0.69, p = 0.00). PageRank can represent the influence of institutions in the cooperation network. The top 10 institutions we mark with their names. The color of nodes presents the PageRank scores; the redder the node color is, the higher the PageRank of the institution is in the network. The color of edges presents our proposed weight. Similarly, the redder the edge is, the higher the weight of the cooperative relationship is in the network. Comparing the cooperation network in 2019 and 2020 (Figure 4a,b), the red edges in the collaboration network of 2020 have significantly increased, mainly from low-degree nodes to high-degree nodes, implying institutions prefer to pay more attention to top institutions and deepen their cooperation during the pandemic.

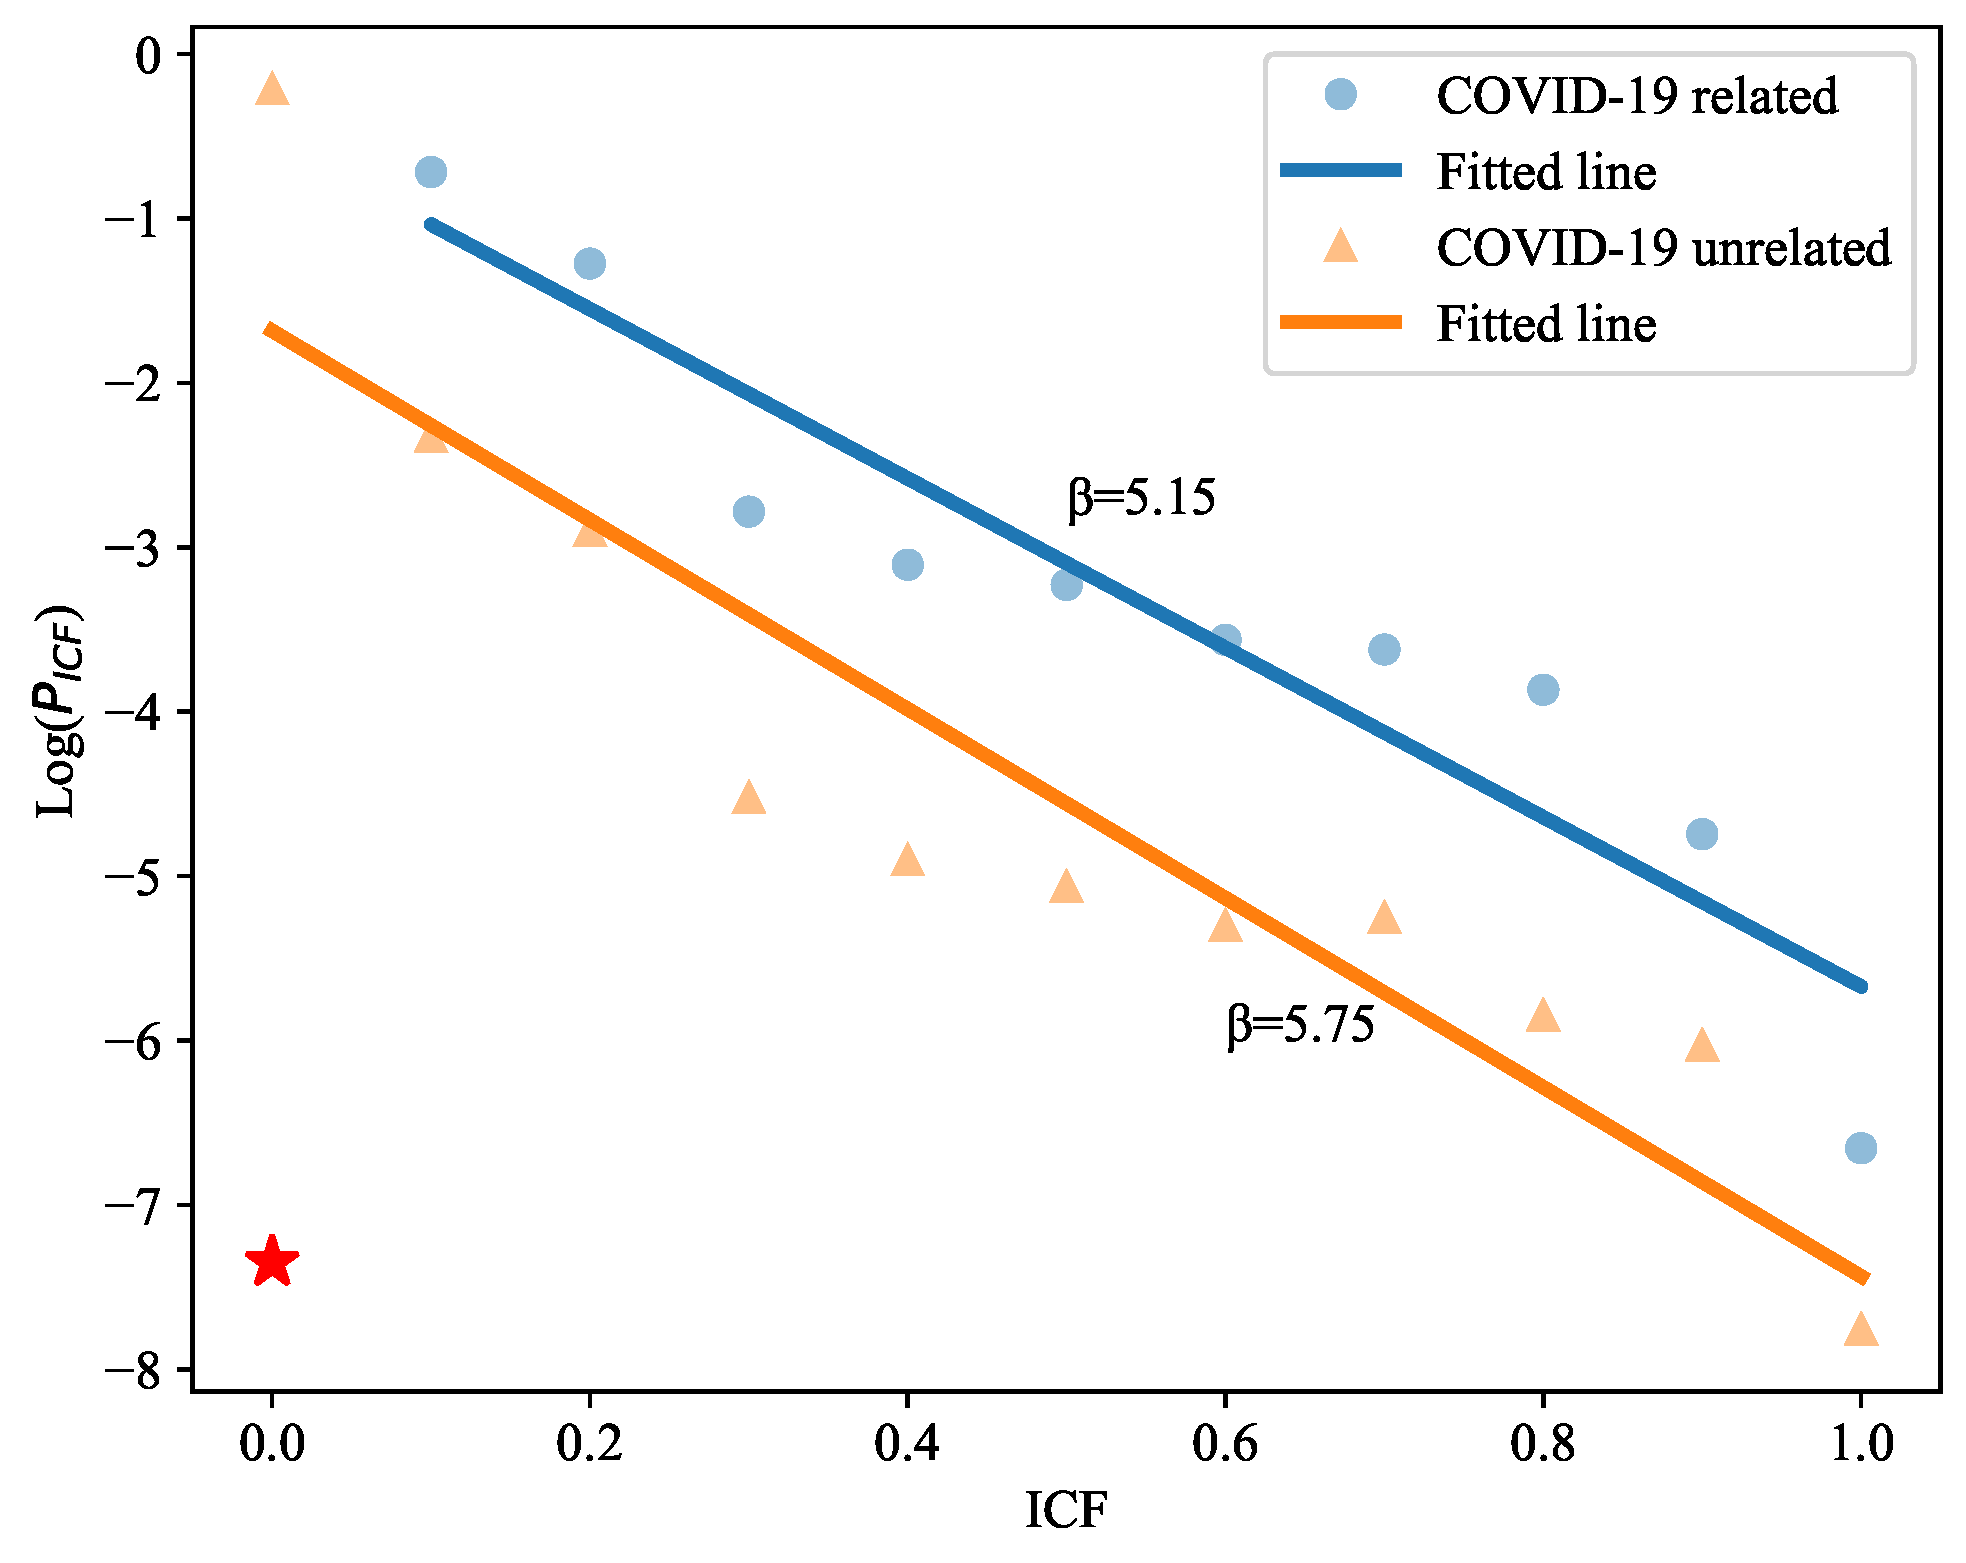
3.2. Institution Cooperation Freshness Analysis

Constructing cooperation networks could reveal the collaboration strategies of institutions during the pandemic, such as how they choose collaborators. To depict the cooperation in more detail, especially the choice when faced with new collaborative partners, we utilize ICF to measure the institutions’ cooperative patterns and strategies (i.e., ICF) and plot Figure 5 to investigate attitudes of institutions with different influences in the network towards new partners. Figure 5 demonstrates the relationship between institution influence and ICF, where institutions are divided into four groups (0–25%, 25–50%, 50–75%, 75–100%) according to their PageRank scores in the cooperation network (i.e., 2019 and 2020 weighted institution cooperation networks).
The range of ICF is [0,1], where one indicates that the institution’s collaborators are all new and zero indicates that the institution has no new collaborators. As shown in Figure 5, institutions with the highest influence (top 25% PageRank) exhibit the largest dispersion of ICF, suggesting that institutions with a strong influence have a variety of cooperation strategies (i.e., ICF), including conservative cooperation strategies (small ICF) to establish efficient output with stable collaborators and aggressive cooperation strategies (large ICF) to establish innovative cooperation with new collaborators.
Conversely, institutions with the lowest influence (75–100%) exhibit the smallest dispersion of ICF, suggesting that these institutions are more conservative in choosing new collaborators. However, the median ICF of the top 25% institutions is not the highest, i.e., institutions in the 25–50% influence interval have the highest median of ICF among all intervals. Overall, the ICF > 0 in most intervals indicates a general trend of institutions selecting a certain proportion of new collaborators. Additionally, the median of ICF fluctuated around 0.5, implying that institutions prefer to keep a balance between offering new ideas and ensuring efficient and effective collaboration. Furthermore, comparing to the ICF in 2019, it is obvious that the medians of ICF decreased in 2020, indicating that although the new cooperative relationships increased in 2020 (Figure 3), the institutions became more cautious when selecting new collaborators in every cooperation due to the impact of the pandemic.
To explore the pattern of institutions towards choosing new partners during the pandemic (2020), Figure 6a demonstrates the overall distribution of ICF in 2020. As shown in Figure 6a, few institutions have ICF = 1, indicating that institutions are very cautious when forming a new team with institutions they have not cooperated with recently. Furthermore, the overall distribution of ICF is bimodal. The first peak suggests that institutions are more willing to choose familiar collaborators for further cooperation to reduce the cost and risk of cooperation and communication, e.g., continuously cooperating for large projects. The second peak suggests that some institutions long for innovation and hope new cooperation could bring changes when pursuing innovative outcomes.
How do scientific collaboration patterns vary across fields? To answer the question, we divide the dataset into nineteen groups by the fields involved in each paper according to the information provided by the MAG dataset, then build scientific research cooperation networks of institutions in various fields, and further calculate and perform statistics for the distribution of ICF in various fields, as shown in Figure 6b–t. The results demonstrate that the scientific institution collaboration patterns are diverse in fields. For example, STEM, especially biology (Figure 6c), computer science (Figure 6f), engineering (Figure 6h), and medicine (Figure 6o) are more prone to a bimodal distribution. By contrast, bimodal distributions disappear in the Humanities fields, such as art (Figure 6b) and history (Figure 6l), demonstrating right-skewed distributions. Compared to the fields of STEM, in the field of Humanities, institutions prefer to study alone or cooperate with fewer new collaborators, which results in small ICF. In contrast, in the field of STEM, research projects often involve large precision computing instruments or expensive experimental materials that small institutions cannot afford, motivating these institutions to seek cooperation to achieve win-win and results in large ICF.
Although institutions and fields exhibit diverse collaboration patterns and strategies (i.e., ICF), it is still unclear which collaborative strategies institutions will choose regarding COVID-19-related research. To address this question, we divide papers published in 2020 into COVID-19 (4422) and non-COVID-19 (1,196,733) groups, where the papers related to COVID-19 are identified by the keywords of the pandemic (Section 2.1). We first check the distribution of ICF in two groups. As shown in Figure 7, all two distributions follow an exponential distribution, i.e., P I C F = e β I C F + μ , where β represents the decay rate and μ is the intercept. The blue dot and orange triangle represent the ICF’s probability of COVID-19 and non-COVID-19 groups, respectively. The fitted decay exponents are β = 5.15 and 5.75 , respectively. The exponential distributions of the two groups suggest that there is a decay pattern in choosing more new collaborators in each collaboration. Furthermore, as shown in Figure 7, the probability of ICF in the COVID-19-related group (blue) is always above the non-COVID-19 group (orange) except ICF = 0, implying that institutions participating in COVID-19 research prefer to bring new collaborators into cooperation than those participating in non-COVID-19 research. Specifically, institutions engaging in non-COVID-19 research during the pandemic demonstrate a propensity for selecting familiar collaborators to foster ongoing collaborations, as evidenced by a higher probability of institutions with ICF = 0. In contrast, institutions participating in COVID-19 research tend to form new partnerships, leading to a lower probability of institutions with ICF = 0 (red star), i.e., only two institutions. This may be because the limitation of COVID-19 resources motivates collaboration among the institutions to obtain the available resources for generating innovative solutions. Moreover, we utilize Propensity Score Matching (PSM) to verify that institutions participating in COVID-19 research prefer to choose new collaborators than those not participating in pandemic research, and the result demonstrates that institutions participating in COVID-19-related research exhibit a higher level of ICF with a statistically significant difference of 0.052 (Table 3).
Finally, we design a randomization experiment to verify whether ICF could measure institution cooperation patterns and strategies (i.e., ICF). Specifically, we keep the number of collaborators in each paper unchanged, randomly disrupt the collaborative relationships, and then calculate the ICF, with the randomization process as shown in Figure 8a. The result demonstrates that the ICF of COVID-19-related institutions shows a normal distribution after randomizing the collaborative relationships. In contrast, the observed data show an exponential distribution in Figure 8b, which indicates that ICF performs well and is effective at measuring institution collaboration patterns and strategies. In summary, although COVID-19 has promoted new cooperation relationships between institutions (Section 3.1), the strategies of scientific research institutions in selecting cooperation collaborators are still very cautious, which may be due to the unknown risk of cooperation during the pandemic (Section 3.2).

3.3. Causal Inference

To explore the causal relationship between institution collaboration strategies (i.e., ICF) and the fluctuation of institution influence during the pandemic, we employ the GPSM method. The first step in computing the Generalized Propensity Scores (GPS) is to estimate the conditional distribution of the treatment variable using covariates. In this study, the Fractional Logit model is employed to estimate the conditional distribution of ICF (2020), and the estimated coefficients from the treatment model are shown in Table 4.
As shown in Table 4, each covariate is significant, indicating that the treatment model and covariates selections are reasonable. In addition, the GPS can be calculated after estimating the conditional distribution of ICF through the Fractional Logit model. Note that the conditional independence assumption is inherent in the GPSM; by controlling the GPS, the independence level at any treatment level and the actual treatment level are mutually independent. Furthermore, we have checked the balancing property. Specifically, we divide the institution into ten intervals based on the treatment variable (i.e., ICF). For the five covariates, we investigate the balance by checking whether the mean in one of the ten treatment groups is different from the mean in the other nine treatment groups adjusted for the GPS. By those measures, we obtain a good balance for most data, which means that institutions with different ICFs are similar in the condition of GPS. It should be noted that we could not make clear that they have similar unobservable variables. Figure 9 demonstrates the dose-response functions for the relationship between the institution collaboration strategies (i.e., ICF) and the fluctuation of institution influence during the pandemic, which suggests that institutions with larger ICF have a larger fluctuation of influence, meaning that they have a higher probability of facing opportunities and risks brought about by cooperation.

4. Conclusions and Discussion

Our work investigates the impact of the COVID-19 pandemic on scientific institution collaboration based on 2,252,016 scientific papers published between 2019 and 2020. Firstly, we construct institution cooperation networks by a new weighted method to statistically study the differences in institution cooperation patterns with/without the pandemic. The result is evidence that the COVID-19 pandemic affects cooperation, making cooperation between institutions closer and associated with new cooperative relationships. Moreover, we employ the ICF to explore the strategies of institutions toward choosing new partners during the pandemic. The results demonstrate that institutions have become more cautious when selecting cooperation collaborators in every cooperation due to the impact of the pandemic. Additionally, we observe different collaboration patterns in different fields and whether institutions participated in COVID-19-related research. Finally, the GPSM is used to explore the causal relationship between institution collaboration patterns and strategies (i.e., ICF) and the influence of institutions during the pandemic. The GPSM result indicates that the institutions with larger ICF have a larger fluctuation of influence, which means they have a higher probability of facing opportunities and risks brought about by cooperation.
Our study reveals the collaboration patterns of scientific institutions during the COVID-19 pandemic. As the COVID-19 pandemic wanes, it remains crucial to examine how institutions have managed to surmount the obstacles posed by the pandemic through collaboration, which presents a unique opportunity to analyze the collaboration patterns employed to mitigate the pandemic’s impact on scientific research. Firstly, such analyses not only created a bridge between data evidence in research and public health but also offered valuable experiential guidance for future responses to other global issues, such as climate change and biodiversity loss. Secondly, the pandemic has spurred tighter scientific collaboration, accelerating the rapid accumulation of scientific knowledge, promoting technological innovation, and preparing for future health crises. Additionally, research collaboration has facilitated the efficient allocation of resources. Research institutions from different countries and regions can collaborate, sharing research costs and avoiding resource wastage. This form of collaboration not only contributes to ensuring the sustainability of scientific research but also better caters to the needs of the global society.
However, there are still limitations in our study. For example, the time window is short, i.e., our study duration is limited to two years, and the source only covers the journal papers, i.e., institution collaboration relationships are only from the journal papers. Thus, future research with different data sources and a long time window is warranted to explore the long-term impact of the COVID-19 pandemic on scientific collaboration. Additionally, other factors, such as different collaboration policies between countries during the pandemic and the lag of scientific research cooperation, are not accounted for in this study and could potentially influence the observed effects. Moreover, external factors such as the talent crisis arising from the sudden demise of senior scientists, the possible economic recession leading to funding shortages and wage stagnation, and the broader societal context of a loss of faith in science were not considered in our analysis. The inclusion of these factors in future research endeavors is essential for cultivating a more nuanced and holistic understanding of the intricate dynamics shaping research collaborations in the aftermath of the COVID-19 pandemic.
In conclusion, our study provides valuable insights into scientific institution collaboration patterns during the COVID-19 pandemic. These findings highlight that when people respond to a crisis, there is an increased tendency for human beings to seek more cooperation rather than less, and such cooperation has a positive impact on the sustainability of human science. This cooperative pattern furnishes a beneficial paradigm, encouraging scientists to enhance their collaboration in the face of global challenges, collectively advancing the forefront of science and seeking solutions to the challenges faced by humanity.

Author Contributions

Conceptualization, C.F., X.L., Y.M., Q.X. and S.Y.; methodology, C.F. and X.L.; validation, C.F. and X.L.; formal analysis, C.F. and X.L.; investigation, C.F. and X.L.; resources, X.L.; data curation, X.L.; writing—original draft preparation, C.F. and X.L.; writing—review and editing, C.F., Y.M., Q.X. and S.Y.; visualization, X.L.; supervision, C.F., Y.M., Q.X. and S.Y.; project administration, C.F., Y.M., Q.X. and S.Y.; funding acquisition, Y.M., Q.X. and S.Y. All authors have read and agreed to the published version of the manuscript.

Funding

This work was funded by the Key R&D Program of Zhejiang under Grant (2022C01018), the National Natural Science Foundation of China under Grant (62103374, U21B2001, 61973273), the Zhejiang Provincial Natural Science Foundation of China under Grants (LGF21G010003), and the National Key Research and Development Program of China under Grant (2020YFB1006104).

Institutional Review Board Statement

Not applicable.

Informed Consent Statement

Not applicable.

Data Availability Statement

The data presented in this study are available on request from the corresponding author.

Conflicts of Interest

The authors declare no conflict of interest.

References

  1. Falavigna, G.; Ippoliti, R. Relief Policy and the Sustainability of COVID-19 Pandemic: Empirical Evidence from the Italian Manufacturing Industry. Sustainability 2022, 14, 15437. [Google Scholar] [CrossRef]
  2. Bojdani, E.; Rajagopalan, A.; Chen, A.; Gearin, P.; Olcott, W.; Shankar, V.; Cloutier, A.; Solomon, H.; Naqvi, N.Z.; Batty, N.; et al. COVID-19 pandemic: Impact on psychiatric care in the United States. Psychiatry Res. 2020, 289, 113069. [Google Scholar] [CrossRef]
  3. Lee, J.J.; Haupt, J.P. Scientific globalism during a global crisis: Research collaboration and open access publications on COVID-19. High. Educ. 2021, 81, 949–966. [Google Scholar] [CrossRef]
  4. Ioannidis, J.P.; Salholz-Hillel, M.; Boyack, K.W.; Baas, J. The rapid, massive growth of COVID-19 authors in the scientific literature. R. Soc. Open Sci. 2021, 8, 210389. [Google Scholar] [CrossRef] [PubMed]
  5. Ioannidis, J.P.; Bendavid, E.; Salholz-Hillel, M.; Boyack, K.W.; Baas, J. Massive covidization of research citations and the citation elite. Proc. Natl. Acad. Sci. USA 2022, 119, e2204074119. [Google Scholar] [CrossRef]
  6. Yang, L.; Holtz, D.; Jaffe, S.; Suri, S.; Sinha, S.; Weston, J.; Joyce, C.; Shah, N.; Sherman, K.; Hecht, B.; et al. The effects of remote work on collaboration among information workers. Nat. Hum. Behav. 2022, 6, 43–54. [Google Scholar] [CrossRef] [PubMed]
  7. Wuchty, S.; Jones, B.F.; Uzzi, B. The increasing dominance of teams in production of knowledge. Science 2007, 316, 1036–1039. [Google Scholar] [CrossRef]
  8. Larivière, V.; Gingras, Y.; Sugimoto, C.R.; Tsou, A. Team size matters: Collaboration and scientific impact since 1900. J. Assoc. Inf. Sci. Technol. 2015, 66, 1323–1332. [Google Scholar] [CrossRef]
  9. Fu, C.; Luo, H.; Liang, X.; Min, Y.; Xuan, Q.; Chen, G. Mutual Influence in Citation and Cooperation Patterns. IEEE Trans. Comput. Soc. Syst. 2023, in press. [Google Scholar] [CrossRef]
  10. Haeussler, C.; Sauermann, H. Division of labor in collaborative knowledge production: The role of team size and interdisciplinarity. Res. Policy 2020, 49, 103987. [Google Scholar] [CrossRef]
  11. Zeng, A.; Fan, Y.; Di, Z.; Wang, Y.; Havlin, S. Impactful scientists have higher tendency to involve collaborators in new topics. Proc. Natl. Acad. Sci. USA 2022, 119, e2207436119. [Google Scholar] [CrossRef] [PubMed]
  12. Fortunato, S.; Bergstrom, C.T.; Börner, K.; Evans, J.A.; Helbing, D.; Milojević, S.; Petersen, A.M.; Radicchi, F.; Sinatra, R.; Uzzi, B.; et al. Science of science. Science 2018, 359, eaao0185. [Google Scholar] [CrossRef] [PubMed]
  13. Uzzi, B.; Mukherjee, S.; Stringer, M.; Jones, B. Atypical combinations and scientific impact. Science 2013, 342, 468–472. [Google Scholar] [CrossRef] [PubMed]
  14. Fu, C.; Yue, X.; Shen, B.; Yu, S.; Min, Y. Patterns of interest change in stack overflow. Sci. Rep. 2022, 12, 11466. [Google Scholar] [CrossRef]
  15. Xu, F.; Wu, L.; Evans, J. Flat teams drive scientific innovation. Proc. Natl. Acad. Sci. USA 2022, 119, e2200927119. [Google Scholar] [CrossRef]
  16. Fronczak, A.; Mrowinski, M.J.; Fronczak, P. Scientific success from the perspective of the strength of weak ties. Sci. Rep. 2022, 12, 5074. [Google Scholar] [CrossRef]
  17. Fu, C.; Luo, H.; Liang, X.; Yu, S. The profit and risk in the interdisciplinary behavior. Front. Phys. 2023, 11, 1107446. [Google Scholar] [CrossRef]
  18. Wu, L.; Wang, D.; Evans, J.A. Large teams develop and small teams disrupt science and technology. Nature 2019, 566, 378–382. [Google Scholar] [CrossRef]
  19. Li, W.; Aste, T.; Caccioli, F.; Livan, G. Early coauthorship with top scientists predicts success in academic careers. Nat. Commun. 2019, 10, 5170. [Google Scholar] [CrossRef]
  20. Liénard, J.F.; Achakulvisut, T.; Acuna, D.E.; David, S.V. Intellectual synthesis in mentorship determines success in academic careers. Nat. Commun. 2018, 9, 4840. [Google Scholar] [CrossRef]
  21. Ma, Y.; Mukherjee, S.; Uzzi, B. Mentorship and protégé success in STEM fields. Proc. Natl. Acad. Sci. USA 2020, 117, 14077–14083. [Google Scholar] [CrossRef]
  22. Sekara, V.; Deville, P.; Ahnert, S.E.; Barabási, A.L.; Sinatra, R.; Lehmann, S. The chaperone effect in scientific publishing. Proc. Natl. Acad. Sci. USA 2018, 115, 12603–12607. [Google Scholar] [CrossRef] [PubMed]
  23. Lozano, R. Collaboration as a pathway for sustainability. Sustain. Dev. 2007, 15, 370–381. [Google Scholar] [CrossRef]
  24. Klein, J.T. Sustainability and collaboration: Crossdisciplinary and cross-sector horizons. Sustainability 2020, 12, 1515. [Google Scholar] [CrossRef]
  25. Chapman, A.; Tsuji, T. Impacts of COVID-19 on a transitioning energy system, society, and international cooperation. Sustainability 2020, 12, 8232. [Google Scholar] [CrossRef]
  26. Aviv-Reuven, S.; Rosenfeld, A. Publication patterns’ changes due to the COVID-19 pandemic: A longitudinal and short-term scientometric analysis. Scientometrics 2021, 126, 6761–6784. [Google Scholar] [CrossRef]
  27. Myers, K.R.; Tham, W.Y.; Yin, Y.; Cohodes, N.; Thursby, J.G.; Thursby, M.C.; Schiffer, P.; Walsh, J.T.; Lakhani, K.R.; Wang, D. Unequal effects of the COVID-19 pandemic on scientists. Nat. Hum. Behav. 2020, 4, 880–883. [Google Scholar] [CrossRef]
  28. Viglione, G. Are women publishing less during the pandemic? Here’s what the data say. Nature 2020, 581, 365–366. [Google Scholar] [CrossRef]
  29. Paula, J.R. Lockdowns due to COVID-19 threaten PhD students’ and early-career researchers’ careers. Nat. Ecol. Evol. 2020, 4, 999. [Google Scholar] [CrossRef]
  30. Cunningham, E.; Smyth, B.; Greene, D. Collaboration in the time of COVID: A scientometric analysis of multidisciplinary SARS-CoV-2 research. Humanit. Soc. Sci. Commun. 2021, 8, 1–8. [Google Scholar]
  31. Liu, M.; Bu, Y.; Chen, C.; Xu, J.; Li, D.; Leng, Y.; Freeman, R.B.; Meyer, E.T.; Yoon, W.; Sung, M.; et al. Pandemics are catalysts of scientific novelty: Evidence from COVID-19. J. Assoc. Inf. Sci. Technol. 2022, 73, 1065–1078. [Google Scholar] [CrossRef] [PubMed]
  32. Zheng, Z.; Hu, Y.; Yang, H.; Qiao, Y.; He, Y.; Zhang, Y.; Huang, Y. AFFU-Net: Attention feature fusion U-Net with hybrid loss for winter jujube crack detection. Comput. Electron. Agric. 2022, 198, 107049. [Google Scholar] [CrossRef]
  33. Fu, C.; Xia, Y.; Yue, X.; Yu, S.; Min, Y.; Zhang, Q.; Leng, Y. A novel spatiotemporal behavior-enabled random walk strategy on online social platforms. IEEE Trans. Comput. Soc. Syst. 2021, 9, 807–817. [Google Scholar] [CrossRef]
  34. Ely, A.; Marin, A.; Charli-Joseph, L.; Abrol, D.; Apgar, M.; Atela, J.; Ayre, B.; Byrne, R.; Choudhary, B.K.; Chengo, V.; et al. Structured collaboration across a transformative knowledge network—learning across disciplines, cultures and contexts? Sustainability 2020, 12, 2499. [Google Scholar] [CrossRef]
  35. Wang, K.; Shen, Z.; Huang, C.; Wu, C.H.; Eide, D.; Dong, Y.; Qian, J.; Kanakia, A.; Chen, A.; Rogahn, R. A review of microsoft academic services for science of science studies. Front. Big Data 2019, 2, 45. [Google Scholar] [CrossRef] [PubMed]
  36. Wang, K.; Shen, Z.; Huang, C.; Wu, C.H.; Dong, Y.; Kanakia, A. Microsoft academic graph: When experts are not enough. Quant. Sci. Stud. 2020, 1, 396–413. [Google Scholar] [CrossRef]
  37. Purwitasari, D.; Fatichah, C.; Sumpeno, S.; Steglich, C.; Purnomo, M.H. Identifying collaboration dynamics of bipartite author-topic networks with the influences of interest changes. Scientometrics 2020, 122, 1407–1443. [Google Scholar] [CrossRef]
  38. Palla, G.; Barabási, A.L.; Vicsek, T. Quantifying social group evolution. Nature 2007, 446, 664–667. [Google Scholar] [CrossRef]
  39. Fu, C.; Zheng, Y.; Liu, Y.; Xuan, Q.; Chen, G. NES-TL: Network embedding similarity-based transfer learning. IEEE Trans. Netw. Sci. Eng. 2019, 7, 1607–1618. [Google Scholar] [CrossRef]
  40. Lu, C.; Zhang, Y.; Ahn, Y.Y.; Ding, Y.; Zhang, C.; Ma, D. Co-contributorship network and division of labor in individual scientific collaborations. J. Assoc. Inf. Sci. Technol. 2020, 71, 1162–1178. [Google Scholar] [CrossRef]
  41. Corrêa, E.A., Jr.; Silva, F.N.; Costa, L.d.F.; Amancio, D.R. Patterns of authors contribution in scientific manuscripts. J. Inf. 2017, 11, 498–510. [Google Scholar] [CrossRef]
  42. Rawlings, C.M.; McFarland, D.A. Influence flows in the academy: Using affiliation networks to assess peer effects among researchers. Soc. Sci. Res. 2011, 40, 1001–1017. [Google Scholar] [CrossRef]
  43. Xie, Z. Predicting the number of coauthors for researchers: A learning model. J. Inf. 2020, 14, 101036. [Google Scholar] [CrossRef]
  44. Newman, M.E. The structure of scientific collaboration networks. Proc. Natl. Acad. Sci. USA 2001, 98, 404–409. [Google Scholar] [CrossRef] [PubMed]
  45. Newman, M.E. Scientific collaboration networks. I. Network construction and fundamental results. Phys. Rev. E 2001, 64, 016131. [Google Scholar] [CrossRef] [PubMed]
  46. Brockmann, D.; Helbing, D. The hidden geometry of complex, network-driven contagion phenomena. Science 2013, 342, 1337–1342. [Google Scholar] [CrossRef]
  47. Zeng, A.; Fan, Y.; Di, Z.; Wang, Y.; Havlin, S. Fresh teams are associated with original and multidisciplinary research. Nat. Hum. Behav. 2021, 5, 1314–1322. [Google Scholar] [CrossRef] [PubMed]
  48. Antonakis, J.; Bendahan, S.; Jacquart, P.; Lalive, R. On making causal claims: A review and recommendations. Leadersh. Q. 2010, 21, 1086–1120. [Google Scholar] [CrossRef]
  49. Rosenbaum, P.R.; Rubin, D.B. The central role of the propensity score in observational studies for causal effects. Biometrika 1983, 70, 41–55. [Google Scholar] [CrossRef]
  50. Imbens, G.W. The role of the propensity score in estimating dose-response functions. Biometrika 2000, 87, 706–710. [Google Scholar] [CrossRef]
  51. Hirano, K.; Imbens, G.W. The propensity score with continuous treatments. In Applied Bayesian Modeling and Causal Inference from Incomplete-Data Perspectives; Wiley: New York, NY, USA, 2004; Volume 226164, pp. 73–84. [Google Scholar]
Figure 1. Data schema of MAG datasets. Papers, PapersAuthorAffiliations, PaperFieldsOfStudy are linked by the key of PaperId, PapersAuthorAffiliations and Affiliations are linked by the key of AffiliationId, PaperFieldsOfStudy, FieldsOfStudy, and FieldsOfStudyChildren are linked by the key of FieldsOfStudyId.
Sustainability 15 16915 g001
Figure 2. Illustration of the ICF. Example of ICF = 0 (a), ICF = 1 3 (b), and ICF = 1 (c). A, B, C, D are different institutions. The blue dotted lines represent the cooperation relationship existing in the current time window, while the black solid lines represent the cooperation relationship existing in the last time window. The proportion of new institutions among all institutions in cooperation in the current month is defined as the institution’s ICF.
Sustainability 15 16915 g002
Figure 3. Distribution of institution cooperation times and cooperation frequency. The institution cooperation times represent the times two institutions repeated cooperation, meaning the strength of cooperation.
Sustainability 15 16915 g003
Figure 4. The institution cooperation networks of 2019 (a) and 2020 (b).
Sustainability 15 16915 g004
Figure 5. The relationship between institution influence and ICF. Institutions are divided into four groups according to PageRank score from top to bottom.
Sustainability 15 16915 g005
Figure 6. Distribution of ICF in 2020 for different fields. (a) The overall distribution of ICF. (bt) The distribution of ICF in various fields. The kernel density estimation curve shows the probability distribution of ICF.
Sustainability 15 16915 g006
Figure 7. The distribution of whether the institution participates in COVID-19 research. The blue dot represents ICF probability of COVID-19-related research, and the orange triangle represents ICF probability of COVID-19-unrelated research. Blue and orange lines represent fitted lines. The red star represents the probability of institutions with ICF = 0.
Sustainability 15 16915 g007
Figure 8. Randomization experiment for ICF of COVID-19-related institutions. (a) The illustration of the randomization experiment. If a paper has four cooperation institutions, then in simulated collaboration, we keep the number of cooperation institutions and select randomly from the institution list. (b) The result of the randomization experiment. The blue color represents the observed ICF of COVID-19-related institutions. The orange color represents the randomized ICF of COVID-19-related institutions.
Sustainability 15 16915 g008
Figure 9. The dose-response functions for the relationship between the institution collaboration strategies (i.e., ICF) and the fluctuation of institution influence during the pandemic. E[D(ICF)] is the expectations in the difference of influence corresponding to different levels of ICF, and the treatment level represents the treatment degree of treatment variable in the GPSM.
Sustainability 15 16915 g009
Table 1. The definition of variables.
VariablesDefinition
Dependent variables
D_pagerankThe difference between 2019 and 2020 of institutions’ PageRank.
Independent variables
ICF20The annual average ICF in 2020.
Covariates
paper19The number of institution’s publications in 2019.
paper20The number of institution’s publications in 2020.
orgtimeThe established time of the institution.
memberThe number of scientists in the institution.
distanceThe distance between collaborative institutions.
Table 2. The statistics of scientific institution cooperation networks.
Attributes20192020
Nodes (institutions)18,33318,568
Links (cooperative relationship)2,890,9183,451,944
Table 3. Coefficients of the PSM treatment model.
VariablesSampleTreatedControlDifferenceS.E.t
ICF20Unmatched0.67900.52230.15660.005130.64
ATT0.69430.64150.0520.00786.76
Table 4. Coefficients of the GPSM treatment model.
VariablesCoef.Std. Err.zP > | z | [95% Conf.Interval]
member0.00001 ***0.000007.150.0000.000010.00001
paper19 0.00127 ***0.00021 6.02 0.000 0.00169 0.00086
paper200.00096 ***0.000185.210.0000.000600.00132
orgtime0.14265 ***0.0074019.250.0000.128130.15718
distance0.00008 ***0.0000021.800.0000.000080.00010
*** p < 0.01.
Disclaimer/Publisher’s Note: The statements, opinions and data contained in all publications are solely those of the individual author(s) and contributor(s) and not of MDPI and/or the editor(s). MDPI and/or the editor(s) disclaim responsibility for any injury to people or property resulting from any ideas, methods, instructions or products referred to in the content.

