Article

The Role of Environmental Management Systems and Energy Management Systems in the Adoption of Energy Recuperation Technologies in Central European Manufacturing Companies

1
Faculty of Mechanical Engineering, Technical University of Košice, Letná 9, 042 00 Košice, Slovakia
2
Faculty of Economics & Business, University of Zagreb, Trg J. F. Kennedyja 6, 10000 Zagreb, Croatia
3
Faculty of Economics, Technical University of Košice, Letná 9, 042 00 Košice, Slovakia
*
Author to whom correspondence should be addressed.
Sustainability 2023, 15(24), 16913; https://doi.org/10.3390/su152416913
Submission received: 8 November 2023 / Revised: 11 December 2023 / Accepted: 14 December 2023 / Published: 17 December 2023

Abstract

:
The diffusion of technologies within an economic system is an intricate process, influenced by a variety of factors, including governmental policies, the characteristics of adopting companies, and the technologies that can be adopted. This study aimed to investigate the relationship between the implementation of environmental management systems (EMSs), such as ISO 14001, or energy management systems (EnMSs), such as ISO 50001, and the adoption of energy recuperation technologies (ERTs), which are a subset of energy efficient technologies (EETs). To achieve this, our research leveraged data from the 2018 European Manufacturing Survey, specifically a subsample of 798 companies across five European countries: Croatia, Slovenia, Austria, Slovakia, and Lithuania. Due to the investigation of relationships and the type of variables used, we employed a two-step ordinary least squares (OLS) regression analysis. Our analysis uncovered that the current utilization of EMSs and EnMSs within companies is significantly linked to the current use of ERTs. However, upon further examination of the implementation timeline, it became improbable that EMSs or EnMSs have a substantial impact on enhancing the adoption of these technologies in the short term. Moreover, our results show that technological intensity and product complexity does not play a determining role in the adoption of ERTs, but they did show that larger companies tend to invest more in ERTs, which is in line with the findings of previous studies.

1. Introduction

Over the past few years, changes in the energy markets, such as the very high levels of oil price volatility caused by the COVID-19 pandemic [1], etc., have had an impact on industry [2], including manufacturing. In addition, the industry sector has significant responsibility for the depletion of fossil fuels and CO2 emissions, which could be mitigated by energy efficiency strategies [3], measures, or technologies.
The paper focuses on energy recuperation technologies (ERTs), which are a subset of energy efficient technologies (EETs). Here, ERTs are considered a group of technologies used in manufacturing companies to recover kinetic and process energy (e.g., waste heat recovery, energy storage). Examples of these technologies include the organic Rankine cycle (ORC), able to generate electricity from low-temperature heat sources [4]; flue gas waste heat recovery; waste heat recovery from cooling water; top-pressure recovery turbines that recover energy from high-pressure steam and uses it to power the turbine [5]; equipping robots with additional components capable of storing and recovering energy, specifically, compliant elements connected in parallel with axles and regenerative motor drives [6]; and the use of direct current (DC) sub-grids in industrial robot power flow, which is ideal for recovering energy from the actuators with regenerative approaches [7].
The relevant literature has predominantly focused on EETs as the subject of investigation. Therefore, if we only consider articles specifically dealing with ERTs, our theoretical foundation will lack coverage of essential aspects related to the relationship between the implementation of EMSs (or EnMSs) and the adoption of these technologies. This is why this paper explores the EETs, while the results section concentrates on the examination of a specific sub-group of EETs, namely, ERTs. This focus can be viewed as an added value of the paper, as it analyses whether the previously collected findings related to EETs also hold true for this subset of technologies.
Certainly, this might raise a question in the reader’s mind: why did we choose to investigate ERTs rather than the entire category of EETs? The reasons primarily stem from the practical considerations in conducting survey-based research, where we inquire about the actual use of technology or measures.
In our pan-European survey (refer to Section 3.1 Data), to maintain objectivity and prevent misinterpretation, the standard practice is to inquire about specific technologies (e.g., industrial robots for manufacturing, 3D printing for prototyping) or organizational concepts (e.g., methods for optimizing change-over time or reducing setup time, such as SMED). Additionally, as the number of questions or items in the survey increases, there is a decline in the willingness of respondents (i.e., firms) to participate. This places constraints on the survey’s scope when inquiring about various technologies, preventing us from typically covering the entire spectrum of technologies within groups like robots, additive technologies, or efficiency technologies. Instead, we focus on the primary types or subgroups. This represents a trade-off between obtaining internationally comparable data, encompassing various industries and topics, and acquiring detailed responses.
The examination of the EETs in the manufacturing sector holds significance from both environmental and economic standpoints. Industries are substantial energy consumers, comprising 26% of the European Union’s total energy consumption [8]. Recognizing the attributes of companies that propel the implementation of energy efficiency (EE) enhancements is vital for policymakers in crafting efficacious measures [9].
EE in industrial firms has been studied from multiple views (from withdrawal proportions to specific technological aspects), from the circular economy (CE) context (e.g., Ref. [10]) or in the sustainable technologies framework (e.g., Ref. [11]). There is not enough understanding of whether and why companies with different characteristics (e.g., size, production/product characteristics, R&D activities) implement these technologies in different patterns. There is widespread awareness of the obvious advantages of the adoption in terms of conservation of energy (e.g., Ref. [12]), but there is a lack of knowledge about the sectoral (or other firm-specific characteristics) distribution of EETs [13], one group of which (i.e., energy recuperation technologies) is of core interest in our paper.
In general, the adoption of technologies in an economic system is a complex process influenced by various factors. These factors include the characteristics of adopting companies, the technology itself, and the company’s environment [14,15]. However, existing empirical studies on the relationship between firm characteristics and the adoption of EETs provide a limited view of the issue. For instance, Haider [16] found that firm size, age, and financial performance are important factors influencing energy efficiency. Cantore [17] found that internal management and organizational factors increase the likelihood of firms investing in energy-efficient technologies. Costa-Campi [9] discovered that firms introducing organizational innovations are more likely to innovate in energy efficiency. These studies, along with others, do not provide a comprehensive understanding of EET adoption, particularly regarding differences in firms’ characteristics. Additionally, there are indications that EET adoption may differ depending on whether a firm has implemented environmental management systems (EMS) or energy management systems (EnMS) certifications [11,18,19,20]. Moreover, previous studies have often treated EMS and EnMS as a single variable or only examined one of them when studying EET adoption. Therefore, our study aims to clarify the relationships between EMS and EnMS implementation and EET adoption within a single study, while also examining the impact of firms’ characteristics such as size, industry, technological intensity, and product complexity.
In this paper, we address the following questions: What is the nexus between the implementation of EMS or EnMS and adoption of ERTs? Which firm’s characteristics do enable the adoption of ERTs?
The answers to these questions could assist policymakers in gaining a deeper understanding of how EMS and EnMS function in the practical operations of manufacturing companies. This understanding would enable them to incorporate these management systems more accurately into the framework of policy support for the adoption of EETs.
The paper is organized as follows: Section 1 and Section 2 offer a general description of the context and literature review concerning the factors influencing EET adoption (Section 2.1), with a specific focus on firm-specific factors (Section 2.2), including EMS (Section 2.3) and EnMS (Section 2.4), plus defining ERTs (Section 2.5). This is followed by a description of the data and methodology in Section 3. Section 4 applies two-step OLS regression analysis and other analyses to proceed with the data and presents the main results of the research. Section 5 concludes with a discussion of the contribution to the theory and policy implications.

2. Theoretical Background

2.1. Factors That Aim to Interpret the Adoption of EETs

The adoption of EETs is influenced by numerous factors classified into four distinctive categories: market failures, wider economic environment-specific variables, firm-specific variables, and technology and investment [21]. In the literature, we were able to find studies dealing with specific factors, such as internal management, organizational factors, and top management, whose commitment is crucial for firms’ investment in EETs [17,22]. The role of governmental policies and regulatory stringency also affects EET adoption [23,24]. Organizational and financial factors, such as cost and risk considerations, financial performance, and awareness, also influence EET adoption [19,20,25,26,27]. Other specific factors, including efficiency, enforcement by parent organizations, ICTs, technological aspects, and the use of EMS and EnMS, have also been researched [18,19,28,29,30,31,32]. For example, Fu (2018) found that certified systems such as EMS and EnMS are important for sustainable process technology adoption [11]. Finally, it has to be mentioned that the role and significance of these factors can vary over time during innovation processes [33].

2.2. Internal Firm-Specific Factors and Adoption of EETs

As stated by Costa-Campi [9], the identification of the characteristics of firms that drive the adoption of EE improvements in order that policy can be correctly designed is one of the challenges of EE studies.
Previous studies have shown that the enhancement of EE varies based on these firm-specific variables:
  • the size [9,16,22,34,35,36];
  • production type, degree of production automation [36];
  • the age [16];
  • sectoral characteristics associated with, e.g., energy intensity or environmental regulation [35,36,37,38];
  • financial performance [16,19,35,39];
  • the share of energy costs, market share, and export orientation [35,40];
  • foreign ownership [35];
  • managers’ expectations of future demand [35];
  • internal management and organizational factors [17], people with great ambition and entrepreneurial mind and the management sensitivity to the issue [34], knowledge and commitment [41], tacit knowledge [39,42];
  • the awareness ([19,41]; in the case of SMEs [39]), previous emphasis on energy efficiency in the organization [36];
  • EMS [18,43,44] (in the case of SMEs [20];
  • EnMS [18,45,46] (in the case of SMEs [17,19];
  • experience in the adoption of EETs, path dependency [17];
  • innovation in general [47], innovativeness [45], organizational innovations [9];
  • ICT tools and standardization [48].

2.3. EMS and Adoption of EETs

In previous studies, EMS, which is the core focus of our paper, has been researched in a wide range of circumstances and relationships. Similar to ours, there is a group of studies that investigated the influence of EMSs on the adoption of EETs/EEMs. For example, Radonjič [43] conducted a study on selected manufacturing industries in Slovenia and found that ISO 14001 [49] certification accelerates initiatives for adopting new and cleaner technologies within certified firms. Similar findings were reported by Ikram [44] for manufacturing in Pakistan. Johnstone [45] showed a positive effect of environmental management systems on the likelihood of implementing technical measures to reduce environmental impacts in some areas. Additionally, Uriarte-Romero [46] demonstrated that EMSs indeed contribute to increased investment in energy-efficient technologies, at least to a minimum extent.
It has to be mentioned that there are also studies of EMSs that aim to explore whether the implementation of an EMS has an influence on environmental or financial performance that focuses on researching EMSs within the context of energy management practices or that specifically examine the relationship between EMSs and factors such as Industry 4.0, but these studies are out of the scope of our paper.

2.4. EnMS and Adoption of EETs

Based on the literature review and in line with the findings of Bunse [48], it is evident that studies rarely address the effectiveness of EnMS. Furthermore, we discovered only a few studies that specifically examined the relationship between EnMSs and the adoption of EETs/EEMs or the environmental performance of companies. The identified studies, such as that of Introna [50], generally assume that an EnMS can offer numerous advantages, including reductions in energy consumption and costs, improvement of corporate image, and environmental impact reduction. However, there are also authors, like Franz [51], who argue that EnMSs primarily function as energy accounting systems and that the actual management of energy sources is not yet widely implemented in the industry. Another perspective is presented by [52], who proposed that EnMS (ISO 50001 [53]) should be seen as a method or tool to achieve ten factors for successful in-house energy management practices. Finally, Cooremans [54] concluded that the better the EnMS (understood in a broader sense than just ISO 50001), the higher the likelihood of making positive decisions on energy-efficiency investments. Despite these conflicting views, according to McKane [55], ISO 50001 has the potential to impact 60% of the world’s energy use, encompassing not only the industrial sector but also commercial and institutional sectors. Demonstrated savings indicate that energy intensity improvements of more than 2.5% per year are attainable, while in the manufacturing industry, energy efficiency can be significantly improved by an impressive 18 to 26% based on proven technology, leading to a reduction in sector CO2 emissions by 19 to 32% [56].
This paper focuses on energy recuperation technologies (ERTs), which are a subset of energy efficient technologies (EETs). Here, ERTs are considered a group of technologies used in manufacturing companies to recover kinetic and process energy (e.g., waste heat recovery, energy storage). Examples of these technologies include the organic Rankine cycle (ORC), able to generate electricity from low-temperature heat sources [4]; flue gas waste heat recovery; waste heat recovery from cooling water; top-pressure recovery turbines that recover energy from high-pressure steam and use it to power the turbine [5]; equipping robots with additional components capable of storing and recovering energy, specifically, compliant elements connected in parallel with axles and regenerative motor drives [6]; and the use of direct current (DC) sub-grids in industrial robot power flow, which is ideal for recovering energy from the actuators with regenerative approaches [7].

2.5. Energy Recovery Technologies (ERTs)

Here, energy recovery technologies (ERTs) encompass a group of technologies employed in manufacturing companies to capture kinetic and process energy, such as waste heat recovery and energy storage. Examples of these technologies include recovering waste heat from gas or water, including the organic Rankine cycle (ORC); utilizing top-pressure recovery turbines; or enhancing robots with additional components capable of storing and recovering energy.
Waste heat utilization technologies in the industry are categorized as passive or active. Passive technologies involve the direct use of heat at the same or lower temperature levels, including heat exchangers and thermal energy storage. In contrast, active technologies, such as sorption systems, mechanically driven heat pumps, and ORC, transform waste heat into another form of energy or to a higher temperature, enabling diverse applications beyond direct heat reuse within the industry [57]. ORC is particularly attractive for small-scale power production and exploiting low-temperature heat sources [58]. Its main components include a pump system, an evaporator, a turbine/expander, and a condenser [59]. Top-pressure recovery turbines (TRTs), like those used in the iron-steel industry such as blast furnace top pressure turbines, generate electrical energy by utilizing the pressure energy of gas without combustion, offering an alternative to pressure reduction by expanding blast furnace gas obtained as a by-product [60].
Another application of ERTs lies in robotics, where the energy efficiency of industrial robots can be enhanced by replacing traditional drives with regenerative drives. These drives convert braking energy into regenerative electric energy, returned to the system when needed, rather than dissipating it as heat [6].

3. Materials and Methods

3.1. Data

The systematic literature review conducted by [61] confirmed that surveys and/or interviews with managers are the most commonly employed method for gathering data on drivers for industrial energy efficiency. Similarly, our research is based on data obtained from the European Manufacturing Survey (EMSurvey), specifically the sub-samples for Austria [62], Lithuania [63], Slovakia [64], and Croatia and Slovenia [65], which covers mostly the central European region.
The EMSurvey is a collaborative European survey project conducted by Fraunhofer ISI that investigates various aspects of manufacturing companies (NACE codes 10 to 33) with more than 20 employees across 17 European countries. The survey is designed in a manner that most questions are used uniformly across all countries. The primary respondents are production managers, executive officers, or owners of the facilities, and they are contacted either electronically or by post. The data used in our study were independently collected in all mentioned countries between the end of 2018 and the spring of 2019, resulting in a total sample size of 798 cases (see Table 1).
The EMSurvey questionnaire consists of different questions, and we selected those specifically related to EETs, EMSs, and EnMSs. The used questions were worded as follows: “Which of the following technologies are currently utilized in your factory?” and “Which of the following organizational concepts are currently implemented in your factory?”. Within these questions, the respondents were given the option to select either “yes” (if they use) or “no” (if they do not use) for each individual technology or organizational concept listed. From the listed technologies, we used in our study
  • Technologies to recuperate kinetic and process energy (e.g., waste heat recovery, energy storage) (further “ERTs”).
From the listed organizational concept, we used in our study
  • Certified environmental management system (e.g., EN ISO 14001) (further “EnMS”).
  • Certified energy management system (e.g., EN ISO 50001) (further “EMS”).

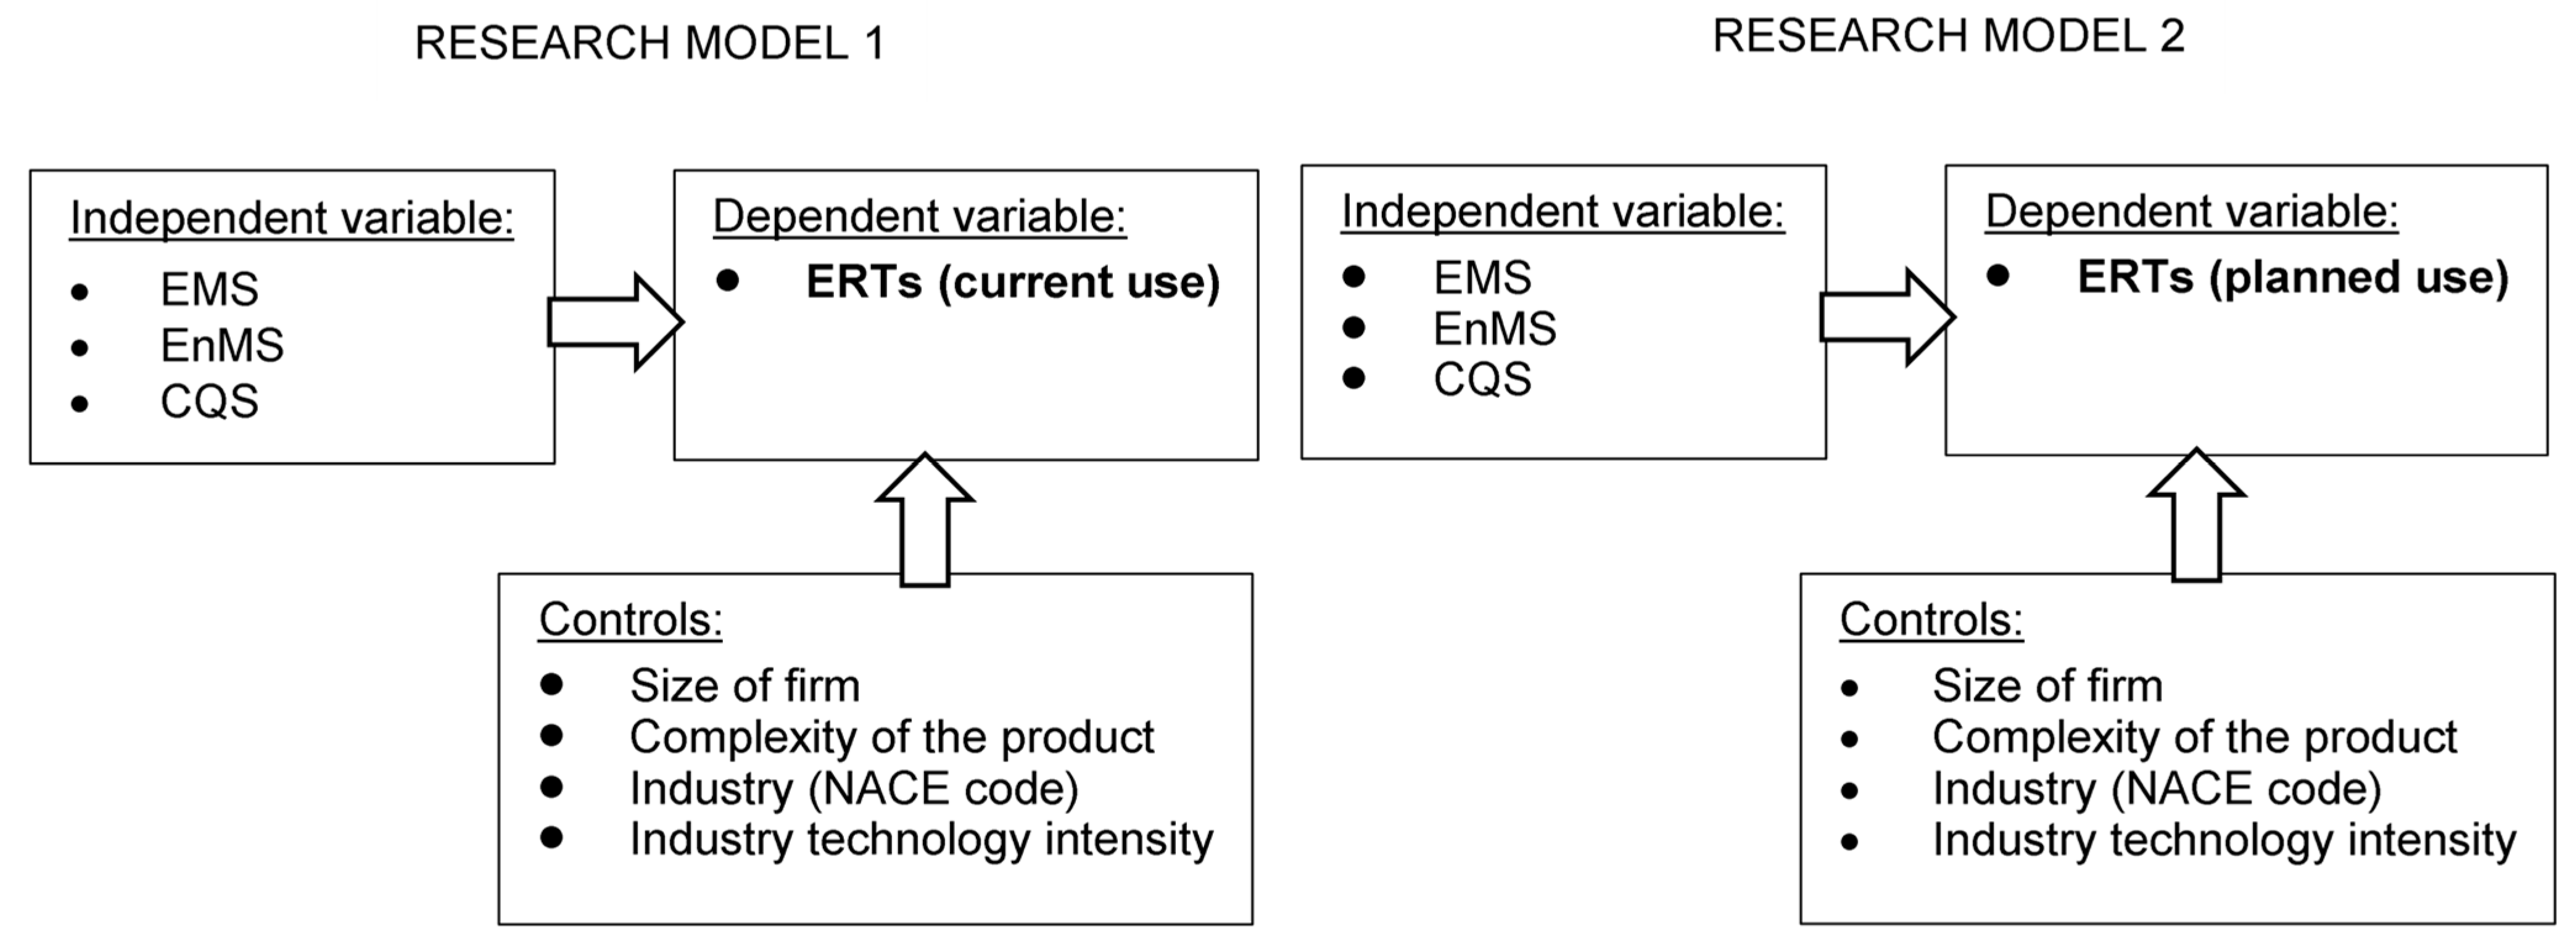
3.2. Regression Analysis

Based on the objective of our study, which focuses on examining the relationship between the use of EMS and EnMS and the adoption of ERTs, regression analysis emerged as a suitable statistical tool.
Figure 1 presents the proposed model, comprising one dependent variable—“ERTs”—referring to technologies for recuperating kinetic and process energy, and two independent variables—“EMS” and “EnMS”. The model emphasizes that, according to the existing literature, organizations that have implemented EMS or EnMS are more likely to invest in technologies aimed at conserving natural resources, such as the recuperation of kinetic and process energy. However, as previous research has indicated, the size of a company can influences its ability to invest in these technologies, with smaller companies often facing resource constraints. Drawing inspiration from the study by [18], which compared efficiency gains between certified (ISO 14001, 50001, 9001, etc.) and non-certified firms, we included “Certified Quality Standards” (ISO 9001 [66]) (CQS) as additional independent variable in the model (Figure 1).
The second model (Figure 1) is derived from the first model, with the only change being the dependent variable, which was modified from its current use to planned use in the near future (i.e., within the next three years). The rationale behind this model is that if an EMS (or EnMS) is utilized within an organization and is considered to enhance the implementation of ERTs, there should be a significant relationship between these management systems and the planned use of the technology.
According to the posed research questions (see Section 1. Introduction), we formulated the following hypotheses for the statistical testing:
H1a: 
Firms that have implemented an EMS (e.g., ISO 14001) are more likely to adopt ERTs.
H1b: 
Firms that have implemented an EnMS (e.g., ISO 50001) are more likely to adopt ERTs.
H2: 
There are firm characteristics that significantly relate to the adoption of ERTs.
All calculations were performed with the SPSS statistical software (version 29).

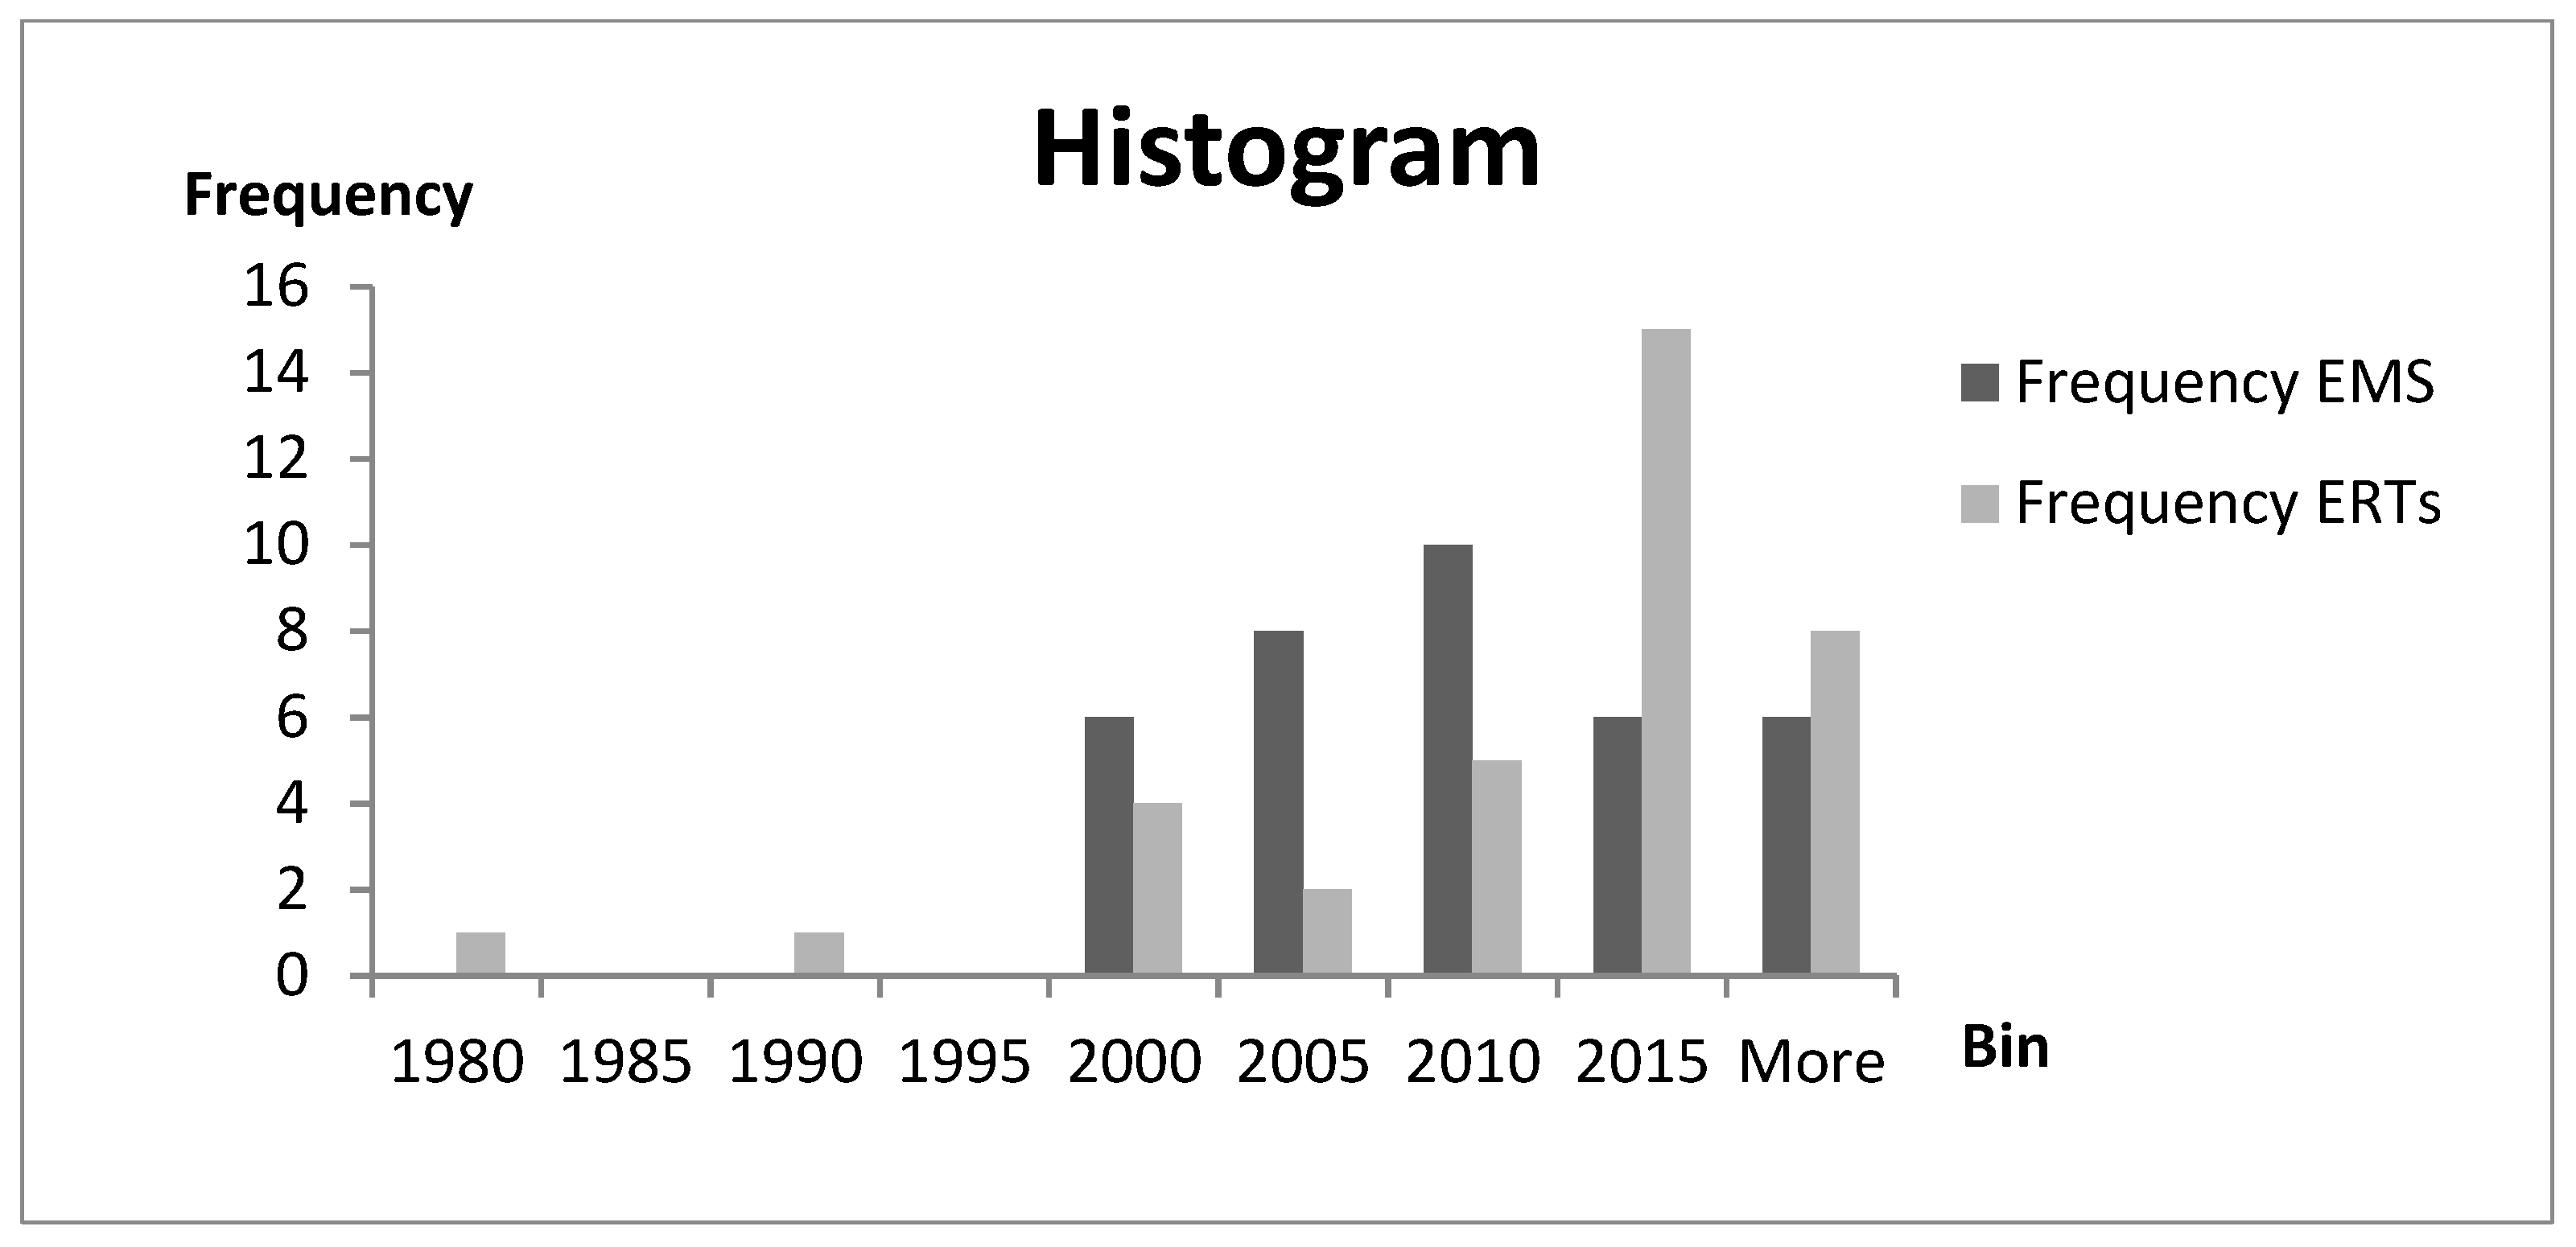
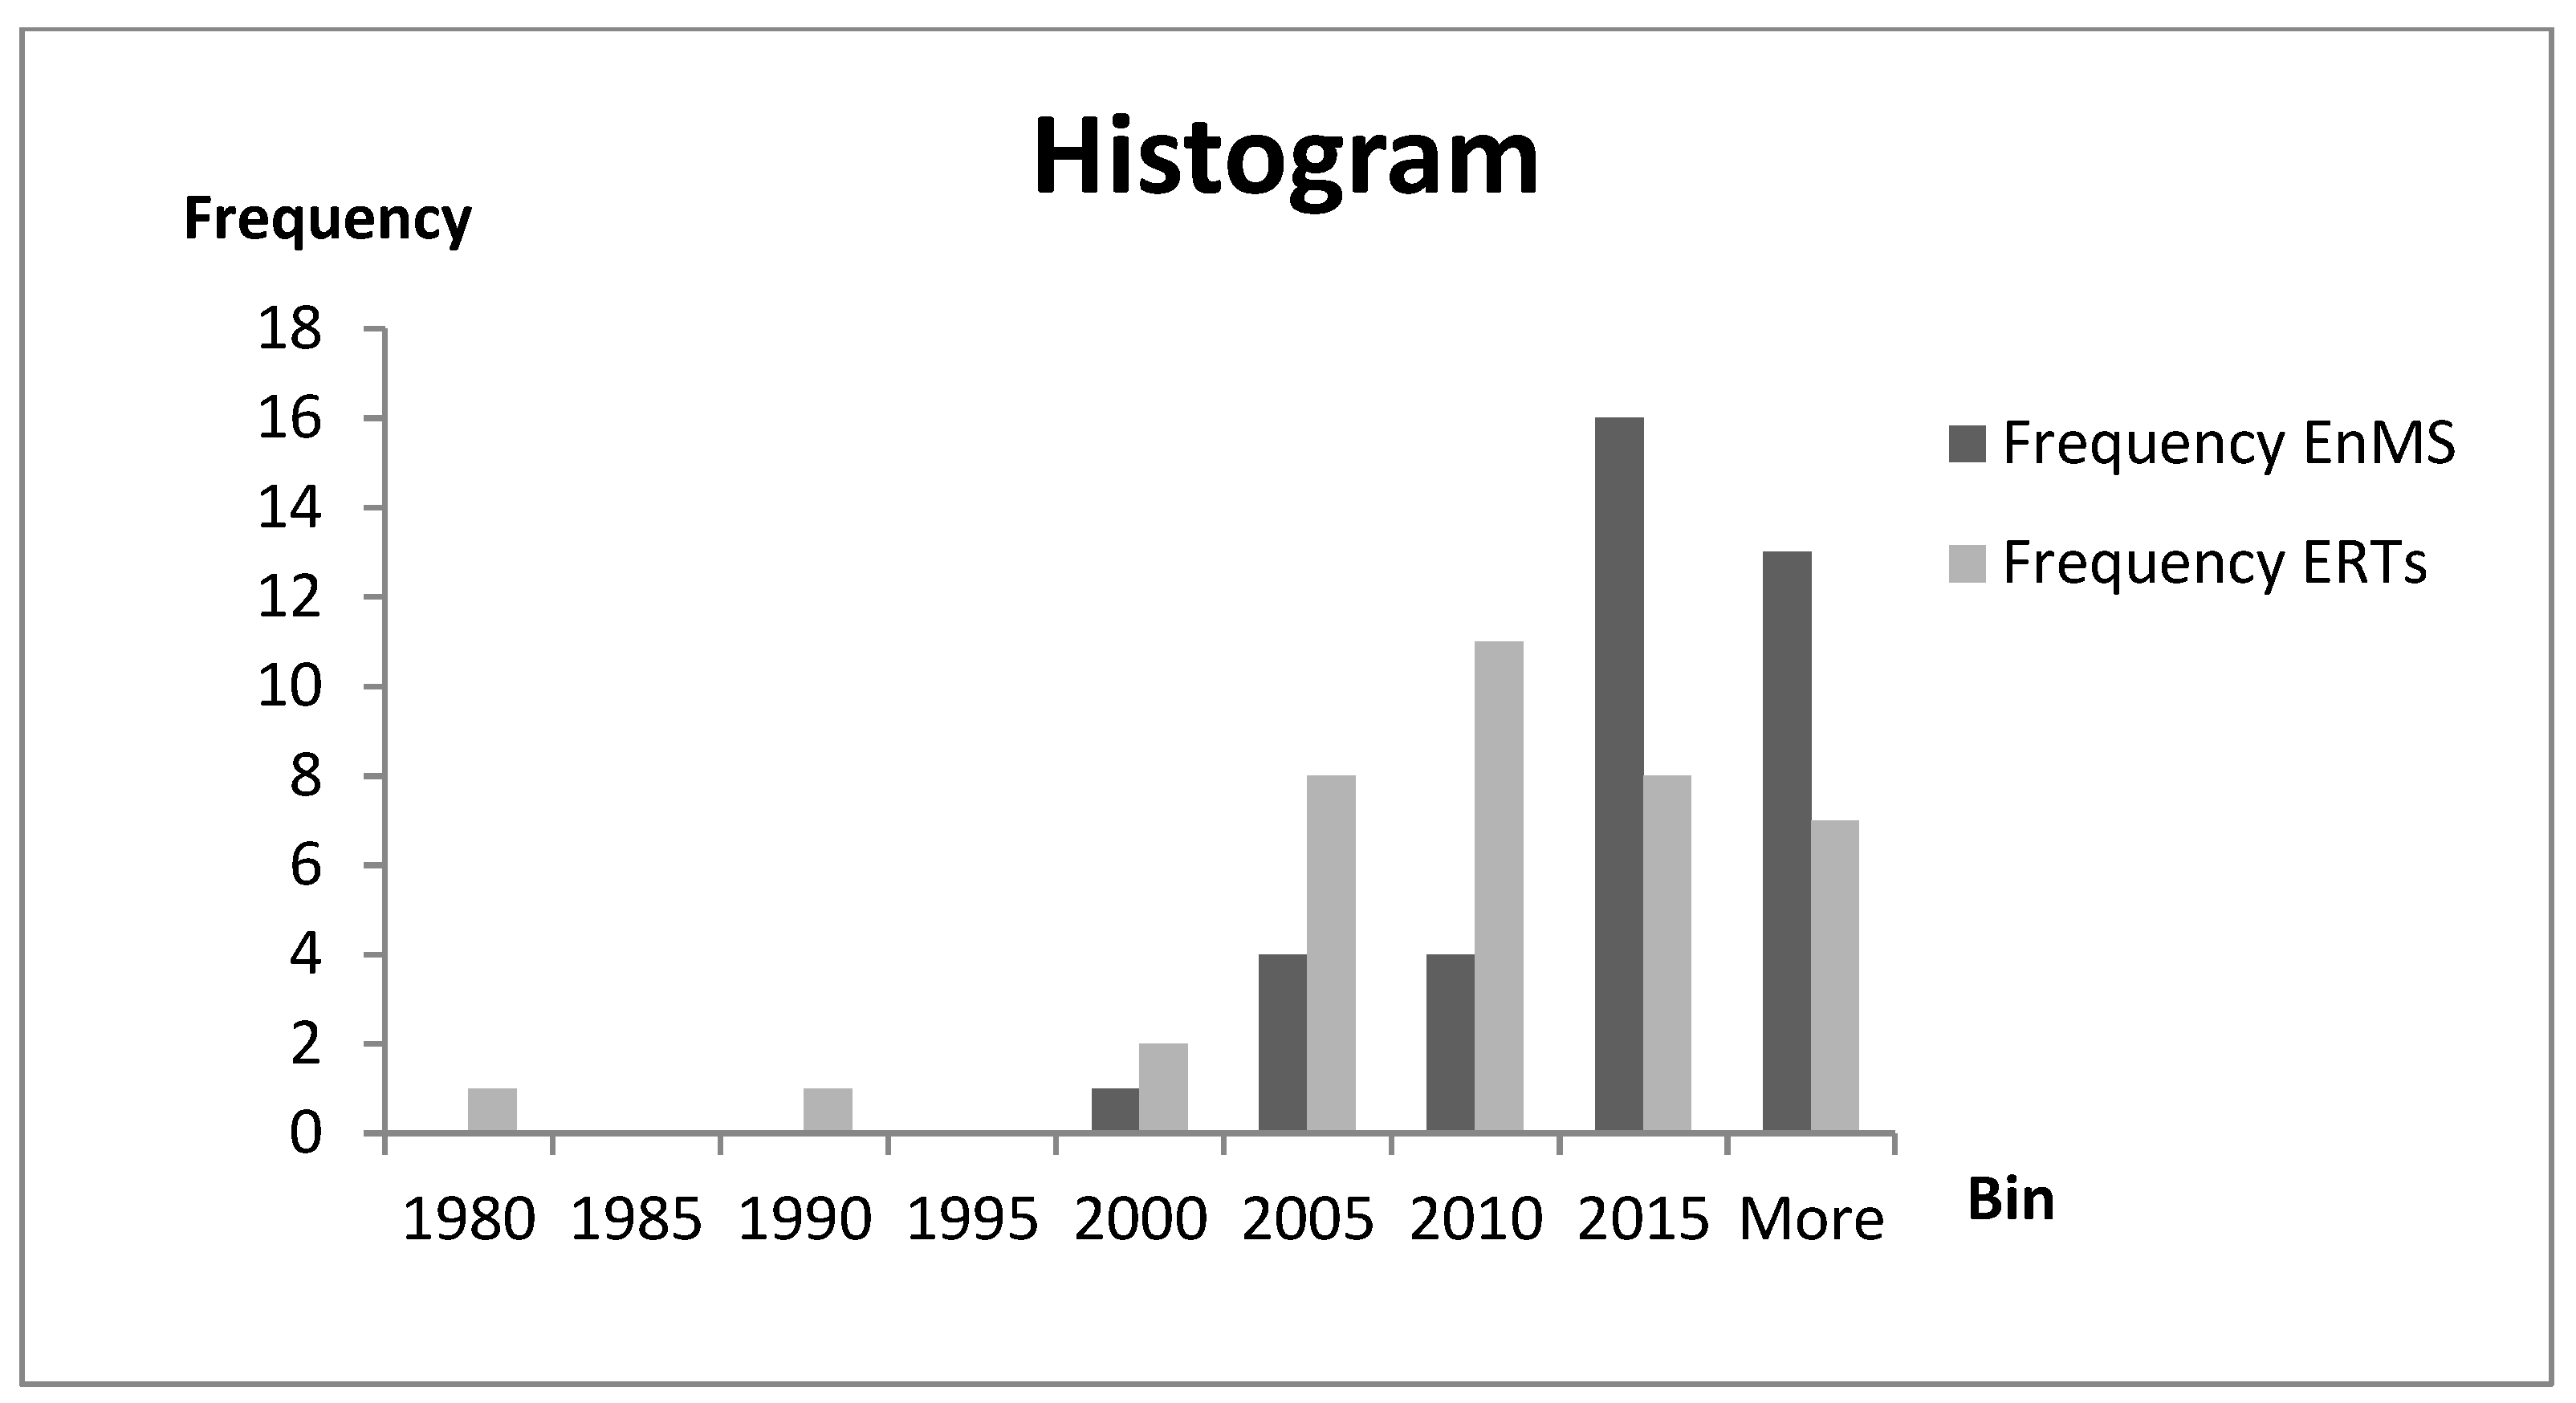
3.3. Years of Implementation Comparison

The second part of our analysis involved a detailed examination of implementation years, which is unique in this research area. The analysis focused on comparing the years of initial implementation for an EMS (or EnMS) and ERTs in each company (Table A1 and Table A2 with years are found in Appendix A). This straightforward time sequence analysis helps identify cases where an EMS (or EnMS) is implemented prior to ERTs and determines the time delay between them, measured as the difference in implementation years. This analysis enables us to investigate the possibility of a causal relationship between system usage and technology adoption.

3.4. Testing Differences among Company Groups

To validate or challenge the findings of the previous analysis using the available survey data, a third analysis was conducted. This analysis involved testing the differences between groups of companies using statistical methods. Taking inspiration from [18], the companies were divided into four groups:
  • Group A: Companies without EMS or EnMS;
  • Group B: Companies with EMS but no EnMS;
  • Group C: Companies without EMS but with EnMS;
  • Group D: Companies with both EMS and EnMS.
Chi-squared tests were employed to examine the differences between these groups in terms of their use of ERTs. The same tests were conducted to assess the planned use of these technologies. It was hypothesized that significant differences in the percentage of companies using or planning to use these technologies would support the notion of a significant relationship between the use of management systems and the adoption of technologies. Moreover, significant differences in the planned use of technologies could indicate that these systems could facilitate the implementation of such technologies. This last analysis considered the current certification status of companies (i.e., their current use of management systems) and its potential influence on the future use of technologies.
As the previous analysis (see Section 4. Results) did not provide a clear understanding of the relationships between management systems and technology adoption, an additional test was conducted to explore the reverse relationship. This test investigated the differences in the planned use of an EMS (or EnMS) based on the division of the sample into two groups according to their use of ERTs:
  • Group X: Companies without ERTs;
  • Group Y: Companies with ERTs.
Chi-squared tests were used to assess the differences between these groups in terms of their planned use of EMS (or EnMS). The hypothesis here was that significant differences in the percentage of companies planning to use EMS (or EnMS) would support the unconventional idea that the use of ERTs could facilitate the implementation of EMS (or EnMS).

4. Results

4.1. Regression Analysis

For the evaluation of the proposed model 1 (see Methodology, Figure 1), a two-step OLS regression analysis was conducted. Firstly, the control variables were included, followed by the introduction of EMS, EnMS, and CQS as independent variables, with ERTs as the dependent variable. In model 1, this dependent variable was specified as the current use of ERTs.
Table 2 reveals that the current use of EMS has a statistically significant relationship (at an alpha level of 0.05) with the current use of ERTs. The model demonstrates significance, and all VIFs (variance inflation factors) were below 2. However, in the case of the current use of EnMSs, the relationship with the current use of ERTs was significant only at an alpha level of 0.1 (but not at an alpha level of 0.05), even though these technologies are designed to save energy. The presented results also confirm that company size plays a significant role in the current use of ERTs, with a higher percentage of larger companies utilizing these technologies compared to smaller ones.
Following the evaluation of model 1, we proceeded to test model 2 (see Section 3. Materials and Methods, Figure 1), where the planned use of ERTs instead of their current use was examined as the dependent variable. This model yielded non-significant results, suggesting that the relationship between the current use of EMS, EnMS, and the planned use of ERTs may not be as commonly assumed, meaning that the use of these systems may not necessarily enhance the implementation of such technologies.
To either support or challenge these findings and explore the potential enhancing relationship between these systems and technology implementation, the subsequent subchapter analyzes and compares the initial implementation years of these systems and technologies in individual companies.

4.2. Years of Implementation Comparison

In this part, the comparison of the initial implementation years of the management systems (EMS or EnMS) and ERTs in individual companies is provided. The rationale behind this analysis is based on the assumption that if there is an enhancing relationship between the use of these management systems and the adoption of ERTs relevant in the short term, the year of adoption of ERTs should closely follow the year of management system implementation.
The survey data representing the “first year of use” of the EMS and technologies (see Appendix A Table A1) revealed that half of the companies (18 out of 36) implemented the technology before the EMS, so there was no rationale to analyze the enhancement relationship. Furthermore, in cases where an EMS was installed prior to the technologies, there was typically a significant delay (more than 8 years in most companies) between the implementations (see Appendix A, Table A1, years highlighted in bold). Based on these results, it is challenging to envision an enhancing relationship between the use of an EMS and the adoption of ERTs in the short term. It also prompts us to consider whether the opposite relationship could be plausible.
Similar to EMS, we conducted an analysis of the implementation years for EnMSs. Table A2 (see Appendix A) demonstrates that most companies (32 out of 38) first introduced the ERTs and then an EnMS, so there is no rationale to analyze the enhancement relationship. Additionally, in the small subset of companies that implemented EnMSs prior to the technologies, in half of them, there was a considerable delay (over 5 years) between implementations. Therefore, also in the case of EnMSs, it is difficult to imagine an enhancing relationship between the use of an EnMS and the adoption of ERTs in the short term. These findings raise the same question as with EMSs, namely, whether the relationship could be the opposite (remark: this question is analyzed in the following Section 4.3).
These findings are somehow further supported by the box plots (Figure 2 and Figure 3, which visualize the same data from Table A1 and Table A2 (see Appendix A)) that illustrate the distribution of implementation years for both management systems and technologies. In the case of EnMS (Figure 3), there was a noticeable time delay in their implementation compared to the ERTs.

4.3. Testing Differences among Company Groups

The numbers in the upper part of Table 3 (underlined) reveal that the lowest percentage of companies using ERTs (17.5%) was found in the group without management systems, while higher percentages (31.6% and 25%) were observed in the groups using EMSs and EnMSs, respectively. The highest percentage (48.3%) was observed in the group using both systems (EMS + EnMS). The chi-squared test confirms the statistically significant differences among these four groups of companies in terms of their usage of ERTs. This analysis suggests that the “intensity” of the relationship (identified in the regression analysis and supported by these numbers) may increase with the number of management systems used by a company.
Similar to our regression analysis (Section 4.1), an additional analysis was conducted here, focusing on the planned use of ERTs instead of current use (see Table 3, bottom part). Numbers in the bottom part of the Table 3 illustrate that the percentage of companies planning to use the technologies was similar (around 11%) in each group, regardless of whether they had management systems or not (note: we excluded the EnMS group due to the limited number of companies available for this specific analysis). The chi-squared tests indicated no statistically significant differences among the four groups of companies in terms of their planned use of ERTs (p = 0.709). If a causal or enhancement relationship existed, we would expect to observe differences between the groups. Thus, it appears that the presence of an EMS or EnMS does not influence the planned use of ERTs.
The final analysis aimed to test the aforementioned unconventional idea that the current use of ERTs can support the implementation of an EMS (or EnMS). To shed more light on this, we divided the sample into two groups: companies that currently use ERTs and those that do not. Differences between these groups based on the planned use of EMSs (and separately of the planned use of EnMSs) were analyzed using the chi-squared test (Table 4). The test revealed a significant difference in the case of the planned use of EMSs, but not in the case of the planned use of EnMSs. The results regarding EMSs do not dismiss the possibility that the current use of ERTs influences the adoption of EMSs, but the percentages in the upper part of the Table 4 show that this was not the case, because on the contrary to our hypothesis, a significantly higher percentage of companies currently not using ERTs (18.5%) were planning to use EMS compared to the group of companies currently using these technologies (8.6%).

5. Discussion and Conclusions

According to our results, the current use of EMS and the current use of EnMS demonstrates a significant relationship with the current use of ERTs, but it is very unlikely that EMSs or EnMSs enhance the adoption of ERTs in the short term. A more detailed discussion of the relationship is found in the following subchapters.

5.1. Implications for Theory

5.1.1. EMS

When examining the relationship between EMS implementation and EETs/EEMs, as demonstrated by [20] in the context of Swedish manufacturing SMEs, EMSs serve as drivers for EET/EEMs, although their significance may vary based on firm size [45]. In our sample of 798 European manufacturing firms, it was established that EMSs do exhibit a significant relationship with one group of EET, namely, ERTs. Despite our initial assumption that this relationship suggests EMS implementation enhances EET adoption, additional regression analysis between the current use of an EMS and the planned use of ERTs did not demonstrate a significant connection. This finding, in our interpretation, supports an opposing notion that there is either no, a weak, or a long-term enhancement relationship.
To understand the nature of the relationship between EMSs and ERTs, we further analyzed the implementation years of the system and technologies. Based on our findings, it is challenging to envision an enhancing relationship between the use of an EMS and the adoption of ERTs. This is evident from the fact that in cases where an EMS was installed prior to the technologies, there was a significant delay (more than 8 years) between the two implementations.
Based on these findings, we raised a counterintuitive yet valid question: Could it be that the use of ERTs enhances the implementation of EMSs? Our results regarding EMS do not dismiss the possibility that the current use of ERTs influences the adoption of EMS, but they show that in the contrary to our assumption, a significantly higher percentage of companies currently not using ERTs are planning to use an EMS compared to the group of companies currently using these technologies.
It is important for readers to note that our investigation focused solely on ERTs, which represent production-oriented measures for recovering kinetic and process energy (e.g., waste heat recovery, energy storage) (see Section 1, Introduction). Our study did not cover a broader spectrum of EETs/EEMs. Therefore, it is not surprising that our results diverge from studies such as the research of [67] on ISO 14001-certified Brazilian companies, which identified a reduction in power, gas, and fuel oil consumption as a major certification benefit. Similarly, Zobel (2016) found, based on Swedish manufacturing companies, that ISO 14001 adoption and certification led to improved energy efficiency concerning fossil fuel usage, but not electricity consumption, with varying results depending on the fuel type [44]. Additionally, Johnstone [68] demonstrated a positive effect of environmental management on the likelihood of implementing technical measures to reduce environmental impacts in some areas, although not uniformly across all domains. One explanation of the discrepancies between our results and presented studies is that ERTs (used in our study) are not low-cost energy efficiency measures, as outlined by Tholander [20], which can be adopted at an operational level within organizations. Instead, they represent capital-intensive investments in production processes often associated with strategic decisionmaking.

5.1.2. EnMS

Similarly to EMS, the regression results for EnMSs indicate a significant relationship between the current use of the system and the current use of ERTs, but only on an alpha level of 0.1 (not on an alpha level of 0.05, as in EMSs). Equally to EMSs, there was no significant relationship between the current use of an EnMS to planned use of the technologies. This does not align with the observations made by [45], among others. To verify if these findings are supported by other survey data, we analogously examined the implementation years, as in the case of EMSs. Our findings indicate that, in most companies, EnMS implementation could not facilitate the adoption of technologies. This is because either the technologies were implemented prior to the EnMS or there was a substantial time delay between their implementations, rendering any significant short-term influence unlikely.
We have also explored the possibility of an opposite relationship, namely, whether the use of ERTs enhances the implementation of EnMSs. Our results suggest that it is highly unlikely that the current use of ERTs influences the introduction of EnMSs.
In addition, readers need to consider that our investigation focused solely on one type of EETs, i.e., ERTs, and it did not encompass a broader range of EETs/EEMs. Thus, it is not surprising that our results differ from studies such as Schulze’s [46], who, based on a sample of 236 German companies, found a positive relationship between the extent of EnMS implementation and firms’ energy efficiency, or Cantore [17], who intriguingly demonstrated, based on a sample of firms in Vietnam, the Philippines, and Moldova, that EnMSs may even impede the diffusion of EETs.

5.1.3. EMS versus EnMS

Based on the research gap found in the literature, we raised the following question: Are the relationships between the use of EMS and EnMS with respect to ERTs different?
Schützenhofer [18] conducted a study on 45 large Austrian firms and found that ISO-certified firms, which have implemented ISO 50001, ISO 14001, or other ISO standards like ISO 9001, achieved a 165% increase in efficiency compared to non-certified firms. However, their deeper analysis of ISO-certified firms did not reveal significant differences, preventing them from distinguishing which management system is more effective. In line with our findings, it appears that the use of EMS (e.g., ISO 14001) and the use of EnMS (e.g., ISO 50001) has a significant relationship with the use of ERTs. However, our analysis of the implementation years leads us to conclude that EMS or EnMS are unlikely to enhance the adoption of ERTs in the short term. Finally, our results show that we could not dismiss the existence of opposite relation (i.e., the relationship between the current use of ERTs and planned use of management system) in the case of EMSs, but we could in the case of EnMSs.
In conclusion, our findings show that the current use of EMSs and the current use of EnMSs are significantly associated with the use of ERTs, but it is very unlikely that EMSs or EnMSs enhance the adoption of ERTs in the short term. However, it is challenging to define the essence of this relationship based on our survey data. An explanation for our results could lie in certain common characteristics of the companies that were not covered in our research, such as energy consumption. This argument is supported by Schützenhofer’s [18] findings, which indicate that firms with a higher share of energy consumption in their processes are more likely to have a management system in place and implement more EEMs.

5.1.4. Contextual Factors

Despite our primary focus on EMS and EnMS, a few contextual variables were also included in our regression models. These variables were considered relevant in previous studies (e.g., company size) or were deemed potentially relevant based on the available survey variables (e.g., product complexity, technological intensity of industry).
Regarding company size, it is one of the most widely investigated factors in the EET literature (e.g., Refs. [9,16,34,35]), and its effect is considered supportive of EET adoption. Our regression analysis confirms that larger companies tend to invest more in ERTs compared to smaller firms. It is worth noting that the validation of these results by other studies adds validity to our research, particularly in terms of the data used from EMSurvey (Section 3.1 Data).
The second factor we investigated, the complexity of products, has not been extensively studied in EET/EEM research. However, a study by Bayo-Moriones [69] on the relationship between the use of 5S (a workplace organization methodology), contextual factors, and performance showed a positive relationship between the use of 5S and certain contextual factors, including the type of product manufactured. Our research did not indicate the significant impact of product complexity on the adoption of ERTs.
The last factor, the technological intensity of industry, has not been directly examined in EET/EEM studies. However, similar concepts such as sectoral characteristics (related to factors like energy intensity or environmental regulation) have received a primary focus (see e.g., [35,37,38]). For example, Hrovatin [35] found that the likelihood of investment is significantly influenced by industry-specific characteristics, which capture the effect of industry differences in environmental regulation and other conditions. Based on our results, technological intensity does not play a determining role in the adoption of ERTs, nor does industry (examined according to NACE codes).

5.2. Implications for Practice

The findings have practical implications for policymakers seeking to understand the relationship between EMS and EnMS implementation in companies and the adoption of specific EETs, namely, ERTs, within manufacturing companies. This understanding can guide policymakers in designing more effective policies to enhance energy efficiency and environmental quality. However, it is important to note that this research focuses solely on ERTs (one group of EETs/EEMs) and therefore cannot provide general recommendations for modifying support for EMS or EnMS implementation in manufacturing companies. Despite this limitation, policymakers should be aware that the evidence suggests that EMS or EnMS implementation is unlikely to enhance the adoption of ERTs in the short term.

5.3. Limitations of the Research

It is important to acknowledge that our research has certain limitations. Firstly, it focuses specifically on one group of EETs, i.e., ERTs, that are specifically defined in the survey as “technologies to recuperate kinetic and process energy (e.g., waste heat recovery, energy storage)” and that are directly associated with the production phase. Secondly, the research sample is limited to manufacturing companies (NACE 10-33) that have more than 20 employees and are situated in five European countries.

Author Contributions

Conceptualization, J.Š. and J.P.; methodology, J.Š. and J.P.; formal analysis, J.Š. and J.P.; data curation, J.Š. and J.P.; writing—original draft preparation, J.Š. and J.P.; writing—review and editing, J.Š., J.P. and M.Š.; visualization, J.Š. and J.P.; funding acquisition, J.Š. All authors have read and agreed to the published version of the manuscript.

Funding

This contribution was supported by research grant VEGA 1/0219/23 “Empirical research of the relation of implementation of advanced technologies and sustainable behavior of manufacturing companies in Slovakia”.

Institutional Review Board Statement

Not applicable.

Informed Consent Statement

Not applicable.

Data Availability Statement

Third-party data. Restrictions apply to the availability of these data. Data for Slovakia and Croatia are available upon on the authors’ permission. Data for Austria, Lithuania, and Slovenia were obtained from the persons responsible for the European Manufacturing Survey in their particular country and the authors do not have permission to share them publicly.

Acknowledgments

The authors would like to thank the EMS consortium for methodological support for the research.

Conflicts of Interest

The authors declare no conflict of interest.

Appendix A

Table A1. Delay between EMS and ERT Implementation.
Year of Implementation of EMS
(Year)
Year of Implementation of ERTs
(Year)
Delay between EMS and ERT Implementation
(Years)
200720158
2004201612
2000201515
20001997
20192018
20182015
20172015
200720125
2000201515
201320174
20152000
20111990
20092009
2000201515
200420139
20182010
1998201517
2001201211
20102010
20152015
20102007
20162003
200720158
20041998
201020111
2000201717
200920167
20052005
20052000
2005201712
20162016
20122012
200820179
20121980
2002201513
200820078
Bold numbers indicate that the EMS was implemented before ERTs.
Table A2. Delay between EnMS and ERT Implementation.
Year of Implementation of EnMS
(Year)
Year of Implementation of ERTs
(Year)
Delay between EnMS and ERT Implementation
(Years)
20112008
20082008
200120109
20172016
20032003
20162016
20182016
20192018
20172015
20172012
20172009
20172013
20152015
20152010
20162003
20182015
2000201717
201320185
20122005
20102002
20102010
20162010
20142013
20161998
20052005
201420151
20112008
20122001
20141990
201520161
200120043
20162013
20151980
20142007
20152000
20132003
20152010
20102010
Bold numbers indicate that the EnMS was implemented before ERTs.

References

  1. Bourghelle, D.; Jawadi, F.; Rozin, P. Oil Price Volatility in the Context of COVID-19. Int. Econ. 2021, 167, 39–49. [Google Scholar] [CrossRef]
  2. Zhang, C.; Mou, X.; Ye, S. How Do Dynamic Jumps in Global Crude Oil Prices Impact China’s Industrial Sector? Energy 2022, 249, 123605. [Google Scholar] [CrossRef]
  3. Clairand, J.-M.; Briceño-León, M.; Escrivá-Escrivá, G.; Pantaleo, A.M. Review of Energy Efficiency Technologies in the Food Industry: Trends, Barriers, and Opportunities. IEEE Access 2020, 8, 48015–48029. [Google Scholar] [CrossRef]
  4. Marques, M. Potential for ORC Application in the Portuguese Manufacturing Industry. Master’s Thesis, Faculdade de Ciências e Tecnologia, Lisboa, Portugal, 2014. [Google Scholar]
  5. Zhang, Q.; Zhao, X.; Lu, H.; Ni, T.; Li, Y. Waste Energy Recovery and Energy Efficiency Improvement in China’s Iron and Steel Industry. Appl. Energy 2017, 191, 502–520. [Google Scholar] [CrossRef]
  6. Palomba, I.; Wehrle, E.; Carabin, G.; Vidoni, R. Minimization of the Energy Consumption in Industrial Robots through Regenerative Drives and Optimally Designed Compliant Elements. Appl. Sci. 2020, 10, 7475. [Google Scholar] [CrossRef]
  7. Grebers, R.; Gadaleta, M.; Paugurs, A.; Senfelds, A.; Avotins, A.; Pellicciari, M. Analysis of the Energy Consumption of a Novel DC Power Supplied Industrial Robot. Procedia Manuf. 2017, 11, 311–318. [Google Scholar] [CrossRef]
  8. Eurostat Energy Balance Visualisation Tool. Available online: https://ec.europa.eu/eurostat/cache/infographs/energy_balances/enbal.html (accessed on 15 June 2022).
  9. Costa-Campi, M.T.; García-Quevedo, J.; Segarra, A. Energy Efficiency Determinants: An Empirical Analysis of Spanish Innovative Firms. Energy Policy 2015, 83, 229–239. [Google Scholar] [CrossRef]
  10. Vimal, K.E.K.; Kulatunga, A.K.; Ravichandran, M.; Kandasamy, J. Application of Multi Grade Fuzzy Approach to Compute the Circularity Index of Manufacturing Organizations. Procedia CIRP 2021, 98, 476–481. [Google Scholar] [CrossRef]
  11. Fu, Y.; Kok, R.A.W.; Dankbaar, B.; Ligthart, P.E.M.; van Riel, A.C.R. Factors Affecting Sustainable Process Technology Adoption: A Systematic Literature Review. J. Clean. Prod. 2018, 205, 226–251. [Google Scholar] [CrossRef]
  12. Reddy, K.N.; Kumar, A. Capacity Investment and Inventory Planning for a Hybrid Manufacturing—Remanufacturing System in the Circular Economy. Int. J. Prod. Res. 2021, 59, 2450–2478. [Google Scholar] [CrossRef]
  13. Šebo, J.; Šebová, M.; Palčič, I. Implementation of Circular Economy Technologies: An Empirical Study of Slovak and Slovenian Manufacturing Companies. Sustainability 2021, 13, 12518. [Google Scholar] [CrossRef]
  14. Dijken, K.V.; Prince, Y.; Wolters, T.J.; Frey, M.; Mussati, G.; Kalff, P.; Hansen, O.; Kerndrup, S.; Søndergård, B.; Rodrigues, E.L.; et al. Adoption of Environmental Innovations: The Dynamics of Innovation as Interplay between Business Competence, Environmental Orientation and Network Involvement; Springer Science & Business Media: Berlin/Heidelberg, Germany, 1999; ISBN 978-0-7923-5561-8. [Google Scholar]
  15. Mattes, J.; Huber, A.; Koehrsen, J. Energy Transitions in Small-Scale Regions—What We Can Learn from a Regional Innovation Systems Perspective. Energy Policy 2015, 78, 255–264. [Google Scholar] [CrossRef]
  16. Haider, S.; Danish, M.S.; Sharma, R. Assessing Energy Efficiency of Indian Paper Industry and Influencing Factors: A Slack-Based Firm-Level Analysis. Energy Econ. 2019, 81, 454–464. [Google Scholar] [CrossRef]
  17. Cantore, N. Factors Affecting the Adoption of Energy Efficiency in the Manufacturing Sector of Developing Countries. Energy Effic. 2017, 10, 743–752. [Google Scholar] [CrossRef]
  18. Schützenhofer, C. Overcoming the Efficiency Gap: Energy Management as a Means for Overcoming Barriers to Energy Efficiency, Empirical Support in the Case of Austrian Large Firms. Energy Effic. 2021, 14, 45. [Google Scholar] [CrossRef]
  19. Cagno, E.; Trianni, A.; Spallina, G.; Marchesani, F. Drivers for Energy Efficiency and Their Effect on Barriers: Empirical Evidence from Italian Manufacturing Enterprises. Energy Effic. 2017, 10, 855–869. [Google Scholar] [CrossRef]
  20. Thollander, P.; Danestig, M.; Rohdin, P. Energy Policies for Increased Industrial Energy Efficiency: Evaluation of a Local Energy Programme for Manufacturing SMEs. Energy Policy 2007, 35, 5774–5783. [Google Scholar] [CrossRef]
  21. Kounetas, K.; Tsekouras, K. The Energy Efficiency Paradox Revisited through a Partial Observability Approach. Energy Econ. 2008, 30, 2517–2536. [Google Scholar] [CrossRef]
  22. Solnørdal, M.T.; Foss, L. Closing the Energy Efficiency Gap—A Systematic Review of Empirical Articles on Drivers to Energy Efficiency in Manufacturing Firms. Energies 2018, 11, 518. [Google Scholar] [CrossRef]
  23. Okereke, C. An Exploration of Motivations, Drivers and Barriers to Carbon Management:: The UK FTSE 100. Eur. Manag. J. 2007, 25, 475–486. [Google Scholar] [CrossRef]
  24. Garrone, P.; Grilli, L.; Mrkajic, B. The Energy-Efficient Transformation of EU Business Enterprises: Adapting Policies to Contextual Factors. Energy Policy 2017, 109, 49–58. [Google Scholar] [CrossRef]
  25. Lee, K.-H. Drivers and Barriers to Energy Efficiency Management for Sustainable Development. Sustain. Dev. 2015, 23, 16–25. [Google Scholar] [CrossRef]
  26. Thollander, P.; Backlund, S.; Trianni, A.; Cagno, E. Beyond Barriers—A Case Study on Driving Forces for Improved Energy Efficiency in the Foundry Industries in Finland, France, Germany, Italy, Poland, Spain, and Sweden. Appl. Energy 2013, 111, 636–643. [Google Scholar] [CrossRef]
  27. Timilsina, G.R.; Hochman, G.; Fedets, I. Understanding Energy Efficiency Barriers in Ukraine: Insights from a Survey of Commercial and Industrial Firms. Energy 2016, 106, 203–211. [Google Scholar] [CrossRef]
  28. Parker, S.; Liddle, B. Energy Efficiency in the Manufacturing Sector of the OECD: Analysis of Price Elasticities. Energy Econ. 2016, 58, 38–45. [Google Scholar] [CrossRef]
  29. Askarany, D.; Yazdifar, H.; Dow, K. B2B Networking, Renewable Energy, and Sustainability. J. Risk Financ. Manag. 2021, 14, 290. [Google Scholar] [CrossRef]
  30. May, G.; Stahl, B.; Taisch, M. Energy Management in Manufacturing: Toward Eco-Factories of the Future—A Focus Group Study. Appl. Energy 2016, 164, 628–638. [Google Scholar] [CrossRef]
  31. Zhu, J.; Niu, L.; Ruth, M.; Shi, L. Technological Change and Energy Efficiency in Large Chinese Firms. Ecol. Econ. 2018, 150, 241–250. [Google Scholar] [CrossRef]
  32. Accordini, D.; Cagno, E.; Trianni, A. Identification and Characterization of Decision-Making Factors over Industrial Energy Efficiency Measures in Electric Motor Systems. Renew. Sustain. Energy Rev. 2021, 149, 111354. [Google Scholar] [CrossRef]
  33. Johansen, J.P.; Isaeva, I. Developing and (Not) Implementing Radical Energy Efficiency Innovations: A Case Study of R&D Projects in the Norwegian Manufacturing Industry. J. Clean. Prod. 2021, 322, 129077. [Google Scholar] [CrossRef]
  34. Cagno, E.; Trianni, A. Exploring Drivers for Energy Efficiency within Small- and Medium-Sized Enterprises: First Evidences from Italian Manufacturing Enterprises. Appl. Energy 2013, 104, 276–285. [Google Scholar] [CrossRef]
  35. Hrovatin, N.; Dolšak, N.; Zorić, J. Factors Impacting Investments in Energy Efficiency and Clean Technologies: Empirical Evidence from Slovenian Manufacturing Firms. J. Clean. Prod. 2016, 127, 475–486. [Google Scholar] [CrossRef]
  36. Backlund, S.; Thollander, P.; Palm, J.; Ottosson, M. Extending the Energy Efficiency Gap. Energy Policy 2012, 51, 392–396. [Google Scholar] [CrossRef]
  37. de Groot, H.L.F.; Verhoef, E.T.; Nijkamp, P. Energy Saving by Firms: Decision-Making, Barriers and Policies. Energy Econ. 2001, 23, 717–740. [Google Scholar] [CrossRef]
  38. De Marchi, V. Environmental Innovation and R&D Cooperation: Empirical Evidence from Spanish Manufacturing Firms. Res. Policy 2012, 41, 614–623. [Google Scholar] [CrossRef]
  39. Trianni, A.; Cagno, E.; Farné, S. Barriers, Drivers and Decision-Making Process for Industrial Energy Efficiency: A Broad Study among Manufacturing Small and Medium-Sized Enterprises. Appl. Energy 2016, 162, 1537–1551. [Google Scholar] [CrossRef]
  40. Urpelainen, J. Export Orientation and Domestic Electricity Generation: Effects on Energy Efficiency Innovation in Select Sectors. Energy Policy 2011, 39, 5638–5646. [Google Scholar] [CrossRef]
  41. Fernando, Y.; Hor, W.L. Impacts of Energy Management Practices on Energy Efficiency and Carbon Emissions Reduction: A Survey of Malaysian Manufacturing Firms. Resour. Conserv. Recycl. 2017, 126, 62–73. [Google Scholar] [CrossRef]
  42. Palm, J.; Thollander, P. Chapter 2.3—Reframing Energy Efficiency in Industry: A Discussion of Definitions, Rationales, and Management Practices. In Energy and Behaviour; Lopes, M., Antunes, C.H., Janda, K.B., Eds.; Academic Press: Cambridge, MA, USA, 2020; pp. 153–175. ISBN 978-0-12-818567-4. [Google Scholar]
  43. Jeong, S.; Lee, J. Environment and Energy? The Impact of Environmental Management Systems on Energy Efficiency. Manuf. Serv. Oper. Manag. 2022, 24, 1311–1328. [Google Scholar] [CrossRef]
  44. Zobel, T.; Malmgren, C. Evaluating the Management System Approach for Industrial Energy Efficiency Improvements. Energies 2016, 9, 774. [Google Scholar] [CrossRef]
  45. Hrovatin, N.; Cagno, E.; Dolšak, J.; Zorić, J. How Important Are Perceived Barriers and Drivers versus Other Contextual Factors for the Adoption of Energy Efficiency Measures: An Empirical Investigation in Manufacturing SMEs. J. Clean. Prod. 2021, 323, 129123. [Google Scholar] [CrossRef]
  46. Schulze, M.; Heidenreich, S.; Spieth, P. The Impact of Energy Management Control Systems on Energy Efficiency in the German Manufacturing Industry. J. Ind. Ecol. 2018, 22, 813–826. [Google Scholar] [CrossRef]
  47. Gerstlberger, W.; Knudsen, M.P.; Dachs, B.; Schröter, M. Closing the Energy-Efficiency Technology Gap in European Firms? Innovation and Adoption of Energy Efficiency Technologies. J. Eng. Technol. Manag. 2016, 40, 87–100. [Google Scholar] [CrossRef]
  48. Bunse, K.; Vodicka, M.; Schönsleben, P.; Brülhart, M.; Ernst, F.O. Integrating Energy Efficiency Performance in Production Management—Gap Analysis between Industrial Needs and Scientific Literature. J. Clean. Prod. 2011, 19, 667–679. [Google Scholar] [CrossRef]
  49. ISO 14001:2015; Environmental Management Systems—Requirements with Guidance for Use. International Organization for Standardization: Geneva, Switzerland, 2021.
  50. Introna, V.; Cesarotti, V.; Benedetti, M.; Biagiotti, S.; Rotunno, R. Energy Management Maturity Model: An Organizational Tool to Foster the Continuous Reduction of Energy Consumption in Companies. J. Clean. Prod. 2014, 83, 108–117. [Google Scholar] [CrossRef]
  51. Franz, E.; Erler, F.; Langer, T.; Schlegel, A.; Stoldt, J.; Richter, M.; Putz, M. Requirements and Tasks for Active Energy Management Systems in Automotive Industry. Procedia Manuf. 2017, 8, 175–182. [Google Scholar] [CrossRef]
  52. Johansson, M.T.; Thollander, P. A Review of Barriers to and Driving Forces for Improved Energy Efficiency in Swedish Industry—Recommendations for Successful in-House Energy Management. Renew. Sustain. Energy Rev. 2018, 82, 618–628. [Google Scholar] [CrossRef]
  53. ISO 50001:2018; Energy Management Systems—Requirements with Guidance for Use. International Organization for Standardization: Geneva, Switzerland, 2018.
  54. Cooremans, C.; Schönenberger, A. Energy Management: A Key Driver of Energy-Efficiency Investment? J. Clean. Prod. 2019, 230, 264–275. [Google Scholar] [CrossRef]
  55. McKane, A. Thinking Globally: How ISO 50001—Energy Management Can Make Industrial Energy Efficiency Standard Practice. 2009. Available online: https://www.osti.gov/servlets/purl/983191-68x6aK/ (accessed on 7 July 2023).
  56. International Energy Agency. Tracking Industrial Energy Efficiency and CO2 Emissions: A Technology Perspective; IEA: Paris, France, 2007; ISBN 978-92-64-03016-9. [Google Scholar]
  57. Brückner, S.; Liu, S.; Miró, L.; Radspieler, M.; Cabeza, L.F.; Lävemann, E. Industrial Waste Heat Recovery Technologies: An Economic Analysis of Heat Transformation Technologies. Appl. Energy 2015, 151, 157–167. [Google Scholar] [CrossRef]
  58. Wu, Z.; Pan, D.; Gao, N.; Zhu, T.; Xie, F. Experimental Testing and Numerical Simulation of Scroll Expander in a Small Scale Organic Rankine Cycle System. Appl. Therm. Eng. 2015, 87, 529–537. [Google Scholar] [CrossRef]
  59. Algieri, A.; Šebo, J. Energetic Investigation of Organic Rankine Cycles (ORCs) for the Exploitation of Low-Temperature Geothermal Sources—A Possible Application in Slovakia. Procedia Comput. Sci. 2017, 109, 833–840. [Google Scholar] [CrossRef]
  60. Albayrak, F.İ.; Ergün, A.; Yıldız, G. Performance, Exergy, and Environmental Analysis of Blast Furnace Top Pressure Turbine in an Iron-Steel Factory. Period. Eng. Nat. Sci. 2023, 11, 189–202. [Google Scholar] [CrossRef]
  61. Smith, K.M.; Wilson, S.; Lant, P.; Hassall, M.E. How Do We Learn about Drivers for Industrial Energy Efficiency—Current State of Knowledge. Energies 2022, 15, 2642. [Google Scholar] [CrossRef]
  62. Zahradnik, G.; Dachs, B.; Rhomberg, W. Karl-Heinz Leitner trends und entwicklungen in der österreichischen produktion Highlights Aus Dem European Manufacturing Survey 2018. 2019. Available online: https://www.researchgate.net/publication/336825165_TRENDS_UND_ENTWICKLUNGEN_IN_DER_OSTERREICHISCHEN_PRODUKTION_Highlights_aus_dem_European_Manufacturing_Survey_2018 (accessed on 7 September 2022). [CrossRef]
  63. Vilkas, M.; Rauleckas, R.; Šeinauskienė, B.; Rutelionė, A. Lean, Agile and Service-Oriented Performers: Templates of Organising in a Global Production Field. Total Qual. Manag. Bus. Excell. 2021, 32, 1122–1146. [Google Scholar] [CrossRef]
  64. Sebo, J.; Kádárová, J.; Malega, P. Barriers and Motives Experienced by Manufacturing Companies in Implementing Circular Economy Initiatives: The Case of Manufacturing Industry in Slovakia. In Proceedings of the 2019 International Council on Technologies of Environmental Protection (ICTEP), Starý Smokovec, Slovakia, 23–25 October 2019; pp. 226–229. [Google Scholar]
  65. Palčič, I.; Prester, J. Impact of Advanced Manufacturing Technologies on Green Innovation. Sustainability 2020, 12, 3499. [Google Scholar] [CrossRef]
  66. ISO 9001:2015; Quality Management Systems—Requirements. International Organization for Standardization: Geneva, Switzerland, 2015.
  67. De Oliveira, O.J.; Serra, J.R.; Salgado, M.H. Does ISO 14001 Work in Brazil? J. Clean. Prod. 2010, 18, 1797–1806. [Google Scholar] [CrossRef]
  68. Johnstone, N.; Scapecchi, P.; Ytterhus, B.; Wolff, R. The Firm, Environmental Management and Environmental Measures: Lessons from a Survey of European Manufacturing Firms. J. Environ. Plan. Manag. 2010, 47, 685–707. [Google Scholar] [CrossRef]
  69. Bayo-Moriones, A.; Bello-Pintado, A.; Merino-Díaz de Cerio, J. 5S Use in Manufacturing Plants: Contextual Factors and Impact on Operating Performance. Int. J. Qual. Reliab. Manag. 2010, 27, 217–230. [Google Scholar] [CrossRef]
Figure 1. Research model 1 (left) and research model 2 (right).
Sustainability 15 16913 g001
Figure 2. Distribution of implementation years for EMSs and ERTs.
Sustainability 15 16913 g002
Figure 3. Distribution of implementation years for EnMSs and ERTs.
Sustainability 15 16913 g003
Table 1. Basic characteristics of the sample (n = 798).
Country NameFrequencyPercent
Lithuania19924.9
Slovenia12715.9
Croatia10513.2
Slovakia11414.3
Austria25331.7
Total798100
Small
<50 employees
Medium
50–249 employees
Large
>250 employees
EMS264739
EnMS275550
ERTs 699064
Table 2. Results of two-step OLS regression analyses.
Standardized Coefficients Collinearity Statistics
Step BetaSig.VIF
1(Constant) 0.844
Complexity of the product−0.0340.5451.026
Industry (NACE)0.0220.7451.505
Industry technology intensity0.0410.5461.487
Size of the firms0.2140.0001.041
Country−0.0570.3251.069
2(Constant) 0.834
Complexity of the product−0.0470.4021.035
Industry (NACE)0.0270.6931.512
Industry technology intensity0.0380.5721.489
Size of the firms0.1570.0101.186
Country−0.0430.4601.079
EMS (e.g., ISO 14001) *0.1300.0331.198
EnMS (e.g., ISO 50001) *0.0990.0931.119
CQS (e.g., ISO 9001) *−0.0070.9061.030
Remark: * currently used.
Table 3. Statistical differences among four groups of companies based on current and planned use of ERTs.
Four Groups of Management Systems *
Current Use of ERTsNo EMS or EnMSEMSEnMSEMS + EnMSTotal
NoCount (% within group)151 (82.5%)67 (68.4%)6 (75.0%)15 (51.7%)239 (75.2%)
YesCount (% within group)32 (17.5%)31 (31.6%)2 (25.0%)14 (48.3%)79 (24.8%)
TotalCount (% within group)183 (100%)98 (100.0%)8 (100.0%)29(100.0%)318 (100.0%)
Planned use of ERTs
NoCount (% within group)163 (88.1%)88 (89.8%)8 (100%)25 (86.2%)284 (88.8%)
YesCount (% within group)22 (11.9%)10 (10.2%)0 (0.0%)4 (13.8%)36 (11.3%)
TotalCount (% within group)185 (100%)98 (100%)8 (100%)29 (100%)320 (100%)
* Significant chi-squared test for differences between groups in the case of “current use of ERTs”. Non-significant chi-squared test for differences between groups in the case of “planned use of ERTs” (p = 0.709).
Table 4. Statistical differences among two groups of companies based on planned use of EMSs or EnMSs.
Currently Using ERTs *
Planned Use of EMSNo YesTotal
NoCount (% within group)203 (81.5%) 74 (91.4%)27 (783.9%)
YesCount (% within group)46 (18.5%)7 (8.6%)53 (16.1%)
TotalCount (% within group)249 (100.0%)81(100.0%)330 (100.0%)
Planned use of EnMS
NoCount (% within group)402 (84.8%)153 (86.9%)555 (85.4%)
YesCount (% within group)72 (15.2%)23 (13.1%)95 (14.6%)
TotalCount (% within group)474 (100.0%)176 (100.0%)650 (100.0%)
* Significant chi-squared test for the difference between groups in the case of “planned use of EMS” (p = 0.023); non-significant chi-squared test for the difference between groups in the case of “planned use of EnMS” (p = 0.293).
Disclaimer/Publisher’s Note: The statements, opinions and data contained in all publications are solely those of the individual author(s) and contributor(s) and not of MDPI and/or the editor(s). MDPI and/or the editor(s) disclaim responsibility for any injury to people or property resulting from any ideas, methods, instructions or products referred to in the content.

