
Land Surface Temperature and Urban Policies: The Ferrara City Case Study


Abstract
:1. Introduction
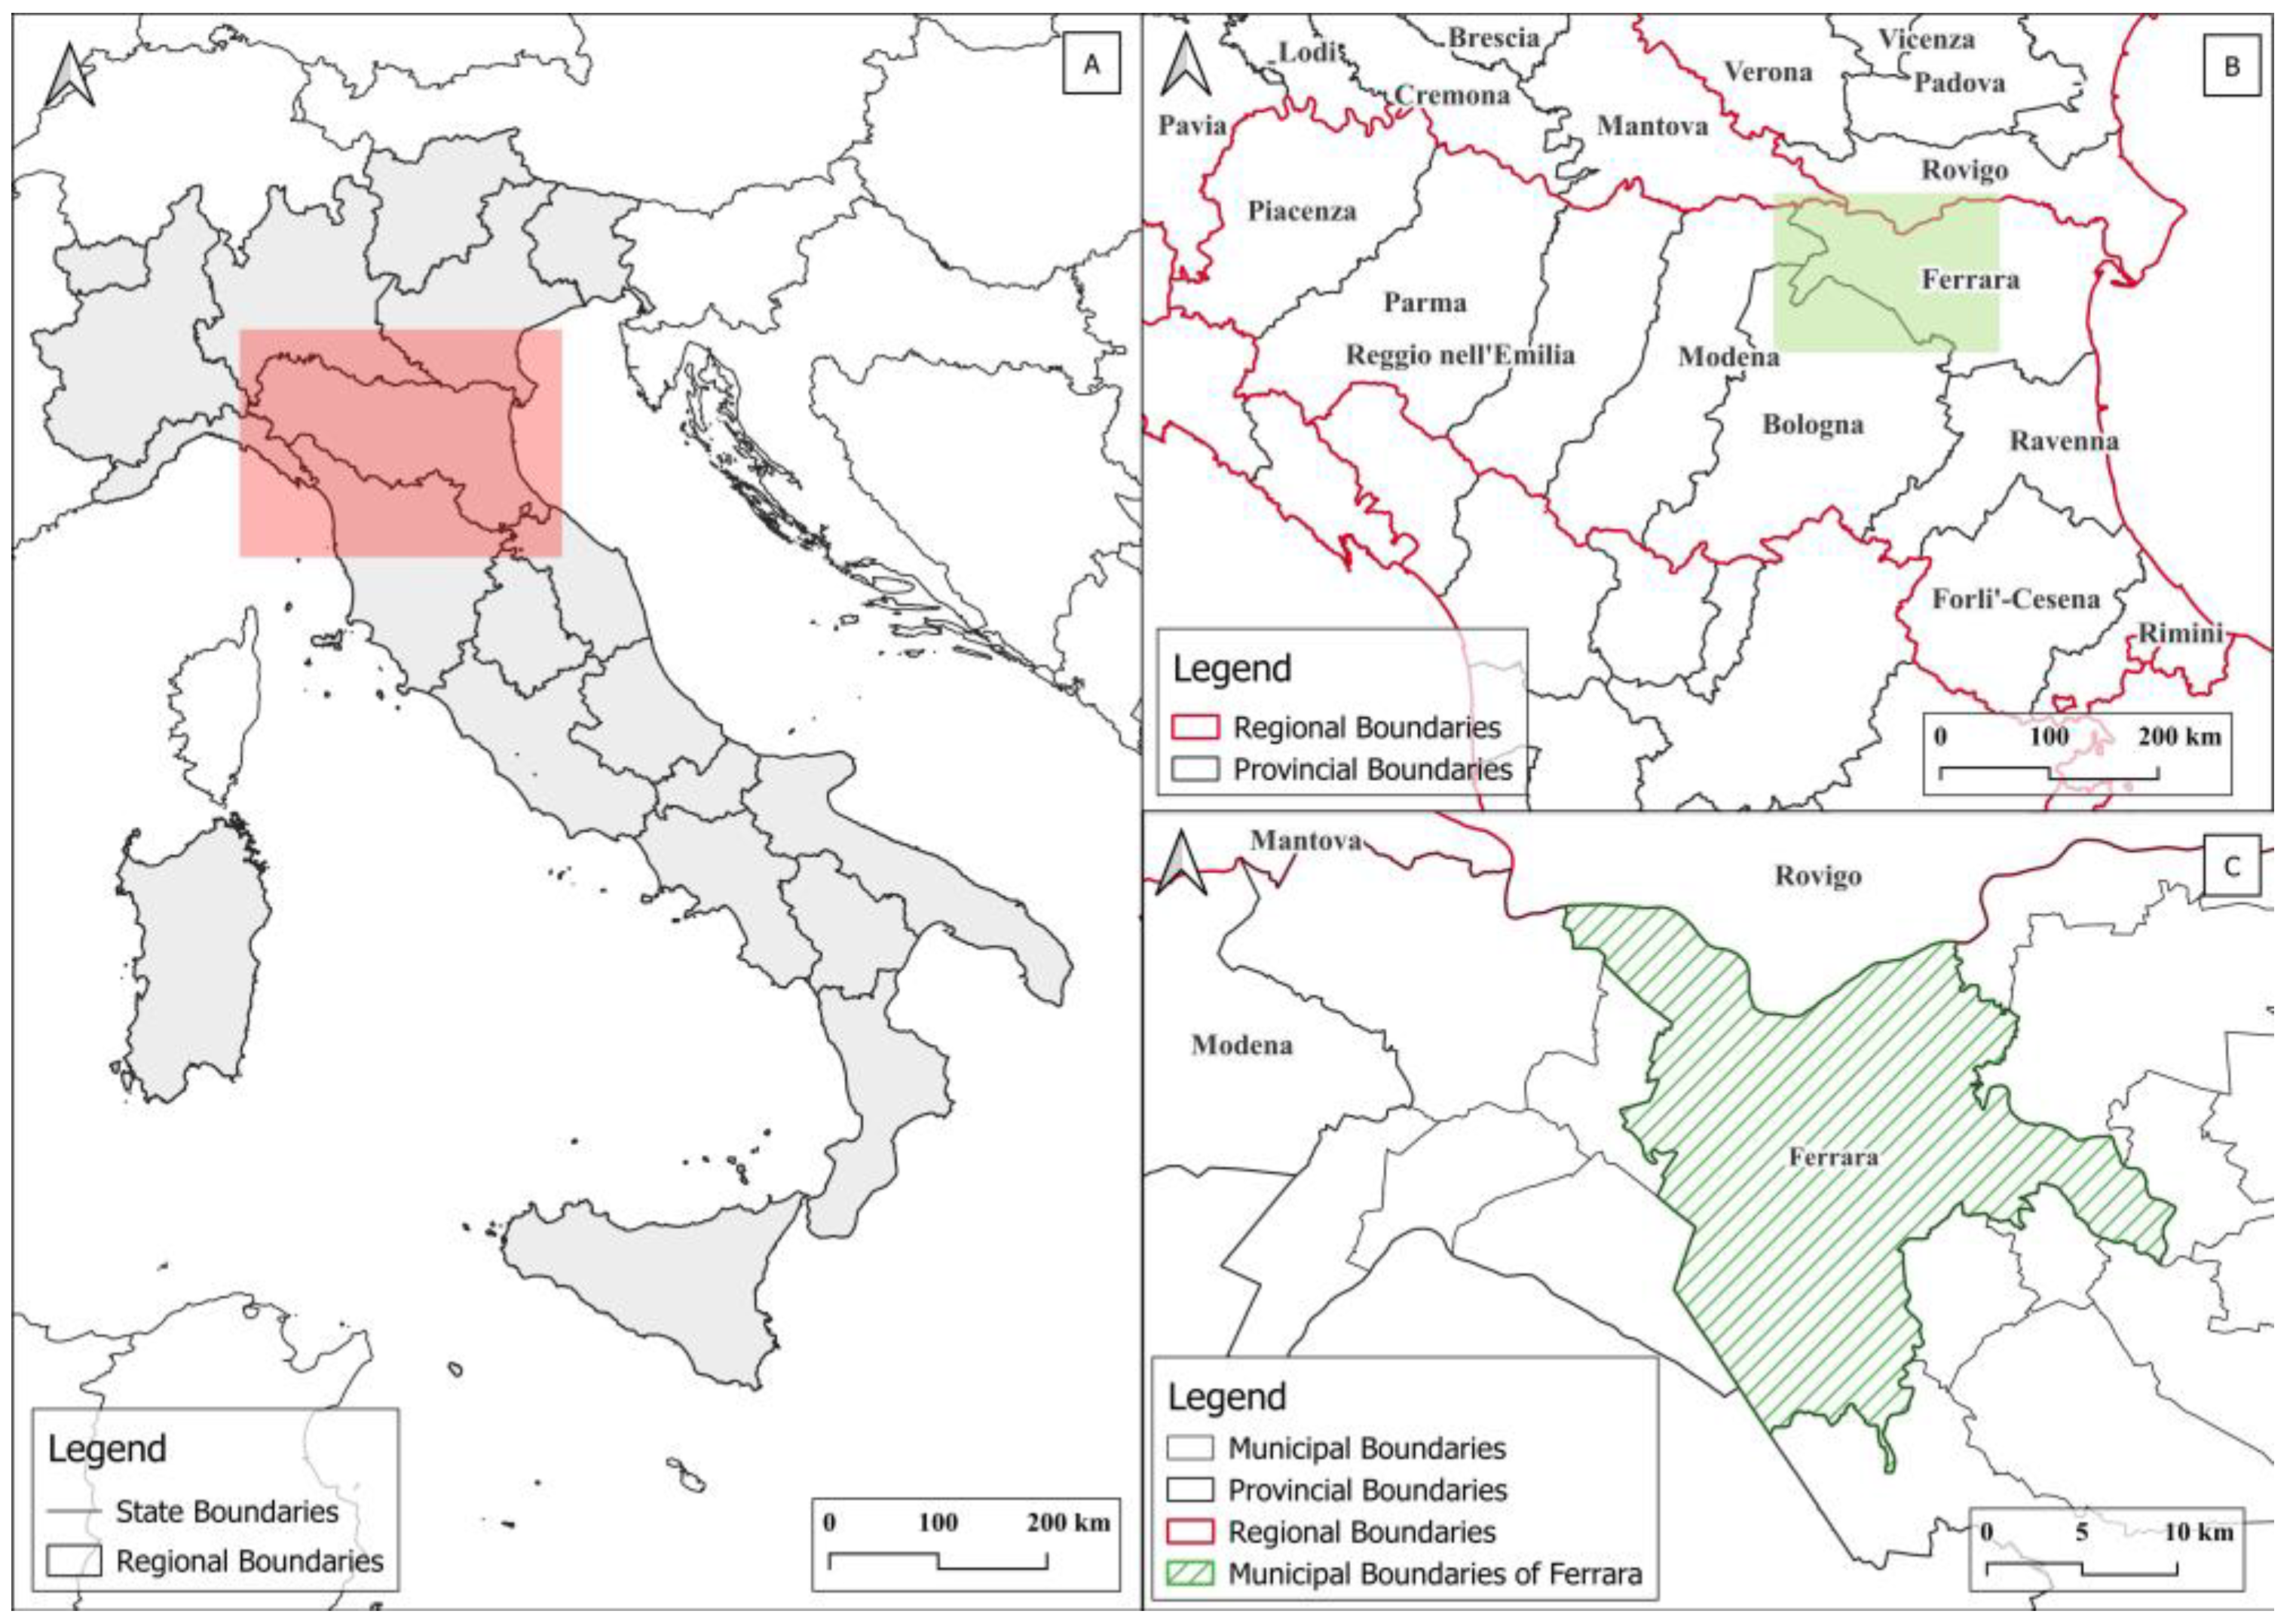
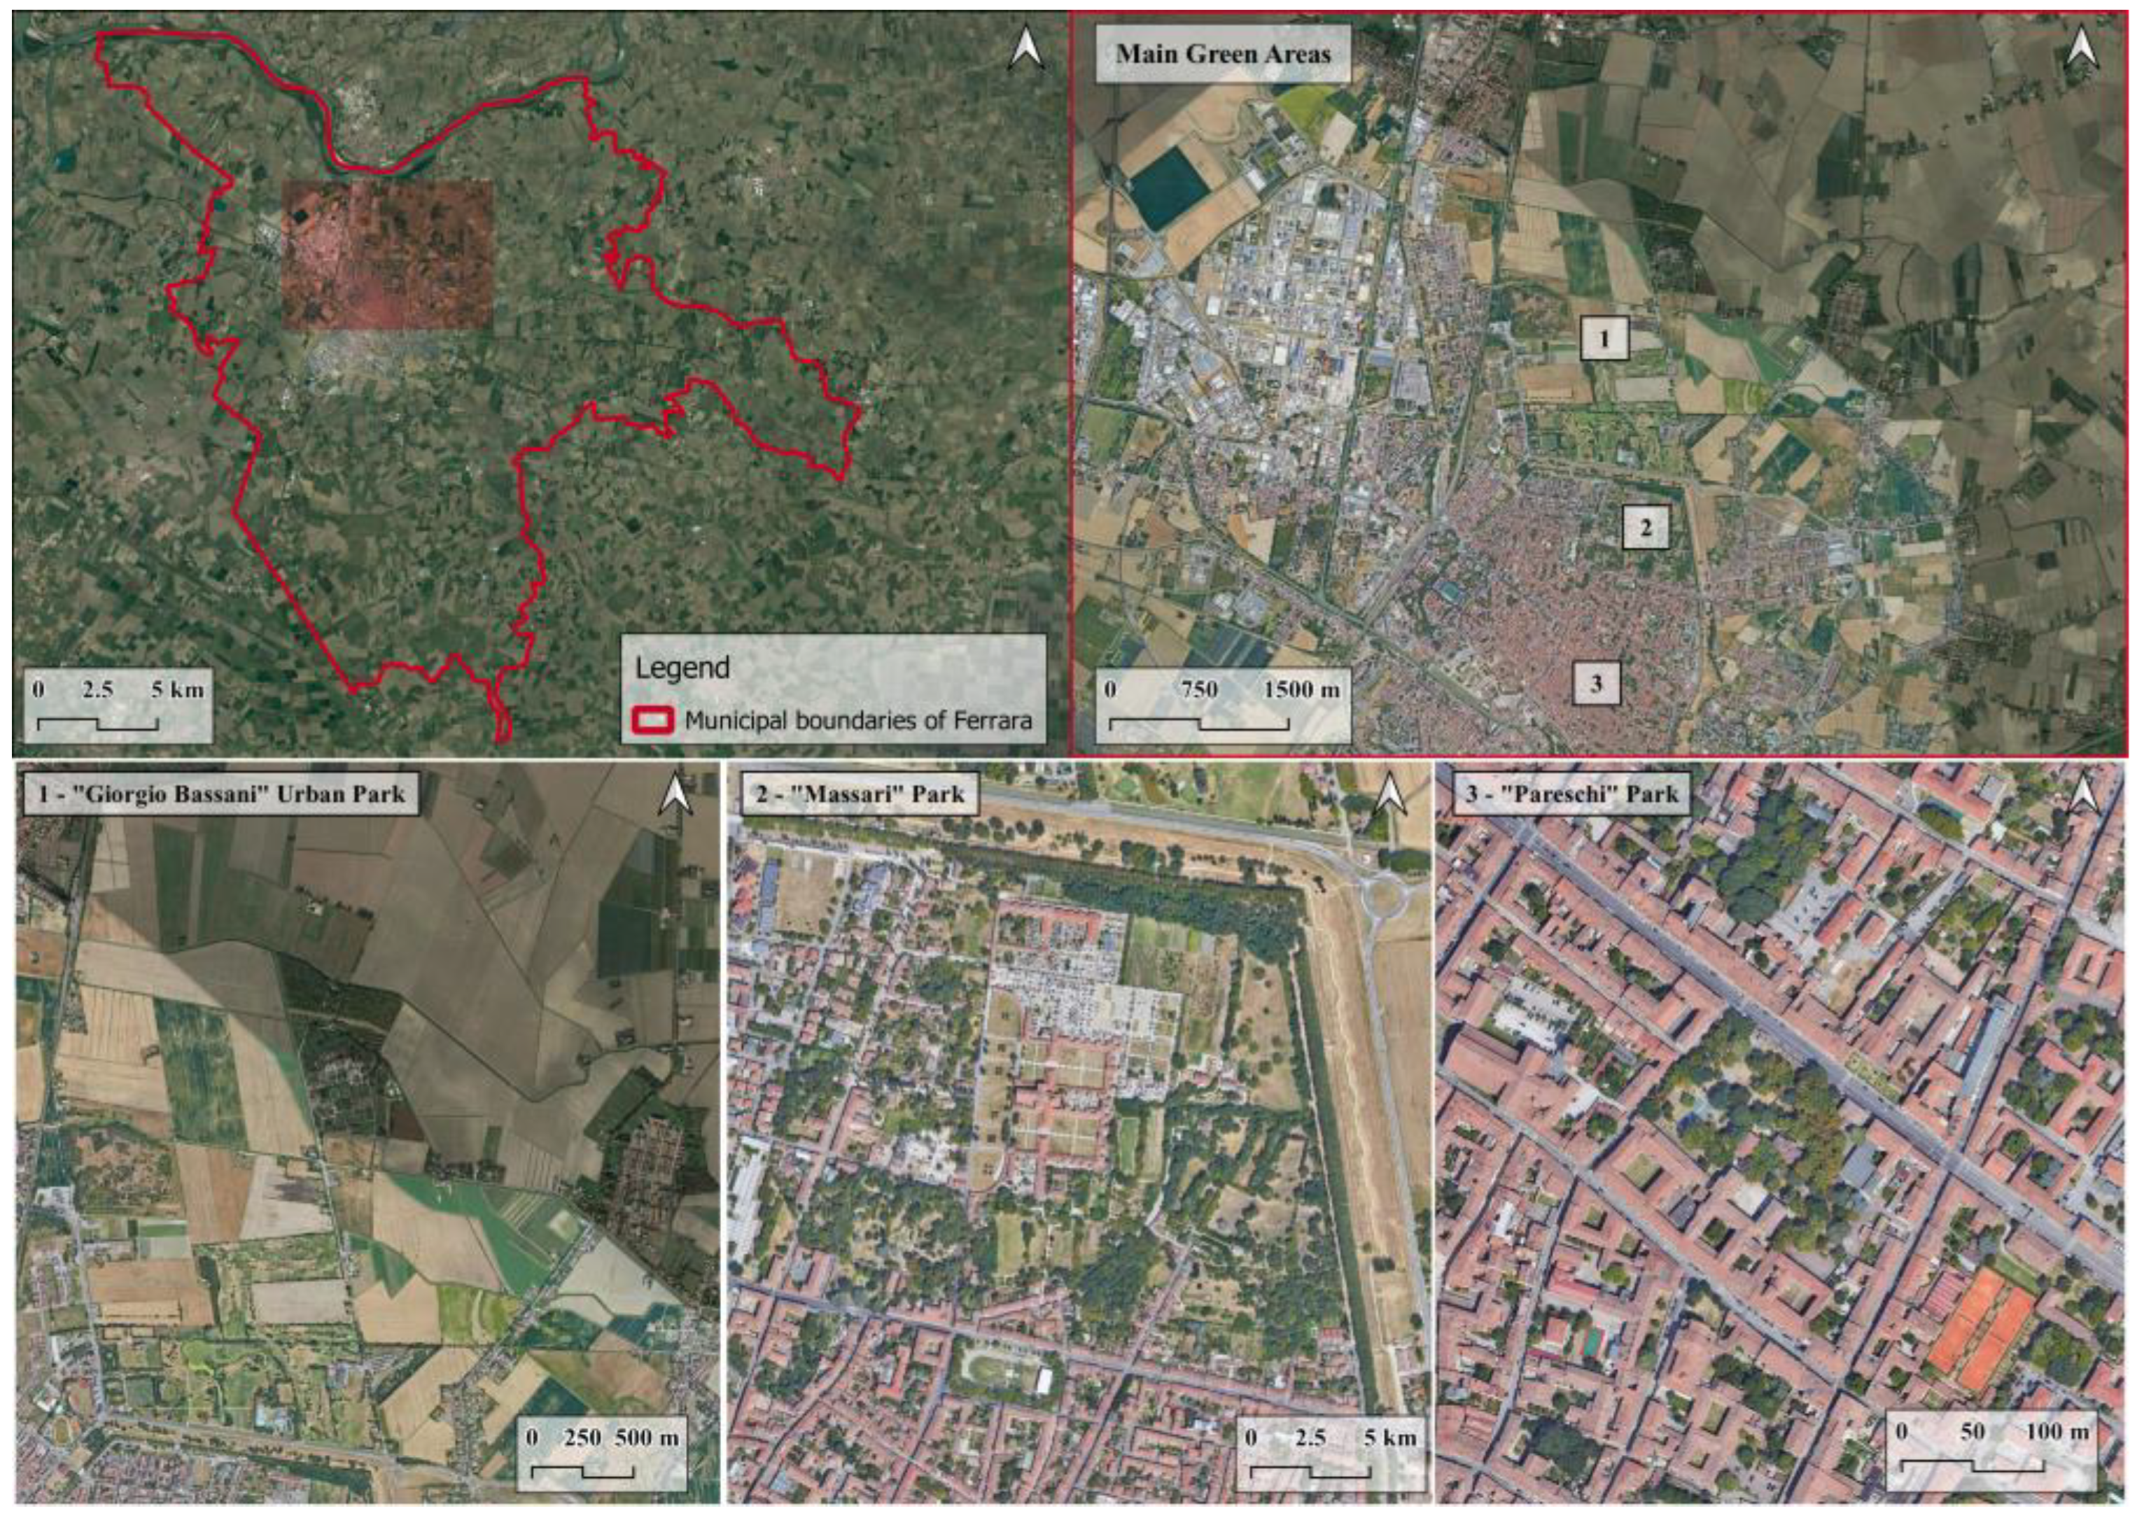
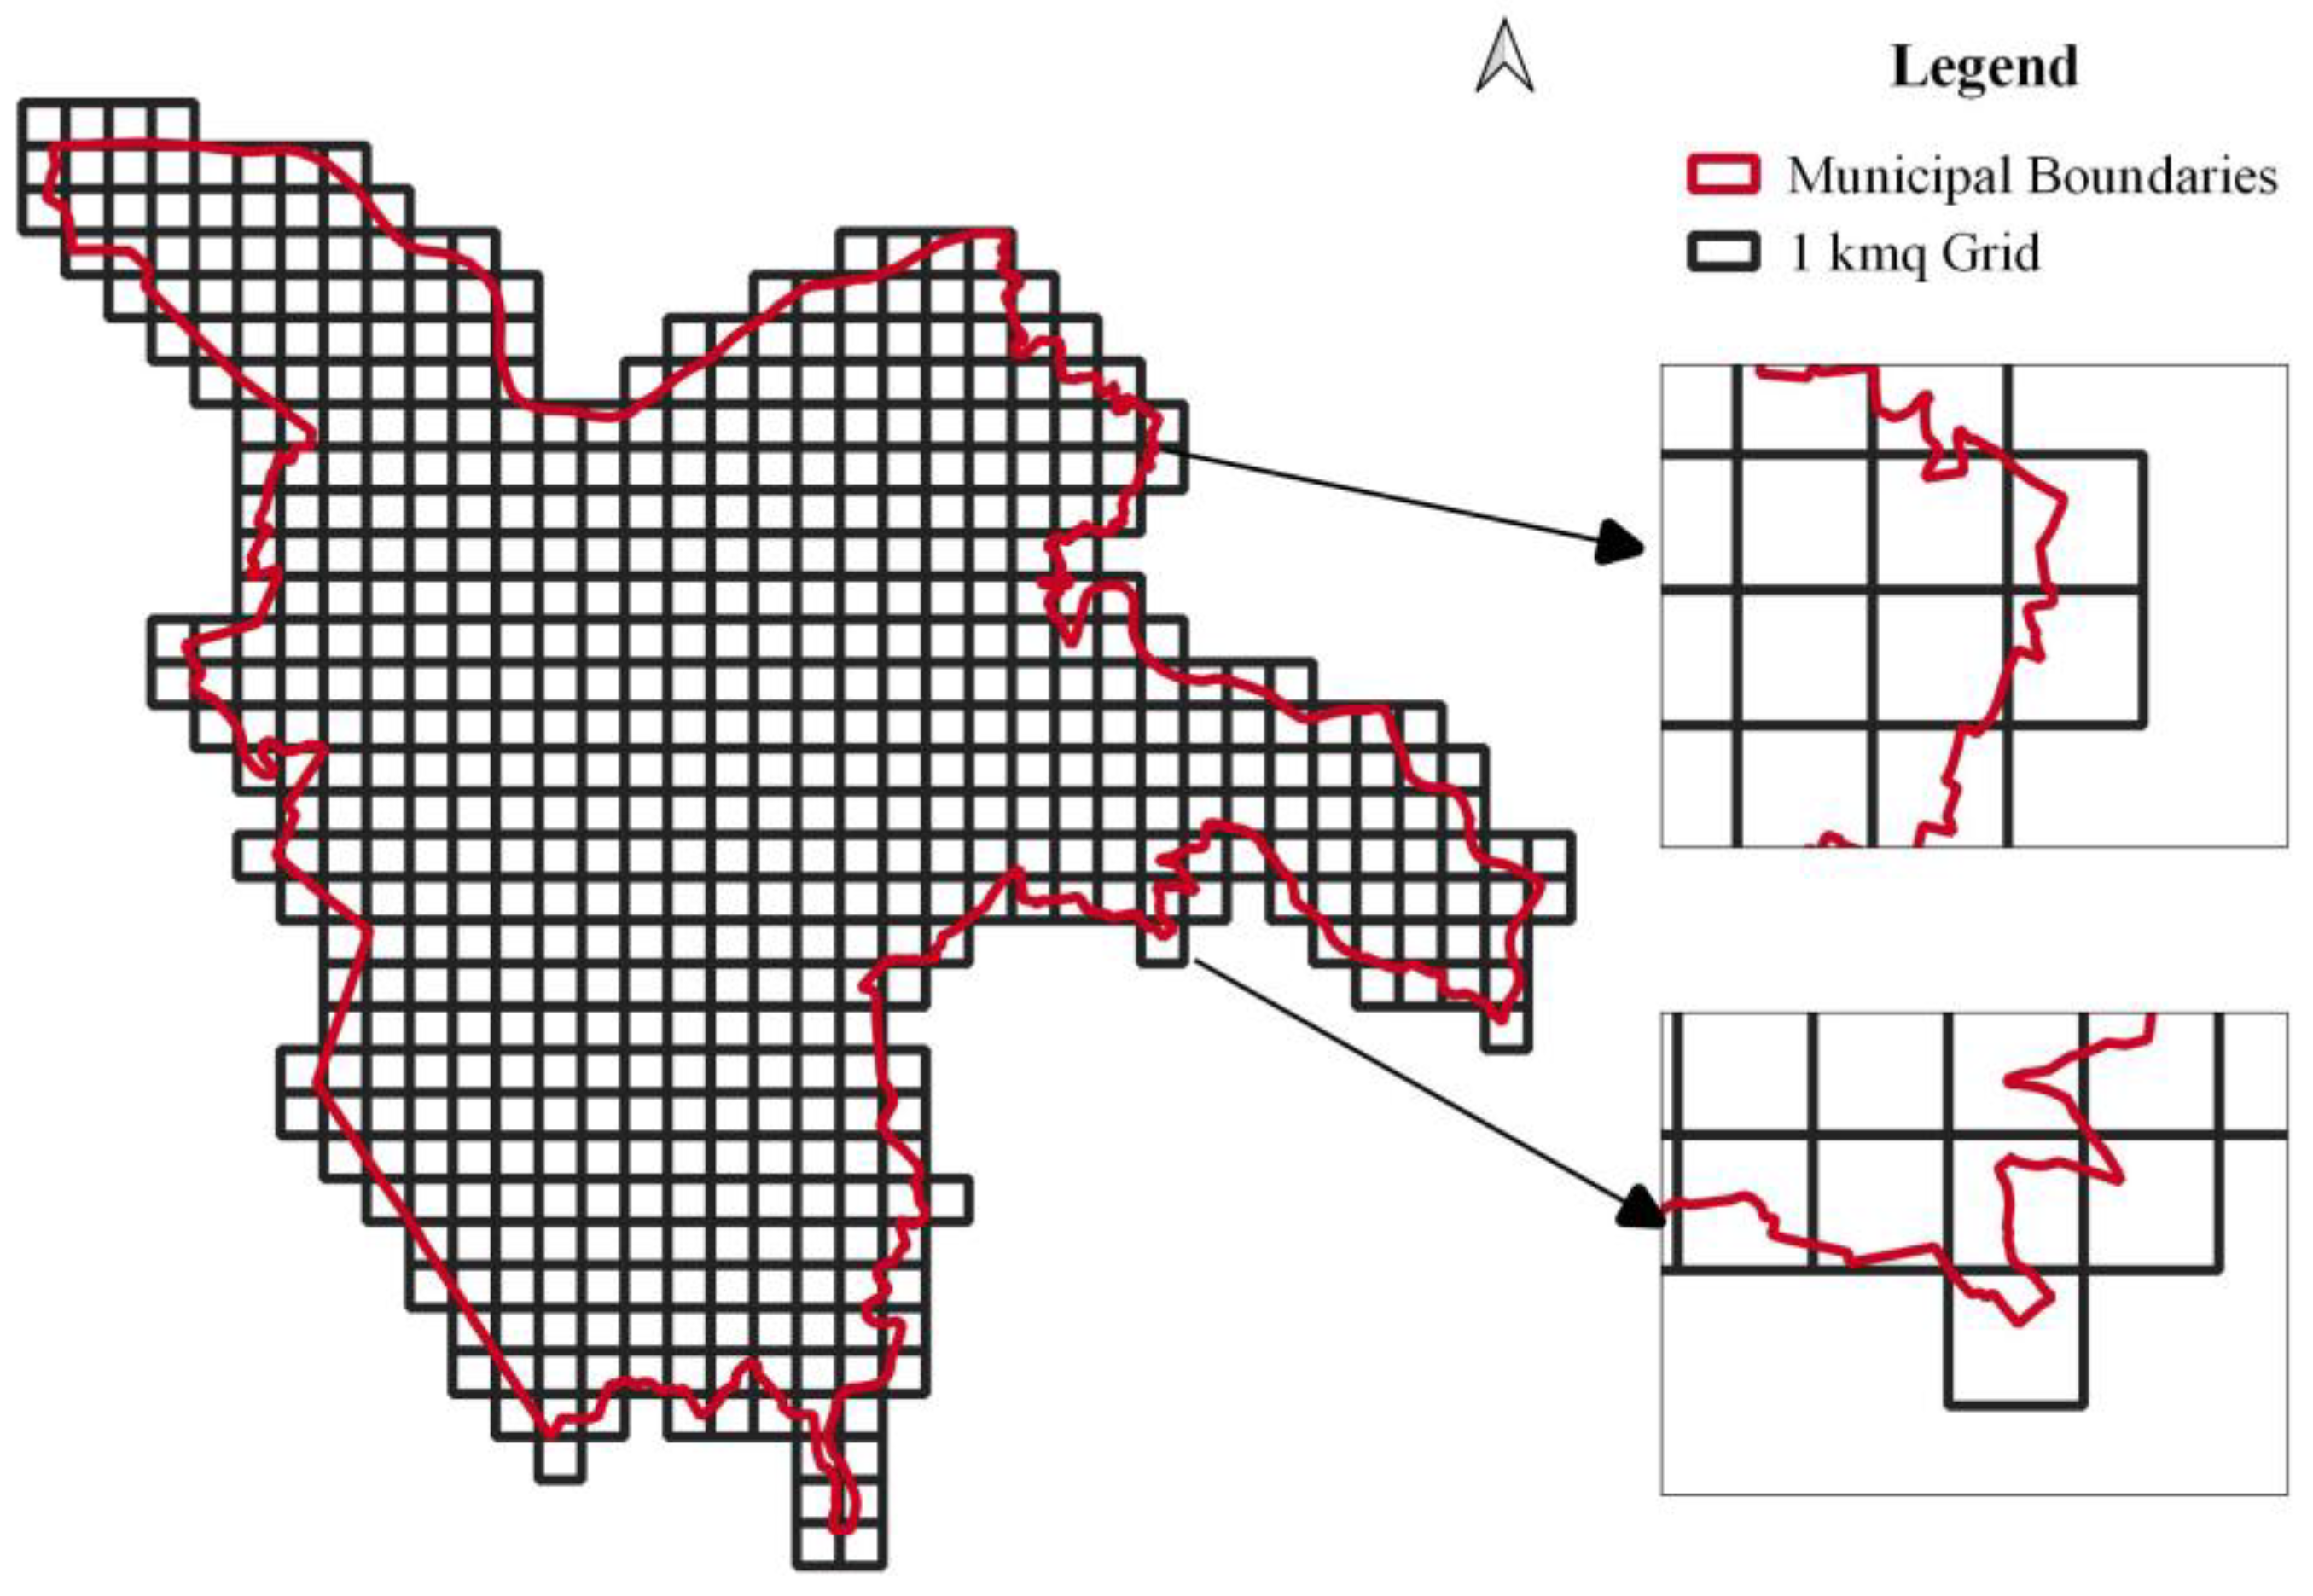
2. Study Area
3. Materials and Methods
3.1. Data on Land Consumption
3.2. Data on Land Temperature
3.3. Comparison between MODIS Data and Land Consumption
3.4. Data on Municipality’s Urban Planning
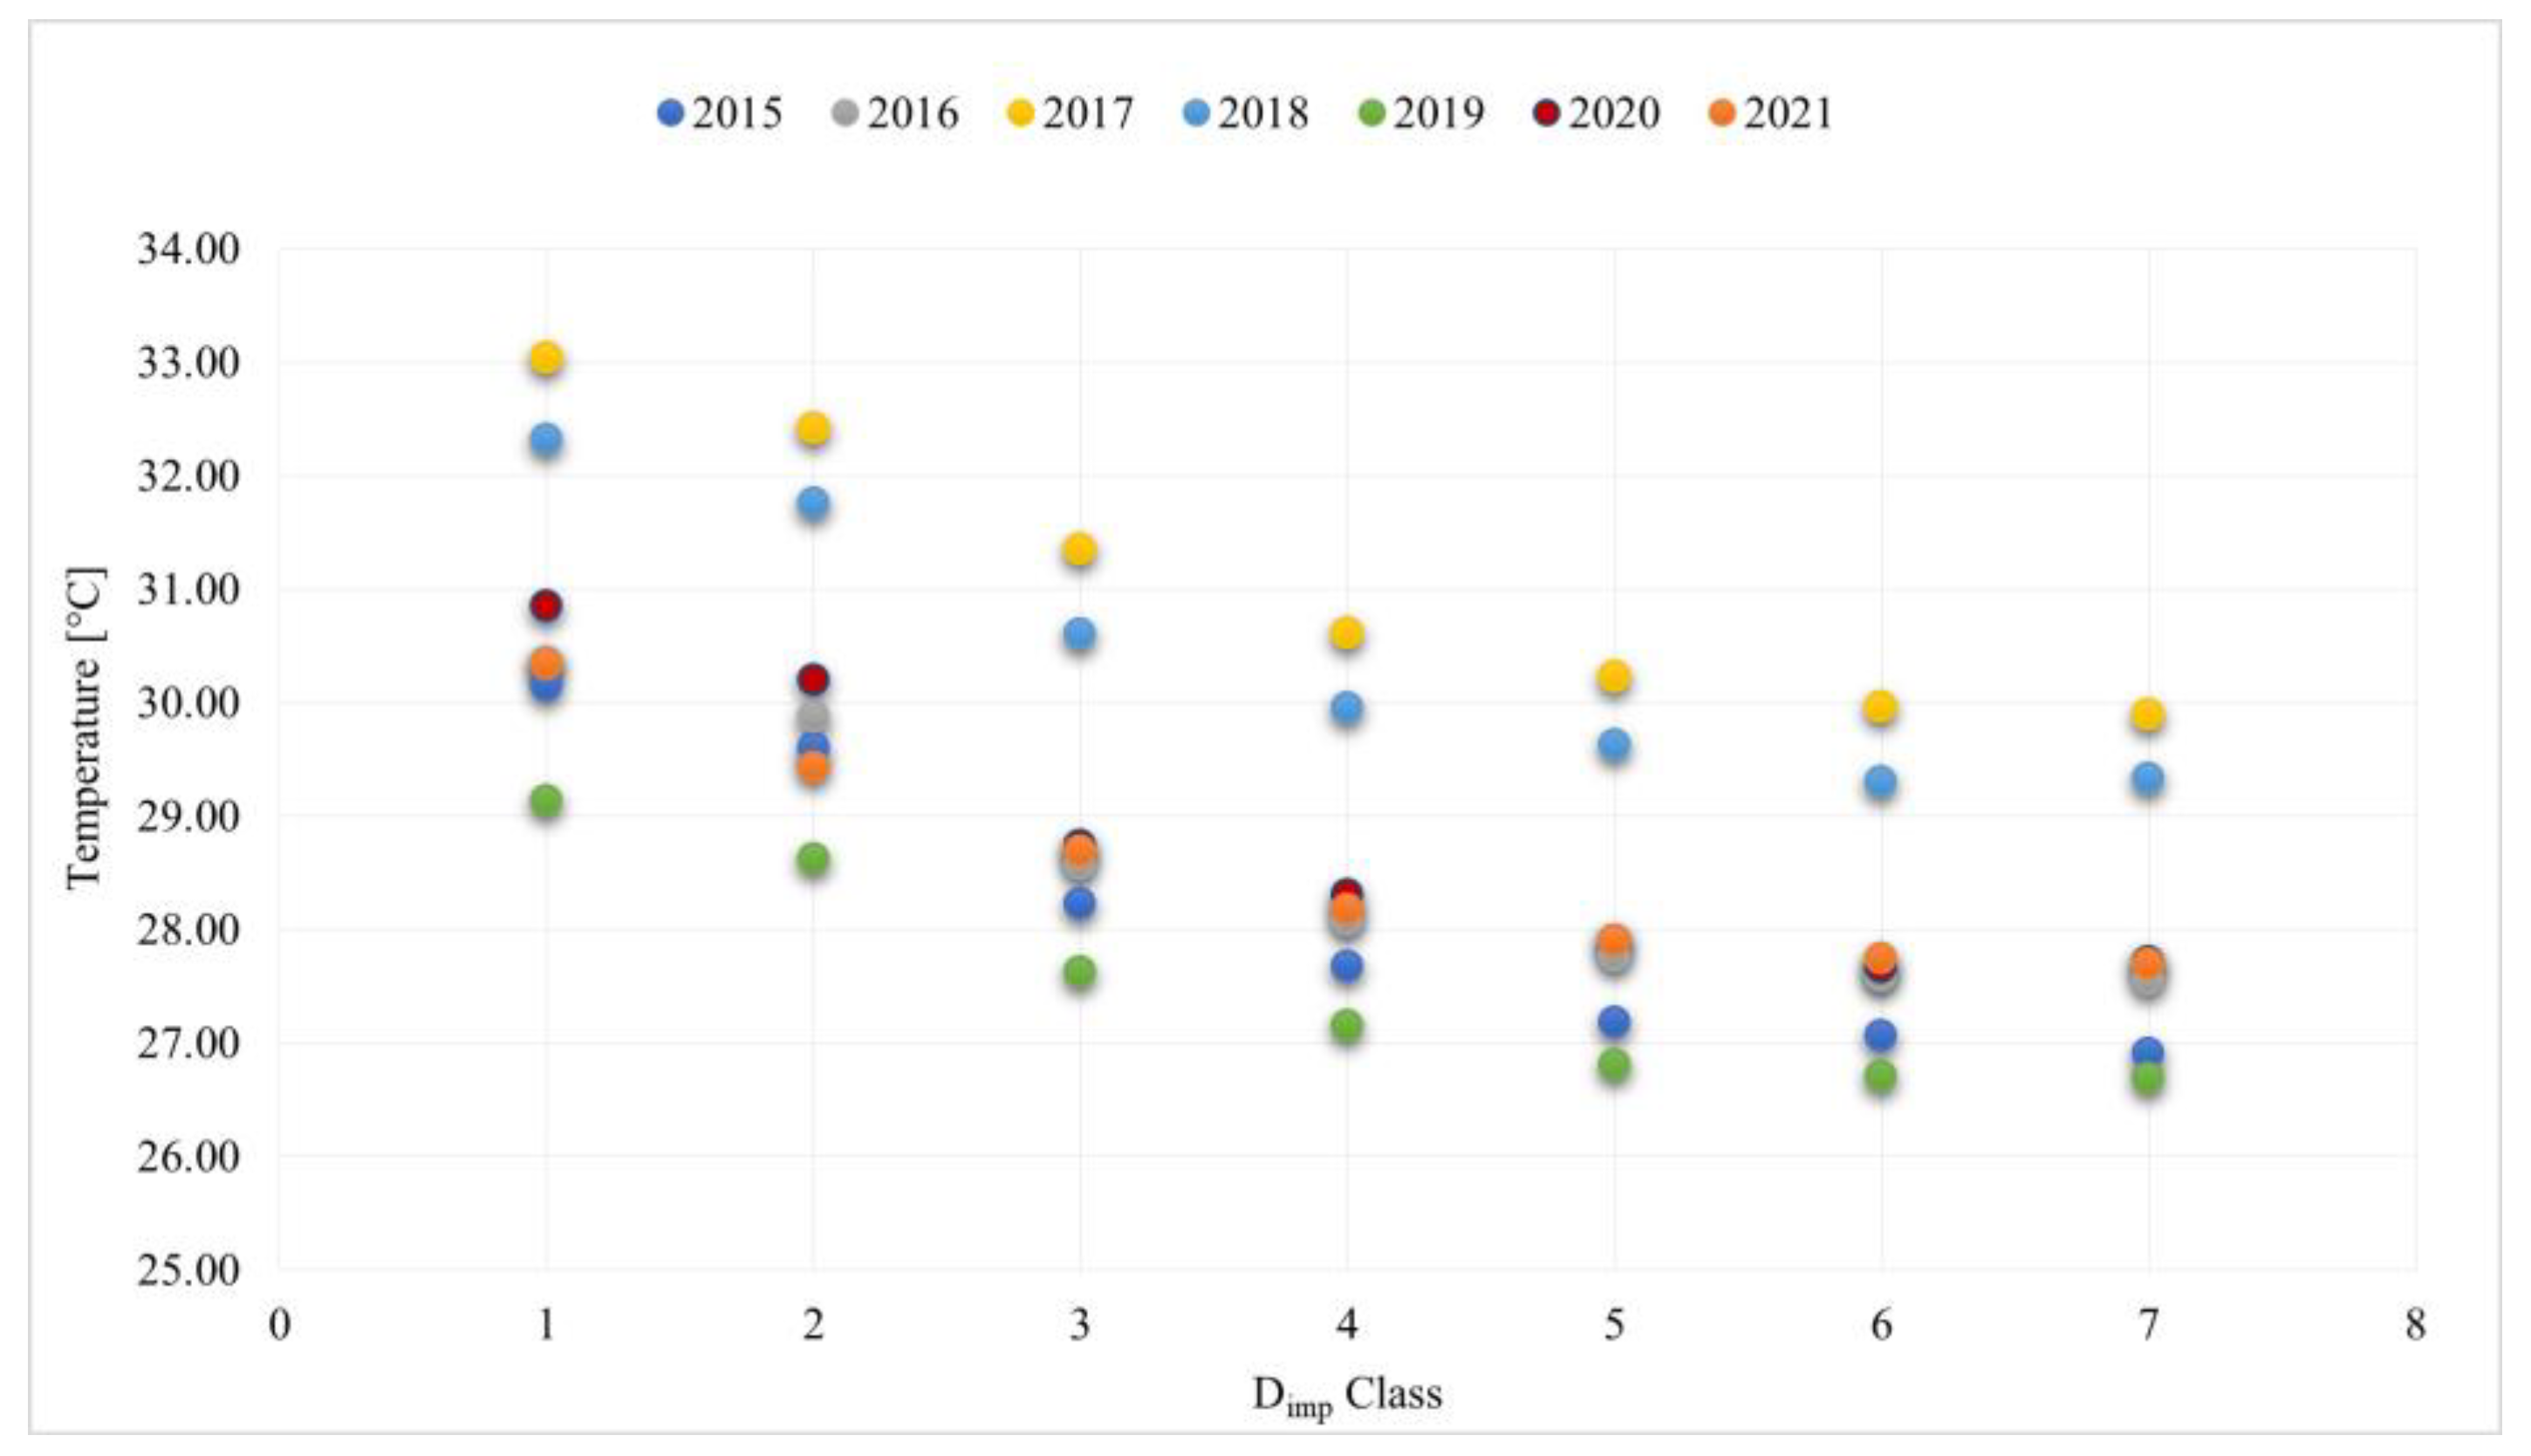
3.5. Sealing Density Index
- Class 1: Dimp ≥ 70%;
- Class 2: 50% ≤ Dimp < 70%;
- Class 3: 35% ≤ Dimp < 50%;
- Class 4: 20% ≤ Dimp < 35%;
- Class 5: 10% ≤ Dimp < 20%;
- Class 6: 5% ≤ Dimp < 10%;
- Class 7: Dimp < 5%.
4. Results
5. Discussion
6. Conclusions
Author Contributions
Funding
Institutional Review Board Statement
Informed Consent Statement
Data Availability Statement
Conflicts of Interest
References
- Gaglione, F. Città e climate change. In La vulnerabilità delle Aree Urbane Alle Isole di Calore, 1st ed.; FedOAPress: Napoli, Italy, 2022; pp. 16–22. [Google Scholar] [CrossRef]
- Profiroiu, C.M.; Bodislav, D.A.; Burlacu, S.; Rădulescu, C.V. Challenges of Sustainable Urban Development in the Context of Population Growth. Eur. J. Sust. Dev. 2020, 9, 51–57. [Google Scholar] [CrossRef]
- Ramaiah, M.; Avtar, R. Urban Green Spaces and Their Need in Cities of Rapidly Urbanizing India: A Review. Urban Sci. 2019, 3, 94. [Google Scholar] [CrossRef]
- Mahtta, R.; Fragkias, M.; Güneralp, B.; Mahendra, A.; Reba, M.; Wentz, E.A.; Seto, K.C. Urban land expansion: The role of population and economic growth for 300+ cities. NPJ Urban Sustain 2022, 2, 5. [Google Scholar] [CrossRef]
- Zhong, C.; Guo, H.; Swan, I.; Gao, P.; Yao, Q.; Li, H. Evaluating trends, profits, and risks of global cities in recent urban expansion for advancing sustainable development. Habitat Int. 2023, 138, 102869. [Google Scholar] [CrossRef]
- Gao, J.; O’Neill, B.C. Mapping global urban land for the 21st century with data-driven simulations and Shared Socioeconomic Pathways. Nat. Commun. 2020, 11, 2302. [Google Scholar] [CrossRef]
- Pörtner, H.O.; Roberts, D.C.; Tignor, M.; Poloczanska, E.S.; Mintenbeck, K.; Alegría, A.; Craig, M.; Langsdorf, S.; Löschke, S.; Möller, V.; et al. Climate Change 2022: Impacts, Adaptation and Vulnerability, 6th ed.; Cambridge University Press: Cambridge, UK; New York, NY, USA, 2022; pp. 13–15. [Google Scholar] [CrossRef]
- Pappalardo, S.E.; Zanetti, C.; Tedeschi, V. Mapping urban heat islands and heat-related risk during heat waves from a climate justice perspective: A case study in the municipality of Padua (Italy) for inclusive adaptation policies. Landsc. Urban Plan. 2023, 238, 104831. [Google Scholar] [CrossRef]
- Kornhuber, K.; Lesk, C.; Schleussner, C.F.; Jägermeyr, J.; Pfleiderer, P.; Horton, R.M. Risks of synchronized low yields are underestimated in climate and crop model projections. Nat. Commun. 2023, 14, 3528. [Google Scholar] [CrossRef]
- Niggli, L.; Huggel, C.; Muccione, V.; Neukom, R.; Salzmann, N. Towards improved understanding of cascading and interconnected risks from concurrent weather extremes: Analysis of historical heat and drought extreme events. PLoS Clim. 2022, 1, e0000057. [Google Scholar] [CrossRef]
- Laino, E.; Iglesias, G. Extreme climate change hazards and impacts on European coastal cities: A review Renew. Sustain. Energy Rev. 2023, 184, 113587. [Google Scholar] [CrossRef]
- Wang, X.; Jiang, D.; Lang, X. Future extreme climate changes linked to global warming intensity. Sci. Bull. 2017, 62, 1673–1680. [Google Scholar] [CrossRef]
- Bastos, A.; Ciais, P.; Friedlingstein, P.; Sitch, S.; Pongratz, J.; Fan, L.; Wigneron, J.P.; Weber, U.; Reichstein, M.; Fu, Z.; et al. Direct and seasonal legacy effects of the 2018 heat wave and drought on European ecosystem productivity. Sci. Adv. 2020, 6, eaba2724. [Google Scholar] [CrossRef]
- Macintyre, H.L.; Heaviside, C.; Taylor, J.; Picetti, R.; Symonds, P.; Cai, X.-M.; Vardoulakis, S. Assessing urban population vulnerability and environmental risks across an urban area during heatwaves—Implications for health protection. Sci. Total. Environ. 2018, 610–611, 678–690. [Google Scholar] [CrossRef]
- Oke, T.R. City size and the urban heat island. Atmos. Environ. 1973, 7, 769–779. [Google Scholar] [CrossRef]
- Arnfield, A.J. Two decades of urban climate research: A review of turbulence, exchanges of energy and water, and the urban heat island. Int. J. Climatol. 2003, 23, 1–26. [Google Scholar] [CrossRef]
- The World Bank. Available online: https://data.worldbank.org/indicator/SP.URB.TOTL.IN.ZS (accessed on 25 October 2023).
- Morabito, M.; Crisci, A.; Guerri, G.; Messeri, A.; Congedo, L.; Munafò, M. Surface urban heat islands in Italian metropolitan cities: Tree cover and impervious surface influences. Sci. Total. Environ. 2021, 751, 19. [Google Scholar] [CrossRef]
- Susca, T.; Pomponi, F. Heat Island effects in urban life cycle assessment: Novel insights to include the effects of the urban heat island and UHI-mitigation measures in LCA for effective policy making. J. Ind. Ecol. 2020, 24, 410–423. [Google Scholar] [CrossRef]
- Calzolari, C.; Tarocco, P.; Lombardo, N.; Marchi, N.; Ungaro, F. Assessing soil ecosystem services in urban and peri-urban areas: From urban soils survey to providing support tool for urban planning. Land Use Policy 2020, 99, 105037. [Google Scholar] [CrossRef]
- Ferreira, C.S.S.; Seifollahi-Aghmiuni, S.; Destouni, G.; Ghajarnia, N.; Kalantari, Z. Soil degradation in the European Mediterranean region: Processes, status and consequences. Sci. Total Environ. 2022, 805, 150106. [Google Scholar] [CrossRef]
- European Environment Agency (EEA). Available online: https://www.eea.europa.eu/data-and-maps/daviz/percentage-sealing-by-country-1#tab-chart_5 (accessed on 19 October 2023).
- Manselli, L.; Molinari, D.; Pogliani, A.; Zambrini, F.; Menduni, G. Improvements and Operational Application of a Zero-Order Quick Assessment Model for Flood Damage: A Case Study in Italy. Water 2022, 14, 373. [Google Scholar] [CrossRef]
- Pulvirenti, L.; Squicciarino, G.; Fiori, E.; Candela, L.; Puca, S. Analysis and Processing of the COSMO-SkyMed Second Generation Images of the 2022 Marche (Central Italy) Flood. Water 2023, 15, 1353. [Google Scholar] [CrossRef]
- Donnini, M.; Santangelo, M.; Gariano, S.L.; Bucci, F.; Peruccacci, S.; Alvioli, M.; Althuwaynee, O.; Ardizzone, F.; Bianchi, C.; Bornaetxea, T.; et al. Landslides triggered by an extraordinary rainfall event in Central Italy on September 15, 2022. Landslides 2023, 20, 2199–2211. [Google Scholar] [CrossRef]
- Munafò, M. Consumo di Suolo, Dinamiche Territoriali e Servizi Ecosistemici; ISPRA: Rome, Italy, 2023. [Google Scholar]
- Istat. Statistiche Demografiche. Available online: https://www.istat.it/ (accessed on 29 September 2023).
- ISPRA. Available online: https://www.isprambiente.gov.it/it/banche-dati/banche-dati-folder/suolo-e-territorio/uso-del-suolo (accessed on 26 September 2023).
- Legambiente. Available online: https://cittaclima.it/ (accessed on 26 September 2023).
- Ministero dell’Economia e delle Finanze. Available online: https://www.mef.gov.it/index.html (accessed on 16 October 2023).
- NASA. Earth Data. Available online: https://lpdaac.usgs.gov/products/mod11a1v061/ (accessed on 27 September 2023).
- Maimaitiyiming, M.; Ghulam, A.; Tiyip, T.; Pla, F.; Latorre-Carmona, P.; Halik, Ü.; Sawut, M.; Caetano, M. Effects of green space spatial pattern on land surface temperature: Implications for sustainable urban planning and climate change adaptation. ISPRS J. Photogramm. Remote Sens. 2014, 89, 59–66. [Google Scholar] [CrossRef]
- Halder, B.; Bandyopadhyay, J.; Banik, P. Evaluation of the Climate Change Impact on Urban Heat Island Based on Land Surface Temperature and Geospatial Indicators. Int. J. Environ. Res. 2021, 15, 819–835. [Google Scholar] [CrossRef]
- 3BMeteo. Available online: https://www.3bmeteo.com/servizi/storico (accessed on 2 October 2023).
- Romano, B.; Zullo, F.; Fiorini, L.; Ciabò, S.; Marucci, A. Sprinkling: An Approach to Describe Urbanization Dynamics in Italy. Sustainability 2017, 9, 97. [Google Scholar] [CrossRef]
- Kirchner, A.; Schmitt, M.; Pollinger, F.; Thiel, M.; Paeth, H. Relationship between soil sealing and local to regional climate change in Germany. Meteorol. Z. 2021, 30, 381–390. [Google Scholar] [CrossRef]
- Perini, L.; Colantoni, A.; Renzi, G.; Salvati, L. Urban sprawl, soil sealing and impacts on local climate. In Urban Expansion, Land Cover and Soil Ecosystem Services, 1st ed.; Routledge: London, UK, 2017; p. 193. [Google Scholar] [CrossRef]
- Wiesner, S.; Eschenbach, A.; Ament, F. Urban air temperature anomalies and their relation to soil moisture observed in the city of Hamburg. Meteorol. Z. 2014, 23, 143–157. [Google Scholar] [CrossRef]
- Wang, C.; Li, Y.; Myint, S.W.; Zhao, Q.; Wentz, E.A. Impacts of spatial clustering of urban land cover on land surface temperature across Köppen climate zones in the contiguous United States. Land Urban Plan. 2019, 192, 103668. [Google Scholar] [CrossRef]
- Algretawee, H.; Rayburg, S.; Neave, M. Estimating the effect of park proximity to the central of Melbourne city on Urban Heat Island (UHI) relative to Land Surface Temperature (LST). Ecol. Eng. 2019, 138, 374–390. [Google Scholar] [CrossRef]
- Li, T.; Cao, J.; Xu, M.; Wu, Q.; Yao, L. The influence of urban spatial pattern on land surface temperature for different functional zones. Landsc. Ecol. Eng. 2020, 16, 249–262. [Google Scholar] [CrossRef]
- Zullo, F.; Fazio, G.; Romano, B.; Marucci, A.; Fiorini, L. Effects of urban growth spatial pattern (UGSP) on the land surface temperature (LST): A study in the Po Valley (Italy). Sci. Total. Environ. 2019, 650, 1740–1751. [Google Scholar] [CrossRef]


| Code | Description |
|---|---|
| 1 | Consumed soil |
| 11 | Permanent Consumed Soil |
| 111 | Buildings, Warehouses |
| 112 | Paved roads |
| 113 | Railway headquarters |
| 114 | Airports |
| 115 | Harbours |
| 116 | Other sealed areas |
| 117 | Paved permanent greenhouses |
| 118 | Landfills |
| 122 | Yards |
| 125 | Ground-mounted photovoltaic fields |
| Code | Description |
|---|---|
| 2 | Forest Use |
| 3 | Quarries and mines |
| 4 | Urban and related areas |
| 5 | Water Uses |
| 11 | Arable crops |
| 12 | Fodder |
| 13 | Prevailing crops |
| 14 | Agroforestry Areas |
| 16 | Other Agricultural Uses |
| 61 | Wetlands |
| 62 | Other non-economic uses |
| 2015 | 2016 | 2017 | 2018 | 2019 | 2020 | 2021 | ||
|---|---|---|---|---|---|---|---|---|
| 1 | Dimp > 70 | 30.14 | 30.35 | 33.03 | 32.32 | 29.13 | 30.85 | 30.33 |
| 2 | 50 < Dimp < 70 | 29.60 | 29.87 | 32.41 | 31.76 | 28.62 | 30.19 | 29.43 |
| 3 | 35 < Dimp < 50 | 28.22 | 28.57 | 31.35 | 30.60 | 27.63 | 28.74 | 28.69 |
| 4 | 20 < Dimp < 35 | 27.67 | 28.08 | 30.61 | 29.95 | 27.15 | 28.30 | 28.17 |
| 5 | 10 < Dimp < 20 | 27.18 | 27.76 | 30.23 | 29.62 | 26.80 | 27.90 | 27.90 |
| 6 | 5 < Dimp < 10 | 27.06 | 27.59 | 29.96 | 29.29 | 26.70 | 27.66 | 27.75 |
| 7 | Dimp < 5 | 26.91 | 27.55 | 29.89 | 29.33 | 26.69 | 27.71 | 27.69 |
| Year | R2 |
|---|---|
| 2015 | 0.8975 |
| 2016 | 0.8746 |
| 2017 | 0.9198 |
| 2018 | 0.9038 |
| 2019 | 0.8799 |
| 2020 | 0.8667 |
| 2021 | 0.8808 |
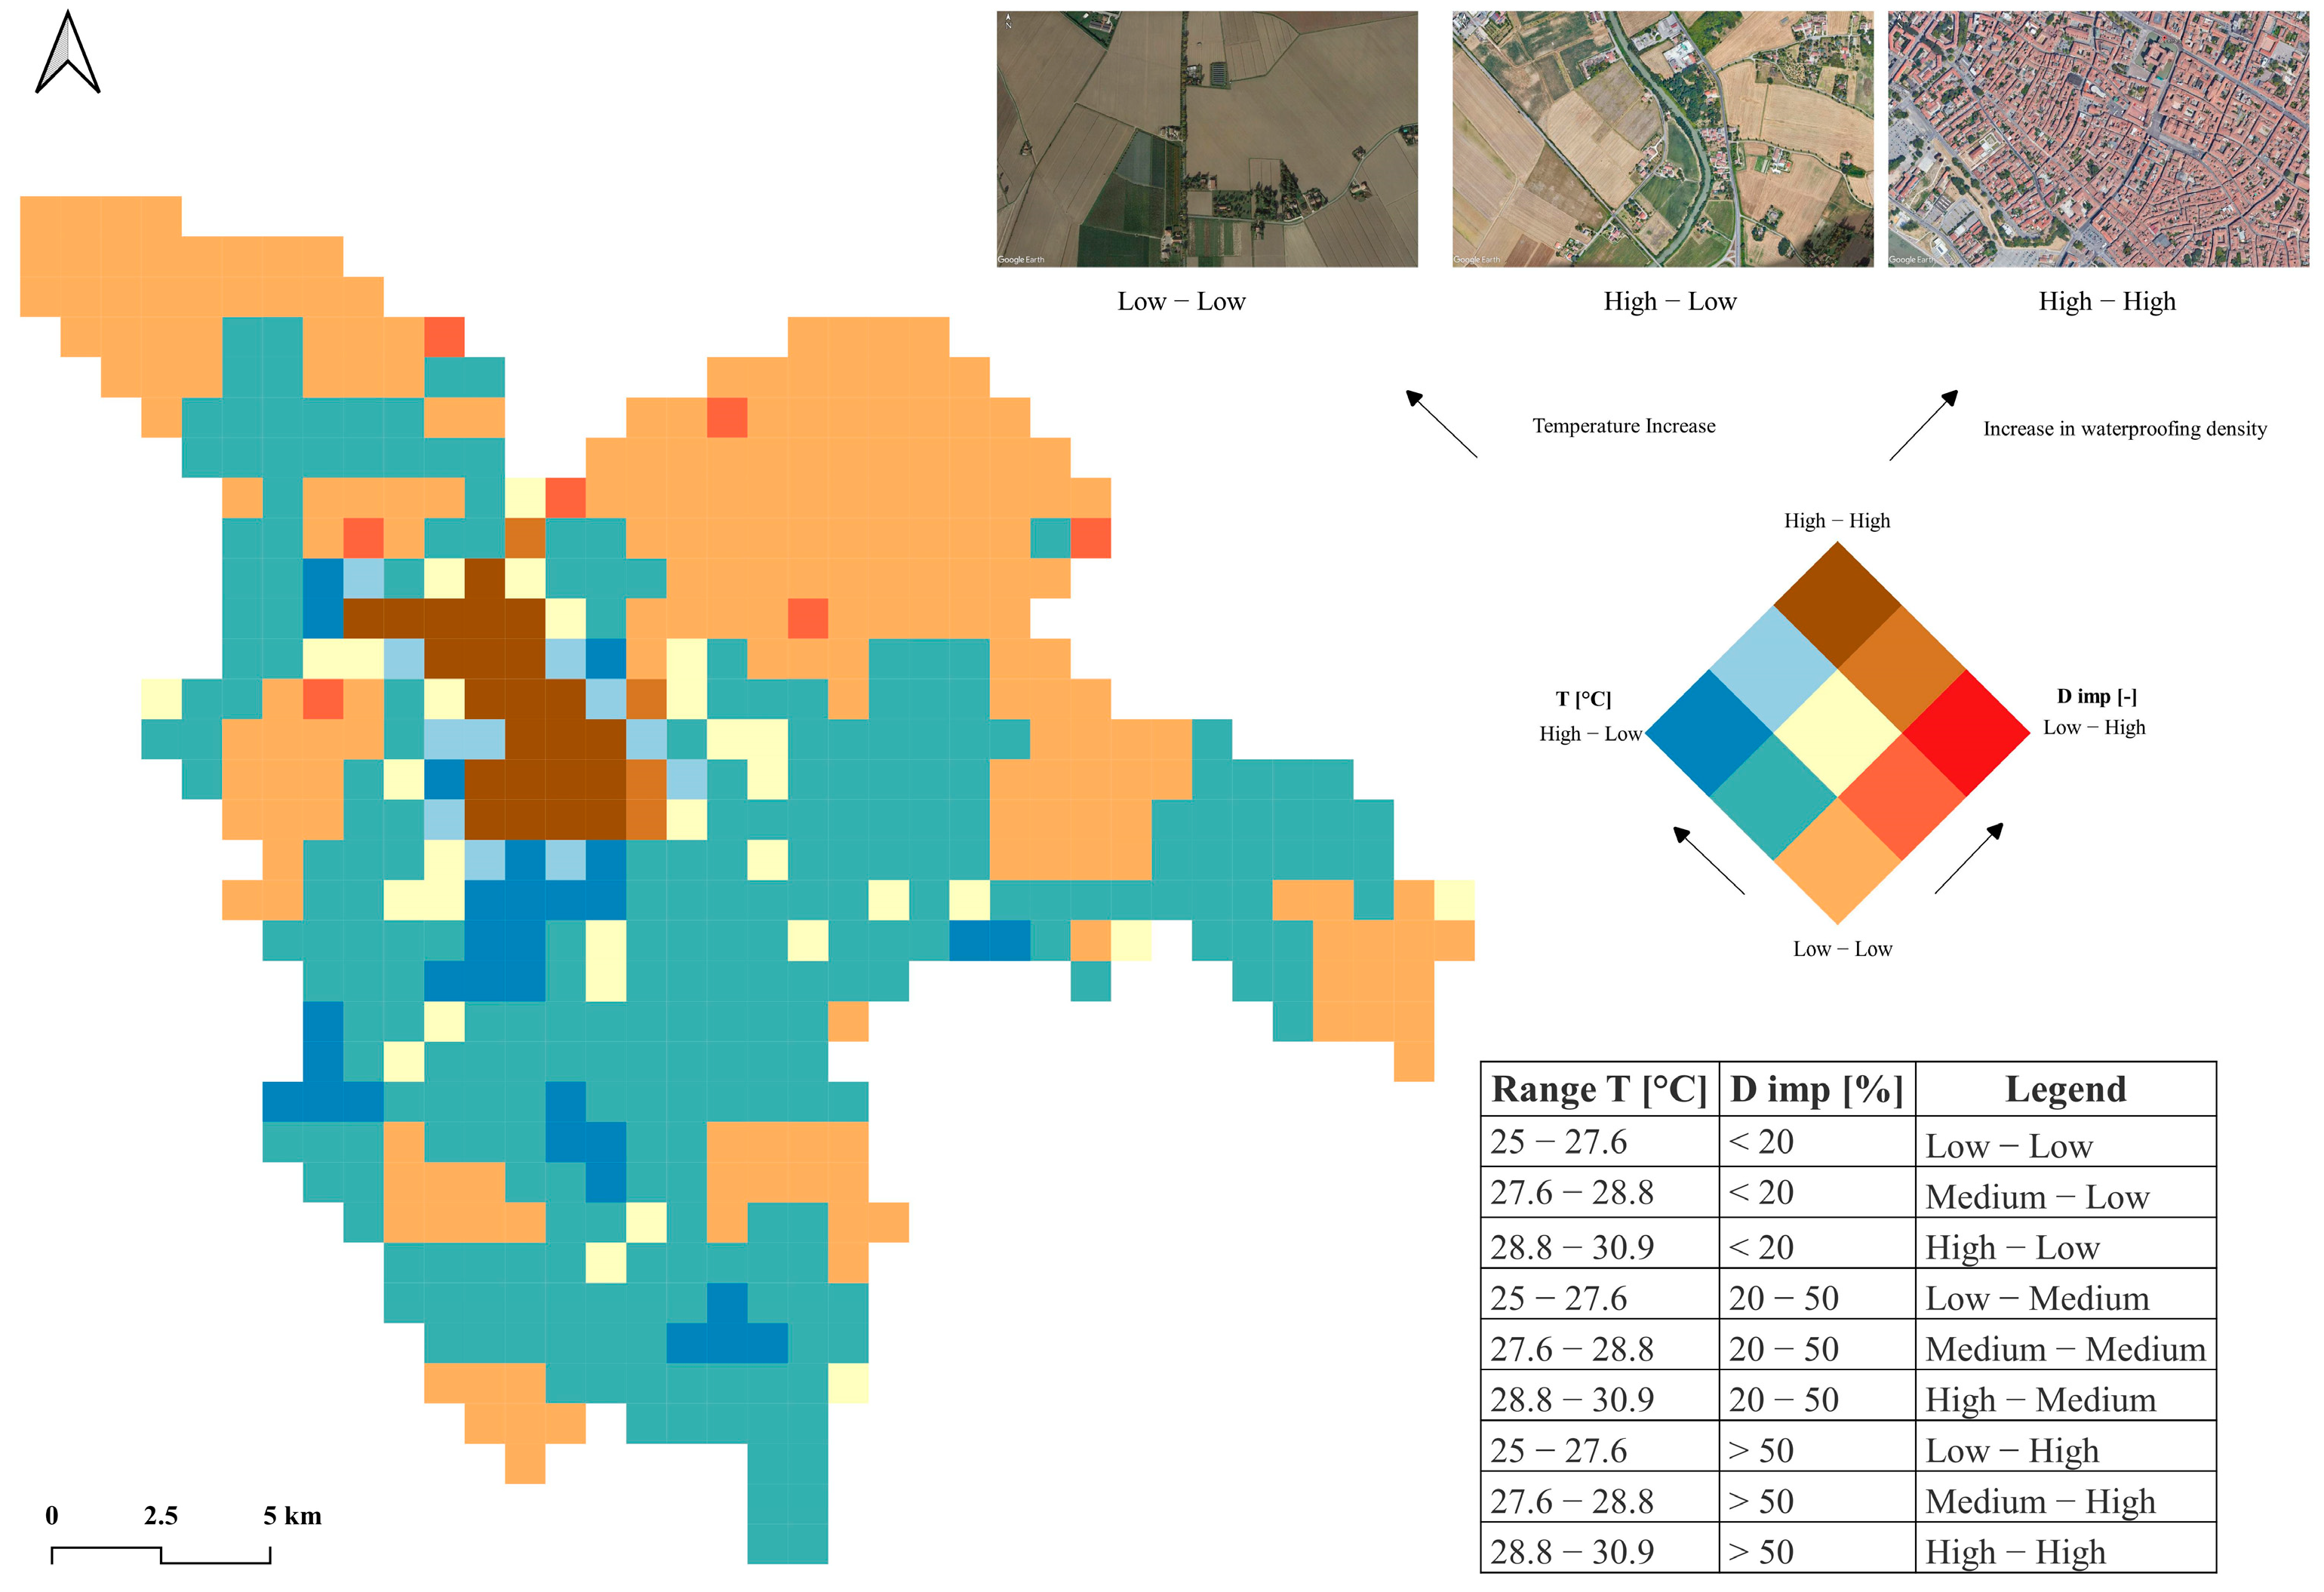
| T Range [°C] | Dimp Range [%] |
|---|---|
| 25.0–27.6 | <20 |
| 27.6–28.8 | 20–50 |
| 28.8–30.9 | >50 |
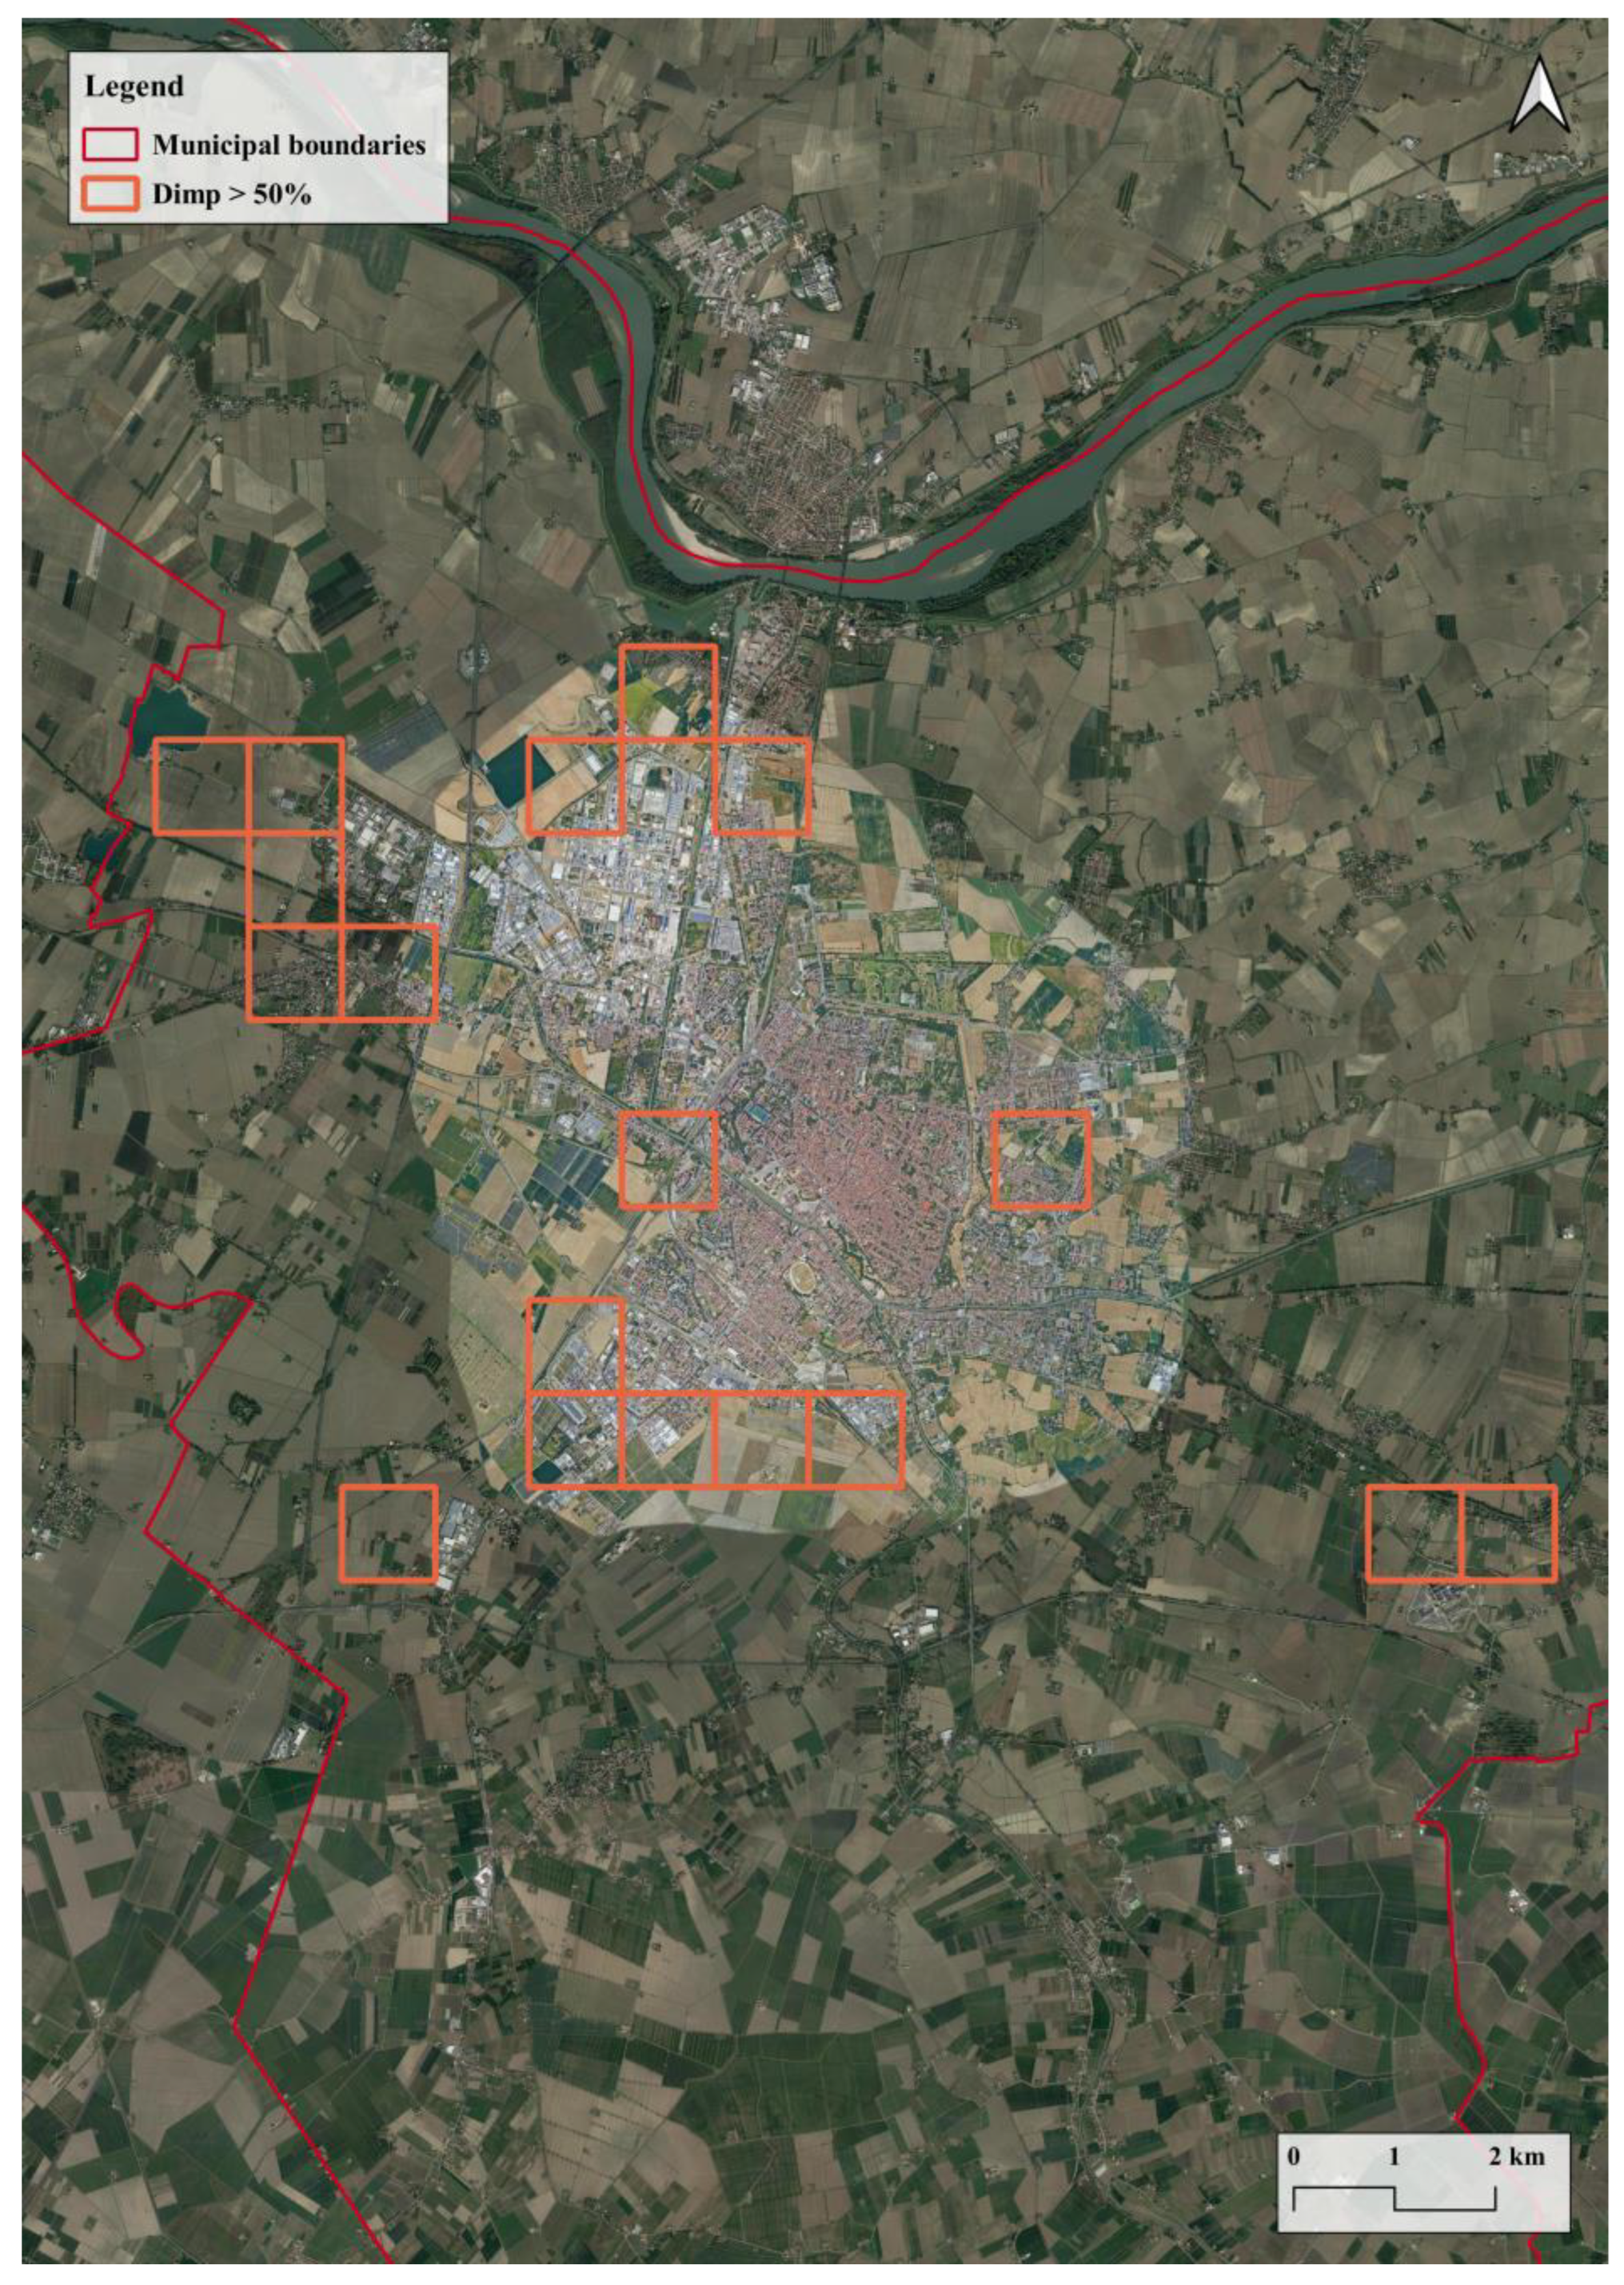
| N° Cells—2021 | N° Cells—P.S.C. | |
|---|---|---|
| Dimp > 70 | 14 | 32 |
| 50 < Dimp < 70 | 13 | 13 |
| 35 < Dimp < 50 | 18 | 20 |
| 20 < Dimp < 35 | 31 | 43 |
| 10 < Dimp < 20 | 90 | 82 |
| 5 < Dimp < 10 | 148 | 127 |
| Dimp < 5 | 252 | 249 |
Disclaimer/Publisher’s Note: The statements, opinions and data contained in all publications are solely those of the individual author(s) and contributor(s) and not of MDPI and/or the editor(s). MDPI and/or the editor(s) disclaim responsibility for any injury to people or property resulting from any ideas, methods, instructions or products referred to in the content. |
© 2023 by the authors. Licensee MDPI, Basel, Switzerland. This article is an open access article distributed under the terms and conditions of the Creative Commons Attribution (CC BY) license (https://creativecommons.org/licenses/by/4.0/).
Share and Cite
Di Pietro, G.; Marziali, E.; Montaldi, C.; Zullo, F. Land Surface Temperature and Urban Policies: The Ferrara City Case Study. Sustainability 2023, 15, 16825. https://doi.org/10.3390/su152416825
Di Pietro G, Marziali E, Montaldi C, Zullo F. Land Surface Temperature and Urban Policies: The Ferrara City Case Study. Sustainability. 2023; 15(24):16825. https://doi.org/10.3390/su152416825
Chicago/Turabian StyleDi Pietro, Gianni, Emilio Marziali, Cristina Montaldi, and Francesco Zullo. 2023. "Land Surface Temperature and Urban Policies: The Ferrara City Case Study" Sustainability 15, no. 24: 16825. https://doi.org/10.3390/su152416825
APA StyleDi Pietro, G., Marziali, E., Montaldi, C., & Zullo, F. (2023). Land Surface Temperature and Urban Policies: The Ferrara City Case Study. Sustainability, 15(24), 16825. https://doi.org/10.3390/su152416825