Article

Ag-Containing Carbon Nanocomposites: Physico-Chemical Properties and Antimicrobial Activity

by
Mariia Galaburda
1,2,*,
Malgorzata Zienkiewicz-Strzalka
1,
Magdalena Blachnio
1,*,
Viktor Bogatyrov
2,
Jolanta Kutkowska
3,
Adam Choma
3 and
Anna Derylo-Marczewska
1
1
Department of Physical Chemistry, Institute of Chemical Sciences, Maria Curie-Sklodowska University, 3, Sq. Maria Curie-Sklodowska, 20-031 Lublin, Poland
2
Chuiko Institute of Surface Chemistry, 17 General Naumov Str., 03164 Kyiv, Ukraine
3
Department of Genetics and Microbiology, Maria Curie-Sklodowska University, 19 Akademicka Str., 20-033 Lublin, Poland
*
Authors to whom correspondence should be addressed.
Sustainability 2023, 15(24), 16817; https://doi.org/10.3390/su152416817
Submission received: 13 October 2023 / Revised: 24 November 2023 / Accepted: 11 December 2023 / Published: 13 December 2023
(This article belongs to the Section Sustainable Chemical Engineering and Technology)

Abstract

:
The subject of the present work is the synthesis and analysis of the structural and morphological properties of Ag-containing carbon composites and the investigation of their practical application in water purification and disinfection. A series of composites were synthesized by carbonization of resorcinol–formaldehyde polymers filled with Ag-containing fumed silica under an inert atmosphere at 800 °C. The as-synthesized micro- and mesoporous carbon composites were characterized by their specific surface area of 466–529 m2/g. The suitability of the composites for flow-through filters was evaluated by kinetic studies on the adsorption of 4-chlorophenol. The composite with the highest amount of metallic nanophase showed the most effective kinetics with a rate constant (log k) and half-life (t0.5) of −2.07 and 81 min, respectively. The antimicrobial susceptibility was determined against Gram-positive (Staphylococcus aureus ATCC 25923) and Gram-negative strains (Escherichia coli ATCC 25922, Klebsiella pneumoniae ATCC 700603, Pseudomonas aeruginosa ATCC 27853, and Acinetobacter baumannii ATCC 19606). The zones of bacterial growth inhibition correlated with the silver nanoparticle content and were the lowest for RFC-02 (10–12 mm) and the highest for the RFC-1 composite (15–16 mm), resulting from the increase in number of evenly distributed small Ag nanoparticles (3–5 nm) in the samples.

1. Introduction

Concern about the state of the environment has increased greatly, mainly because of the negative impact of factors such as irrational use of natural resources, human activities, population growth, rapid industrialization, etc., [1]. Water pollution has become one of the major environmental problems in both developed and developing countries. Nowadays, much attention is being paid to the development and potential benefits of nanomaterials in water treatment [2]. Traditional wastewater treatment uses physical, chemical and biological methods (or a combination of these) to remove solids, organic matter and nutrients from wastewater [3,4,5,6]. However, adsorption is the most commonly used method to remove non-degradable organic compounds from groundwater, to treat drinking water, technical water or as a purification step after biological water treatment [1].
Porous activated carbon materials are very attractive for adsorption applications due to their controllable pore architecture, large surface area, large pore volume and specific physical and chemical properties [7]. They have demonstrated effectiveness in removing a wide range of inorganic and organic pollutants (such as metals, dyes, pesticides and other industrial chemicals) dissolved in aqueous media or in gaseous environments [8,9,10,11]. Despite their already pronounced advantages, much scientific and industrial work has been dedicated to improving and expanding the potential of carbon materials for specific applications [8,9,12].
Currently, many methods for the production of carbon-based nanomaterials for agricultural and environmental applications are known [13,14]. However, pyrolysis is widely recognized as a simple, efficient, feasible, sustainable and cost-effective approach for the valorization of compounds of natural or synthetic origin [15]. It is worth mentioning that carbon materials produced using commercial resins as precursors are characterized by high purity, large surface area and pronounced porosity, as well as good mechanical strength and compressibility, so that they can be processed by certain methods to improve the durability and cost-effectiveness of the materials and facilitate further industrial production [16]. Pyrolysis at high temperature and low heating rate has the potential to reduce the release of hazardous formaldehyde and greenhouse gases into the environment by converting waste into high value-added chemical additives, diverting the release of these toxic substances into the environment [17]. In addition, thermal conversion of modified resins/polymers into microporous and mesoporous materials enables the achievement of the desired structural and adsorptive properties of the final adsorbents [18]. The production of new hybrid materials from modified synthetic polymers does not require complex technological equipment, which improves their use in conventional sorption filters and advanced environmental protection technologies.
Recently, the modification of hybrid carbon composites or membranes with various bio polymers or low-molecular polymers has been intensively investigated in order to provide specific bactericidal properties to the materials and to expand the spectrum of their application [19,20,21,22]. A variety of nanomaterials have been developed for use in stopping or slowing the growth of bacteria and fungi in medicine, biotechnology, water treatment and other fields. Metallic nanoparticles such as silver, copper and zinc, which have antibacterial and antifungal properties, have been most commonly used for this purpose [23,24]. In particular, these nanoparticles are attracting much attention due to the constant increase in number of microbial infections and diseases [25,26,27]. However, due to the emergence of antibiotic resistance in recent years, researchers and scientists are considering exploring the therapeutic potential of silver and its systems as effective antimicrobial agents [26]. One of the most important directions in the development of biocidal nanomaterials is the design and synthesis of multifunctional hybrid composites filled with nanoparticles of bioactive metals for water disinfection [28,29]. Therefore, the approach proposed in this paper can be considered as one of the cost-effective solutions to the problems associated with drinking water pollution.
The presence of chlorophenols in wastewater, surface water, and groundwater may be due to their wide use as intermediates in the production of plastics, paints, pharmaceuticals, pesticides, and insecticides, or as byproducts in refineries, dry distillation of shale, and production of phenolic resin and naphthalic acid [30]. In addition, microbiological or oxidative degradation of some herbicides, i.e., chlorophenoxy acids, commonly used in agriculture, may result in chlorophenols as an intermediate. Some of them are more persistent in the natural environment than their parent compounds [30,31]. They are responsible for the unpleasant taste and odor of water and its negative effects on the health of the creatures that consume it, even at low concentrations. According to the International Agency for Research on Cancer (ICRA), chlorophenols belong to group B2 (probable carcinogen) [31]. Therefore, the elimination of these compounds from water is of great importance from a public health perspective.
Thus, the main aim of this work is to develop a nanostructured hybrid Ag-containing carbon sorbent with antimicrobial activity and to study its structural and adsorptive properties. Essentially, we present a tailored approach to prepare carbon-based sorbents with nanoscale silver and compare their antibacterial activity against Gram-positive (Staphylococcus aureus, ATCC 25923) and Gram-negative strains (Escherichia coli, ATCC 25922, Klebsiella pneumoniae, ATCC 700603, Pseudomonas aeruginosa, ATCC 27853, and Acinetobacter baumannii, ATCC 19606). In addition, the composites were tested for adsorption of a phenol derivative (4-chlorophenol) to ensure their functionality as a suitable and useful filter medium.

2. Materials and Methods

2.1. Reagents

Fumed silica A-300 (Pilot plant of Chuiko Institute of Surface Chemistry, Kalush, Ukraine), silver nitrate (AgNO3, >99% purity, Sigma-Aldrich, Poznań, Poland). Resorcinol (C6H6O2, 99.9% purity), 25%-ammonia (NH4OH), 37% aqueous solution of formaldehyde and citric acid monohydrate (GOST 908-2004) were obtained from Chimlaborreativ, Ukraine, and were used in the synthesis of resorcinol–formaldehyde resin compounds. Moreover, 4-chlorophenol (ClC6H4OH, ≥99% purity, Sigma-Aldrich, Poland) was used as adsorbate. All materials and double-distilled water were used without additional processing.

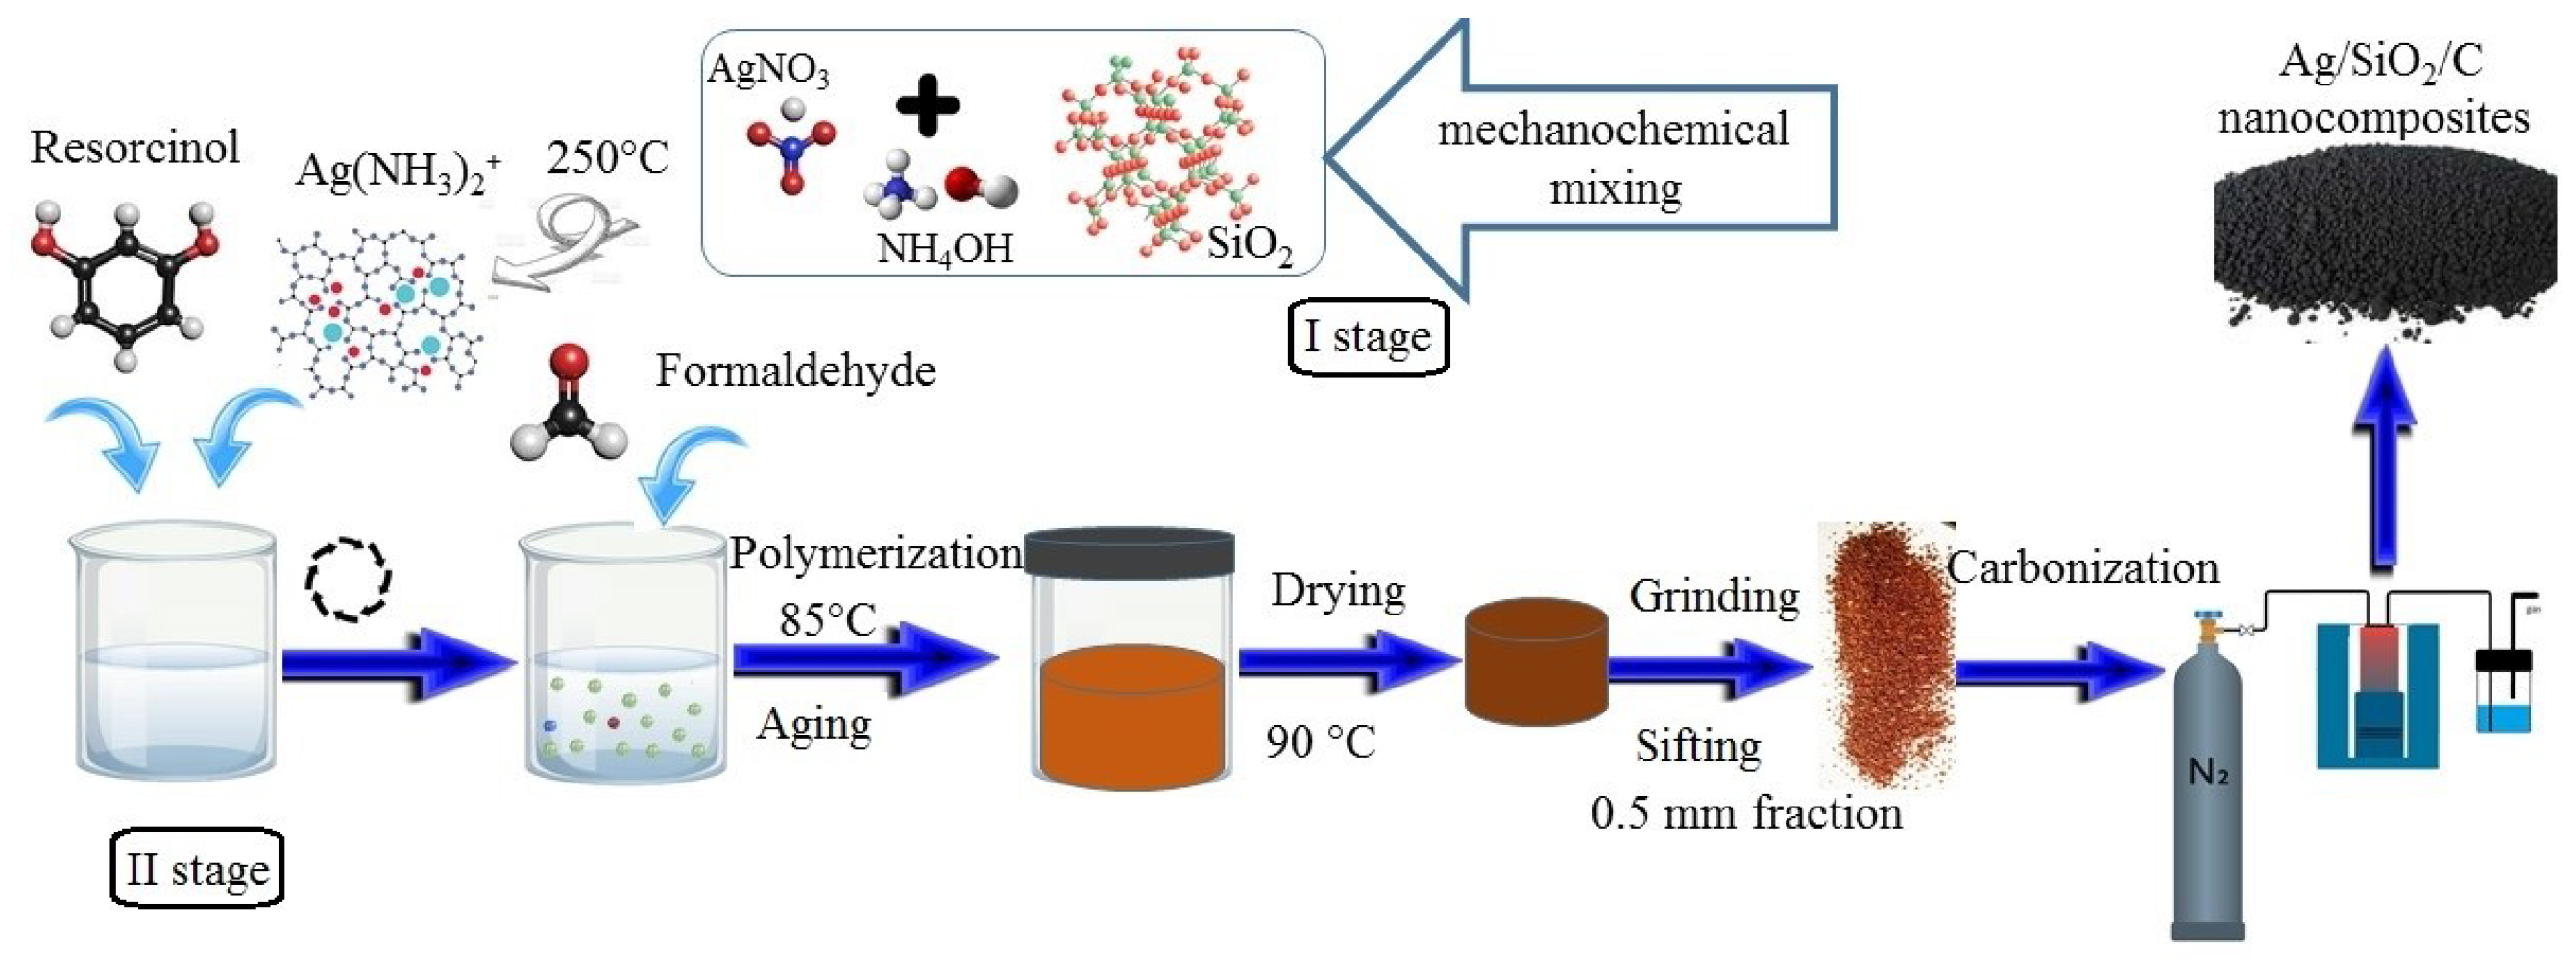
2.2. Sample Synthesis

The Ag/SiO2 fillers were synthesized following a procedure that has been reported previously (Figure 1) [32]. In summary, silica was modified by the formation of Ag(NH3)2+ complexes during mechanochemical mixing in a porcelain ball mill (2 L volume) using different amounts of AgNO3 and SiO2 components in the presence of ammonia solution (I stage). The concentrations of AgNO3 used were 0.2, 0.5 and 1 mmol/g. Based on our previous research, the proposed concentrations allow us to obtain samples with a uniform distribution of the modifier in the silica matrix [32]. In the second stage, the polymeric composites were prepared by dissolving resorcinol in formalin and adding 2 g of the as-synthesized Ag/SiO2 filler with stirring and additional sonication for 2 min. The weight ratio of resorcinol to formalin was 1:1.5. After aging in the hermetically sealed containers in a thermostatic oven (for 12 h), all samples were dried overnight at 85 °C and pyrolyzed in quartz cells of the reactor in an argon flow at 800 °C for 2 h. The samples were carbonized in a thermostatic oven. The carbonized composites were labeled as RFC-02, RFC-05, and RFC-1, depending on the Ag filler content. The control sample was synthesized without the addition of silver-containing silica using citric acid (1 g) as a catalyst for the polymerization reaction in an aqueous solution (20 g). It underwent all the processing steps as the modified composites to ensure the accuracy of the comparisons and was labeled as RFC.

2.3. Instruments and Measurements

The powder X-ray diffraction (XRD) patterns were recorded with CuKα radiation source (λ = 1.5418 Å) using the Empyrean diffractometer (Malvern, PANalytical, 2012, United Kingdom) in the reflection–transmission stage of the sample and reflection geometry. The spectra were acquired at two theta ranges of 2–80 and 0.01 step size.
The SAXS analysis was carried out by Empyrean diffractometer (Malvern, PANalytical, 2012, United Kingdom) using a CuKα radiation source as SAXS/WAXS capillary mode configuration. The SAXS configuration includes a 2θ range of 0.1–2 degrees of 2θ with the corresponding range of q values of 0.00095–0.015 nm−1. The length of the scattering vector q is defined as q = 4πsinθ/λ, where 2θ the scattering angle, λ is the X-ray wavelength (0.15418 nm). The device was powered by generator settings of 40 kV and 40 mA. The incident beam path consisted of a line focus X-ray tube and mirror with an elliptic shape. The primary beam was measured using a Cu 0.2 mm beam attenuator. The measurements were taken using a PIXcel1D detector and receiving slit with 0.05 mm active length. Background scattering was performed by air scattering measure with an empty sample holder. The EasySAXS (Panalitycal) software (Version 2.0a) was applied for SAXS calculations. Dv(R) calculations were performed using the indirect Fourier transformation technique with an algorithm based on Tikhonov’s regularization method. Pair distance distribution function (PDDF) as real space counterparts of the experimental intensity (P(r)) were calculated by the EasySAXS program as an indirect Fourier transform of these data. The Guinier plot as ln(I(q)) vs. q2 was used to determine the radius of gyration Rg from the slope of the plot (−Rg2/3).
The surface morphology of the samples was studied by field emission scanning electron microscopy (SEM, QuantaTM 3D FEG (FEI, Hillsboro, OR, USA) operating at a voltage of 30.0 kV).
The microstructure of the composites was analyzed via transmission electron microscopy (TEM, Titan FEI Company operating at 300 kV). A 300 W 0.15–200 mL Ultrasonic Homogenizer Sonicator Processor Cell Disruptor Mixer was used for mixing initial components.
To analyze the textural characteristics, low-temperature (77.4 K) nitrogen adsorption–desorption isotherms were recorded using a Micromeritics ASAP 2405N adsorption analyzer. The specific surface area (SBET) was calculated according to the standard BET method [33]. The total pore volume Vp was evaluated from the nitrogen adsorption at p/p0 = 0.98–0.99 (p and p0 denote the equilibrium and saturation pressure of nitrogen at 77.4 K, respectively). The nitrogen desorption data were used to compute the pore size distributions (PSD, differential fV(R)~dVp/dR and fS(R)~dS/dR) using a model with slit-shaped, cylindrical pores and voids between nanoparticles (SCV) [34]. The differential PSD with respect to pore volume fV(R)~dVp/dR, ∫ fV(R)dR~Vp, were recalculated into incremental PSD (IPSD, ∑ Φv,i (R) = Vp). The fV(R) and fS(R) functions were also used to calculate contributions of micropores (Vmicro and Smicro at R ≤ 1 nm), mesopores (Vmeso and Smeso at 1 nm < R < 25 nm) and macropores (Vmacro and Smacro at R > 25 nm) to the total pore volume and specific surface area.

2.4. Adsorption Studies

Kinetic measurements were performed using a UV–Vis spectrophotometer (Cary 100, Varian, Melbourne, VIC, Australia) with a flow cell for periodic measurements of solution concentration. An aqueous solution of 4-chlorophenol with an initial concentration of 0.313 mmol/L was contacted with 0.2 g of adsorbent in a glass vessel. During the experiment, the suspension solution was stirred with a magnetic stirrer. At specific times, the solution sample was drawn into a flow cell via a peristaltic pump, the absorption spectrum was measured (wavelength range 200–350 nm), and returned to the reaction vessel. During the experiment, several dozen absorption spectra were collected for each adsorption system. The kinetic data were used to calculate the concentration-time profiles, which were then optimized using various theoretical equations listed in Table 1.

2.5. Antibacterial Activity Determination

Antibacterial activities were determined using the agar well diffusion method [39,40] against strains from the American Type Culture Collection: Staphylococcus aureus ATCC 25923, Escherichia coli ATCC 25922, Klebsiella pneumoniae ATCC 700603, Pseudomonas aeruginosa ATCC 27853, and Acinetobacter baumannii ATCC 19606 commonly used as control strains for susceptibility testing to antibiotics and other antibacterial compounds according to EUCAST recommendation (The European Committee on Antimicrobial Susceptibility Testing). E. coli is the most reliable indicator of fecal bacterial contamination of waters, and it is used as a measure of microbial contamination of water quality level. Meanwhile, K. pneumoniae, P. aeruginosa and A. baumannii strains are multidrug-resistant opportunistic pathogens that can cause nosocomial infections.
Muller–Hinton Agar MHA plates were inoculated with suspensions of the tested strains at a density of 1.5 × 10⁸ CFU/mL 0.5 McFarland. An 8 mm diameter hole was then punched with a sterile cork-borer and 10 mg of the tested samples (RFC, RFC-02, RFC-05, and RFC-1) were applied. Silver nanoparticle stock solution (40 mg/L) in doses of 2 g and reference antibiotic cefepime—4th generation cephalosporin (disc 30 µg) were used as positive control. After 18 h of incubation at 37 °C, the zones of bacterial growth inhibition were measured. All experiments were performed in triplicate.

3. Results and Discussion

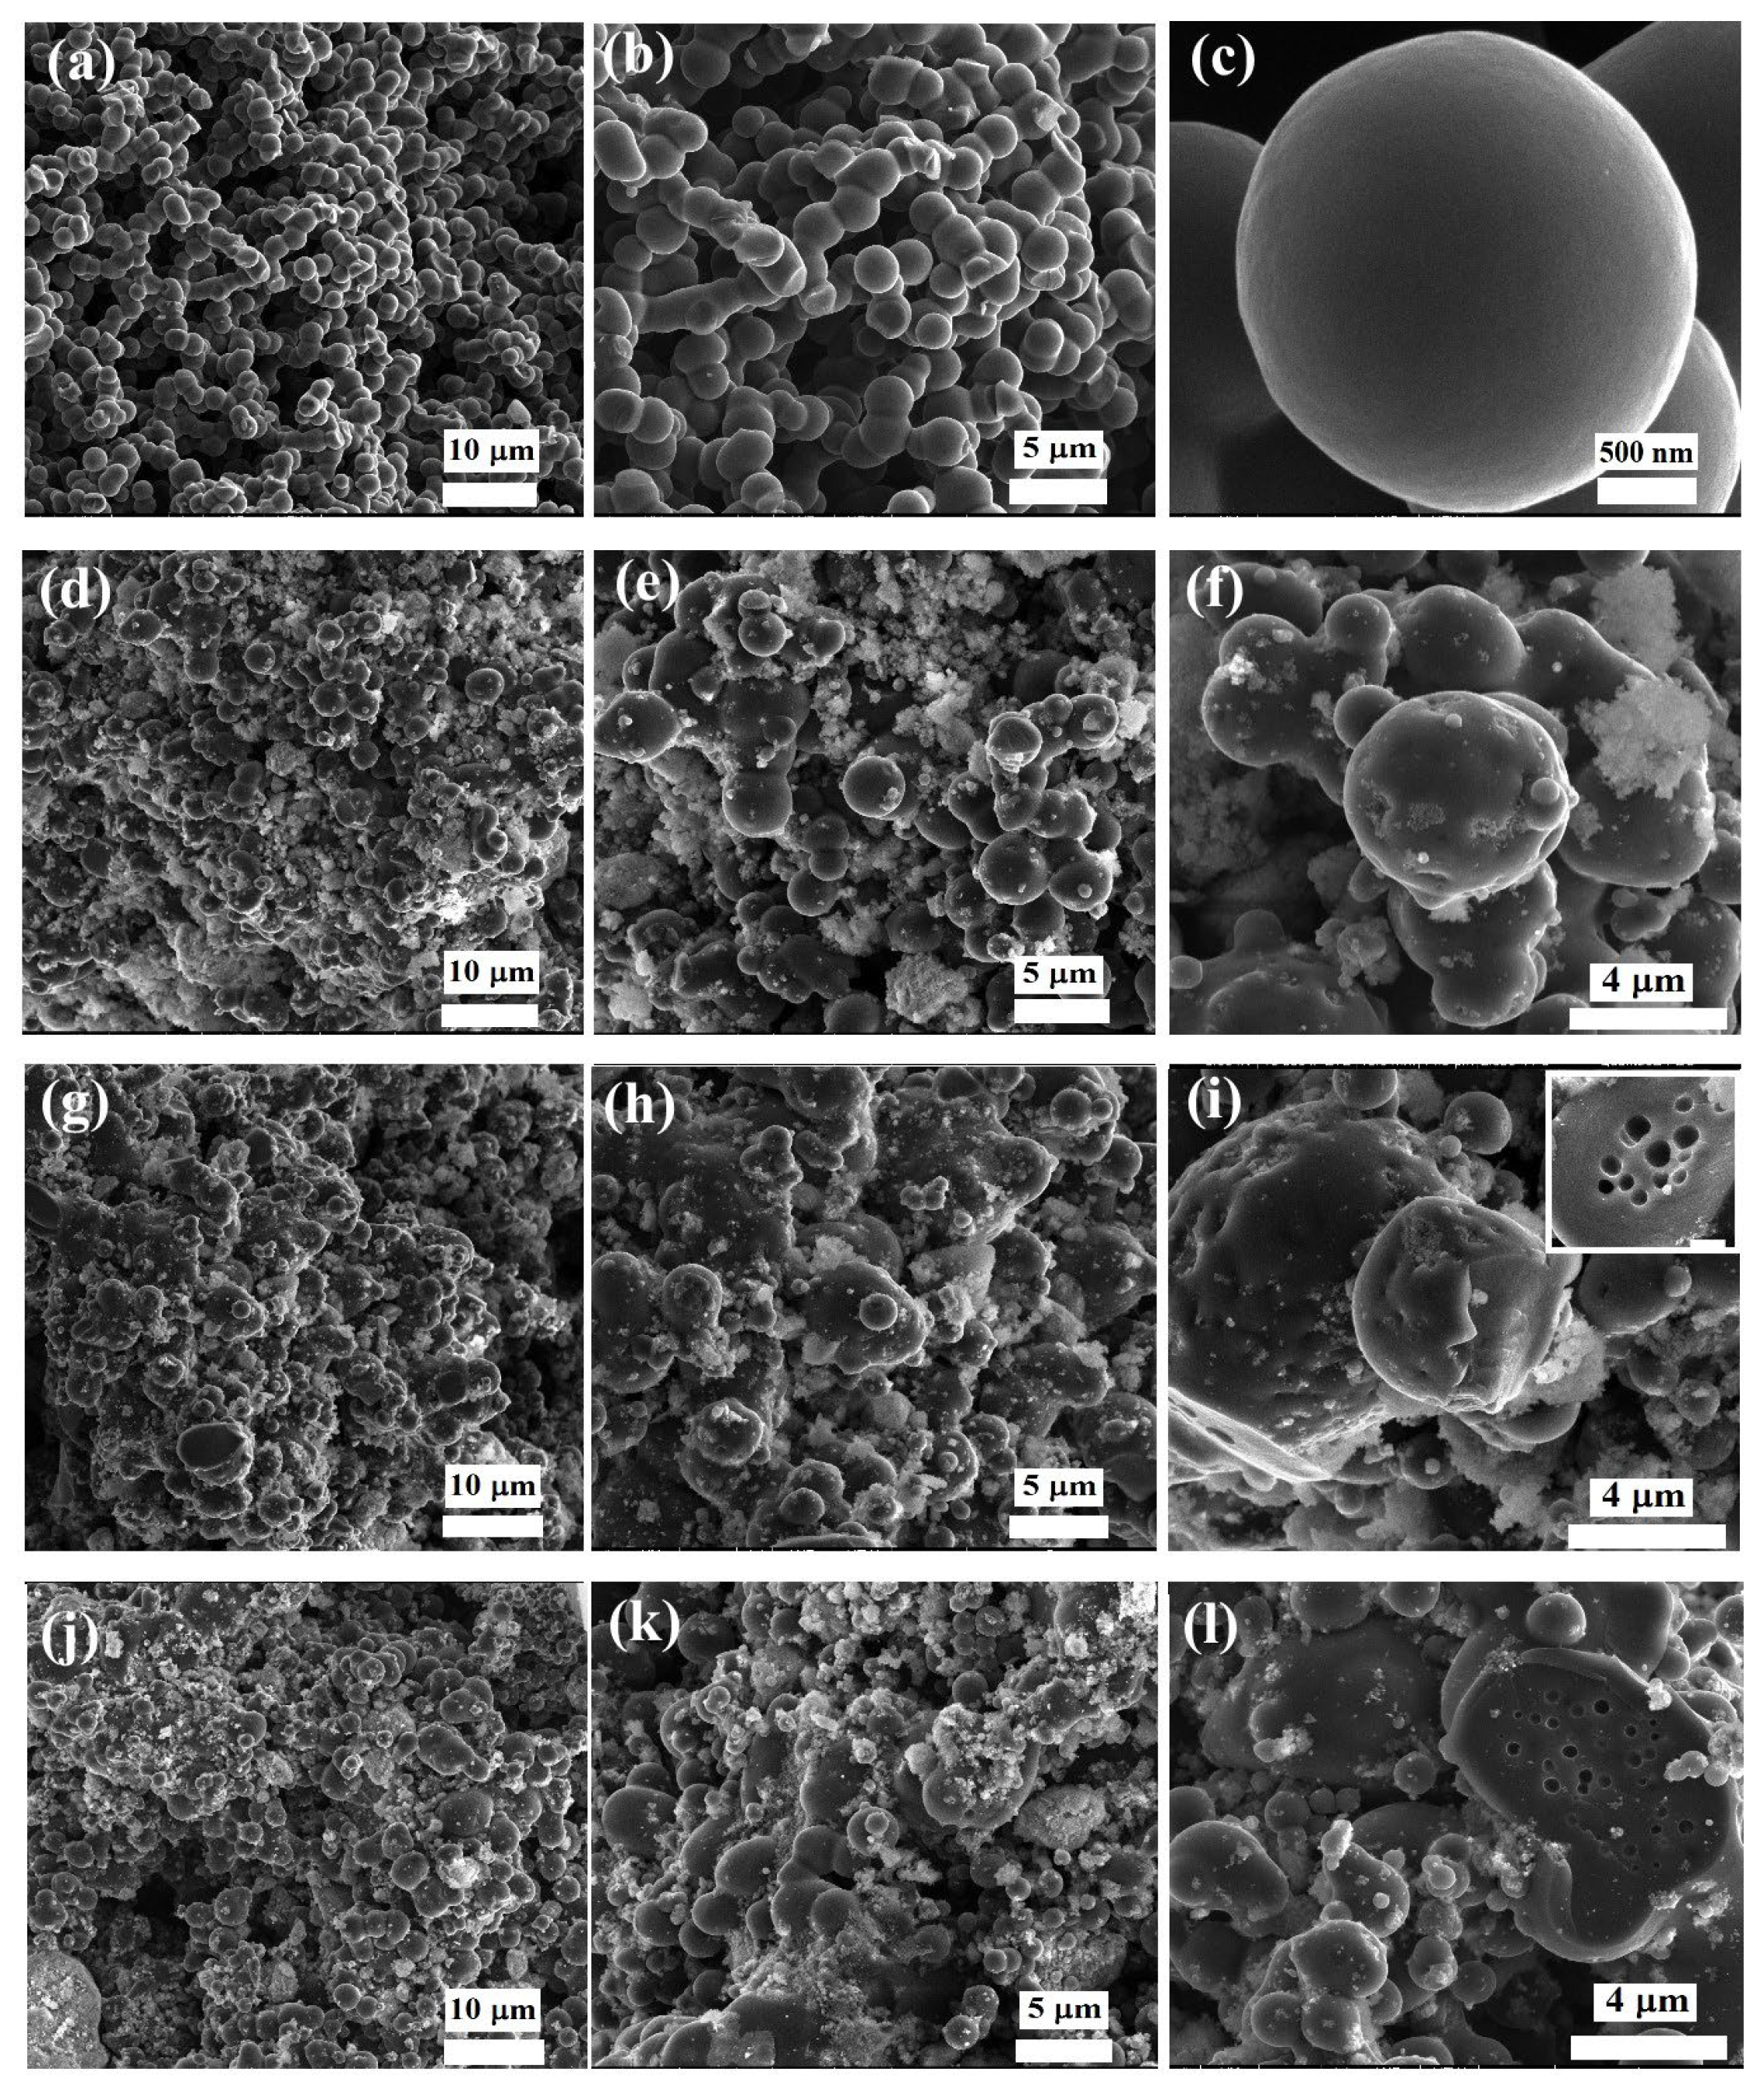
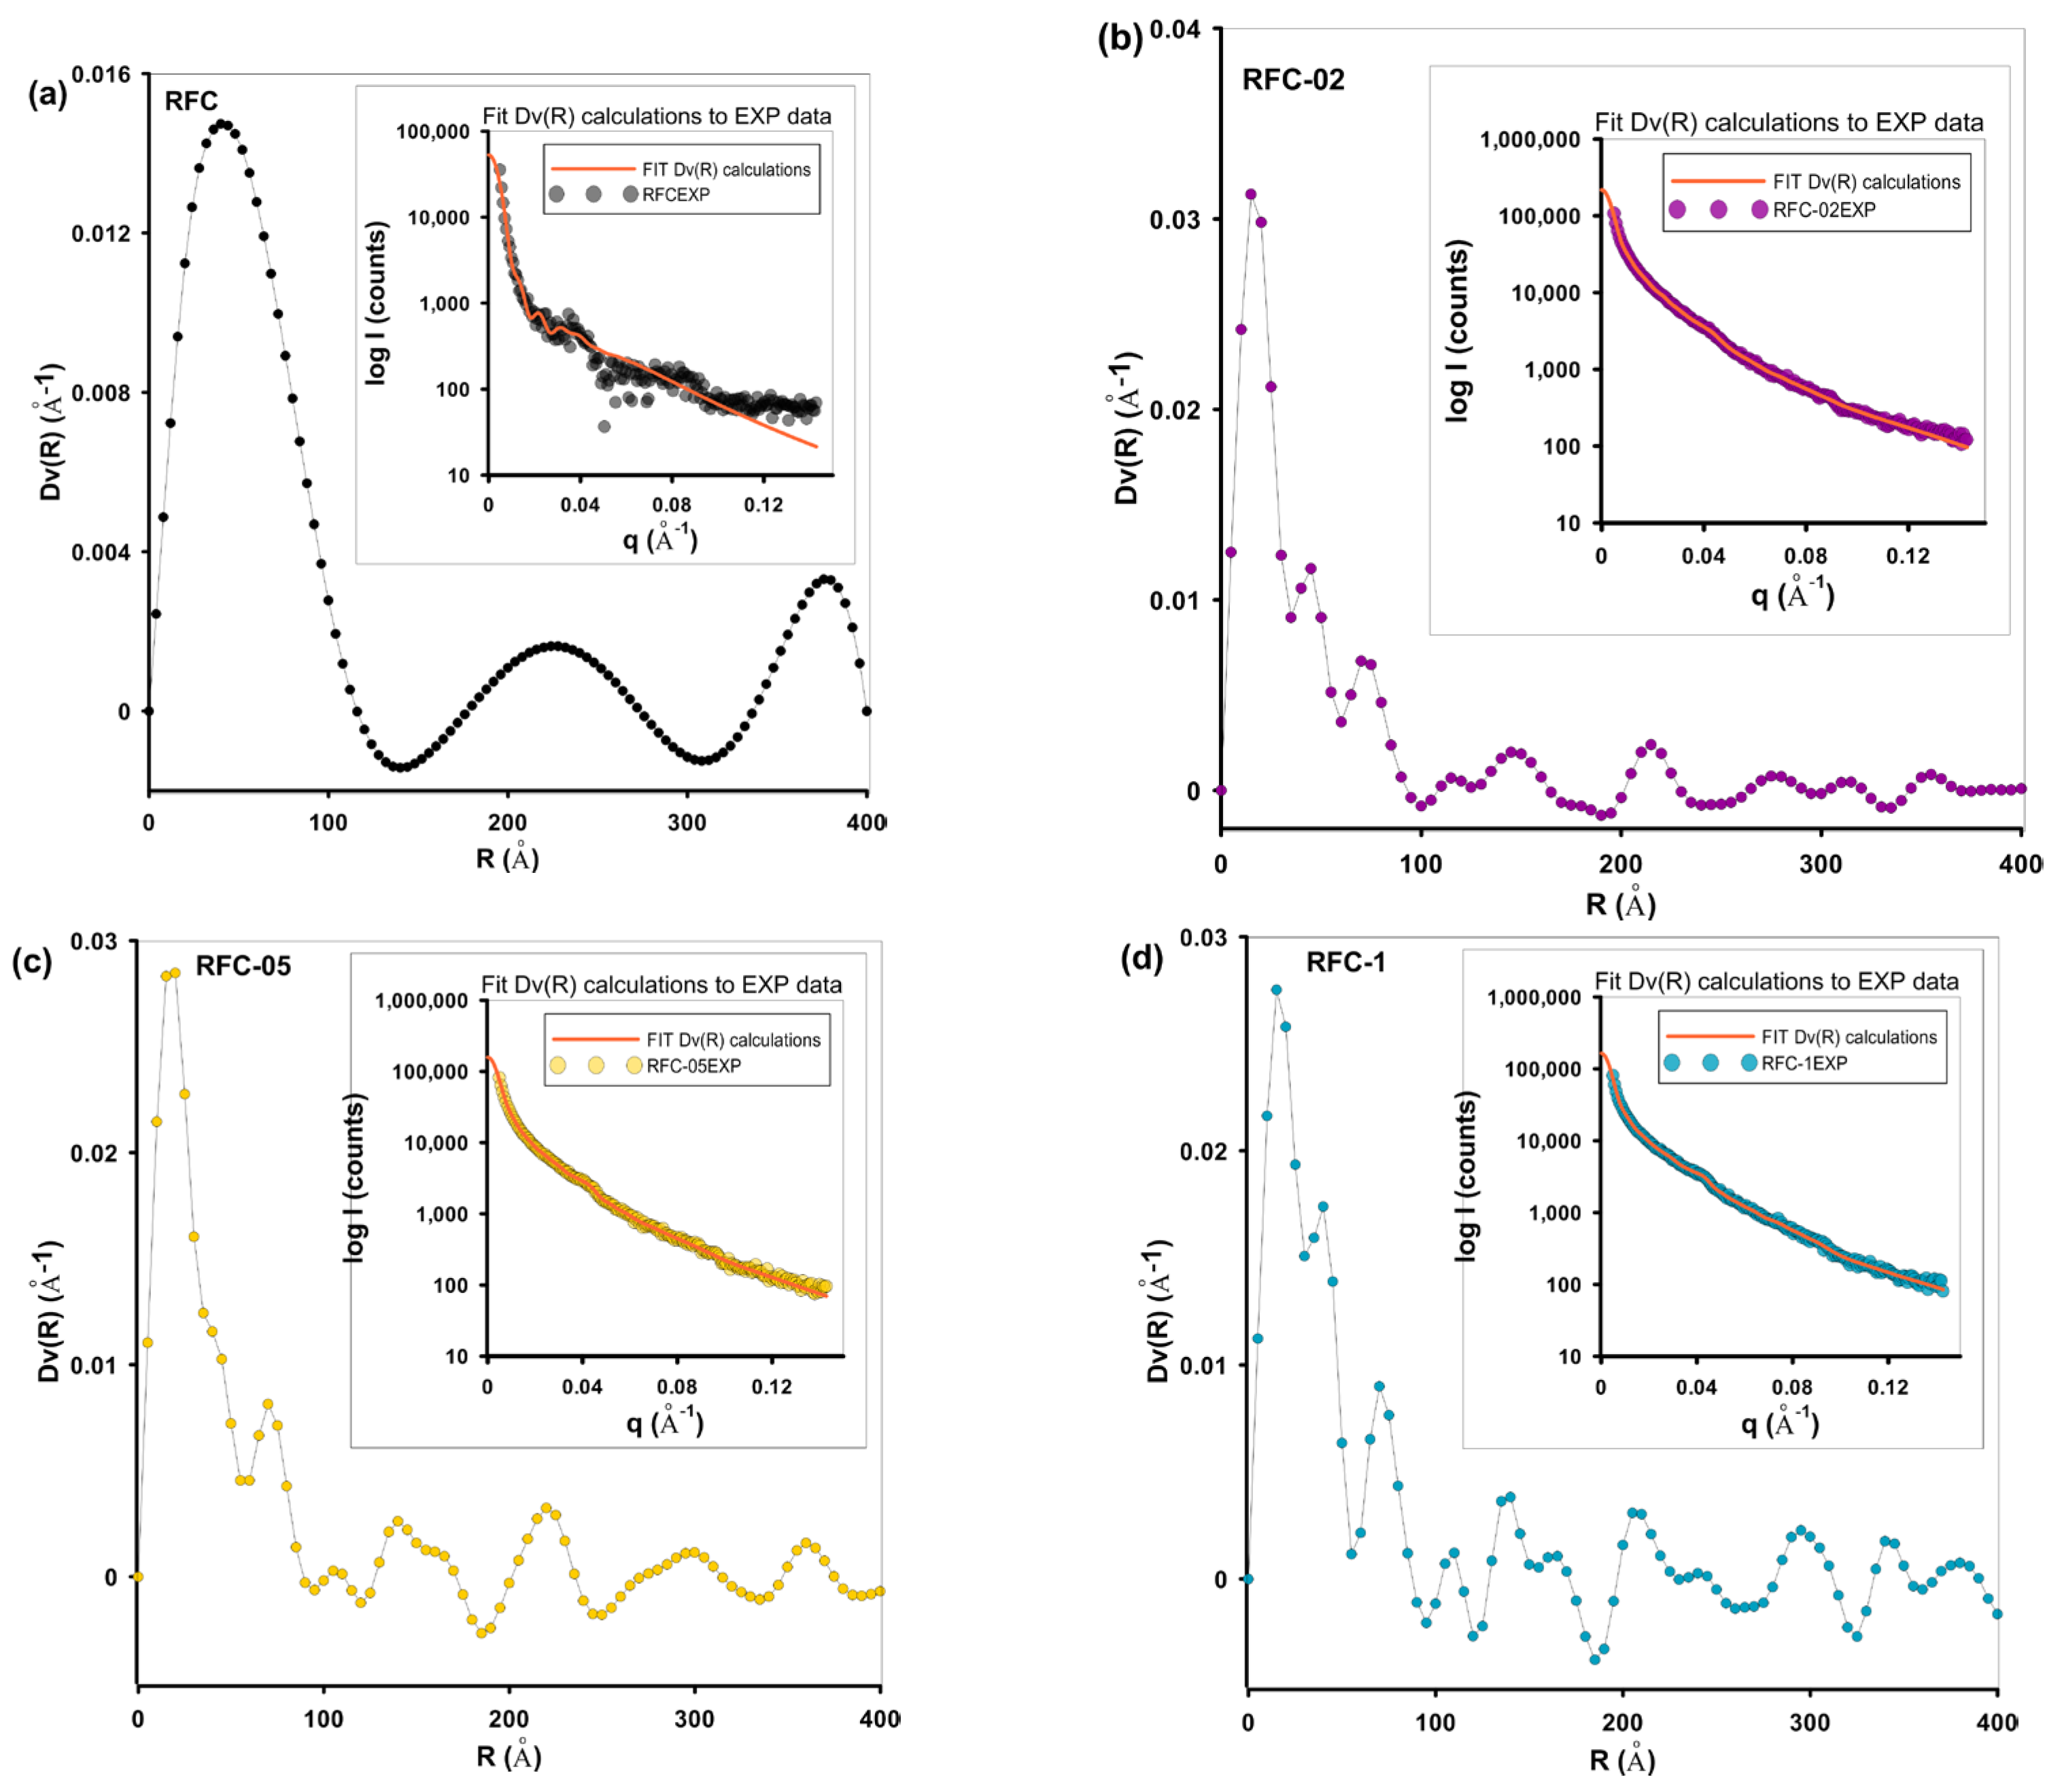
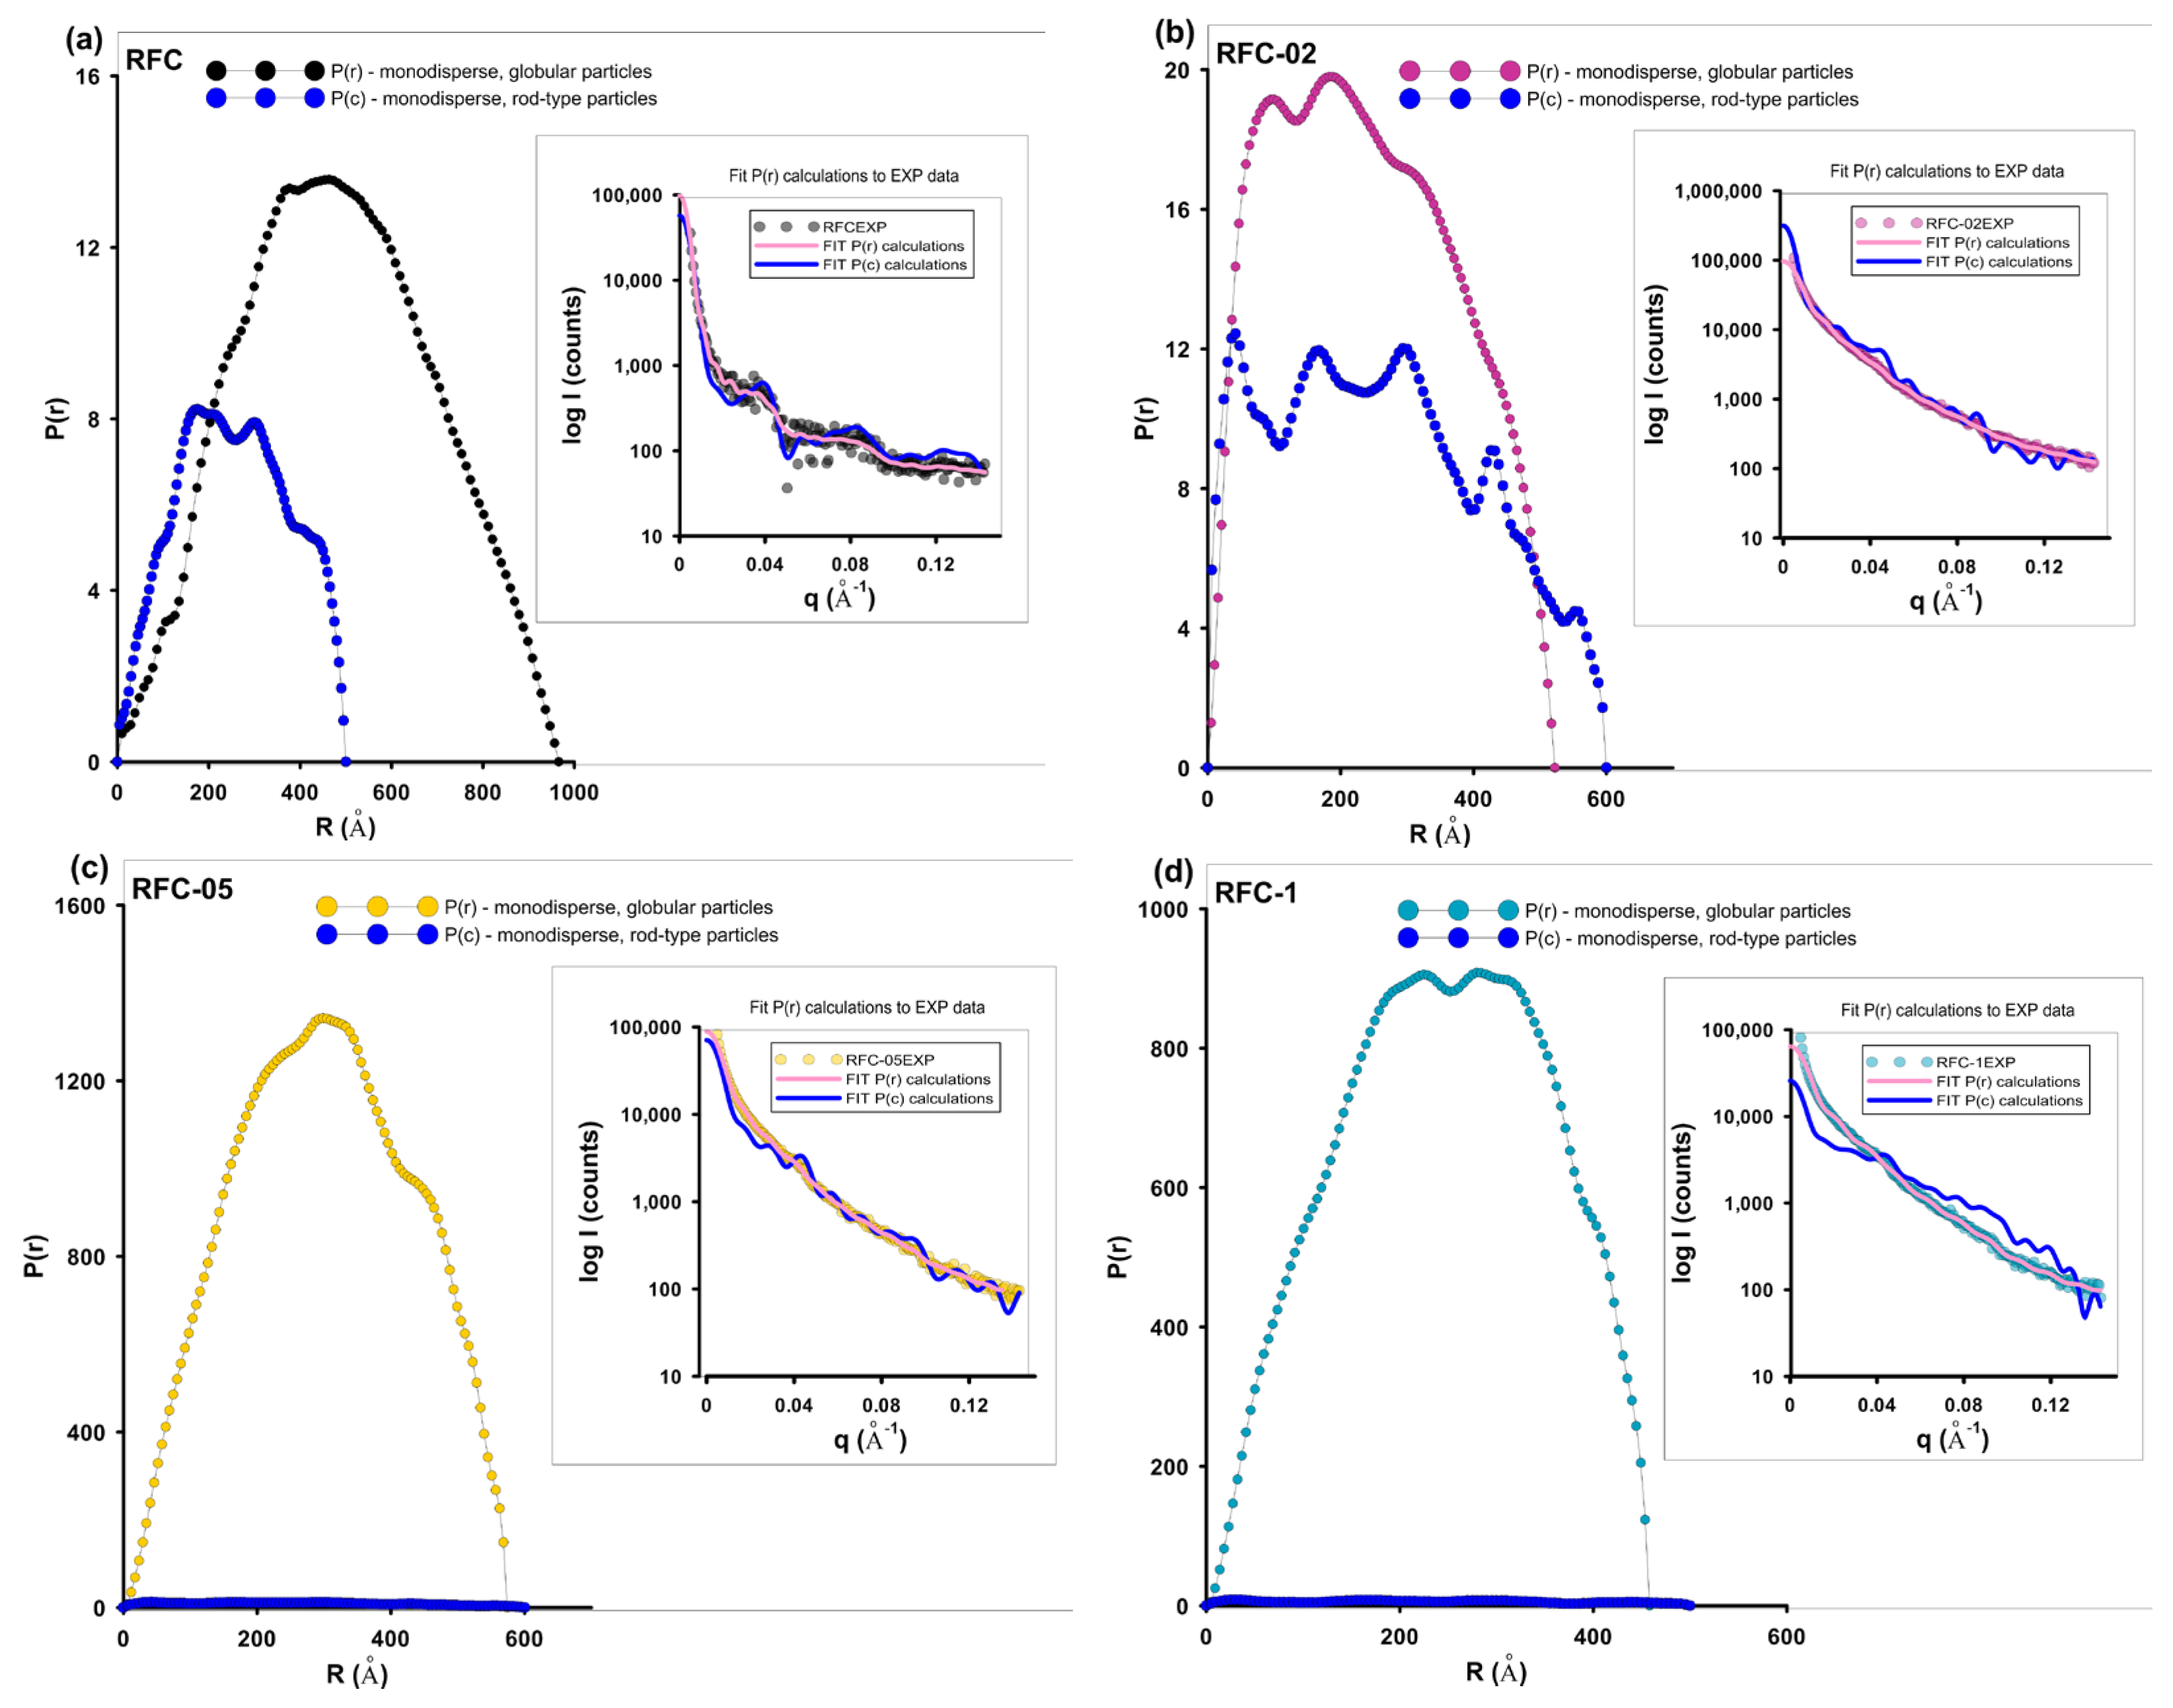
3.1. Characterization of the Adsorbents

The XRD data measured for the synthesized samples are shown in Figure 2. All X-ray diffraction patterns of the composites exhibit a few characteristic reflections. It can be seen that all patterns have two broad diffraction features at 23° and ~43° associated with amorphous carbon. The XRD patterns of the modified samples show a significant broadening of the halo in the region 2θ = 22.5, which is due to the presence of amorphous silica (21.26°), which practically coincides in its angular position with the first halo of the disordered structure of the carbon material.
Analysis of the Ag-containing samples confirmed the crystal structure of the silver nanoparticles by the presence of four distinct diffraction peaks at 2θ = 38.1°, 44.3°, 64.29°, and 77.3° with Miller indices (111), (200), (202), and (311), respectively. The cubic unit cell was found to have a constant lattice (a = 0.40855 nm). The average size of silver crystallites of AgNPs in the samples is 13.1, 11 and 14 nm for RFC-02, RFC-05 and RFC-1, respectively. Considering that only the metallic silver phase is present, this indicates the high purity of the composites after synthesis.
SEM images of the unmodified carbon composite (Figure 3a) show the formation of microspheres with a diameter ranging between about 2–4 μm arranged in chains and having a smooth surface and uniform size. High-magnification SEM images of the modified carbons (Figure 2) show that the carbon microspheres are of non-uniform size and irregular spherical morphology, forming denser aggregates with small amounts of amorphous silica phase on the outer surface.
It is noteworthy that the size distribution of the spheres becomes more heterogeneous with increasing silver salt content (Figure 3d–l). Numerous spheres measuring 1 μm in size appear. In our studies, the amino groups from the ammonia solution play an important role in the formation of polymer spheres and consequently carbon spheres after pyrolysis. NH4+ not only accelerates the RF polymerization process, but also ensures the accumulation of positive charges on the outer surface of the polymer spheres, which prevents their aggregation and reduces the size of the carbon spheres [41,42]. The volume of ammonia solution used in the synthesis to form Ag(NH3)2+ complexes is the largest for the RFC-1 sample; therefore, the number of spheres with the smallest size is the largest here.
Porous microspheres have interconnected external and internal pores, which gives them a high specific surface area. Consequently, this endows them with high adsorption properties. The interconnected pores in the core can lead to dispersion or dissolution of the active substances (pollutants) in the core of the microspheres. Porosity plays an important role in determining adsorption efficiency and kinetics. Such interconnected pores in the core can lead to an increase in the transport rate of solutes to the active sites of the microspheres.
According to the TEM analysis, Ag nanoparticles exhibit a spherical morphology and are distributed in the carbon phase (Figure 4). During pyrolysis, the majority of single-crystalline nanoparticles of cubic Ag with a diameter ranging between 3–15 nm have penetrated (migrated) into the carbon spheres and are uniformly distributed in the sample (Figure 4). The distance between the planes of the lattice fringes is about 0.235 and 0.202 nm, which corresponds to the (111) and (002) planes of metallic silver [43]. There is such a dependence that with an increase in the content of modifier, the number of small silver nanoparticles (3–8 nm) uniformly distributed in the carbon matrix increases (Figure 4d). This, in turn, may affect biocidal activity, which will be discussed in the next section. In addition, all composites contain nanoparticles consisting of multiple fused nanoparticles with twin planes {111} with diameters up to 18 nm. The most common is the pentagonal fusion (fivefold twinned) with the common axis of the zone (110) (Figure 4f) [44]. The formation of such NPs may be a consequence of Ag agglomeration due to the accumulation of smaller spherical NPs during heat treatment. However, in the sample with the highest content of modifier (RFC-1), particles with sizes ranging up to 50 nm are found. It is noteworthy that silver nanoparticles are also visible on a carbon shell, although they are mainly distributed in the silica matrix (Figure 4b). Moreover, part of the silica phase is located not only inside the carbon spheres, but also on their outer surface.
The structural properties of the nanocomposite materials can be determined using structure-dependent methods such as small-angle X-ray scattering (SAXS). In this way, the study of structural and interfacial properties can be performed for functional hybrid materials showing phase heterogeneity. Figure 5 presents the scattering data (the intensity versus momentum transfer q) in the form of log-linear and log-log plots. The SAXS profiles indicate the lack of structural ordering involving both the metallic phase and the micro-structure of the carriers. Some differences in the scattering profiles in the initial region of the SAXS curves (i.e., in the nanometric sizes of the scattering objects) were noticed. These features concern the scattering intensity and general shape of the scattering curves (especially for unmodified RCF sample) and illustrate the direct consequence of changes in the microstructure and morphology of the scattering objects. Based on the SAXS data, a number of structural parameters were determined. The summary of the calculated SAXS parameters can be found in Table 2.
The size of the scattering objects (spherical particles) was analyzed by calculations of the volume-weighted particle size distribution Dv(R) function (Figure 6 and Figure 7). The scattering objects with spherical morphology (satisfying the probable assumption of a spherical shape according to the best fit of the theoretical curve) have sizes of 5.2, 1.8, 1.9 nm, and 1.7/4.0 nm (bimodal distribution) for the RFC, RFC-02, RFC-05, and RFC-1 samples, respectively.
The imposing of the obtained curves allows us to compare the size distributions of the scattering objects in the studied carbon–silver nanocomposites (Figure 7). The volume-weighted particle size distributions Dv(R) have similar properties, with an extreme value at ~2.0 nm. A shift of this value towards larger sizes (~5.0 nm) is only visible by sample RFC.
The pair distance distribution functions (PDDF, P(r)) are shown in Figure 8. The PDDF function refers to the frequencies of the distances within the particles (in monodisperse systems). The general feature of the spherical compact particle system is the symmetric bell-shaped P(r), while unfolded and aspherical particles have a modified P(r) function at larger distances. The pair distance distribution functions of the scattering curves were calculated in the specified range of the scattering vector 0.002 < q < 0.015 nm−1. Each sample was analyzed in terms of PDDF for monodisperse globular particles as well as monodisperse rod-shaped particles. The flat morphology did not meet the assumptions of the qualitative adjustment and was not considered. The maximum particle dimensions (Dmax) were obtained from PDDF analysis for illustrating the symmetry of the spherical particles with simultaneous evaluation of fit quality. Thus, a spherical morphology of the scattering objects for all samples, and additional probable cylindrical morphology for RFC (Figure 8a) and RFC-02 (Figure 8c) was confirmed.
In the structural evaluation of scattering objects, the electron radius of the gyration of the particle relative to the electron center of gravity was determined. The results of the structural parameter Rg are presented in Table 2. In this work, calculations with the P(r) function were applied to determine the Rg instead of using the Guinier plot. The parameter reflects the average electron density weighted squared distance of the scatters from the center of the nano-object. This parameter is often determined to estimate the exact size of the scattering particles. In this work, the Rg values were obtained as 37/17, 19/21.3, 23 nm, and 19 nm for RFC, RFC-02, RFC-05, and RFC-1 samples, respectively. The results indicate that the particle size decreases with increasing silver content, which was also confirmed via SEM imaging.
Figure 9 shows the Porod plot determined for the investigated samples. In all cases, due to the variations and discrepancies in the unambiguous definition of the Porod curve and the Porod constant values, there are some diffuse boundaries or disturbances in the boundary regions. Therefore, their pseudo-asymptotic shape was defined in the high range of the scattering curves. The negative deviation from Porod’s law demonstrated the existence of an interfacial layer between the phases. Furthermore, a relative comparison of the birth curves may indicate that the interface is largest for the sample with the highest I·q3.
The porous structure of the adsorbent largely determines its adsorption ability towards dissolved substances and therefore affects the efficiency of the adsorption technology. It is clear that micropores, the sizes of which are smaller than the molecular dimensions of dissolved substances, do not participate in the adsorption process and are therefore useless in the adsorption of complex molecules of organic substances (surfactants, dyes, or polymers, for example). In the case of small molecules, the micropores form the main part of the adsorbent internal structure, playing an important role in adsorption. The volume of overly wide pores is also not fully utilized for selective adsorption from aqueous solutions. This process occurs only in a monomolecular layer on the pore surface. The content of micropores with a half-width of less than 0.5 nm is also generally useless for the adsorption of organic substances from solutions since such micropores are inaccessible to almost all organic molecules. It should be noted that both low-molecular-weight and high-molecular-weight substances, as well as multimolecular associations, are usually present in production wastewater. The size of the pollutant molecules, most of which are found in aqueous solutions, allows determining the usefulness of specific adsorbents. Micelles of surfactants, dyes, and humic acids formed in aqueous solutions by the association of single non-ionized or ionized molecules in the presence of strong electrolytes have linear dimensions that in most cases do not exceed 10 nm [45,46]. Thus, for the removal of organic substances from aqueous solutions, adsorbents with pores whose half-width is in the range of 0.5–10 nm are required. Therefore, from a technological point of view, it would probably be advisable to have an adsorbent with a bimodal distribution of pores: microporous with an interval ranging from 0.3 to 1.0 nm and mesoporous with an interval ranging from 2 to 10 nm.
The porosity of the obtained samples was characterized by low-temperature N2 adsorption–desorption measurements. Figure 10 shows the adsorption isotherms and pore size distributions of the composites. The nitrogen adsorption isotherms of the modified composites can be characterized as a combination of II and IV-type curves, with the curve increasing at a lower p/p0 (0–0.15) due to micropore filling [47]. As p/p0 increases, nitrogen adsorption slowly increases, and single-layer adsorption passes to multilayer adsorption. At p/p0 > 0.8, N2 adsorption increases sharply, indicating capillary condensation in the mesopores. The adsorption and desorption curves have an inflection point and grow rapidly around p/p0 = 0.8. A small hysteresis loop formed between the adsorption and desorption curves in the modified composites belongs to the H3 type, in which aggregates (loose assemblages) of plate-like particles form slit-like micropores. Figure 10b shows that the micropores have a large contribution to the total porosity of the adsorbents. In the case of the control RFC sample, the character of nitrogen adsorption is quite different compared to the filled composites. This isotherm of type I is characteristic of microporous material (Rpores = 0.7, Table 3). A slight increase in adsorption at higher relative pressures and a narrow hysteresis loop indicates a small contribution of mesopores to the total porosity of this material. However, from a practical point of view, it should be noted that filter systems with a pore size of 1 micron or less are very effective in removing of Cryptosporidium and Giardia [48]. The pore diameter of the composites should be very small to prevent pathogenic microorganisms from entering the pores [49].
It is noteworthy that despite the same weight of filler (2 g) in all silica-containing samples, the RFC-02 sample with the lowest content of silver filler has a larger proportion of mesopores than RFC-05 and RFC-1, where the content of Ag nanoparticles is higher (Figure 10, Table 3). The average pore size tended to decrease from 6.5 to 4 nm with increasing Ag nanoparticle content. This in turn confirms the successful incorporation of the active nanoparticles into the carbon matrix during the pyrolysis process and the formation of the composite. The SEM images and the shape of the isotherms confirm the textural difference between the composites.

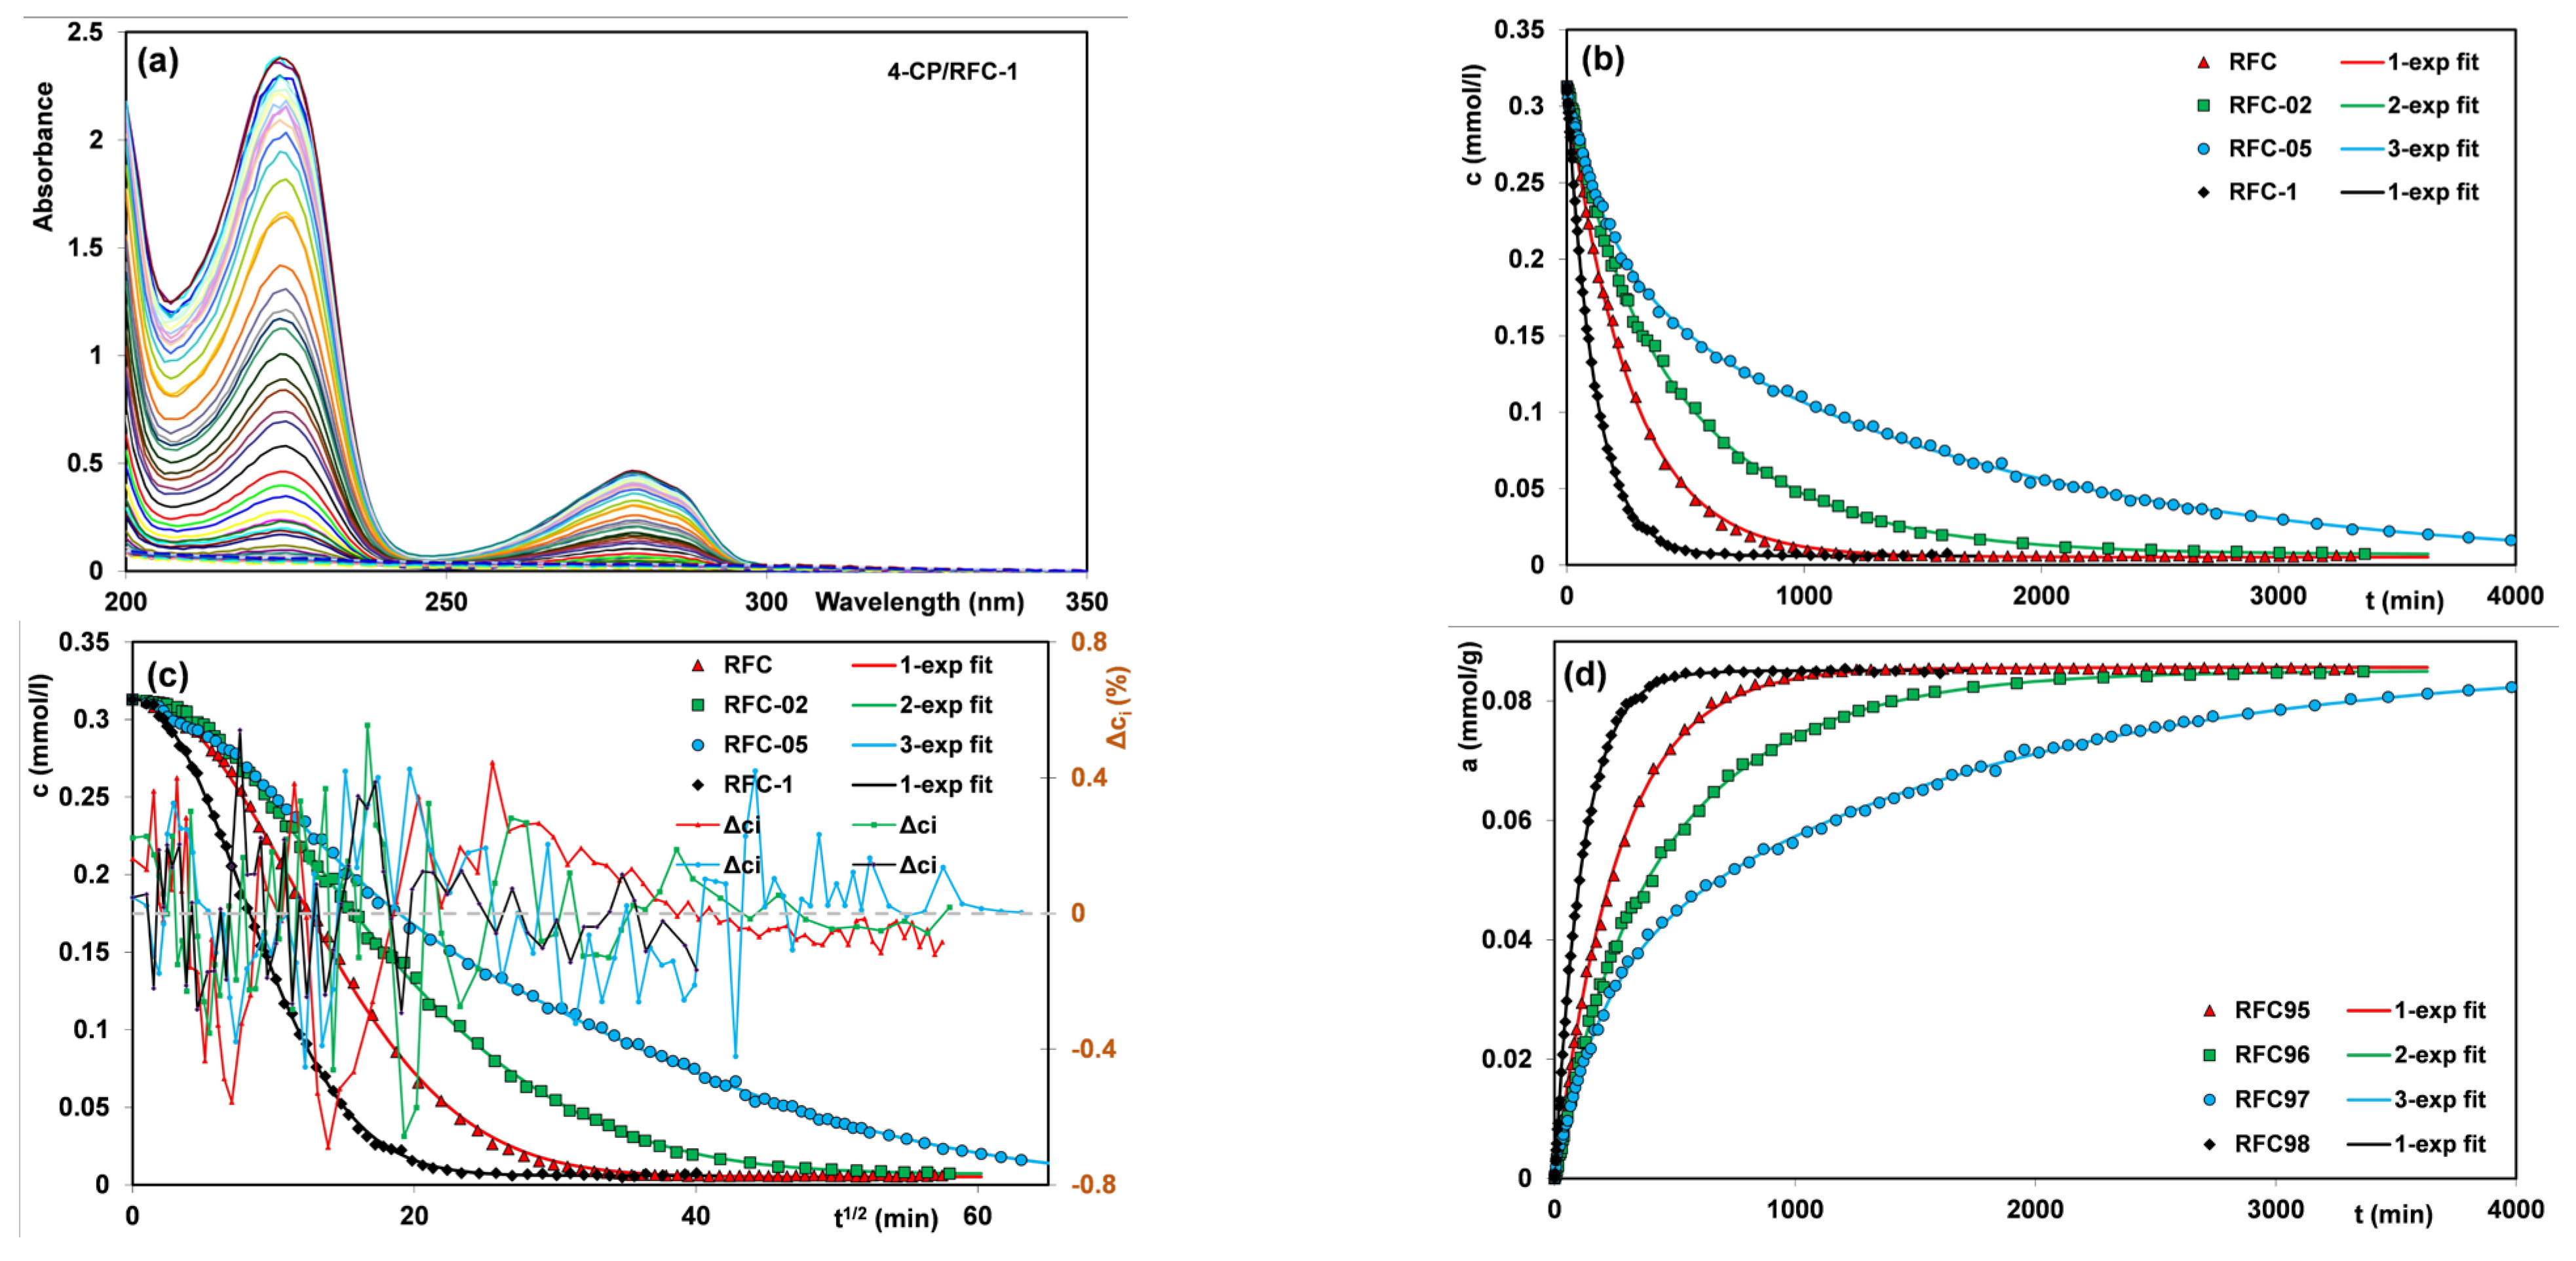
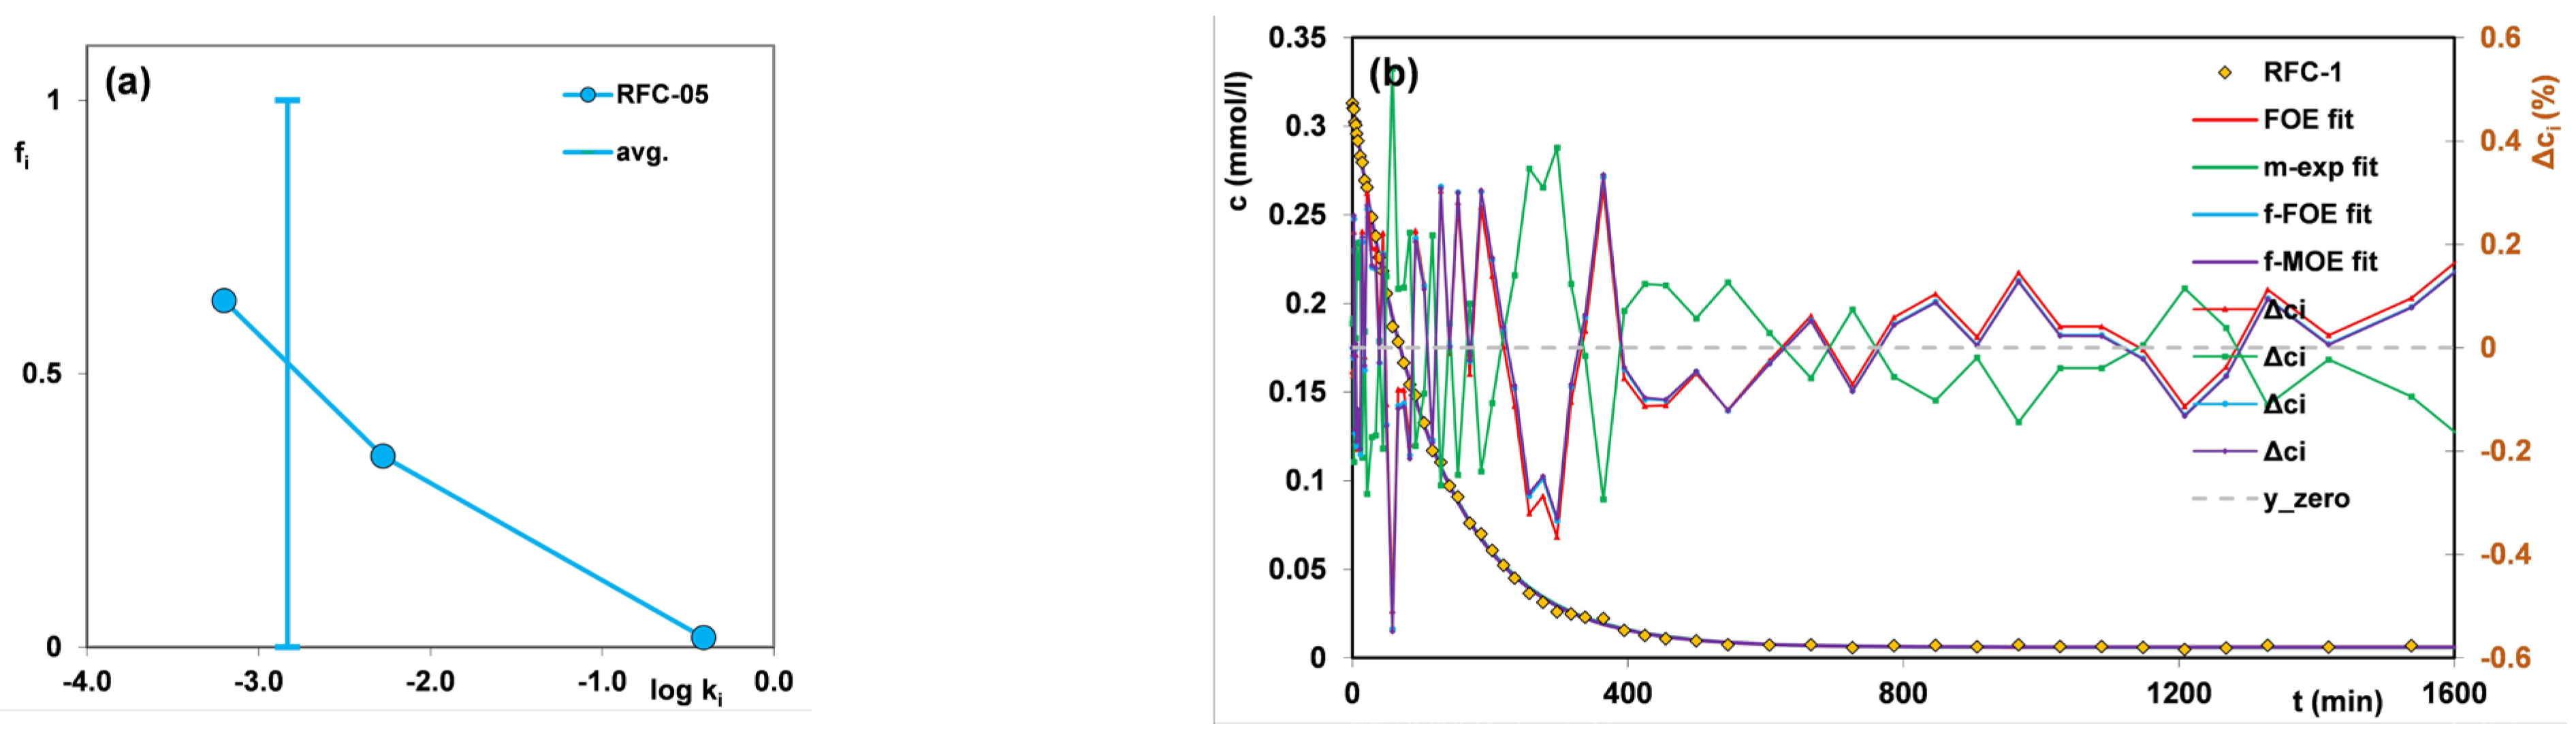
3.2. Adsorption of 4-Chlorophenol

In the case of adsorption from solutions, the effect of adsorbent porosity and the surface properties should be considered, with the latter effect being the most important. The influence of the adsorbent porosity on the adsorption efficiency depends on the pore volume and the relationship between the pore sizes and the size of the adsorbate molecules. In general, small adsorbate molecule sizes increase adsorption effectiveness in terms of adsorption amount and also adsorption rate by facilitating diffusion of the adsorbate.
Thus, the usefulness of adsorption technology in environmental applications depends on the adsorption capacity and the kinetics of the process. In flow-through filters for water, the latter factor seems to be particularly important. The results of adsorption experiments presented in this paper are related to the kinetics of adsorption of 4-chlorophenol on the novel carbon nanocomposites (RFC-02–RFC-1) and pure carbon—reference material (RFC). Based on the spectrophotometric data (Figure 11a), profiles of both concentration and adsorption changes over time were constructed for the systems studied (Figure 11b,c).
In order to better show the progress of the adsorption process in the initial phase, the curves of concentration changes versus the square root of time are also shown. One can observe significant differences in the adsorption rate of the pollutant depending on the carbon composite used.
The order of the adsorption rate of 4-CP on the studied adsorbents is as follows: RFC-1 > RFC > RFC-02 > RFC-05. The values of the kinetic parameters, i.e., the rate constant (log k) and the half-time (t0.5), estimated from the multi-exponential equation, are as follows for the above systems: −2.07; −2.42; −2.62; −2.83 and: 81; 181; 289; 470 min, respectively. Of all of them, RFC-05 seems to be the most heterogeneous solid, since the adsorption kinetics is described by 3 terms of the m-exponential equation (for the other systems it is 1 or 2 terms). This means that the kinetics is determined by a parallel or series of subsequent processes of a differentiated nature, for which the values of the rate coefficients k1, k2 and k3 are: −0.41; −2.28, and −3.20, respectively. For illustration purposes, the distribution of the parameter (ki), which shows the relative contribution of the slow and fast kinetic terms in the m-exponential equation, is shown in Figure 12a.
The total adsorbed amount of 4-CP on the pure carbon, nanocomposites RFC-02 and RFC-1 is 0.085 mmol/g, while for RFC-05 it is slightly lower at 0.082 mmol/g. In the latter case, the lower value is due to the fact that the experiment was terminated before dynamic equilibrium was reached. The explanation for the differences in the adsorption rate is not straightforward, since several factors have to be considered, i.e.,: (i) characteristics of the texture and structure of the materials; (ii) the relative contribution of the carbon and silica components; (iii) the spatial location of the carbon component with respect to the silica component; (iv) the contribution of the metallic phase; (v) the mechanism of the adsorption process. Composites RFC-02-1 belong to hybrid materials in which the organic and inorganic components are carbon and silica, respectively, with an incorporated metallic nanophase. The role of the composites (carbon and silica components) is to remove undesirable pollutants dissolved in water by adsorption. The silica component serves mainly as a carrier for the metallic nanophase. Silica is characterized by weak adsorption potential (there are no active sites on its surface that strongly interact with chlorophenols), but its participation in adsorption cannot be completely ruled out. Confirmation of this thesis can be found in the subject literature [50,51,52]. The role of metallic nanophase (silver nanoparticles) is its disinfecting effect on microorganisms present in water. Since metallic nanoparticles have high surface energy, which leads to their high reactivity and tendency to agglomeration, the encapsulation method was used in the synthesis of composites, which resulted in a product with a core–shell structure [53,54]. The core and shell are composed of silica (with embedded metallic nanophase) and carbon, respectively. This solution avoids the unfavorable phenomenon of agglomeration of silver nanoparticles, which weakens their antimicrobial capabilities.
The nature of the composite component determines the adsorption mechanism of 4-CP. In the carbon shell of the capsule, strong π-π interactions are expected between the adsorbate benzene rings and the aromatic rings of the graphene layers. In addition, hydrogen bonds between the adsorbate phenyl group and the oxygen moieties of the carbon surface are also quite probable [55]. In turn, only weak hydrogen bonds can be formed in the silica core between the adsorbate phenyl groups and the silanol moieties of the silica [56]. Considering the complexity of the synthesis of carbon nanocomposites, it is likely that the products differ not only in the amount of metallic nanophase (this was the intention), but also to a slight extent in the relative proportions of the carbon and silica components. Moreover, the structural properties of the composites, determined on the basis of X-ray diffraction and N2-physisorption measurements, are the result of the properties of the two components plus the metallic nanophase. The assumption of the encapsulation process is to obtain a product with a strictly defined position of two phases (carbon shell and silica core); however, the SEM and TEM microphotographs and the TEM maps show that the carbon phase contains a silica addition and vice versa. All these factors and a significant difference in the 4-CP affinity towards carbon and silica components make it difficult to state how they affect the adsorption rate in the studied systems. Only the SEM images show that the RFC-1 sample is characterized by the lowest diameter range of the carbon microspheres (the fastest 4-CP adsorption), which allows greater adsorption on the outer surface of the solid and easier access for the adsorbate to the transport channels of the internal pore network. Pure carbon (4-CP adsorption is slower than on RFC-1) is characterized by a highly homogeneous morphology and larger spheres compared to RFC-1. It should be noted that the structure of this sample is microporous, which should slow the diffusion of contaminants to the surface active sites. RFC-02 and RFC-1, in turn, appear to be similar morphologically and in terms of carbon sphere diameter, although the 4-CP adsorption on their surfaces occurred at different rates.
The kinetic data were analyzed using the classical first-order equation (FOE) and less commonly used models: the multi-exponential (m-exp) and the fractal-like MOE/pseudo-fractal-like MOE (f-MOE/f-PMOE) equations [57]. Table 4 summarizes the values of the parameters of the theoretical equations used to optimize the adsorption data. For the 4- CP/RCF and 4-CP/RCF-1 systems, f2 and p determined by the f-MOE equation are very close to those of f-FOE, so the fractal-like MOE equation is generally reduced to the pseudo-fractal-like MOE equation (f-FOE).
Table 5 summarizes the information on the values of the relative deviation SD (c/co) for the kinetic equations used. Calculations using the m-exp and f-MOE/f-PMOE equations gave good results for most systems, while FOE worked well only for the 4-CP/RCF and 4-CP/RCF-1 systems. For 4-CP/RCF-1, there is a very good correlation between the data and the fitted lines using all the models used (SD (c)/co = 0.51−0.57), which is shown in Figure 12b.

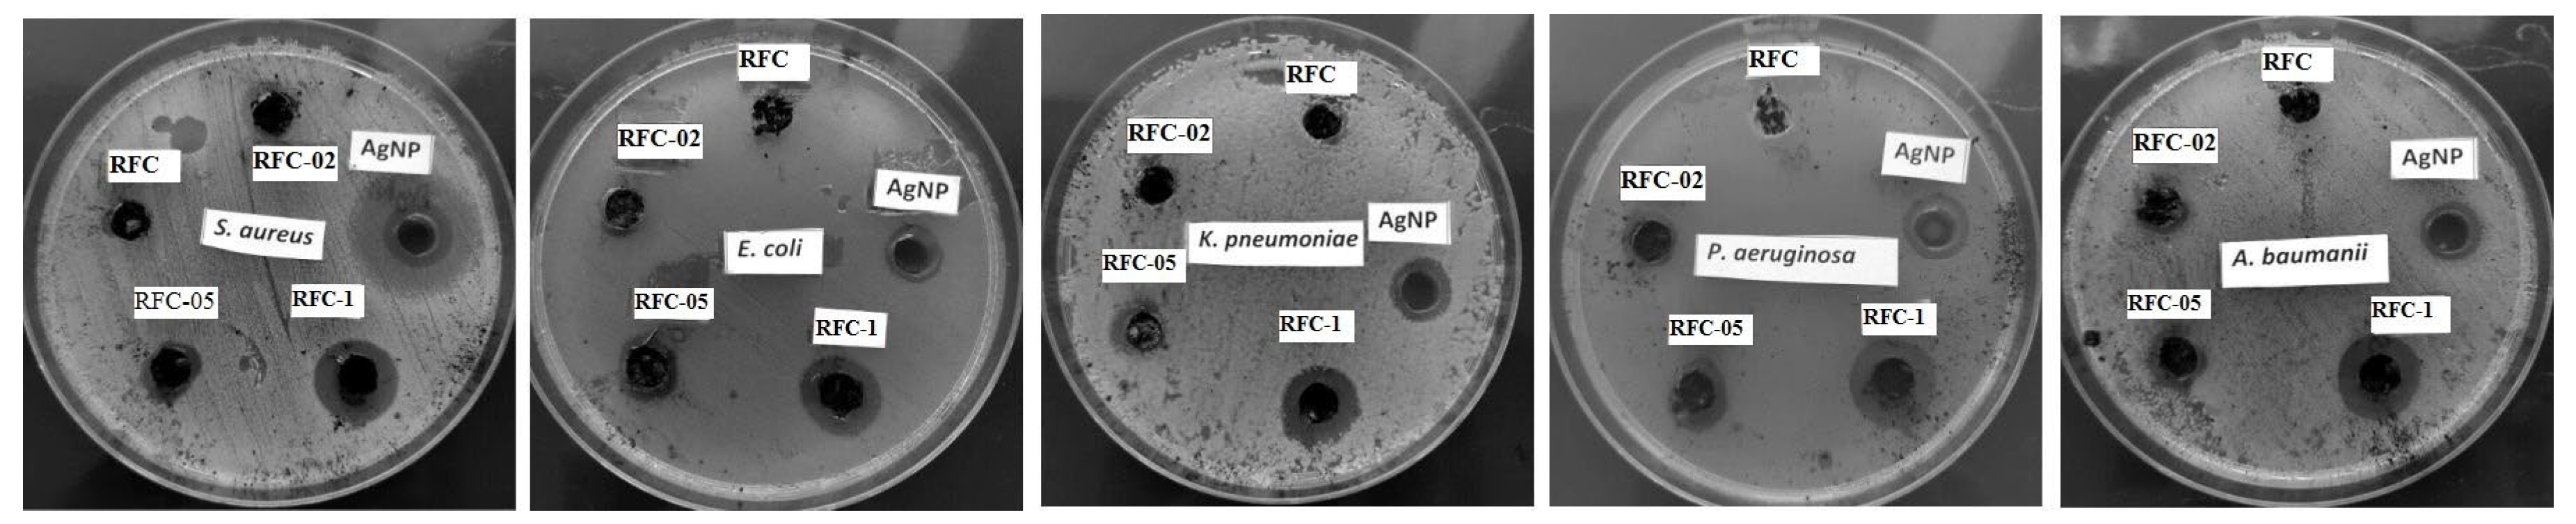
3.3. Antibacterial Activity

The antibacterial activities of the unmodified RFC and modified samples (RFC-02, RFC-05, and RFC-1, m=10 mg) and silver nanoparticle stock solution (m =2 mg) were determined against Gram-positive strain S. aureus ATCC 25923 and Gram-negative strains E. coli ATCC 25922, K. pneumoniae ATCC 700603, P. aeruginosa ATCC 27853, and A. baumannii ATCC 19606. The zones of growth inhibition (in mm) of the tested bacteria are shown in Table 6 and Figure 13. It is worth noting that determination of the sensitivity to cefepime (4th generation cephalosporin) using the disc diffusion method was done before starting experiments. The tested strains were sensitive to cefepime and, except Acinetobacter baumannii, the growth inhibition zones were: E. coli—33 mm, S. aureus—28 mm, P. aeruginosa—26 mm, K. pneumoniae—24 mm and A. baumanii—14 mm (Table 6).
The obtained results confirm the antibacterial activity of all nanocomposites against both Gram-negative and Gram-positive bacteria and the lack of activity in the case of the control RFC sample. The RFC-1 composite, with the highest silver content, showed the greatest antibacterial activity. The growth inhibition zones of all strains used had a diameter ranging from about 15–16 mm. In contrast, the sample CRF-02 with the lowest silver content showed similar activity to AgNPs (inhibition zones—10–12 mm).
Other authors reported a significant increase in growth inhibition of E. coli, P. aeruginosa, S. aureus, and A. baumannii including multidrug-resistant strains, by AgNPs activated carbon compared to unmodified activated carbon with AgNPs [58,59]. Different mechanisms of antibacterial activity against Gram-positive and Gram-negative species have been reported in the scientific literature. Different mechanisms of the lethal effect of AgNPs on different classes of bacteria have been proposed. Ag nanoparticles bear stronger antibacterial properties because AgNPs attach to cell walls and disrupt cell wall permeability and cell respiration [59]. Small-sized structures are not fixed in XRD and are particles with the most pronounced surface defects. Higher antimicrobial activity could be due to the formation of smaller forms of silver oxide with increased solubility in the culture medium used and, accordingly, higher formation of metal ions [60]. It is known that smaller particles have a larger contact surface area compared to a unit mass of larger particles. Therefore, the larger the surface area of nanoparticles, the greater the release of ions. With increasing silver content, the number of small nanoparticles of 3–10 nm distributed in the sample matrix increases; therefore, an increase in antimicrobial activity is observed in the RFC-1 sample, which is confirmed by the TEM data. It was confirmed that the RFC composite, as a control, does not cause the observed growth inhibition.

4. Conclusions

In the present work, a successful procedure for the synthesis of Ag-containing carbon sorbents was developed. The results showed that the combination of the mechanochemical synthesis of silica as a carrier of AgNPs with subsequent copolymerization of the RF polymer and the resulting pyrolysis method provided the opportunity to synthesize carbon composites with a uniform distribution of nanoparticles.
It is shown that the concentration of the silver compound as a filler in the initial polymer composites has a significant effect on the morphology of the carbonized carbon composites. Moreover, the resulting samples are characterized by a core–shell structure in which Ag nanoparticles are encapsulated in carbon.
Adsorption experiments towards the phenolic derivative 4-chlorophenol were carried out. It was found that the adsorption rate of the pollutant (4-chlorophenol) depends on the topography of the carbon composites.
Carbon-based composites containing AgNPs showed promising antibacterial activity against both Gram-positive (Staphylococcus aureus ATCC 25923) and Gram-negative strains (Escherichia coli ATCC 25922, Klebsiella pneumoniae ATCC 700603, Pseudomonas aeruginosa ATCC 27853, and Acinetobacter baumannii ATCC 19606). The growth inhibition zones were measured as follows: E. coli 33 mm, S. aureus 28 mm, P. aeruginosa 26 mm, K. pneumoniae 24 mm and A. baumanii 14 mm. The tested strains were sensitive to cefepime, except Acinetobacter. The antimicrobial activity of the materials is directly dependent on the Ag concentration in the composite. The difference in diameter of the inhibition zones is due to the large number of small nanoparticles and their uniform distribution throughout the sample volume.
Considering that filtration alone does not disinfect the water (it must be boiled or disinfected afterwards) and that filters lose their disinfecting properties over time if they are not maintained, filling the carbon composition with silver nanoparticles can prevent the proliferation of bacteria inside the filter and, thus, ensure the freshness and safety of the water during long-term storage. The proposed materials can therefore be used as carbon-based fillers in mechanical filters with antimicrobial properties for water purification and disinfection, which can inhibit the growth of bacteria, algae, mould, and yeast in the filter. In addition, they could be used not only as a stand-alone bioactive adsorbent, but also as part of polymer composites and textiles with biocidal properties [61].
The studies will be continued in order to propose another selective adsorbent with differentiated porosity that exhibits antimicrobial activity. Adsorption studies will be extended to multicomponent systems of adsorbates with different properties.
The results obtained in this study show that the pyrolysis of resorcinol–formaldehyde resin as a secondary raw material is a promising route for the production of functional carbon composites. The use of waste precursors to produce high-quality functional carbon nanomaterials therefore indicates the sustainability and economic viability of the end products.

Author Contributions

Conceptualization: M.G., M.Z.-S., M.B. and V.B.; formal analysis: M.G., M.Z.-S., M.B., J.K. and A.C.; investigation: M.G., M.Z.-S.; M.B., J.K. and A.C.; methodology: M.G., M.B., M.Z.-S. and V.B.; supervision: A.D.-M.; writing—original draft: M.G., M.Z.-S., M.B., J.K., A.C. and A.D.-M.; writing—review and editing: M.G., M.Z.-S., M.B., J.K., A.C. and A.D.-M. All authors have read and agreed to the published version of the manuscript.

Funding

This research received no external funding.

Institutional Review Board Statement

Not applicable.

Informed Consent Statement

Not applicable.

Data Availability Statement

Data are contained within the article.

Acknowledgments

This work was carried out within the framework of the National Science Centre (UMO-2022/01/3/ST4/00105) and within the framework of the implementation of the NATO project G5798 (A Novel Nanoparticle Based Real-Time Sensor for B. Anthracis and M. Tuberculosis (NanoSat)).

Conflicts of Interest

The authors declare no conflict of interest.

References

  1. Rashid, R.; Shafiq, I.; Akhter, P.; Iqbal, M.J.; Hussain, M. A State-of-the-Art Review on Wastewater Treatment Techniques: The Effectiveness of Adsorption Method. Environ. Sci. Pollut. Res. 2021, 28, 9050–9066. [Google Scholar] [CrossRef] [PubMed]
  2. Sangamnere, R.; Misra, T.; Bherwani, H.; Kapley, A.; Kumar, R. A Critical Review of Conventional and Emerging Wastewater Treatment Technologies. Sustain. Water Resour. Manag. 2023, 9, 58. [Google Scholar] [CrossRef]
  3. Pell, M.; Wörman, A. Biological Wastewater Treatment Systems. In Comprehensive Biotechnology; Elsevier: Amsterdam, The Netherlands, 2011; pp. 275–290. [Google Scholar]
  4. Lin, S.H.; Kiang, C.D. Combined Physical, Chemical and Biological Treatments of Wastewater Containing Organics from a Semiconductor Plant. J. Hazard Mater. 2003, 97, 159–171. [Google Scholar] [CrossRef] [PubMed]
  5. Dewil, R.; Mantzavinos, D.; Poulios, I.; Rodrigo, M.A. New Perspectives for Advanced Oxidation Processes. J. Environ. Manag. 2017, 195, 93–99. [Google Scholar] [CrossRef] [PubMed]
  6. Grządka, E. Adsorption and Electrokinetic Properties in the System: Beta-Cyclodextrin/Alumina in the Presence of Ionic and Non-Ionic Surfactants. Colloids Surf. A Physicochem. Eng. Asp. 2015, 481, 261–268. [Google Scholar] [CrossRef]
  7. Raninga, M.; Mudgal, A.; Patel, V.K.; Patel, J.; Kumar Sinha, M. Modification of Activated Carbon-Based Adsorbent for Removal of Industrial Dyes and Heavy Metals: A Review. Mater. Today Proc. 2023, 77, 286–294. [Google Scholar] [CrossRef]
  8. Barquilha, C.E.R.; Braga, M.C.B. Adsorption of Organic and Inorganic Pollutants onto Biochars: Challenges, Operating Conditions, and Mechanisms. Bioresour. Technol. Rep. 2021, 15, 100728. [Google Scholar] [CrossRef]
  9. Le-Minh, N.; Sivret, E.C.; Shammay, A.; Stuetz, R.M. Factors Affecting the Adsorption of Gaseous Environmental Odors by Activated Carbon: A Critical Review. Crit. Rev. Environ. Sci. Technol. 2018, 48, 341–375. [Google Scholar] [CrossRef]
  10. Foo, K.Y.; Hameed, B.H. Detoxification of Pesticide Waste via Activated Carbon Adsorption Process. J. Hazard Mater. 2010, 175, 1–11. [Google Scholar] [CrossRef] [PubMed]
  11. Tomczyk, A.; Kondracki, B.; Szewczuk-Karpisz, K. Chemical Modification of Biochars as a Method to Improve Its Surface Properties and Efficiency in Removing Xenobiotics from Aqueous Media. Chemosphere 2023, 312, 137238. [Google Scholar] [CrossRef] [PubMed]
  12. Bhatnagar, A.; Hogland, W.; Marques, M.; Sillanpää, M. An Overview of the Modification Methods of Activated Carbon for Its Water Treatment Applications. Chem. Eng. J. 2013, 219, 499–511. [Google Scholar] [CrossRef]
  13. Liu, Z.; Zhou, X.; Qian, Y. Synthetic Methodologies for Carbon Nanomaterials. Adv. Mater. 2010, 22, 1963–1966. [Google Scholar] [CrossRef]
  14. Han, Z.; Adeleye, A.S.; Keller, A.A. Engineered Nanomaterials for Water Treatment. In Encyclopedia of Nanomaterials; Elsevier: Amsterdam, The Netherlands, 2023; pp. 418–455. [Google Scholar]
  15. Zahid, M.U.; Pervaiz, E.; Hussain, A.; Shahzad, M.I.; Niazi, M.B.K. Synthesis of Carbon Nanomaterials from Different Pyrolysis Techniques: A Review. Mater. Res. Express 2018, 5, 052002. [Google Scholar] [CrossRef]
  16. Galaburda, M.V.; Bogatyrov, V.M.; Skubiszewska-ZiĿba, J.; Oranska, O.I.; Sternik, D.; Gunko, V.M. Synthesis and Structural Features of Resorcinol Formaldehyde Resin Chars Containing Nickel Nanoparticles. Appl. Surf. Sci. 2016, 360, 722–730. [Google Scholar] [CrossRef]
  17. Foong, S.Y.; Liew, R.K.; Lee, C.L.; Tan, W.P.; Peng, W.; Sonne, C.; Tsang, Y.F.; Lam, S.S. Strategic Hazard Mitigation of Waste Furniture Boards via Pyrolysis: Pyrolysis Behavior, Mechanisms, and Value-Added Products. J. Hazard Mater. 2022, 421, 126774. [Google Scholar] [CrossRef] [PubMed]
  18. Galaburda, M.; Bogatyrov, V.; Oranska, O.; Gun’ko, V.; Skubiszewska-Zięba, J.; Urubkov, I. Synthesis and Characterization of Carbon Composites Containing Fe, Co, Ni Nanoparticles. J. Therm. Anal. Calorim. 2015, 122, 553–561. [Google Scholar] [CrossRef]
  19. Monge, F.A.; Jagadesan, P.; Bondu, V.; Donabedian, P.L.; Ista, L.; Chi, E.Y.; Schanze, K.S.; Whitten, D.G.; Kell, A.M. Highly Effective Inactivation of SARS-CoV-2 by Conjugated Polymers and Oligomers. ACS Appl. Mater. Interfaces 2020, 12, 55688–55695. [Google Scholar] [CrossRef]
  20. Liu, H.; Huang, J.; Mao, J.; Chen, Z.; Chen, G.; Lai, Y. Transparent Antibacterial Nanofiber Air Filters with Highly Efficient Moisture Resistance for Sustainable Particulate Matter Capture. iScience 2019, 19, 214–223. [Google Scholar] [CrossRef]
  21. Gough, C.R.; Callaway, K.; Spencer, E.; Leisy, K.; Jiang, G.; Yang, S.; Hu, X. Biopolymer-Based Filtration Materials. ACS Omega 2021, 6, 11804–11812. [Google Scholar] [CrossRef] [PubMed]
  22. Ren, G.; Wan, K.; Kong, H.; Guo, L.; Wang, Y.; Liu, X.; Wei, G. Recent Advance in Biomass Membranes: Fabrication, Functional Regulation, and Antimicrobial Applications. Carbohydr. Polym. 2023, 305, 120537. [Google Scholar] [CrossRef]
  23. Deshmukh, S.P.; Patil, S.M.; Mullani, S.B.; Delekar, S.D. Silver Nanoparticles as an Effective Disinfectant: A Review. Mater. Sci. Eng. C 2019, 97, 954–965. [Google Scholar] [CrossRef]
  24. Malachová, K.; Praus, P.; Rybková, Z.; Kozák, O. Antibacterial and Antifungal Activities of Silver, Copper and Zinc Montmorillonites. Appl. Clay Sci. 2011, 53, 642–645. [Google Scholar] [CrossRef]
  25. Prestinaci, F.; Pezzotti, P.; Pantosti, A. Antimicrobial Resistance: A Global Multifaceted Phenomenon. Pathog. Glob. Health 2015, 109, 309–318. [Google Scholar] [CrossRef] [PubMed]
  26. Panáček, A.; Kvítek, L.; Smékalová, M.; Večeřová, R.; Kolář, M.; Röderová, M.; Dyčka, F.; Šebela, M.; Prucek, R.; Tomanec, O.; et al. Bacterial Resistance to Silver Nanoparticles and How to Overcome It. Nat. Nanotechnol. 2018, 13, 65–71. [Google Scholar] [CrossRef] [PubMed]
  27. Zienkiewicz-Strzałka, M.; Deryło-Marczewska, A.; Skorik, Y.A.; Petrova, V.A.; Choma, A.; Komaniecka, I. Silver Nanoparticles on Chitosan/Silica Nanofibers: Characterization and Antibacterial Activity. Int. J. Mol. Sci. 2019, 21, 166. [Google Scholar] [CrossRef]
  28. Prasad, R.; Karchiyappan, T. Advanced Research in Nanosciences for Water Technology; Springer International Publishing: Cham, Switzerland, 2019; ISBN 978-3-030-02380-5. [Google Scholar]
  29. Egger, S.; Lehmann, R.P.; Height, M.J.; Loessner, M.J.; Schuppler, M. Antimicrobial Properties of a Novel Silver-Silica Nanocomposite Material. Appl. Environ. Microbiol. 2009, 75, 2973–2976. [Google Scholar] [CrossRef] [PubMed]
  30. Garba, Z.N.; Zhou, W.; Lawan, I.; Xiao, W.; Zhang, M.; Wang, L.; Chen, L.; Yuan, Z. An Overview of Chlorophenols as Contaminants and Their Removal from Wastewater by Adsorption: A Review. J. Environ. Manag. 2019, 241, 59–75. [Google Scholar] [CrossRef] [PubMed]
  31. World Health Organization, International Agency for Research on Cancer. IARC Monographs on the Evaluation of Carcinogenic Risks to Humans; World Health Organization, International Agency for Research on Cancer: Lyon, France, 2014; Volume 83, Available online: https://monographs.iarc.who.int/wp-content/uploads/2018/08/14-002.pdf (accessed on 23 November 2023).
  32. Bogatyrov, V.M.; Gun’ko, V.M.; Galaburda, M.V.; Oranska, O.I.; Petryk, I.S.; Tsyganenko, K.S.; Savchuk, Y.I.; Chobotarov, A.Y.; Rudenchyk, T.V.; Rozhnova, R.A.; et al. The Effect of Photoactivated Transformations of Ag+ and Ag0 in Silica Fillers on Their Biocidal Activity. Res. Chem. Intermed. 2019, 45, 3985–4001. [Google Scholar] [CrossRef]
  33. Gun’ko, V.M. Composite Materials: Textural Characteristics. Appl. Surf. Sci. 2014, 307, 444–454. [Google Scholar] [CrossRef]
  34. Gun’ko, V.M.; Mikhalovsky, S.V. Evaluation of Slitlike Porosity of Carbon Adsorbents. Carbon N. Y. 2004, 42, 843–849. [Google Scholar] [CrossRef]
  35. Azizian, S. Kinetic Models of Sorption: A Theoretical Analysis. J. Colloid Interface Sci. 2004, 276, 47–52. [Google Scholar] [CrossRef] [PubMed]
  36. Blachnio, M.; Zienkiewicz-Strzalka, M.; Derylo-Marczewska, A.; Nosach, L.V.; Voronin, E.F. Chitosan–Silica Composites for Adsorption Application in the Treatment of Water and Wastewater from Anionic Dyes. Int. J. Mol. Sci. 2023, 24, 11818. [Google Scholar] [CrossRef] [PubMed]
  37. Haerifar, M.; Azizian, S. Fractal-Like Kinetics for Adsorption on Heterogeneous Solid Surfaces. J. Phys. Chem. C 2014, 118, 1129–1134. [Google Scholar] [CrossRef]
  38. Zienkiewicz-Strzalka, M.; Blachnio, M. Nitrogenous Bases in Relation to the Colloidal Silver Phase: Adsorption Kinetic, and Morphology Investigation. Appl. Sci. 2023, 13, 3696. [Google Scholar] [CrossRef]
  39. Rajeshkumar, S.; Malarkodi, C. In Vitro Antibacterial Activity and Mechanism of Silver Nanoparticles against Foodborne Pathogens. Bioinorg. Chem. Appl. 2014, 2014, 581890. [Google Scholar] [CrossRef]
  40. Balouiri, M.; Sadiki, M.; Ibnsouda, S.K. Methods for in Vitro Evaluating Antimicrobial Activity: A Review. J. Pharm. Anal. 2016, 6, 71–79. [Google Scholar] [CrossRef] [PubMed]
  41. Liu, J.; Qiao, S.Z.; Liu, H.; Chen, J.; Orpe, A.; Zhao, D.; Lu, G.Q.M. Extension of The Stöber Method to the Preparation of Monodisperse Resorcinol-Formaldehyde Resin Polymer and Carbon Spheres. Angew. Chem. Int. Ed. 2011, 50, 5947–5951. [Google Scholar] [CrossRef] [PubMed]
  42. Du, X.; Yang, H.; Zhang, Y.; Hu, Q.; Li, S.; He, W. Synthesis of Size-Controlled Carbon Microspheres from Resorcinol/Formaldehyde for High Electrochemical Performance. New Carbon Mater. 2021, 36, 616–624. [Google Scholar] [CrossRef]
  43. Chen, R.; Nuhfer, N.T.; Moussa, L.; Morris, H.R.; Whitmore, P.M. Silver Sulfide Nanoparticle Assembly Obtained by Reacting an Assembled Silver Nanoparticle Template with Hydrogen Sulfide Gas. Nanotechnology 2008, 19, 455604. [Google Scholar] [CrossRef]
  44. Bakardjieva, S.; Mares, J.; Koci, E.; Tolasz, J.; Fajgar, R.; Ryukhtin, V.; Klementova, M.; Michna, Š.; Bibova, H.; Holmestad, R.; et al. Effect of Multiply Twinned Ag(0) Nanoparticles on Photocatalytic Properties of TiO2 Nanosheets and TiO2 Nanostructured Thin Films. Nanomaterials 2022, 12, 750. [Google Scholar] [CrossRef]
  45. Van der Veeken, P.L.R.; Chakraborty, P.; van Leeuwen, H.P. Accumulation of Humic Acid in DET/DGT Gels. Env. Sci. Technol. 2010, 44, 4253–4257. [Google Scholar] [CrossRef] [PubMed]
  46. Perino, A.; Klymchenko, A.; Morere, A.; Contal, E.; Rameau, A.; Guenet, J.-M.; Mély, Y.; Wagner, A. Structure and Behavior of Polydiacetylene-Based Micelles. Macromol. Chem. Phys. 2011, 212, 111–117. [Google Scholar] [CrossRef]
  47. Thommes, M.; Kaneko, K.; Neimark, A.V.; Olivier, J.P.; Rodriguez-Reinoso, F.; Rouquerol, J.; Sing, K.S.W. Physisorption of Gases, with Special Reference to the Evaluation of Surface Area and Pore Size Distribution (IUPAC Technical Report). Pure Appl. Chem. 2015, 87, 1051–1069. [Google Scholar] [CrossRef]
  48. Bailey, E.; Beetsch, N.; Wait, D.; Oza, H.; Ronnie, N.; Sobsey, M. Methods, Protocols, Guidance and Standards for Performance Evaluation for Point-of-Use Water Treatment Technologies: History, Current Status, Future Needs and Directions. Water 2021, 13, 1094. [Google Scholar] [CrossRef]
  49. Nasir, A.M.; Adam, M.R.; Mohamad Kamal, S.N.E.A.; Jaafar, J.; Othman, M.H.D.; Ismail, A.F.; Aziz, F.; Yusof, N.; Bilad, M.R.; Mohamud, R.; et al. A Review of the Potential of Conventional and Advanced Membrane Technology in the Removal of Pathogens from Wastewater. Sep. Purif. Technol. 2022, 286, 120454. [Google Scholar] [CrossRef] [PubMed]
  50. Ghaffari, A.; Tehrani, M.S.; Husain, S.W.; Anbia, M.; Azar, P.A. Adsorption of Chlorophenols from Aqueous Solution over Amino-Modified Ordered Nanoporous Silica Materials. J. Nanostruct. Chem. 2014, 4, 114. [Google Scholar] [CrossRef]
  51. Deryło-Marczewska, A.; Zienkiewicz-Strzałka, M.; Skrzypczyńska, K.; Świątkowski, A.; Kuśmierek, K. Evaluation of the SBA-15 Materials Ability to Accumulation of 4-Chlorophenol on Carbon Paste Electrode. Adsorption 2016, 22, 801–812. [Google Scholar] [CrossRef]
  52. Moritz, M. Use of Modified SBA-15 and MCF Mesoporous Silicas as Adsorbents for Chlorogenic Acid. A Comparative Study. Przemysł. Chem. 2015, 1, 112–115. [Google Scholar] [CrossRef]
  53. Liu, C.; Shaw, L. Nanoparticulate Materials and Core/Shell Structures Derived from Wet Chemistry Methods. In Encyclopedia of Nanotechnology; Springer Netherlands: Dordrecht, The Netherlands, 2016; pp. 2579–2597. [Google Scholar]
  54. El-Toni, A.M.; Habila, M.A.; Labis, J.P.; ALOthman, Z.A.; Alhoshan, M.; Elzatahry, A.A.; Zhang, F. Design, Synthesis and Applications of Core–Shell, Hollow Core, and Nanorattle Multifunctional Nanostructures. Nanoscale 2016, 8, 2510–2531. [Google Scholar] [CrossRef]
  55. Okolo, B.; Park, C.; Keane, M.A. Interaction of Phenol and Chlorophenols with Activated Carbon and Synthetic Zeolites in Aqueous Media. J. Colloid Interface Sci. 2000, 226, 308–317. [Google Scholar] [CrossRef]
  56. Berro, Y.; Gueddida, S.; Lebègue, S.; Pasc, A.; Canilho, N.; Kassir, M.; Hassan, F.E.H.; Badawi, M. Atomistic Description of Phenol, CO and H2O Adsorption over Crystalline and Amorphous Silica Surfaces for Hydrodeoxygenation Applications. Appl. Surf. Sci. 2019, 494, 721–730. [Google Scholar] [CrossRef]
  57. Blachnio, M.; Derylo-Marczewska, A.; Winter, S.; Zienkiewicz-Strzalka, M. Mesoporous Carbons of Well-Organized Structure in the Removal of Dyes from Aqueous Solutions. Molecules 2021, 26, 2159. [Google Scholar] [CrossRef] [PubMed]
  58. Kohsari, I.; Mohammad-Zadeh, M.; Minaeian, S.; Rezaee, M.; Barzegari, A.; Shariatinia, Z.; Koudehi, M.F.; Mirsadeghi, S.; Pourmortazavi, S.M. In Vitro Antibacterial Property Assessment of Silver Nanoparticles Synthesized by Falcaria Vulgaris Aqueous Extract against MDR Bacteria. J. Solgel Sci. Technol. 2019, 90, 380–389. [Google Scholar] [CrossRef]
  59. Taha, A.; Ben Aissa, M.; Da’na, E. Green Synthesis of an Activated Carbon-Supported Ag and ZnO Nanocomposite for Photocatalytic Degradation and Its Antibacterial Activities. Molecules 2020, 25, 1586. [Google Scholar] [CrossRef] [PubMed]
  60. Menichetti, A.; Mavridi-Printezi, A.; Mordini, D.; Montalti, M. Effect of Size, Shape and Surface Functionalization on the Antibacterial Activity of Silver Nanoparticles. J. Funct. Biomater. 2023, 14, 244. [Google Scholar] [CrossRef]
  61. Emam, H.E.; El-Rafie, M.H.; Ahmed, H.B.; Zahran, M.K. Room Temperature Synthesis of Metallic Nanosilver Using Acacia to Impart Durable Biocidal Effect on Cotton Fabrics. Fibers Polym. 2015, 16, 1676–1687. [Google Scholar] [CrossRef]
Figure 1. Flowchart displaying the synthesis of Ag-containing carbon-based composites.
Sustainability 15 16817 g001
Figure 2. XRD patterns of nanocomposites: RFC (1), RFC-02 (2), RFC-05 (3) and RFC-1 (4) with deconvolution of diffraction peaks of Ag nanophase and calculated size of crystallites.
Sustainability 15 16817 g002
Figure 3. SEM images of composites: RFC (ac), RFC-02 (df), RFC-05 (gi), RFC-1 (jl).
Sustainability 15 16817 g003
Figure 4. TEM images of (a) RCF-02, (b) RCF-05, (c) RCF-01 composites with EDX mapping analysis, (d) Ag NPs distribution in the carbon phase in RFC-1 sample, (e) single-crystal nanoparticle of cubic Ag, and (f) fivefold twinned Ag0 NP.
Sustainability 15 16817 g004
Figure 5. Experimental SAXS curves of investigated materials. The SAXS intensity versus momentum transfer q (length of the scattering vector) is plotted on log-linear (a) and log-log (b) scales.
Sustainability 15 16817 g005
Figure 6. Particle size distribution by volume analysis for the RFC (a), RFC-02 (b), RFC-05 (c), and RFC-1 (d) samples with corresponding fit curves of Dv(R) calculations (solid lines) for the experimental data (points).
Sustainability 15 16817 g006
Figure 7. Particle size distribution by volume analysis for the investigated samples and corresponding fit curves of Dv(R) calculations (solid lines) for the experimental data (points) in linear (a) and logarithmic (b) scale.
Sustainability 15 16817 g007
Figure 8. The PDDF functions with corresponding fitting analysis (as insets) for the RFC (a), RFC-02 (b), RFC-05 (c), and RFC-1 (d) samples. Calculations were performed for monodispersing globular and rod-type particles.
Sustainability 15 16817 g008
Figure 9. Porod plots were calculated for the investigated systems (slit-collimation) as well as the summary system with designated Porod constants and ranges of suitable Porod law.
Sustainability 15 16817 g009
Figure 10. Nitrogen adsorption/desorption isotherms (a) and pore size distribution (b) of the nanocomposites: RFC (1), RFC-02 (2), RFC-05 (3), and RFC-1 (4).
Sustainability 15 16817 g010
Figure 11. Example of a series of UV absorption spectra used for adsorption kinetics analysis (4CP/RFC-1 system) (a), and comparison of adsorption kinetics for 4-CP on carbon nanocomposites at coordinates: concentration—time (b), concentration—square root of time (c), and adsorption—time (d). The lines correspond to the fitted m-exponential equation.
Sustainability 15 16817 g011
Figure 12. Distribution of rate coefficient ki, for adsorption of 4-CP on RFC-05 (a). Comparison of fitting quality by using the FOE, m-exponential, f-FOE, and f-MOE equations for the adsorption kinetic data for 4-CP on carbon nanocomposite RFC-1 (b).
Sustainability 15 16817 g012
Figure 13. Bacterial growth inhibition of: S. aureus ATCC 25923, E. coli ATCC 25922, K. pneumoniae ATCC 700603, P. aeruginosa ATCC 27853, and A. baumannii ATCC 19606 by AgNPs, unmodified RFC and modified samples (RFC-02, RFC-05 and RFC-1).
Sustainability 15 16817 g013
Table 1. Kinetic equations used to optimize the adsorption data.
Kinetic ModelGeneral EquationHalf-Time Expression
First-order equation
(FOE) [35]
d c d t = k 1 c c e q t0.5~1/k1
Multi-exponential equation
(m-exp) [36]
c = c o c e q i = 1 n f i e x p k i t + c e q t0.5~(ln 2)/ki
Fractal-like MOE equation
(f-MOE) [37,38]
Fractal-like FOE equation
(f-FOE) [37,38]
F = 1 e x p k 1 t p 1 f 2 e x p k 1 t p
F = 1 e x p k 1 t p
t0.5~[ln(2 − f2)]1/p/k1
t0.5~[(ln2)]1/p/k1
where: ceq is the equilibrium concentration, co is the initial concentration, c—temporary concentration, k—kinetic rate coefficient, t—time, F—adsorption progress, p—fractal parameter.
Table 2. Structural parameters of the investigated systems by SAXS.
SampleDv(R)a (nm)PDDF b (nm)Dmax
(PDDF) c (nm)
Rgd (nm)
PDDF e
RFC5.24896 (50)37/17 f
RFC-021.82052 (60)19/21.3 f
RFC-051.9315723
RFC-11.7/4.0264619
a The volume-weighted particle size distribution Dv(R) as the maximum value of the function. b Pair distance distribution function PDDF as the maximum value of the function for globular/rod type particles. c Maximum dimension Dmax means also R-value (distance) at which PDDF goes to 0. This parameter is defined as the diameter across the longest dimension of the particles and is zero for r > Dmax. The maximum dimension of the particle cross-section is also shown in brackets. d Radius of gyration as the mean square distance from the center of their distribution. Rg provides a measure of the overall size of the scatt objects. e Radius of gyration determined from P(r) function is proportional to the normalized second moment of P(r) from the whole scattering curve. f Rc as the radius of the cross-section for monodisperse rod-type scattering objects.
Table 3. Structural characteristics of tested samples.
SampleSBET
(m2/g)
Smicro (m2/g)Smeso
(m2/g)
Vp
(cm3/g)
Vmicro
(cm3/g)
Vmeso
(cm3/g)
Vmacro
(cm3/g)
Vmicro/VpVmeso/VpRaverage
RFC529507210.2260.2170.009-0.9580.0420.7
RFC-02450392560.3780.1720.1880.0180.4560.4966.5
RFC-05481434460.3120.1870.1180.0070.6010.3775.4
RFC-1466421440.3090.1830.1180.0080.5930.3824
Table 4. Comparison of the parameters of kinetic equations applied in the data analysis.
Adsorbentfitf2plog k *t0.5 (min)ueq1-R2
RFCFOE0--−2.421830.9953.17·10−4
m-exp----−2.421810.9951.78·10−4
f-FOE01.05−2.421870.9822.16·10−4
f-MOE−0.131.02−2.391870.9822.14·10−4
RFC-02FOE0--−2.632940.9871.48·10−3
m-exp----−2.622890.9933.68·10−4
f-FOE00.89−2.642880.9774.94·10−4
f-MOE0.441.01−2.812910.9823.92·10−4
RFC-05FOE0--−2.844800.9651.23·10−2
m-exp----−2.834701.0003.70·10−4
f-FOE00.66−2.934871.0001.54·10−3
f-MOE0.390.74−3.124891.0001.43·10−3
RFC-1FOE0--−2.06800.9942.37·10−4
m-exp----−2.07810.9941.83·10−4
f-FOE01−2.06810.9802.31·10−4
f-MOE−0.021.01−2.06810.9802.30·10−4
k *: k1-FOE, f-FOE and f-MOE; kavg-m-exp.
Table 5. Comparison of the relative deviation SD (c/co) values for kinetic equations applied in the data analysis.
AdsorbentFOE (%)m-exp (%)f-FOE (%)f-MOE (%)
RFC0.710.540.590.59
RFC-021.400.720.820.74
RFC-053.630.651.301.26
RFC-10.570.510.560.57
Table 6. The diameters of growth inhibition zones. Standard deviation (SD) ranging from ±0.1 and ±0.86 (n = 3).
Bacterial StrainInhibition Zone (mm)
RFCRFC-02RFC-05RFC-1AgNPsCefepime
Staphylococcus aureus ATCC 2592301213151228
Escherichia coli ATCC 2592201012151033
Klebsiella pneumoniae ATCC 70060301012151124
Pseudomonas aeruginosa ATCC 2785301113161226
Acinetobacter baumannii ATCC 196060111215110
Disclaimer/Publisher’s Note: The statements, opinions and data contained in all publications are solely those of the individual author(s) and contributor(s) and not of MDPI and/or the editor(s). MDPI and/or the editor(s) disclaim responsibility for any injury to people or property resulting from any ideas, methods, instructions or products referred to in the content.

