Abstract
Pinus pinaster, commonly called the maritime pine, is a vital species in Mediterranean forests. Its ability to thrive in the local climate and rapid growth make it an essential resource for wood production and reforestation efforts. Accurately estimating the volume of wood within a pine forest is of great significance to the wood industry. The traditional process is either a rough estimation without measurements or a time-consuming process based on manual measurements and calculations. This article presents a method for determining a tree’s diameter, total height, and volume based on a photograph. The method involves placing reference targets of known dimensions on the trees. A deep learning neural network is used to extract the tree trunk and the targets from the background, and the dimensions of the trunk are estimated based on the dimensions of the targets. The results indicate less than 10% estimation errors for diameter, height, and volume in general. The proposed methodology automates the estimation of the dendrometric characteristics of trees, reducing field time consumed in a forest inventory and without the need to use nonprofessional instruments.
1. Introduction
Pinus pinaster is an important species of pine tree, and there has been some research to facilitate the process of inventorying a forest.
1.1. Forest Inventory
The development and use of new technologies in forest management are increasing. This is especially true in the case of a forest inventory, where accurate data and results are crucial for defining policies and plans for managing forest resources and for timber supply to forest industries. Forest inventories are no longer limited to measuring the amount of timber extracted from forests. Nowadays, they are also used to assess the health of forests, forest carbon pools and carbon sequestration, and biodiversity. However, according to Fan et al. [1], stand volume assessment remains one of the main objectives of a forest inventory today. The inventory is carried out at different spatial scales with different methodological and technological approaches and by different stakeholders. Remote sensing, photogrammetry, and 3D scanning allow for an accurate forestry attribute acquisition at national and regional levels [2,3]. In smaller enterprises, where implementing new terrestrial technologies could be a viable option, the accessibility of such technology is hindered by the high acquisition costs [4]. Additionally, small forest owners lack the technical expertise to use this technology, limiting their access to it. Nevertheless, these new technologies rely on calibration from ground-based forest inventory surveys. Conducting forest inventories on the ground can be a costly and time-consuming process. It requires extensive fieldwork and expensive instruments to collect and validate data.
Traditional methods for estimating tree volume, including destructive and nondestructive techniques, can be time-consuming and expensive. An alternative approach to help reduce the time-consuming task of collecting data in the field or verifying it at a lower cost, without requiring much technological expertise, is to process photographic images. This approach has been demonstrated in several studies [5,6,7] and can be used for forest inventories regardless of the method used to obtain the data. A methodological approach is therefore needed to allow any user to obtain data on a tree’s diameter, height, and volume quickly and using inexpensive technology. Currently, in forest inventories, the diameter and height of trees are measured in the field, and another postprocessing task is required to calculate the volume.
1.2. Maritime Pine (Pinus pinaster)
The maritime pine species is naturally distributed in the Mediterranean basin and occupies a significant area in southern Europe, namely in France, Spain and Portugal [8,9,10]. Forests in Portugal cover about 36% of the country’s total land area. Maritime pine is the second most represented species in terms of wood production, occupying 22% of the country’s forested area [9]. In 2022, the maritime pine value chain accounted for approximately 54% of the gross value added (GVA) of the forestry sector in Portugal and provided around 58,223 jobs, mostly in rural areas. The pine industry consists of over 8373 small- and medium-sized enterprises (Centro PINUS) [11], and it is one of the most diversified forest industries, producing pellets, resins, panels, paper and packaging, sawn timber, and furniture. The sawmill, which consumes about 46% of the wood used by the industry, utilises the most valuable wood material—the first six metres of the tree trunk from the ground Gonçalves et al. [12].
According to the latest national forest inventory, the area occupied with pine forests and its standing volume has decreased (ICNF) [9]. This decline is partly due to induced disturbances such as forest fires, pest outbreaks, and extreme weather events [13,14,15]. These disturbances also originated stand structures that exhibit a more significant heterogeneity, featuring diverse tree sizes and diameter distributions [14,16] that are more difficult to measure and less well represented by conventional stand averages used in conventional silviculture [17,18]. However, the vulnerability of the timber supply chain in the pine industry is also due to socioeconomic factors. Maritime pine forests are owned by small private forest owners for whom the forest is not their primary source of income [19]. Their management approach significantly differs from industrial forest management. Factors such as lack of investment capacity, technical training, professional management, and innovation, among others, are well-identified factors responsible for a lower productivity and less resilience to disturbance agents of forest stands [16,20,21].
Forest owners, especially those without formal forestry education, are often unable to estimate the volume of their timber reserves. This can lead to difficulties negotiating fair prices with loggers, resulting in reduced profits for landowners and ultimately land abandonment. As the economy shifts towards decarbonisation, the demand for forest products is predicted to increase. Concurrently, society will require more ecological benefits from forest regions. Therefore, it is of utmost importance to enhance production efficiency while ensuring forest ecosystem sustainability.
1.3. Object Detection and Segmentation
Using deep learning techniques, object detection is widely used in various areas of technology, healthcare, and industry, among others. It is a technique that allows the identification of objects in an image and their location within the image. Semantic segmentation is a technique that achieves pixel-level classification, assigning each pixel to a category. Object instance segmentation is a recent technique that reconciles object detection with instance segmentation. That is, it identifies and segments the different types of objects present in each image.
The present work uses the latest instance segmentation methods to identify and delimit a tree trunk in an image to calculate the volume of the tree. Figure 1 shows examples of object detection and segmentation. The first image only represents the detection of objects; in this case, chessboard patterns are detected and framed. The second image shows instance segmentation, where tree trunks are detected and properly marked out of the background.
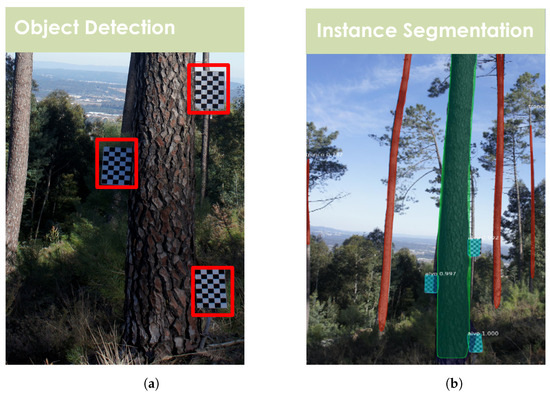
Figure 1.
Example of the difference between object detection and instance segmentation. (a) Object detection and (b) instance segmentation.
1.4. Literature Review
A literature review was performed, covering the use of artificial intelligence techniques for biometric calculations.
1.4.1. Artificial Intelligence and Tree Biometric Calculations
Diamantopoulou et al. [22] discussed the use of artificial neural network (ANN) models to accurately estimate the bark volume of standing pine (Pinus Brutia) trees. Actual bark volume data from pine trees were collected for the input dataset. The most relevant inputs that could influence the bark volume estimates were selected. To validate the results, the values predicted by the models were compared to the actual measured values. They concluded that the neural networks could estimate the volume of the pine bark with high accuracy, namely with errors of about 6%.
Ramazan et al. [23] conducted a study where the trunk volumes of 89 Scots pine (Pinus sylvestris L.), 96 Brutia pine (Pinus brutia Ten.), 107 Scots fir (Abies cilicica Carr.), and 67 Lebanon cedar (Cedrus libani A. Rich.) were estimated using recurrent neural network (RNA) models. In the different tests carried out, with four different models, the ANNs showed accurate results and a low mean percentage error. Results were compared using precision metrics such as the root-mean-square error (RMSE). ANN models require less complex measurements compared to other methods. That study suggested that ANN models, especially cascade correlation models, could be promising to accurately and efficiently estimate the volume of trees of different species.
Juyal et al. [24] developed a method for calculating treetop volume using Mask-RCNN. The diameter detection model was trained using the Mask-RCNN to segment the images and identify the X coordinates of tree boundaries and references. Based on these coordinates, calculations were made to determine the diameter of the trees. Likewise, the height detection model was trained using the Mask-RCNN to identify the Y coordinates of tree boundaries and references. Based on these coordinates, calculations were made to determine the height of the trees. After training, the models were validated and tested on a separate set of images to assess their performance. The mean average precision (mAP) was calculated to measure the overall accuracy of the model in terms of classifying and locating objects. The authors obtained values of the mAP for diameter detection of 0.92, while the mAP for height detection was 0.86.
Zhao et al. [25] reported the successful development and application of a Mask-RCNN model for automatically detecting tree crown and height simultaneously in a Chinese fir plantation. A dataset of pomegranate trees was created by flying a commercially available camera at an altitude of 30 metres, around noon, throughout the growing season, spanning from April to October 2017. Two convolutional-network-based methods, namely U-Net and Mask R-CNN, were trained and tested using that dataset. Their performance values were then compared against the same dataset’s aerial images of pomegranate trees. The results highlighted the accuracy and potential of that approach for remote sensing applications in forest inventory and management.
Coelho et al. [6] also proposed a method to estimate Corsican pine wood volume. They proposed methods to automatically calculate the diameter, height, and wood volume of a tree, based on a photograph with a partial or complete view of the tree and a specially designed target behind the tree. They used computer vision methods to separate the tree from the background, thus obtaining the tree’s diameter. Using that value and a hypsometric relationship, they calculated its height, which then allowed them to calculate the tree’s volume.
Guimarães et al. [7] also used a Mask-RCNN model to estimate the production of cork that would be obtained from cork oak trees. Detecting and segmenting the trunk, as well as three specially placed targets of known dimensions, the extracted mask was used to calculate the cork area in the tree. Then, using additional biometric data, the volume of cork expected to be produced was determined.
1.4.2. Mask-RCNN Model
Mask R-CNN is an extension of the deep neural network architecture Faster R-CNN model. As an image pixel specification is required for image segmentation, it was necessary to make adjustments to the Faster R-CNN architecture, since it was found that the regions of the feature map resulting from the region of interest (ROI) pooling layer presented slight deviations from the regions of the original image. Thus, the concept of ROI alignment was introduced in Mask-RCNN [7], as depicted in Figure 2. This ROI alignment is a standard operation for extracting a small feature map from each ROI.
Mask-RCNN is simple to train and adds only a small overhead to Faster RCNN [26]. It is capable of performing object detection and instance segmentation in near real time. Instance segmentation is the technique where single objects are detected in an image and classified into a certain class. It is also known as pixel-level targeting [27].
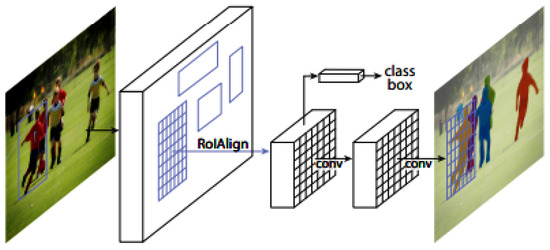
Figure 2.
Diagram of the use of the Mask R-CNN framework for image instance segmentation [27].
The Faster R-CNN architecture is divided into two steps. The first phase consists of two networks: a backbone (ResNet, VGG, Inception, etc.) and region proposal network. These networks are run once per image to provide a proposed set of regions. Region proposals are regions in the resource map that contain the desired objects. In the second stage, the network predicts bounding boxes and the object class for each of the proposed regions obtained in stage 1. Each proposed region can have different sizes, while fully connected layers in networks always require a fixed-size vector to make predictions [28]. The image segmentation problem consists of classifying each pixel in the image. The model assigns each pixel of the image to a class, generating the respective masks.
The present work uses the Mask-RCNN model, a complex variant of a convolutional neural network that can perform these object detection and instance segmentation tasks, so that pine trees and targets can be detected in images and their contours can be defined and separated from the background. The goal is to estimate the diameter at breast height (DBH), the height, and the volume of the pine tree from just a picture. The method proposed can be integrated into a framework which is inexpensive and easy to use, since the only tools required are chessboards of known dimensions and a cell phone. The chessboards can be printed using a regular home printer. The cell phone needs a camera and some processing power, which all modern smartphones contain. Therefore, the project seeks not only to facilitate the tasks of forest inventory for large land owners but also to empower small forest owners, thus contributing to sustainable forest management practices and ultimately mitigate the issue of abandonment in forestry. Additionally, the proposed methodology is envisioned to play a crucial role in advancing the updating of inventory and data collection methodologies at the tree level. These improvements are essential for addressing the increasingly irregular structures of pine stands, thereby ensuring more consistent and adequate management strategies. This proposal also contributes to digitising the maritime pine value chain and assisting in solving issues well identified, related to the collection and transmission of information among several stakeholders.
2. Research Methodology
The first part of the research consisted in studying and choosing the best deep learning model. The choice was Mask-RCNN, as explained in Section 1.4. At the same time, a dataset of images of different trees in different plots was also created.
Afterwards, the network was then trained by placing the mask over the trunk at the maximum possible height. This approach allowed for precisely determining diameters and then estimating stem volume up to that height. Various equations were tested to evaluate the tree’s remaining height and its corresponding volume, until the one that provided the most consistent results was found.
2.1. Dataset and Environmental Conditions
The dataset was obtained from measurements and photographs taken of Pinus pinaster trees belonging to the Serra da Lousã forest, a property managed by the Portuguese forestry services. This dataset included young and mature trees selected from different areas within this forest. These trees were used for the training phase and also for testing and validating the methodology.
The measurements taken on the trees were total height and tree diameters. Both destructive and nondestructive methods were used. Standing trees that could not be felled were measured at the following heights: at the base of the tree, at 1.30 m, and from 3 m onwards in multiples of 3 m, using the Bitterlich relascope. Trees that were harvested were measured after they were felled, using a vertex (IV) to measure the height (length) of the tree and a diametric tape to measure the diameters at different heights, also in multiples of 3 m.
Since environmental conditions can vary, creating a dataset representative of most of the changes observed in a real scenario is essential. Properties such as lighting, distance to the tree, and camera angle contribute to the model’s accuracy; the photographic camera’s characteristics are shown in Table 1.

Table 1.
Training dataset and Camera Information.
When creating the dataset, several measurements were taken to maximise the model’s tolerance to the environmental conditions. Different trees were photographed at other times of the day to increase the diversity of lighting conditions in the dataset. The photographs were taken from 5, 10, and 20 m away, depending on the tree’s height. Initially, 137 images were used to begin the training phase. Still, it was quickly observed that there were several characteristics of the images that produced poor results in that phase, namely the distance at which the tree was photographed, the inclination of the targets, the overlapping of trees behind the photographed tree that was confused with the tree under analysis, and the amount of light. These problems imposed a very rigorous selection of images in that training phase, which led to working with a total of 48 images that had the necessary characteristics to carry out this first work. Figure 3 shows examples of images of the same pine tree from the dataset but in different positions and lighting conditions.
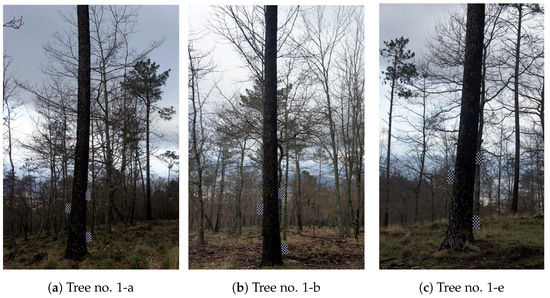
Figure 3.
Examples of images taken of the same tree: 1-a—longest distance; 1-b—shortest distance and taken in front of the tree; 1-e—with an inclination towards the tree and the targets.
Trees with IDs from 1 to 10 were used in the training of the mask, with a total of 48 images. The data from the dataset file that was created contained 451 trunk masks and 144 target masks in those same 48 images. All images were manually annotated using MakeSense.AI (https://www.makesense.ai/, (accessed on 24 October 2023)) as shown in Figure 4. After all the images were annotated, the annotations were exported in the COCO JSON format. This is the format that the Mask-RCNN network accepts as input to run the training and test processes.
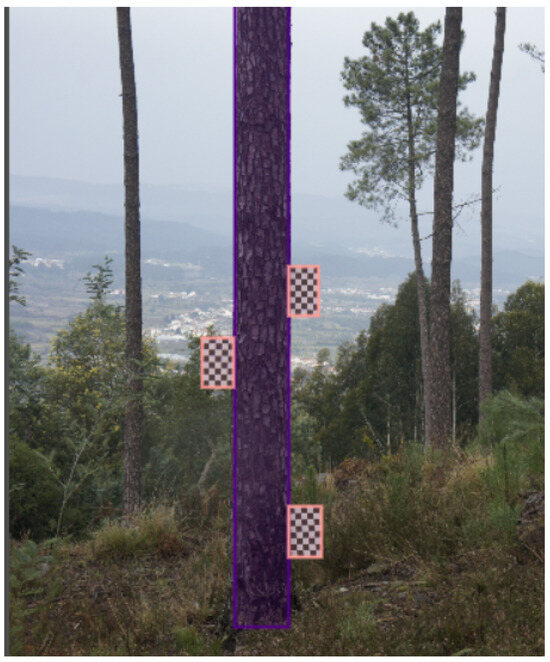
Figure 4.
Example of image where the labels “Trunk” and “Target” are marked.
As for the test set, 20 additional pictures were taken.
2.2. Targets
The design of the targets followed a checkerboard-like pattern typically used in computer vision algorithms, as shown in Figure 5. Each target had the dimensions of 29.6 cm × 18.2 cm. The model was trained with a dataset containing images of maritime pine trees with three targets placed on the trunk. The targets were used as reference scales to calculate the trees’ dimensions.
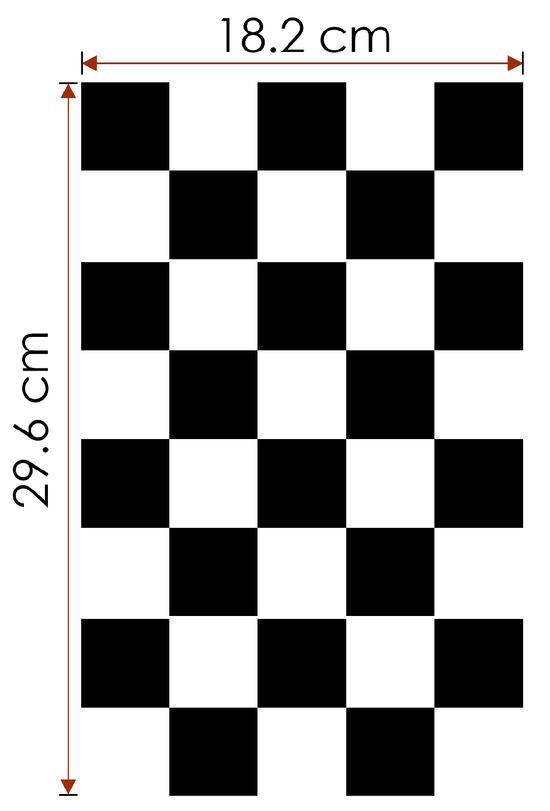
Figure 5.
Layout of the target used for scale in the images.
The number of targets used contributed significantly to the accuracy of the model’s predictions. Using less than the recommended number of targets, the algorithm would have had less information related to the targets, resulting in a possibly lower accuracy or at least, less confidence in the results. Although other patterns could be used for the present project, this pattern was chosen because it was unlikely to be found in the forest. Therefore, it was easy to recognise with a negligible probability of confusion. The contrast between black and white squares also facilitated recognition under different lighting conditions.
The targets were strategically placed at different heights, so the network could make the necessary calculations to estimate the desired values. They were placed on the tree trunk at heights of 0.30 m, 1.30 m, and 2.0 m. It was found that at 20 m from the tree, the targets lacked adequate image definition, so that distance was assumed as a potential boundary to the application of the method with the camera used.
2.3. Training
Data relevant to the training process of the Mask-RCNN model are presented in Table 2 and Table 3. Table 2 describes the virtual environment created for training and execution of the network, as well as the specifications of some hardware used to train the mask. Table 3 shows the most critical parameters of the Mask-RCNN model configuration during the training process. According to the Mask R-CNN documentation, some of these parameters/hyperparameters are defined:
- IMAGES_PER_GPU: used to define how many images are trained at once per GPU;
- STEPS_PER_EPOCH: defines the number of steps in each training epoch;
- VALIDATION_STEPS: defines the number of validations performed at the end of each training period;
- TRAIN_ROIS_PER_IMAGE: maximum number of regions of interest to be considered in the final layers of the neural network;
- BACKBONE: Conv Net architecture that will be used in the first stage of Mask R-CNN;
- RPN_ANCHOR_SCALES: proportions of anchors in each cell;
- RPN_NMS_THRESHOLD: nonmaximum suppression is applied to remove boxes that have an overlap greater than the threshold (0.7);
- RPN_TRAIN_ANCHORS_PER_IMAGE: used to balance training if there are few objects in an image;
- IMAGE_MIN_DIM and IMAGE_MAX_DIM: the image size is controlled by these settings.

Table 2.
Training environment.
Table 2.
Training environment.
| Parameter | Value |
|---|---|
| Operational system | Ubuntu 22.04.2 LTS (codename: Jammy) |
| Kernel | Linux 5.15.0-53-generic |
| CPU | Intel(R) Xeon(R) CPU E5-2630 v3 @ 2.40GHz |
| CPU architecture | x86_64 |
| CPU cores | 4 |
| Cpu frequency | 2399.998 MHz |
| Total memory | 7.8 GiB |
| Network cards | ens160 |
| Used memory | 537 MiB |
| Free memory | 1.4 GiB |
| Swap total | 4.0 GiB |
| Swap used | 49 MiB |
| Swap free | 4.0 GiB |
| Python version | 3.7.11 |
| Keras version | 2.3.1 |
| TensorFlow version | 1.15.5 |

Table 3.
Parameter values for the model.
Table 3.
Parameter values for the model.
| Parameter | Value |
|---|---|
| GPU_COUNT | 1 |
| IMAGES_PER_GPU | 2 |
| STEPS_PER_EPOCH | 1000 |
| VALIDATION_STEPS | 50 |
| BACKBONE | “resnet101” |
| NUM_CLASSES | 1 |
| TRAIN_ROIS_PER_IMAGE | 200 |
| RPN_ANCHOR_SCALES | (32, 64, 128, 256, 512) |
| RPN_NMS_THRESHOLD | 0.7 |
| RPN_TRAIN_ANCHORS_PER_IMAGE | 256 |
| IMAGE_MIN_DIM | 800 |
| IMAGE_MAX_DIM | 1024 |
2.4. Data Analysis
The error in estimating the tree’s diameter, height, and volume was calculated. This error is the difference between the values of these variables measured in the field and the respective estimate using our Mask-RCNN model, defined as follows:
where is any of the variables mentioned above. The errors were analysed in terms of mean, standard deviation, RMSE, and relative bias (%). A nonparametric paired t-test (Wilcoxon signed-rank test) was used to compare the means of dbh, height, and volume measured and estimated (using Mask-RCNN), as the assumption (normal distribution) was not met (Shapiro–Wilk test).
3. Results and Discussion
A Kolmogorov–Smirnov test revealed that the DBH, height, and volume measured were not normally distributed (Kolmogorov–Smirnov test, DBH—(D)= 0.123, p = 0.012; height—(D) = 0.209, p < 0.001; volume—(D) = 0.108, p = 0.040). On the other hand, Wilcoxon tests revealed that there were no significant differences between measured and estimated DBH (Z = −1.564, p = 0.118), between measured and estimated heights (Z = −0.464, p = 0.643), and measured and estimated volumes (Z = −0.430, p = 0.667). This means that the estimated values for DBH, tree height, and volume were close to those measured in the field, i.e., on average, the errors between the observed values and the estimated values for these variables did not differ statistically.
3.1. Results of Detection
The quality of the masks generated by the model showed that the accuracy was very high. Two variables are needed to measure the accuracy of masks correctly. One is the percentage of the tree that is covered by the mask. Using only this metric, however, any mask that fills the entire image will have an accuracy close to 100%. Therefore, a second variable is needed to limit this problem. A simple way to do this is to check the percentage of the mask outside the tree. This pair of variables gives enough information to understand the model’s accuracy.
Figure 6 shows some masks detected by the Mask-RCNN model on test images. The blue regions represent the model predictions, i.e., the image regions where the model found a trunk. The targets are marked with a white mask.
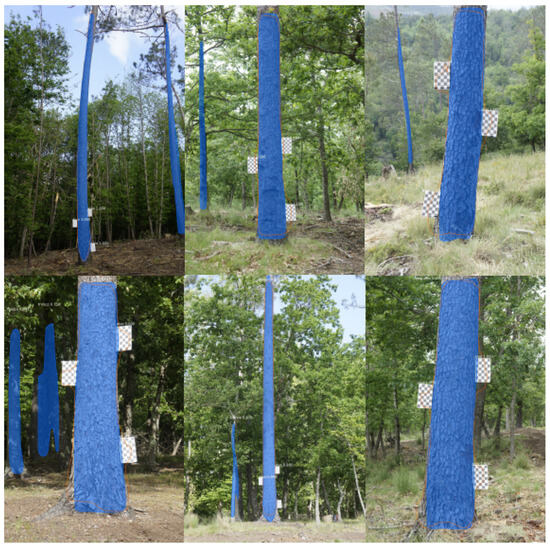
Figure 6.
Some of the outputs generated by the model using the test set.
Table 4 shows examples obtained by evaluating the model on six trees from the test set. The coverage variable represents the percentage of the tree covered by the mask, while the outer mask variable represents the percentage of the mask outside the tree. The table also shows the coverage percentage for each of the targets.

Table 4.
Tree and targets masks results, obtained by evaluating the model on images of the test set. The table shows the percentage of the mask that intersects the tree trunk or the targets. Outer mask is the percentage of the mask that is outside the tree trunk.
3.2. Tree Diameter Estimation
The measurements of the masks detected by the Mask-RCNN were used to estimate the tree biometric data. The first parameter to evaluate was the trunk diameter. As shown in Table 5, the average error to calculate this variable was approximately 4%. Rarely, the diameter of the tree trunk was incorrectly estimated, and this happened when the image had limitations, such as the distance or angle at which the photograph was taken or when the amount of light was insufficient.

Table 5.
Statistical characteristics of DBH, height, and volume estimates based on the proposed methodological approach for 60 images.
Using image processing methods, Wang et al. [29] found a relative error lower than 5.5% in diameter estimation. Marzulli et al. [30], using a photogrammetric point-cloud method, observed that the RMSE in diameter estimation ranged from 1.6 cm to 4.6 cm. That value represented a maximum percentage of 16.09%. In the present study, the mean error was 1.7 cm, and the relative error was 4.0%. These are very good results for diameter estimation using the proposed model based on the Mask-RCNN neural network.
3.3. Tree Height Estimation
Depending on the size of the tree, the mask could cover the trunk at a larger or smaller height. From the point at which the mask arrived, the remainder of the tree was estimated. To minimize errors in determining the remaining height of the tree, this estimate was made using a model. Therefore, we used a second Pinus pinaster dataset, also measured in the Serra da Lousã forest. This dataset consisted of 104 trees. The total heights and diameters were measured using the procedure explained in Section 3.1: standing trees (nondestructive method) or harvested trees (destructive method).
The three different formulas were examined to estimate the remaining height of the tree from the last diameter recorded by the mask. Among them, the best model for predicting the height above the trunk as far as the mask reached () was as follows.
with and , , and . This approach is known as a hypsometric relation in forest engineering [6].
Several authors have pointed out that the greater the height of the trees or the inclination of the ground, the greater the error in measuring the total height of the trees [31]. Hunter et al. [32] estimate that the error in calculating the full height of trees can vary from 3 to 20%, and Frank et al. [33] states that the error in measuring the height of adult trees can be up to approximately 8 m. Therefore, the error in this study found by applying the Mask-RCNN model to estimate total height was within this range or even lower, as shown in Table 5, with the advantage that it is not required to buy expensive equipment or spend so much time measuring the trees, in addition to the fact that our height estimation procedure allows one to photograph all the trees in a forest inventory plot. That is not the case with traditional methods in which only a subsample of trees is measured [34].
3.4. Tree Volume Estimation
After measuring the trees in the field, both nondestructive and destructive methods were used to calculate their volume. Then, applying our method, it was necessary to figure out whether within the formula (Equations (3) and (4)), we should use the height (mask_height), a height segmented by the mask, or whether we should set that height to 6 metres. The differences were minimal and so it was decided to use (mask_height). It was necessary to add the volumes of two parts to calculate the total volume of the stem (Equation (5)). The first was the volume of the part segmented by the mask and represented in Equation (3). The second Volume was calculated using the estimated value of the remainder height of the tree and was represented in Equation (4).
Özcelik et al. [23] found that when estimating tree volume using artificial neural network models, the relative error ranged from 4.38 to 14.41%. Using a photogrammetric point cloud method, Marzulli et al. [30] observed that the error in tree volume estimation ranged from 0.095 to 0.186 , this value representing a maximum percentage of 38%. In the present study, the mean error was 0.140 , and the relative error was 9.8%, which are again promising results for volume estimation using the proposed model based on the Mask-RCNN neural network.
Table 5 presents the results obtained with these formulas. To test and validate the procedure for volume estimation, 60 images from 15 trees were used. As already mentioned, all this material was recorded in stands currently managed by a forest management plan. The good results were only possible due to the mask’s efficiency. Overall, the error rate for DBH was 1.7 cm, 2.7 metres for the height, and 0.14 for the volume; this represented an estimation error of 4.0%, 10.7%, and 9.8% for these variables, respectively. A percentage of the trees covered by the mask had an accuracy close to 100%. After measuring the mask accuracy of the trees, we also needed to confirm the accuracy of the target masks generated by the model, and we also found a percentage close to 100%.
In addition to the results obtained in this study, it should be noted that taking photographs of trees and estimating the dendrometric characteristics of a tree takes no more than a minute or a minute and a half. Hennoten and Kangas [35] estimate that the time to take tree measurements using classic inventory methods can be between 4.5 and 5 min per tree, depending on its height.
3.5. Limitations of the Model
The photo quality has a decisive influence on obtaining the best results using our Mask-RCNN model. Photographs with a poor sharpness and contrast obtain higher errors, such as in Figure 7. On the left side, we see a photograph with a much larger error than the photograph on the right side, both of which correspond to the same tree.
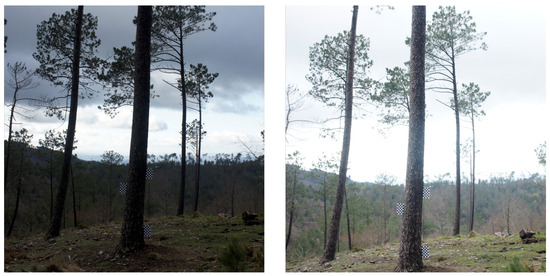
Figure 7.
Photographs of tree #4. On the left side is a photograph with poor results. On the right side, a photo shows good results.
Photographs should also avoid having too many logs or debris around so as not to cause “noise.” Targets should also be visible and not be confused with background objects (Figure 8). Otherwise, our model produces no results because the mask detects a false target in the middle of the debris.
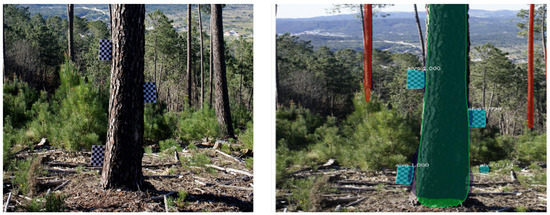
Figure 8.
Photograph of tree #29. On the left side, a picture is shown with no results, while on the right side, the mask image incorrectly detects one extra target.
As mentioned earlier, to improve the accuracy of the mask, the following aspects should be considered when taking photographs: brightness, distance to the tree, camera angle and the vertical position of the targets. Figure 9 shows some examples of incorrect images.
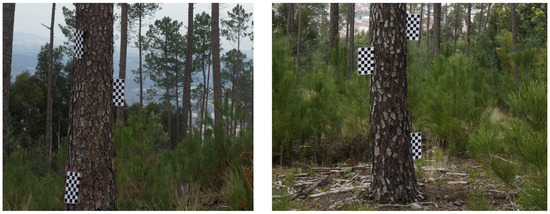
Figure 9.
Photograph of trees #11 and #14. These images show how the angle of the photograph can negatively affect the detection results.
Table 6 shows results from data that included images that the network considered “invalid” and therefore, the error values increased compared to the table in Appendix A (Table A1). The mean errors and standard deviation for each biometric variable were higher than those presented before for the selected images (Table 5).

Table 6.
Mean and standard deviation data for the total set of 256 images. These data include the 30 images that the network misdetected.
Similarly, Table A1 shows another example of the test set created for trees with ID 1 to ID 16, from 30 trees. This table presents the biometric variables’ average errors and standard deviation when the images are not selected.
4. Conclusions
The objective of the present work was to train a deep learning neural network capable of estimating a pine tree’s diameter, height, and volume. At the beginning of the project, a dataset was created to train the Mask-RCNN model. Several measurements were taken to account for different environmental variables, such as lighting conditions or distance to the tree. These measurements helped generalise the model and improve the overall accuracy of the generated masks.
A Mask-RCNN was trained to identify where each object was in the image. After performing the tests, we concluded that the proposed model could detect and segment the stem and targets. The extracted mask was used to calculate the tree’s diameter, height, and volume. The results obtained with the model showed that it had a good performance in segmenting the instances.
In general, estimating the trees’ diameters, heights, and volumes was highly accurate, and the average error was 4.0, 10.7 and 9.8, respectively, using our Mask-RCNN model. This method may allow any user to estimate the volume of trees in a forest inventory, saving time, human resources, and materials for its execution. An experimental platform was made available at http://floresta.digital.esac.pt (accessed on 24 October 2023), where users can obtain the volume values after registration.
In future work, the model can be improved using more data. Additionally, the model can be tested with other forest species. Our goal is to create an application that will allow potential users to utilize this tool and save time and economic resources, without compromising on the accuracy of the volume estimation.
Author Contributions
Conceptualization, T.F., R.S.-G., M.M. and B.F.; Methodology, A.M., T.F., R.S.-G. and M.M.; software, A.M. and J.L.; validation, T.F., R.S.-G., M.M. and B.F.; formal analysis, T.F., R.S.-G. and M.M.; investigation, A.M., T.F., R.S.-G., M.M., B.F. and J.L.; writing—original draft preparation, A.M.; writing—review and editing, T.F., R.S.-G. and M.M.; visualization, A.M.; supervision, T.F., R.S.-G. and M.M. All authors have read and agreed to the published version of the manuscript.
Funding
This work is financed by the European Union–NextGenerationEU, project no. 34 TRANSFORM—Digital transformation of the forestry sector for a more resilient and low-carbon economy. Project cofinanced by Centro 2020, Portugal 2020, and the European Union, through the ESF (European Social Fund).
Institutional Review Board Statement
Not applicable.
Informed Consent Statement
Not applicable.
Data Availability Statement
Data can be made available upon request from the authors.
Conflicts of Interest
The authors declare no conflict of interest.
Abbreviations
The following abbreviations are used in this manuscript:
| ANN | Artificial neural network |
| CNN | Convolutional neural network |
| COCO | Common Objects In Context |
| DBH | Diameter at breast height |
| mAP | Mean average precision |
| R-CNN | Region-based convolutional neural networks |
| RNN | Recurrent neural network |
| ROI | Region of interest |
| RPN | Region proposal network |
Appendix A

Table A1.
Results obtained on almost all the test (ID: 11–16) images. The first 3 columns represent the DBH, height, and volume values calculated and estimated by the network. Columns four, five, and six represent the actual measured values of the same measurements. Columns seven, eight, and nine represent the percentage error between the estimated value and the actual value. The average and standard deviation of the errors are shown at the end.
| Values | Real Values | Error (%) | |||||||
|---|---|---|---|---|---|---|---|---|---|
| Tree | DBH | H | V | DBH | H | V | DBH | H | V |
| 11.2 | 44.26 | 23.7 | 1.75 | 48.3 | 26.5 | 1.34 | 8% | 11% | 31% |
| 11.3 | 50.25 | 25.66 | 2.11 | 48.3 | 26.5 | 1.34 | 4% | 3% | 57% |
| 11.4 | 49.81 | 25.52 | 1.98 | 48.3 | 26.5 | 1.34 | 3% | 4% | 48% |
| 11.5 | 42.74 | 23.19 | 1.52 | 48.3 | 26.5 | 1.34 | 12% | 12% | 13% |
| 11.6 | 48.67 | 25.15 | 1.96 | 48.3 | 26.5 | 1.34 | 1% | 5% | 46% |
| 11.7 | 40.18 | 22.31 | 1.65 | 48.3 | 26.5 | 1.34 | 17% | 16% | 23% |
| 11.8 | 50.25 | 25.66 | 1.87 | 48.3 | 26.5 | 1.34 | 4% | 3% | 40% |
| 12.0 | 44.62 | 23.82 | 1.54 | 47.9 | 26.5 | 2.02 | 7% | 10% | 24% |
| 12.2 | 44.58 | 23.81 | 1.74 | 47.9 | 26.5 | 2.02 | 7% | 10% | 14% |
| 12.3 | 47.42 | 24.75 | 1.58 | 47.9 | 26.5 | 2.02 | 1% | 7% | 22% |
| 12.4 | 44.13 | 23.66 | 1.53 | 47.9 | 26.5 | 2.02 | 8% | 11% | 24% |
| 12.5 | 47.23 | 24.68 | 1.6 | 47.9 | 26.5 | 2.02 | 1% | 7% | 21% |
| 12.7 | 51.06 | 25.92 | 1.67 | 47.9 | 26.5 | 2.02 | 7% | 2% | 17% |
| 12.8 | 48.34 | 25.04 | 1.56 | 47.9 | 26.5 | 2.02 | 1% | 6% | 23% |
| 12.9 | 48.38 | 25.06 | 1.7 | 47.9 | 26.5 | 2.02 | 1% | 5% | 16% |
| 12.1 | 48.02 | 24.94 | 1.44 | 47.9 | 26.5 | 2.02 | 0% | 6% | 29% |
| 13.0 | 31.68 | 19.22 | 0.51 | 28.5 | 22.5 | 0.5 | 11% | 15% | 2% |
| 13.2 | 28.91 | 18.15 | 0.59 | 28.5 | 22.5 | 0.5 | 1% | 19% | 18% |
| 13.3 | 28.42 | 17.96 | 0.61 | 28.5 | 22.5 | 0.5 | 0% | 20% | 22% |
| 13.4 | 34.83 | 20.4 | 0.63 | 28.5 | 22.5 | 0.5 | 22% | 9% | 26% |
| 13.7 | 29.11 | 18.23 | 0.54 | 28.5 | 22.5 | 0.5 | 2% | 19% | 8% |
| 14.0 | 44.6 | 23.81 | 1.61 | 42.7 | 25.5 | 1.44 | 4% | 7% | 12% |
| 14.2 | 48.36 | 25.05 | 1.55 | 42.7 | 25.5 | 1.44 | 13% | 2% | 8% |
| 14.3 | 45.58 | 24.14 | 1.55 | 42.7 | 25.5 | 1.44 | 7% | 5% | 8% |
| 14.4 | 47.99 | 24.93 | 1.63 | 42.7 | 25.5 | 1.44 | 12% | 2% | 13% |
| 14.5 | 44.46 | 23.77 | 1.53 | 42.7 | 25.5 | 1.44 | 4% | 7% | 6% |
| 14.6 | 43.42 | 23.77 | 1.25 | 42.7 | 25.5 | 1.44 | 2% | 7% | 13% |
| 14.7 | 43.42 | 23.42 | 1.24 | 42.7 | 25.5 | 1.44 | 2% | 8% | 14% |
| 14.8 | 43.44 | 23.42 | 1.6 | 42.7 | 25.5 | 1.44 | 2% | 8% | 11% |
| 14.9 | 43.51 | 23.45 | 1.67 | 42.7 | 25.5 | 1.44 | 2% | 8% | 16% |
| 14.11 | 43.36 | 23.4 | 1.55 | 42.7 | 25.5 | 1.44 | 2% | 8% | 8% |
| 14.12 | 48.84 | 25.21 | 1.35 | 42.7 | 25.5 | 1.44 | 14% | 1% | 6% |
| 14.13 | 45.89 | 24.24 | 1.27 | 42.7 | 25.5 | 1.44 | 7% | 5% | 12% |
| 14.14 | 43.8 | 23.54 | 1.6 | 42.7 | 25.5 | 1.44 | 3% | 8% | 11% |
| 14.15 | 40.87 | 22.55 | 1.57 | 42.7 | 25.5 | 1.44 | 4% | 12% | 9% |
| 14.16 | 44.4 | 23.75 | 1.71 | 42.7 | 25.5 | 1.44 | 4% | 7% | 19% |
| 14.17 | 41.81 | 22.87 | 1.81 | 42.7 | 25.5 | 1.44 | 2% | 10% | 26% |
| 14.18 | 47.46 | 24.76 | 1.89 | 42.7 | 25.5 | 1.44 | 11% | 3% | 31% |
| 15.2 | 46.17 | 24.33 | 1.55 | 40.9 | 26.0 | 1.22 | 13% | 6% | 27% |
| 15.6 | 42.52 | 23.11 | 1.59 | 40.9 | 26.0 | 1.22 | 4% | 11% | 30% |
| 16.1 | 49.07 | 25.28 | 1.57 | 45.6 | 26.5 | 1.58 | 8% | 5% | 1% |
| 16.2 | 45.09 | 23.98 | 1.51 | 45.6 | 26.5 | 1.58 | 1% | 10% | 4% |
| … | … | … | … | … | … | … | …% | …% | …% |
| 30.3 | 41.36 | 22.71 | 1.26 | 39.0 | 30.0 | 1.33 | 6% | 24% | 5% |
| Mean | 5% | 10% | 15% | ||||||
| 1.83 | 1.61 | 0.18 | |||||||
References
- Fan, G.; Feng, W.; Chen, F.; Chen, D.; Dong, Y.; Wang, Z. Measurement of volume and accuracy analysis of standing trees using Forest Survey Intelligent Dendrometer. Comput. Electron. Agric. 2020, 169, 105211. [Google Scholar] [CrossRef]
- Coops, N.C.; Tompalski, P.; Goodbody, T.R.H.; Queinnec, M.; Luther, J.E.; Bolton, D.K.; White, J.C.; Wulder, M.A.; van Lier, O.R.; Hermosilla, T. Modelling lidar-derived estimates of forest attributes over space and time: A review of approaches and future trends. Remote Sens. Environ. 2021, 260, 112477. [Google Scholar] [CrossRef]
- Serrano, F.R.L.; Rubio, E.; Morote, F.A.G.; Abellán, M.A.; Córdoba, M.I.P.; Saucedo, F.G.; García, E.M.; García, J.M.S.; Innerarity, J.S.; Lucas, L.C.; et al. Artificial intelligence-based software (AID-FOREST) for tree detection: A new framework for fast and accurate forest inventorying using LiDAR point clouds. Int. J. Appl. Earth Obs. Geoinf. 2022, 113, 103014. [Google Scholar]
- Calders, K.; Adams, J.; Armston, J.; Bartholomeus, H.; Bauwens, S.; Bentley, L.P.; Chave, J.; Danson, F.M.; Demol, M.; Disney, M.; et al. Terrestrial laser scanning in forest ecology: Expanding the horizo. Remote Sens. Environ. 2020, 251, 112102. [Google Scholar] [CrossRef]
- Juyal, P.; Sharma, S. Classification of tree species and stock volume estimation in ground forest images using Deep Learning. Comput. Electron. Agric. 2019, 166, 105012. [Google Scholar]
- Coelho, J.; Fidalgo, B.; Crisóstomo, M.M.; Salas-González, R.; Coimbra, A.P.; Mendes, M. Non-destructive fast estimation of tree stem height and volume using image processing. Symmetry 2021, 13, 374. [Google Scholar] [CrossRef]
- Guimarães, A.; Valério, M.; Fidalgo, B.; Salas-Gonzalez, R.; Pereira, C.; Mendes, M. Cork Oak Production Estimation Using a Mask R-CNN. Energies 2022, 15, 9593. [Google Scholar] [CrossRef]
- Vadell, E.; Pemán, J.; Verkerk, P.J.; Erdozain, M.; De-Miguel, S. Forest management practices in Spain: Understanding past trends to better face future challenges. For. Ecol. Manag. 2022, 524, 120526. [Google Scholar] [CrossRef]
- ICNF. 6.° Inventário Florestal Nacional: 2015. In Relatório Final; ICNF: Lisboa, Portugal, 2019; Volume 120526. [Google Scholar]
- IGN (Institut National de l’Information Géographique et Forestière). Inventaire Forestier National. 2022. Available online: https://inventaire-forestier.ign.fr/ (accessed on 24 October 2023).
- Centro PINUS. A Fileira do Pinho em 2022. Indicadores da Fileira do Pinho. Available online: https://www.centropinus.org/files/upload/indicadores/indicadores-2022-final.pdf (accessed on 24 October 2023).
- Gonçalves, J.; Teixeira, P.; Carneiro, S. Valorizar o Pinheiro-Bravo: A Perspetiva de Mercado; Printer Portuguesa: Lisbon, Portugal, 2020. [Google Scholar]
- Ribeiro, S.; Cerveira, A.; Soares, P.; Fonseca, T. Natural Regeneration of Maritime Pine: A Review of the Influencing Factors and Proposals for Management. Forests 2022, 13, 386. [Google Scholar] [CrossRef]
- Salas-González, R.; Fidalgo, B. Impacto de agentes de distúrbio nos serviços dos ecossistemas em povoamentos de pinheiro bravo na Serra da Lousã. Geografia, Riscos e Proteção Civil. Livro Homenagem Profr. Doutor Luciano LourençO 2021, 2, 213–224. [Google Scholar]
- Sousa, E.; Rodrigues, J.M.; Bonifácio, L.; Naves, P.M.; Rodrigues, A. Management and control of the pine wood nematode, Bursaphelenchus xylophilus, in Portugal. In Nematodes: Morphology, Functions and Management Strategies; Nova Science Publishers, Inc.: Hauppauge, NY, USA, 2011; pp. 157–178. [Google Scholar]
- Alegria, C.; Canavarro, T.M. An overview of maritime pine private non-industrial forest in the centre of Portugal: A 19-year case study. Folia For. Pol. 2016, 58, 198–213. [Google Scholar] [CrossRef][Green Version]
- Achim, A.; Moreau, G.; Coops, N.C.; Axelson, J.N.; Barrette, J.; Bédard, S.; White, J.C. The changing culture of silviculture. Forestry 2022, 95, 143–152. [Google Scholar] [CrossRef]
- Mina, M.; Messier, C.; Duveneck, M.; Fortin, M.; Aquilué, N. Managing for the unexpected: Building resilient forest landscapes to cope with global change. Glob. Change Biol. 2022, 28, 4323–4341. [Google Scholar] [CrossRef] [PubMed]
- ICNF. Portugal Perfil Florestal. 2021. Available online: https://www.icnf.pt/api/file/doc/1f924a3c0e4f7372 (accessed on 24 October 2023).
- Canadas, J.M.; Novais, A. Proprietários florestais; gestão e territórios rurais. AnáLise Soc. 2014, 211, 346–381. [Google Scholar]
- Herbohn, J.L. Small-scale forestry-is it simply a smaller version of industrial (large-scale) multiple use forestry? In Small-scale Forestry and Rural Development: The Intersection of Ecosystems, Economics and Society. In Proceedings of the IUFRO 3.08 Conference, hosted by Galway-Mayo Institute of Technology, Galway, Ireland, 18–23 June 2006; pp. 158–163. [Google Scholar]
- Diamantopoulou, M.J. Artificial neural networks as an alternative tool in pine bark volume estimation. Comput. Electron. Agric. 2005, 48, 235–244. [Google Scholar] [CrossRef]
- Ramazan, Ö.; Diamantopoulou, M.; Brooks, J.; Wiant, H. Estimating tree bole volume using artificial neural network models for four species in Turkey. J. Environ. Manag. 2010, 91, 742–753. [Google Scholar] [CrossRef]
- Juyal, P.; Sharma, S. Estimation of tree volume using mask R-CNN based deep learning. In Proceedings of the 2020 11th International Conference on Computing, Communication and Networking Technologies (ICCCNT), Kharagpur, India, 1–3 July 2020; pp. 1–6. [Google Scholar]
- Zhao, T.; Yang, Y.; Niu, H.; Wang, D.; Chen, Y. Comparing U-Net convolutional network with mask R-CNN in the performances of pomegranate tree canopy segmentation. Multispectral Hyperspectral Ultraspectral Remote Sens. Technol. Tech. Appl. VII 2018, 10780, 210–218. [Google Scholar]
- He, K.; Gkioxari, G.; Dollár, P.; Girshick, R. Mask r-cnn. In Proceedings of the IEEE International Conference on Computer Vision, Venice, Italy, 22–29 October 2017; pp. 2961–2969. [Google Scholar]
- Bharati, P.; Pramanik, A. Deep learning techniques—R-CNN to mask R-CNN: A survey. In Computational Intelligence in Pattern Recognition: Proceedings of CIPR 2019; Springer: Berlin, Germany, 2020; pp. 657–668. [Google Scholar]
- ESIR. How Mask R-CNN Works? Available online: https://developers.arcgis.com/python/guide/how-maskrcnn-works/ (accessed on 24 October 2023).
- Wang, J.; Li, T.; Wang, D.; Liu, J. Measuring algorithm for tree’s diameter at breast height based on optical triangular method and image processing. Trans. Chin. Soc. 2013, 44, 241–245. [Google Scholar]
- Marzulli, M.; Raumonen, P.; Greco, R.; Persia, M.; Tartarino, P. Estimating tree stem diameters and volume from smartphone photogrammetric point clouds. For. Int. J. For. Res. 2020, 93, 411–429. [Google Scholar] [CrossRef]
- Hyyppä, J.; Pyysalo, U.; Hyyppä, H.; Samberg, A. Elevation accuracy of laser scanning-derived digital terrain and target models in forest environment. In Proceedings of the EARSeL-SIG-Workshop LIDAR, Dresden, Germany, 16–17 June 2000; pp. 16–17. [Google Scholar]
- Hunter, M.O.; Keller, M.; Victoria, D.; Morton, D.C. Tree height and tropical forest biomass estimation. Biogeosciences 2013, 10, 8385–8399. [Google Scholar] [CrossRef]
- Frank, E. The Really, Really Basics of Laser Rangefinder/Clinometer Tree Height. Native Tree Society BBS. 2010. Available online: https://www.ents-bbs.org/viewtopic.php?f=235&t=2703 (accessed on 24 October 2023).
- Sullivan, M.J.; Lewis, S.L.; Hubau, W.; Qie, L.; Baker, T.R.; Banin, L.F.; Chave, J.; Cuni-Sanchez, A.; Feldpausch, T.R.; Lopez-Gonzalez, G.; et al. Field methods for sampling tree height for tropical forest biomass estimation. Methods Ecol. Evol. 2018, 9, 1179–1189. [Google Scholar] [CrossRef] [PubMed]
- Henttonen, H.M.; Kangas, A. Optimal plot design in a multipurpose forest inventory. For. Ecosyst. 2015, 2, 31. [Google Scholar] [CrossRef]
Disclaimer/Publisher’s Note: The statements, opinions and data contained in all publications are solely those of the individual author(s) and contributor(s) and not of MDPI and/or the editor(s). MDPI and/or the editor(s) disclaim responsibility for any injury to people or property resulting from any ideas, methods, instructions or products referred to in the content. |
© 2023 by the authors. Licensee MDPI, Basel, Switzerland. This article is an open access article distributed under the terms and conditions of the Creative Commons Attribution (CC BY) license (https://creativecommons.org/licenses/by/4.0/).