Article

Effect of High Biological Value Animal Protein Sources on the Techno-Functional Properties of Ice Cream

by
Tamás Csurka
,
Karina Ilona Hidas
,
Adrienn Varga-Tóth
,
István Dalmadi
*,
Klára Pásztor-Huszár
and
László Ferenc Friedrich
Department of Livestock Products and Food Preservation Technology, Institute of Food Science and Technology, Hungarian University of Agriculture and Life Sciences, Ménesi Str. 43-45, H-1118 Budapest, Hungary
*
Author to whom correspondence should be addressed.
Sustainability 2023, 15(24), 16794; https://doi.org/10.3390/su152416794
Submission received: 8 November 2023 / Revised: 27 November 2023 / Accepted: 7 December 2023 / Published: 13 December 2023
(This article belongs to the Section Sustainable Food)

Abstract

:
This study aimed to investigate the effect of enriching ice cream with high biological value animal protein sources from by-products on its techno-functional properties. Ice creams were prepared with 10 g (100 g)−1 amount of different enrichments: whole egg, egg yolk, egg white, animal blood plasma, whole blood, and haemoglobin. The rheological properties, frozen texture, colour, dry matter content, and pH of the ice cream samples were analysed. The results indicate that these ‘natural food additives’ can influence the quality properties of ice cream, highlighting the potential for developing novel ice cream products with enhanced nutritional value and decreasing food wastes. The study reveals that enrichments significantly affect the rheological attributes of the ice cream mix, altering yield stress and consistency index without changing the overall rheological behaviour. The frozen texture varies among enrichments, with egg white resulting in the softest texture, while blood-based enrichments and egg yolk contribute to a harder texture. Colour analysis indicates changes in redness/greenness, yellowness/blueness and lightness due to different pigments and foaming effects of enrichment materials. Furthermore, enrichments influence dry matter content and pH, with egg yolk increasing fat content and haemoglobin boosting protein content. Sensory analysis suggests that certain enrichments improve taste sensation and colour preference, making them more acceptable to consumers despite the by-product ingredients.

1. Introduction

Modern slaughterhouses supply meat to our increasingly demanding population, in the strictest food law environment and using advanced technology. However, about half of the weight of a pig or cattle cannot be used for human consumption, thus without added value. Blood can represent up to 9 g (100 g)−1 of the total live weight of an animal, which is well above the 10 g (100 g)−1 effective weight ratio [1]. According to the literature, the most important of the unutilised animal by-products is the blood. Both in terms of its good absorbability protein [2,3,4] and heme-iron [5,6,7] content, and techno-functional properties, blood can be a perfect raw material for functional and common food [8,9,10,11]. According to the Eurostat database, in 2021 alone, 6,801,910 t of beef meat and 23,393,670 t of pork meat were produced in the European Union, which, based on the weight ratio of 5 g (100 g)−1, can be confidently obtained from bleeding using conventional technology, means 340,095.5 t of beef blood and 1,169,683.5 t of pork blood [12]. If we exclude illegally ‘disappeared’ blood, the amount of blood stored as hazardous waste at extra cost and sent for neutralisation, or possibly in the better case processed into a fertiliser or animal feed, is more than 90% of the before mentioned numbers. The reason for this is that the legally compliant technology to collect animal blood for human consumption is very expensive and the potential uses are severely limited due to a lack of information and demand. There has always been a lot of potential and ‘money’ in by-products, but there are still very limited scientific results that can be used by industry either to generate demand or to increase competitiveness.
An egg is also a ‘miracle food’ with its high biological value, which means its high protein content and beneficial protein composition, high vitamin and mineral content [13], as well as egg, can be produced in a more sustainable way than milk or meat [14]. Cattle and dairy farming are currently generating much debate on sustainability [15,16,17]. For sustainability reasons, it may be beneficial to replace milk proteins with egg proteins in foods, if this does not cause an unacceptable change in quality properties for industry and consumers [18].
Ice cream, especially chocolate ice cream, is one of the most popular sweet foods, and the development of its properties and nutritional effects has always been an important topic and still is today [19,20,21,22,23]. Ice cream is a complex, but still homogeneous food matrix that provides novel data to investigate the effect of enrichment with high biological value animal protein sources. In addition, the addition of a product with a high biological value, which is an excellent medium for bacteria, is not expected to reduce the shelf life of the product. The colloidal system of the matrix contains all the states of matter at once: solid crystal, liquid and gas. The incorporation of proteins into the cross-linked structure may affect the flow properties of the ice cream mix, thereby changing the optimum mixing and transport operations in the pipe system, as well as the hardness of the frozen ice cream. The components of ice cream are proteins, fats, sugars, air and other substances, the mixture of which has the unique characteristic of changing from a sol state to a liquid state during consumption [24]. The incorporation of proteins can slow down this phase transition. Proteins have an important function in the development of the structure. They are adsorbed at the air interface, leading to enhanced aeration and foam stability and contributing to partial coalescence and fat structure formation [25]. The microstructural elements of ice cream are made up of fat globules, ice and air. The composition of ice creams differs considerably and therefore their structure is also different. The microstructure influences the melting behaviour [26]. Guar gum is a common ingredient in ice creams, which is used as a thickener and stabilizer. It can boost the texture and heat-shock resistance by binding free water [27].
From a nutritional point of view, the enrichment of ice creams with blood is a beneficial change due to their iron content in the first place and protein in the second place [28]. One of the groups most at risk of iron deficiency anaemia is children, who can also suffer from lifelong movement disorders and neurological dysfunction because of this [29]. The best way to increase the absorbed iron content of a food product is to enrich it with whole blood or, even better, with haemoglobin [30], but it causes a strong darkening of the target matrix via denatured hem pigments [31]. The darkening caused by haemoglobin, the decrease in lightness, is non-linear. An amount of 2 g (100 g)−1–5 g (100 g)−1 of raw whole blood is acceptable to consumers in a meat product and causes an increase in total iron content of 22 mg kg−1–35 mg kg−1 wet weight depending on the animal species [32]. According to a previous study, by-flavour is only found above a concentration of 4 g (100 g)−1 and below this level the taste and texture of meat batter products are not significantly different from blood-free products in sensory tests [33]. Compounds of egg products are also emulsifiers and egg proteins are also stabilizing elements with good solubility, foaming capacity and emulsifying effect [34]. Similar effects of egg whites and plasma proteins on the techno-functional properties of foods have been observed [35,36,37]. But the higher salt content of plasma should be considered. Egg lecithin is an important emulsifying additive, which also has to be considered.
The aim of the research was to investigate the effect of enriching with high biological value animal protein sources on the techno-functional properties of ice cream.
There is no Codex Alimentarius international food standard for ice creams and the composition of ice creams from different regions can be very different. The scope of the research does not include determining which religious systems allow or forbid the consumption of the products used, or which local legal systems allow the commercialisation of fortified products such as ice cream.

2. Materials and Methods

2.1. Preparation of Ice Cream

Ice creams were prepared using the same, industrial technology in a semi-industrial size [38]. Six independent samples were made from each sample group. The recipe for one batch of ice cream was the following: 0.7 kg milk with 2.8% fat, 0.12 kg cream with 30% fat, 0.1 kg sucrose, 0.05 kg cocoa powder with 30% fat, 0.05 kg dextrose and 0.004 kg guar gum. All basic ingredients are sourced from Hungarian food stores in normal commercial, food industrial purity. This base formulation was fortified with liquid whole egg (Capriovus, Szigetcsép, Hungary), liquid egg yolk (Capriovus, Szigetcsép, Hungary), liquid egg white (Capriovus, Hungary), animal blood plasma with 9 g (100 g)−1 dry matter content (DMC) from plasma powder (Sonac Burgum, Sumar, The Netherlands), animal whole blood with 38 g (100 g)−1 DMC from whole blood powder (Solvent Kereskedőház, Budapest, Hungary) or animal haemoglobin with 38 g (100 g)−1 DMC from haemoglobin powder (Sonac Burgum, Sumar, The Netherlands) to give 10 g (100 g)−1 of the total weight of fortifying liquid blood product. Before enrichment, the powders were diluted back to the original water content of the liquid blood products. The fat content of ice cream samples was 7–10 g (100 g)−1. The ice cream mix was homogenised by an ultra mixer (Robot Cupe, Montceau-en-Bourgogne, France) at 440 W for 3 min and then heat treated at 70 °C for 30 min. To prepare the ice cream, an ice cream maker (Telme CRM GEL 5; Telme, Codogno, Italy) was used with a 12 min program, and then the ice cream was frozen at −34 °C for 2 h by shock freezing. Ice creams were stored at −18 °C for at least one day before measurements.

2.2. Rheological Measurement of Liquid Ice Cream Mix

The rheological analysis was carried out by using a MCR 92, Anton-Paar rheometer (Anton-Paar, Ostfildern, Germany) in rotational mode. The flow behaviour of the samples under variable shear stress was measured with a Couette-type method using concentric cylinders (CC27: outer cylinder diameter—28.92 mm; inner cylinder diameter—26.651 mm; inner cylinder height—40.003 mm; active height—120.2 mm; positioning height—72.5 mm). The speed of the inner cylinder varied between 1 mm−1 and 1000 min−1 during the measurement, while data were collected at 2 × 31 measuring points [39]. Each parallel sample was measured three times and their average was used for later evaluation. The method resulted in flow curves by the Anton Paar RheoCompass software version 1.21.852, to which a model was fitted, and rheological constants were calculated according to the model to describe the behaviour of the material. The curves were analysed using the Herschel–Bulkley model, which can be used to describe the flow behaviour of all the samples. The variables included in the model are shear stress (τ), theoretical yield stress (τ0), shear rate (γ), consistency index (C) and flow index (p). The Herschel–Bulkley model is described by the following equation [40]:
τ = τ 0 + C × γ p
From the measurement results, a theoretical shear rate was calculated for each measurement point based on the equation describing the model. The sum of squares of difference of the calculated and measured shear rates was iterated using the Excel Solver to fit the model to the measurement points and determine the values of the constants in the equation. After applying the method of least squares, the model was validated by considering the coefficient of determination (R2), which indicates the goodness of fitting. R2 was above 0.95 in all cases. The temperature of the measurement of ice cream mix samples was 20 °C. The samples were liquid ice cream mixed at a temperature of 20 °C without any sedimentation.

2.3. Texture Measurement of Frozen Ice Cream

The texture of samples was examined by Stable Micro System (SMS) TA. XT Plus texture analyser (Stable Micro System, Godalming, UK). Warner–Bratzler (W-B) test was carried out, which investigates the force (N) needed to shear the sample [41]. W-B ‘V’-shaped blade measuring head was used with 2 mm s−1 test speed. The blade completely passed through the samples with 0.049 N. The aim of the measurement was to obtain comparable values from the hardness of frozen ice cream samples in the same size (5 mm wide and 50 mm long half-cylinder shapes). Ice creams were stored at −18 °C for at least one day after production before the measurement. To avoid melting, the measuring head and the tray were kept in ice between two measurements, and a maximum of 30 s was allowed between the removal of the samples from the freezer and the measurement. Each parallel sample was measured three times and their average was used for the evaluation. Data were evaluated using Texture Exponent 32 software. The shear force represented the hardness of the texture.

2.4. Colour Measurement

Minolta CR-400 (Konica Minolta, INC., Tokyo, Japan) colourimeter was used for the reflectional colour measurement. The ratio of the three different wave-length lights was plotted in the CIELAB colour space system. The colour coordinates can be numbered making colours analysable. The instrument was calibrated with a standard white plate. Measured attributes are the following: redness/greenness (a*), yellowness/blueness (b*) and lightness (L*). Chroma (C*) was calculated as the following equation [42]:
C * = a * 2 + b * 2
Each parallel sample was measured three times and their average was used for the evaluation.

2.5. Dry Matter Content Measurement

An amount of 3–5 g of each sample was measured into open Petri dishes by Kern ABJ-NM/ABS-N (Kern & Sohn GmbH, Balingen, Germany) analytical balance. Then, samples were dried in a laboratory drying oven (Labor Műszeripari Művek, Budapest, Hungary) at 105 °C until constant weight. Samples were cooled in a desiccator then their mass was measured by analytical balance. Each parallel sample was measured three times and their average was used for the evaluation.

2.6. pH Measurement

Voltcraft PHT-02 ATC (Voltcraft, Hirschau, Germany) pH meter for liquid samples was used for pH measurement in the case of ice cream mix samples. Ice cream mix samples were measured at room temperature after the mixing before the freezing. Liquid samples were measured because around a pH measuring electrode put into a frozen sample, the frozen sample would start to melt and the electrolyte content and thus the pH of the eutectic mixture would not be the same as the pH of the whole mass. In addition, pH also depends on temperature and is more easily interpreted in water solutions, so it was preferable to measure samples in liquid form. The principle of pH meter operation is based on electronic differentiation between a referent electrode with a stable value and a pH-sensitive electrode in a fluid with any standard redox potential. The device was calibrated before each measurement series with two standard liquids (pH 7.0 and pH 4.0). Each parallel sample was measured three times and their average was used for the evaluation.

2.7. Sensory Analysis

The sensory analysis was carried out in an adequately equipped laboratory (with no distractions and with separated panel members). Panel members filled in a paper questionnaire. They rate from 1 (worst/not noticeable) to 10 (best/very noticeable) on a structured scale of the following attributes: colour preference, flavour preference, chocolate flavour intensity, chocolate aroma intensity, sweet flavour intensity and salty flavour intensity. (Investigation of salty flavour intensity was required because of the high salt content of blood plasma.) For flavour neutralisation, water was given to the panellists. The average age of the panel members was 32.13 years, the minimum age was 20 years, and the maximum age was 58 years. Panel members were (untrained) consumers. All panel members were informed that the samples contained blood, as some religions prohibit its consumption. Samples were randomly assigned a three-digit numerical code and each panellist received samples in a different sequence to eliminate the effect of consecutive tasting. In addition, the sample set contained the control sample twice. Panellists received only six samples per test.

2.8. Statistical Analysis

Measurement results were evaluated by IBM SPSS v27 (IBM, Armonk, New York, NY, USA) and Microsoft Excel 365 version 2010 (build: 13328.20356) software. Excel was used for fitting the rheological model, correlation analysis, representation and performing mathematical operations. To detect the effect of different animal origin ingredients enrichments and their protein content on ice cream mix rheological behaviour (τ0, C, p), hardness of ice cream (shear force), ice cream colour (L*, a*, b*, C*), DMC and pH, multivariate analysis of variance (MANOVA) was carried out. The value of the unexplained variance rate (Wilks’s lambda) was evaluated. The homogenous groups were separated by the Tukey HSD post hoc test for the evaluation (α = 0.05). The homogeneity of variances was checked by Levene’s test. The normality of residuals was checked by the Kolmogorov–Smirnov test. In the case of L*, b* and pH, the normality of residuals was checked by the Shapiro–Wilk test, because the requirements of Kolmogorov–Smirnov test were not met. Three different MANOVA were carried out: (1) one for the rheological attributes, (2) one for the colour attributes, and (3) one for pH, DMC and hardness, because the hardness of frozen texture theoretically depends on pH and DMC.

3. Results and Discussion

3.1. Rheological Behaviour of Liquid Ice Cream Mix

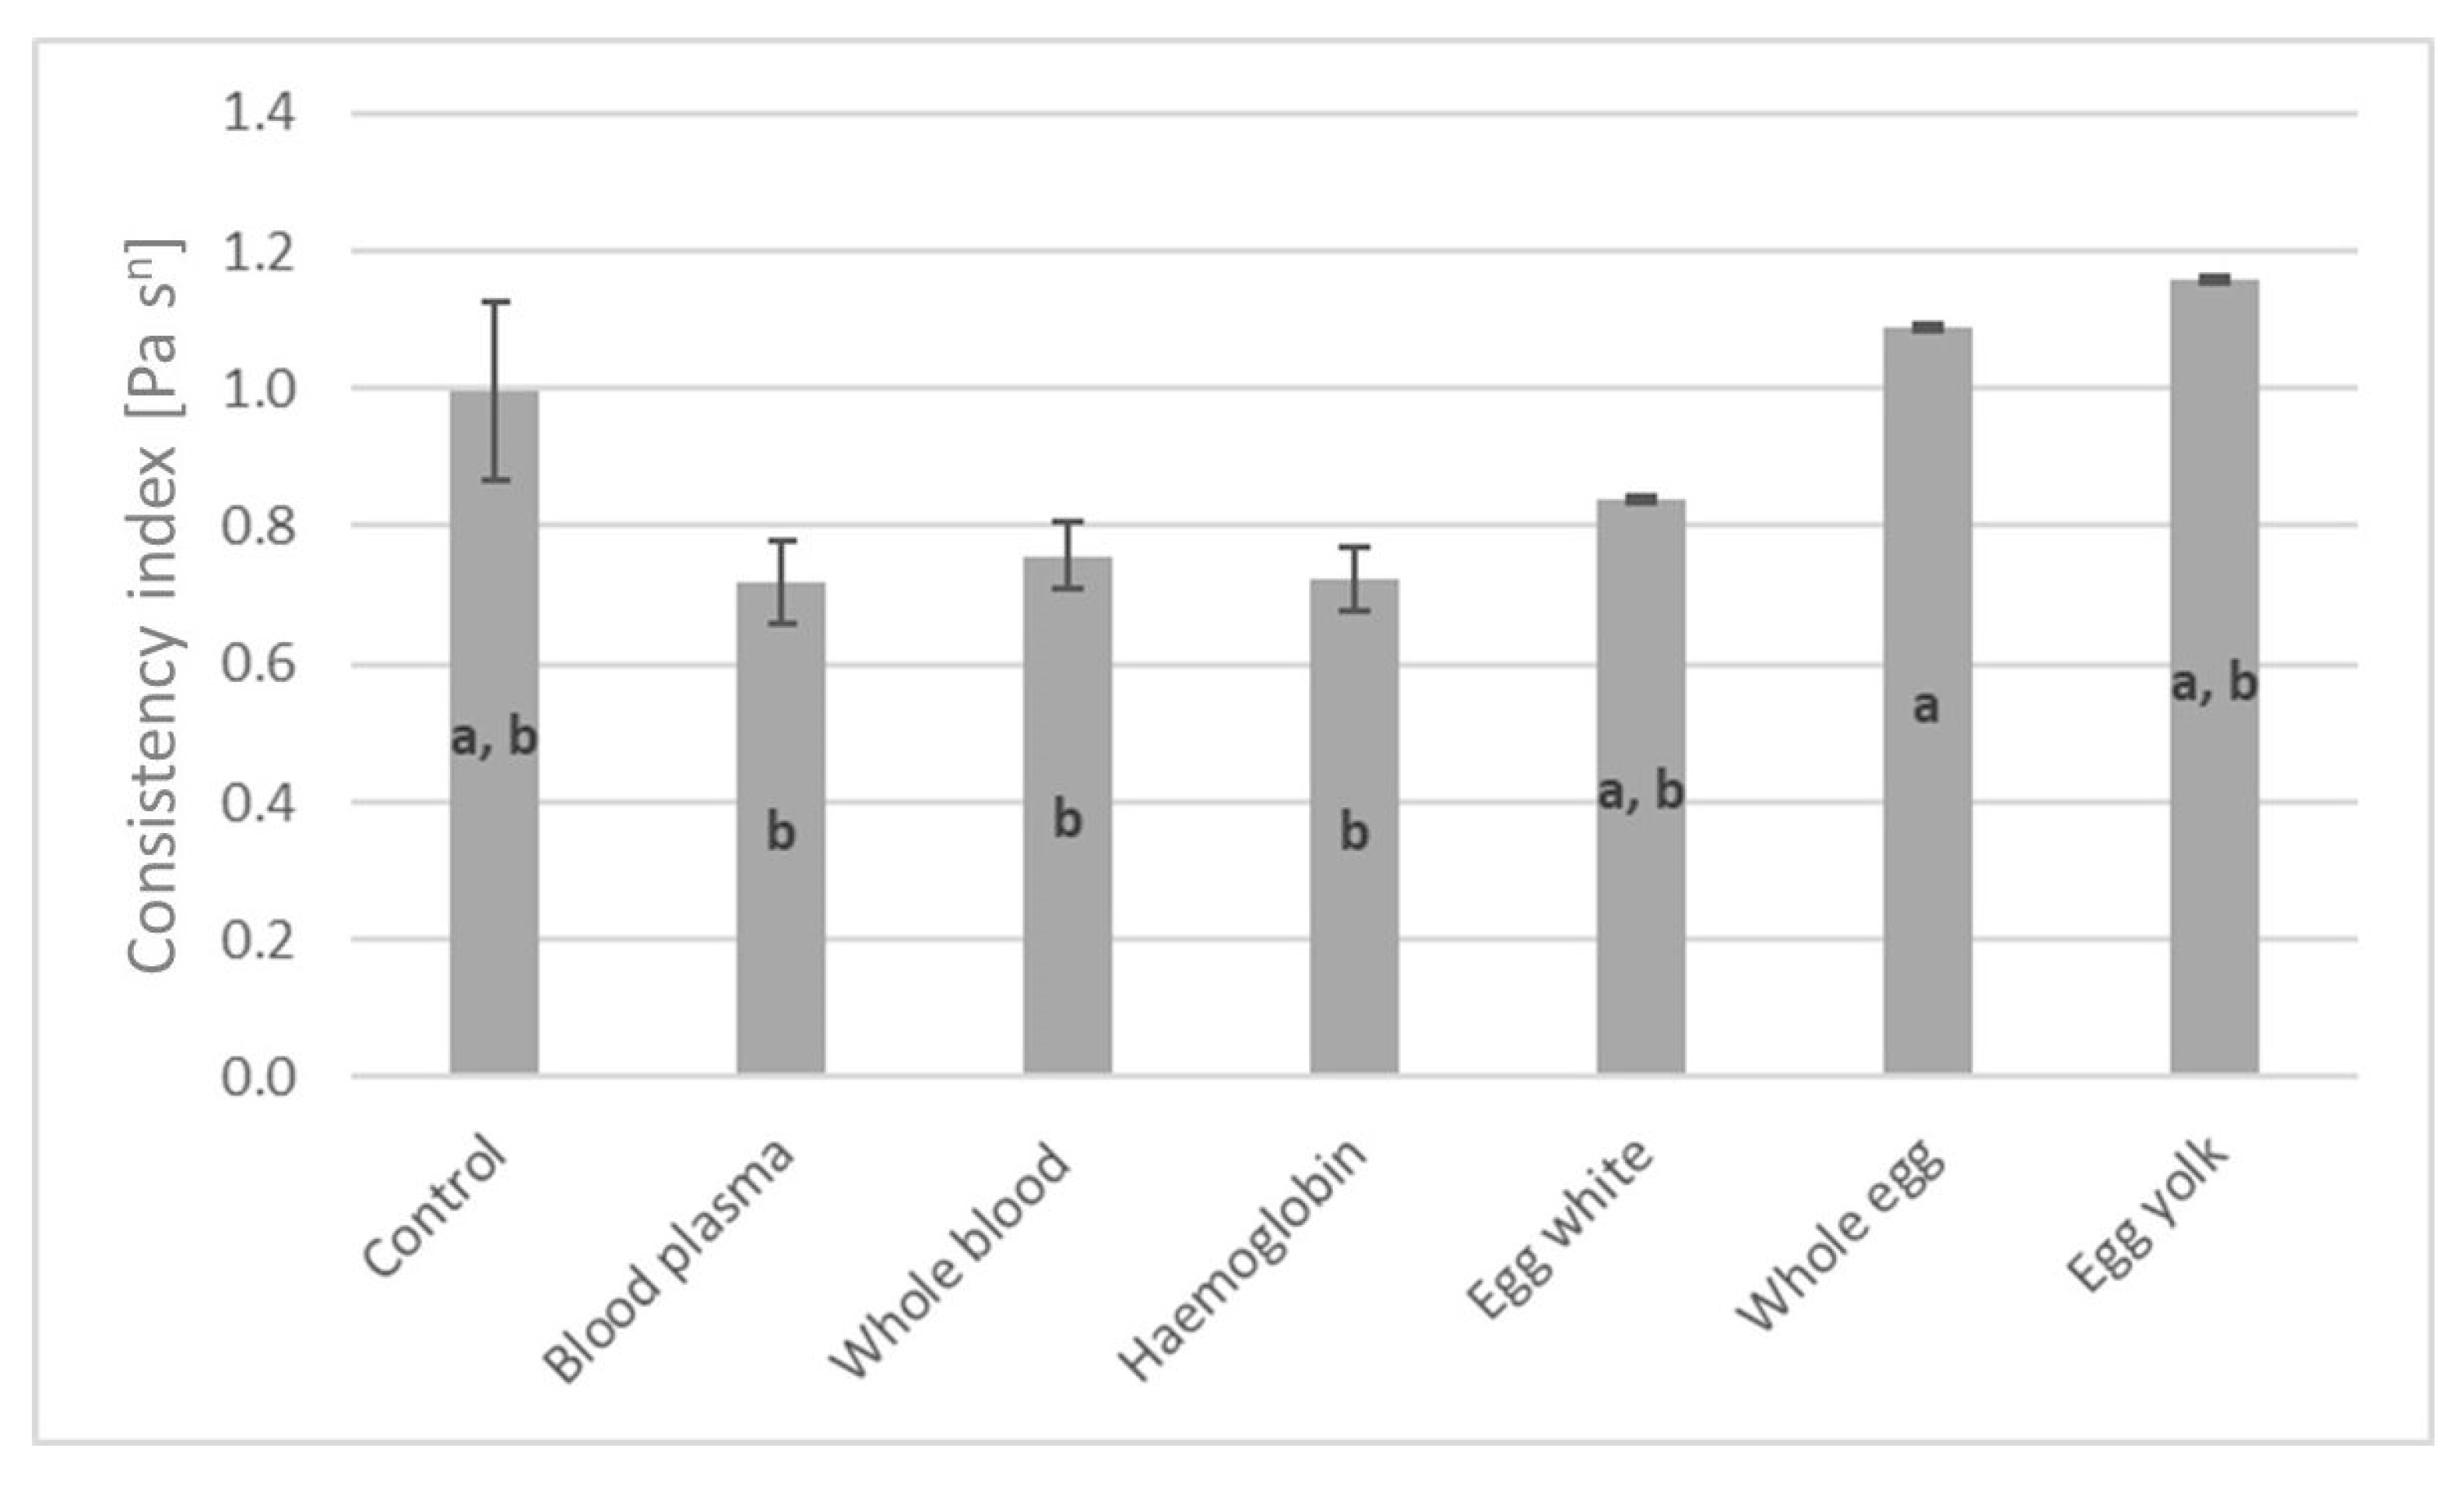
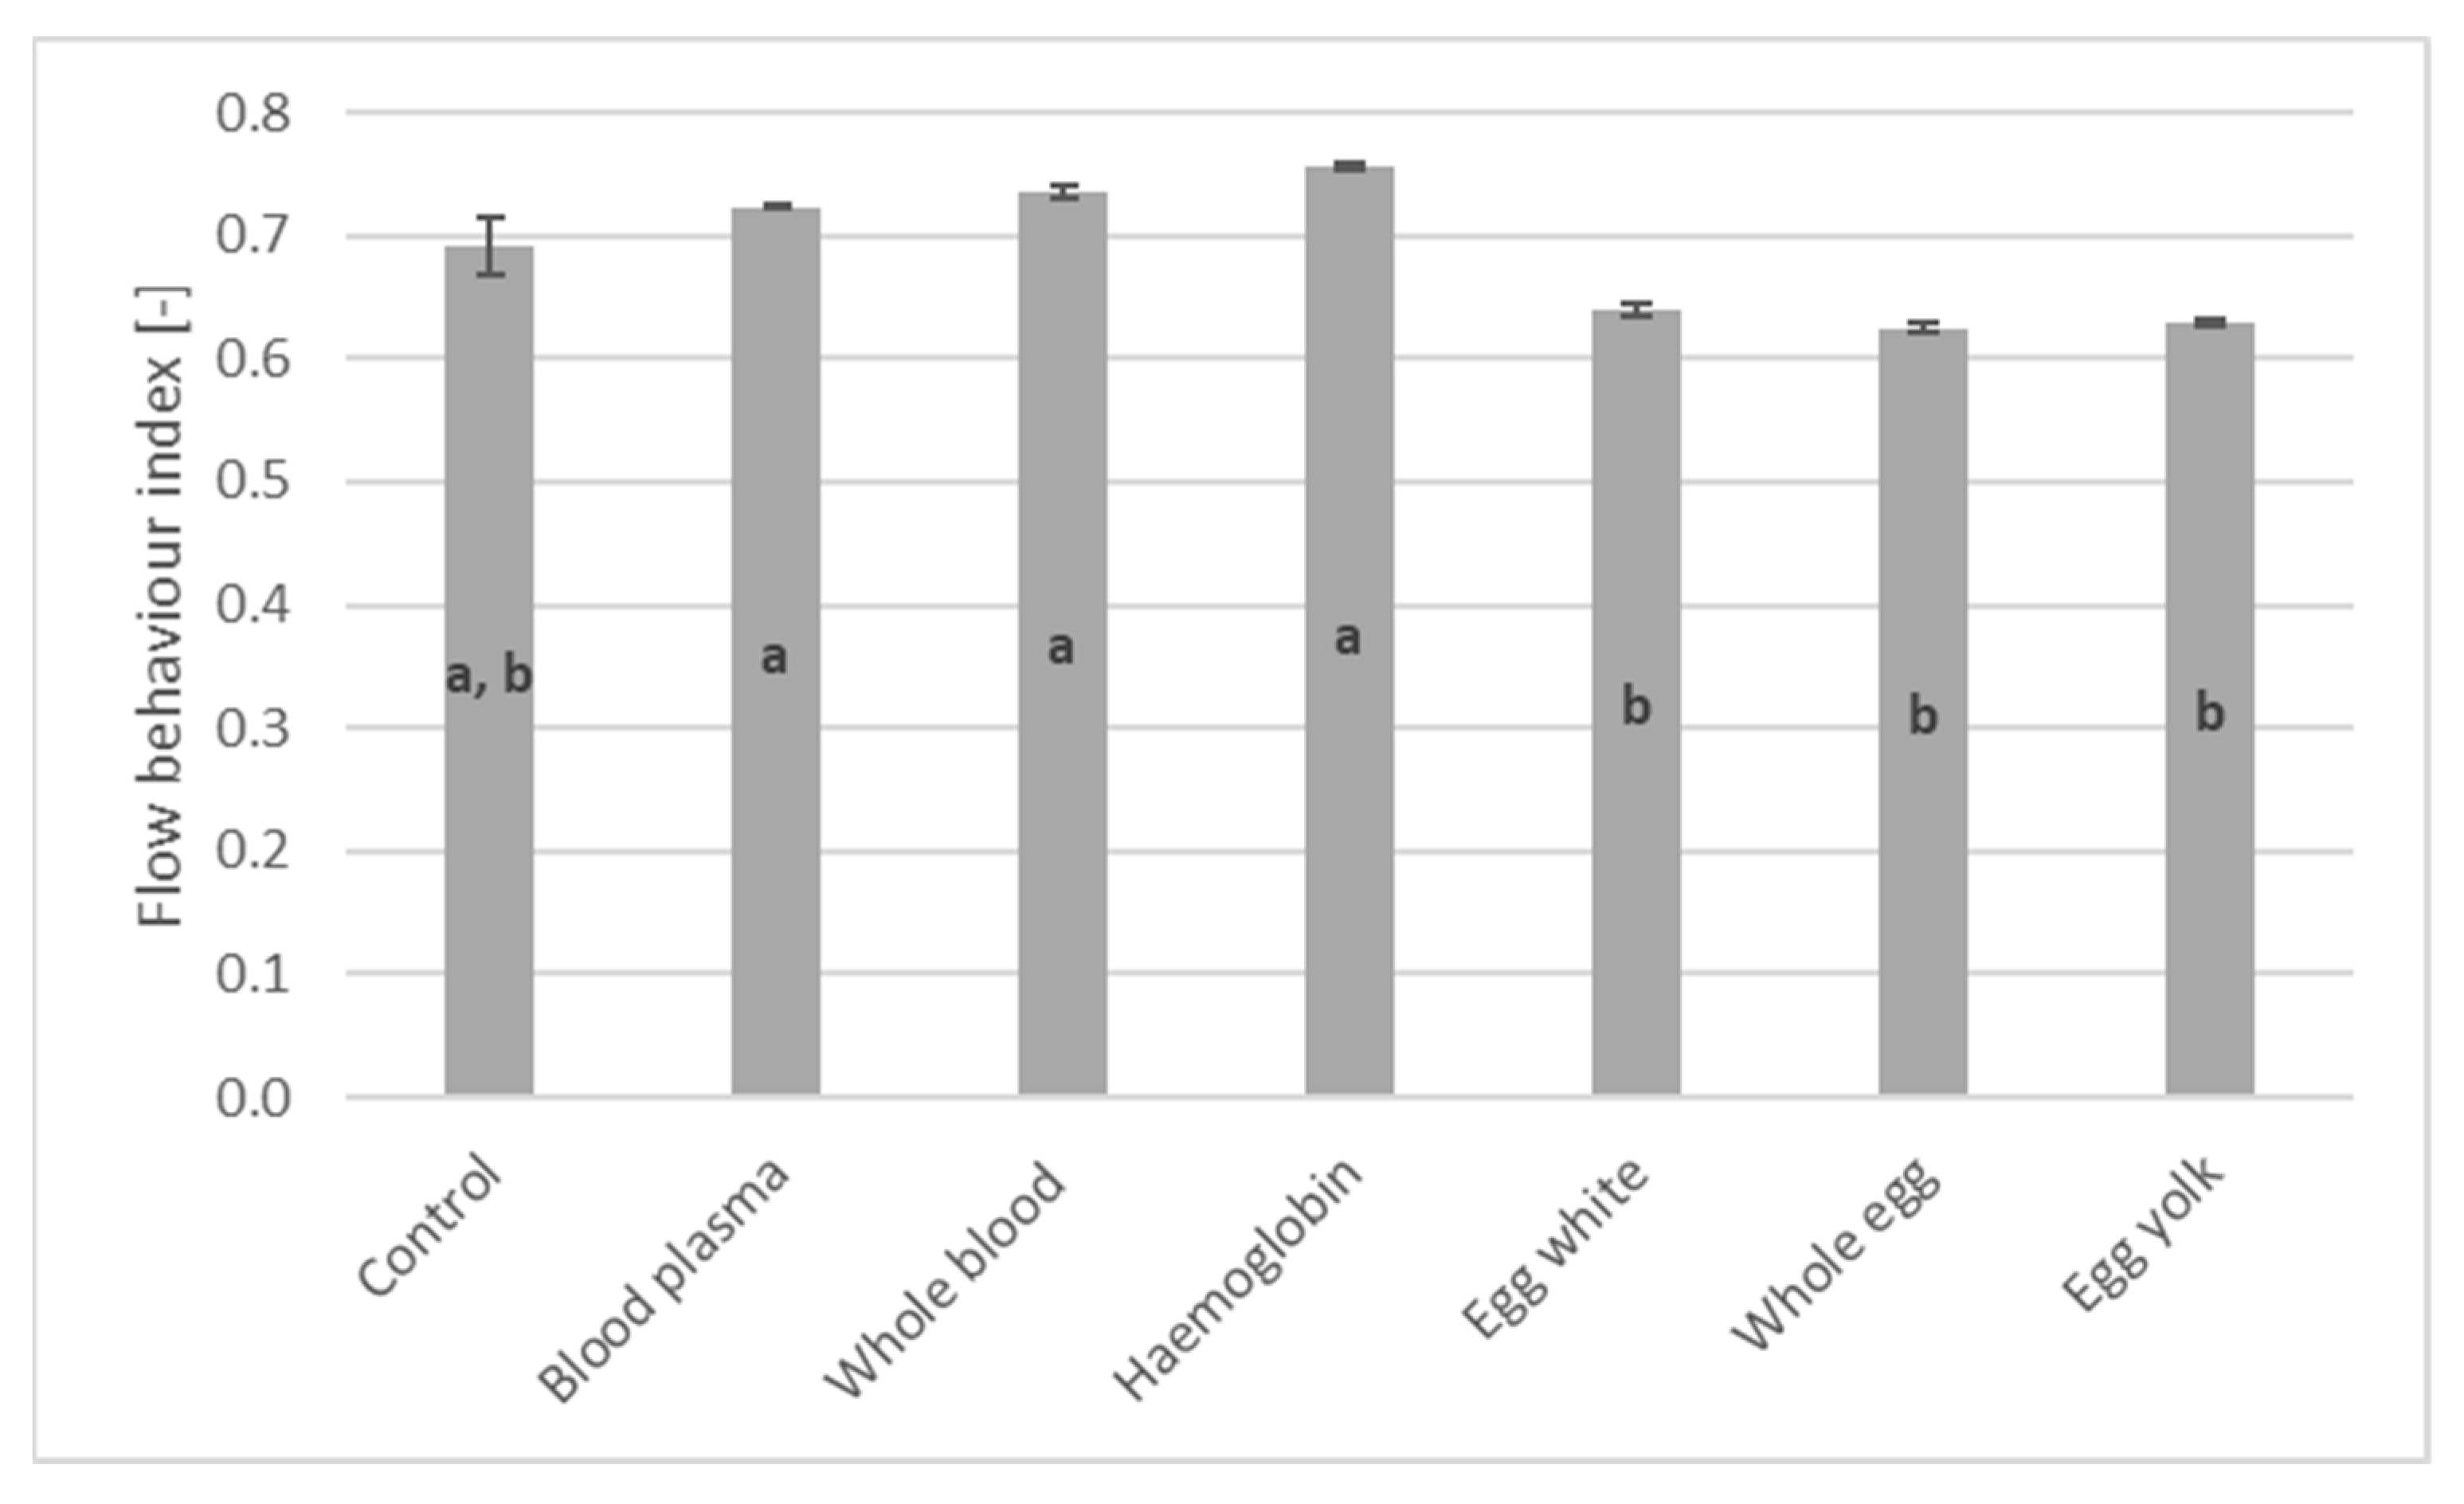
After checking equality of error variances [τ0: F(6,17) = 3.163, p = 0.029; C: F(6,17) = 11.988, p < 0.001; p(flow behaviour index): F(6,17) = 13.557, p < 0.001] and normal distribution of residuals [τ0: D(24) = 0.321, p < 0.001; C: D(24) = 0.178, p = 0.047; p(flow behaviour index): D(24) = 0.212, p = 0.006], results were evaluated by MANOVA. The overall MANOVA result was significant for the sample types with different enrichments and marks a very strong relation between the enrichments and the rheological attributes (Wilks’ lambda: 0.003, p < 0.001). Figure 1, Figure 2 and Figure 3 show the rheological parameters of different sample groups. In the case of the yield stress, a significant difference cannot be observed between most of the sample groups. Only the control samples had significantly higher yield stress than other sample groups and samples enriched with egg yolk had significantly lower yield stress than other sample groups. This can be explained by the control sample being diluted with the enrichments, because the water content of the enrichments was much higher than the control ice cream mix. The egg yolk has the highest fat content and its protein content has the lowest binding capacity. Because of that, the sample group with egg yolk enrichment started the easiest to flow. However, there is a tendency for blood products to produce a slightly more cohesive texture with a higher yield stress. In the case of the consistency index, two groups could be separated according to the Tukey HSD. There was a large overlap between the two groups. There were four sample groups, which belonged to only one separated group. The sample groups enriched with blood plasma, haemoglobin and whole blood had significantly lower consistency index, and the sample group enriched with egg yolk had a significantly higher consistency index. This can be explained by the hardening effect of the heat-treated protein network of blood proteins and the fat content of egg yolk, which “diluted” the binding components Tukey HSD could separate two groups in the case of flow behaviour index as well, but the overlap was only one sample group: the control sample. Thus, it can be declared that none of the enriched sample groups was significantly different from a part of the control samples. Sample groups with egg-origin enrichments had the lowest and sample groups with blood-origin enrichments had the highest flow behaviour index. The nominal difference between the two separated groups was very small. This also shows that all sample groups could be described by the same rheological model with similar curve parameters. Another interesting observation is that the standard deviation for the control samples was higher than for the enriched samples for all rheological attributes. This can be explained by the presence of binders and emulsifiers in the enrichment materials, which can help to form a more homogeneous texture.

3.2. Colour Attributes

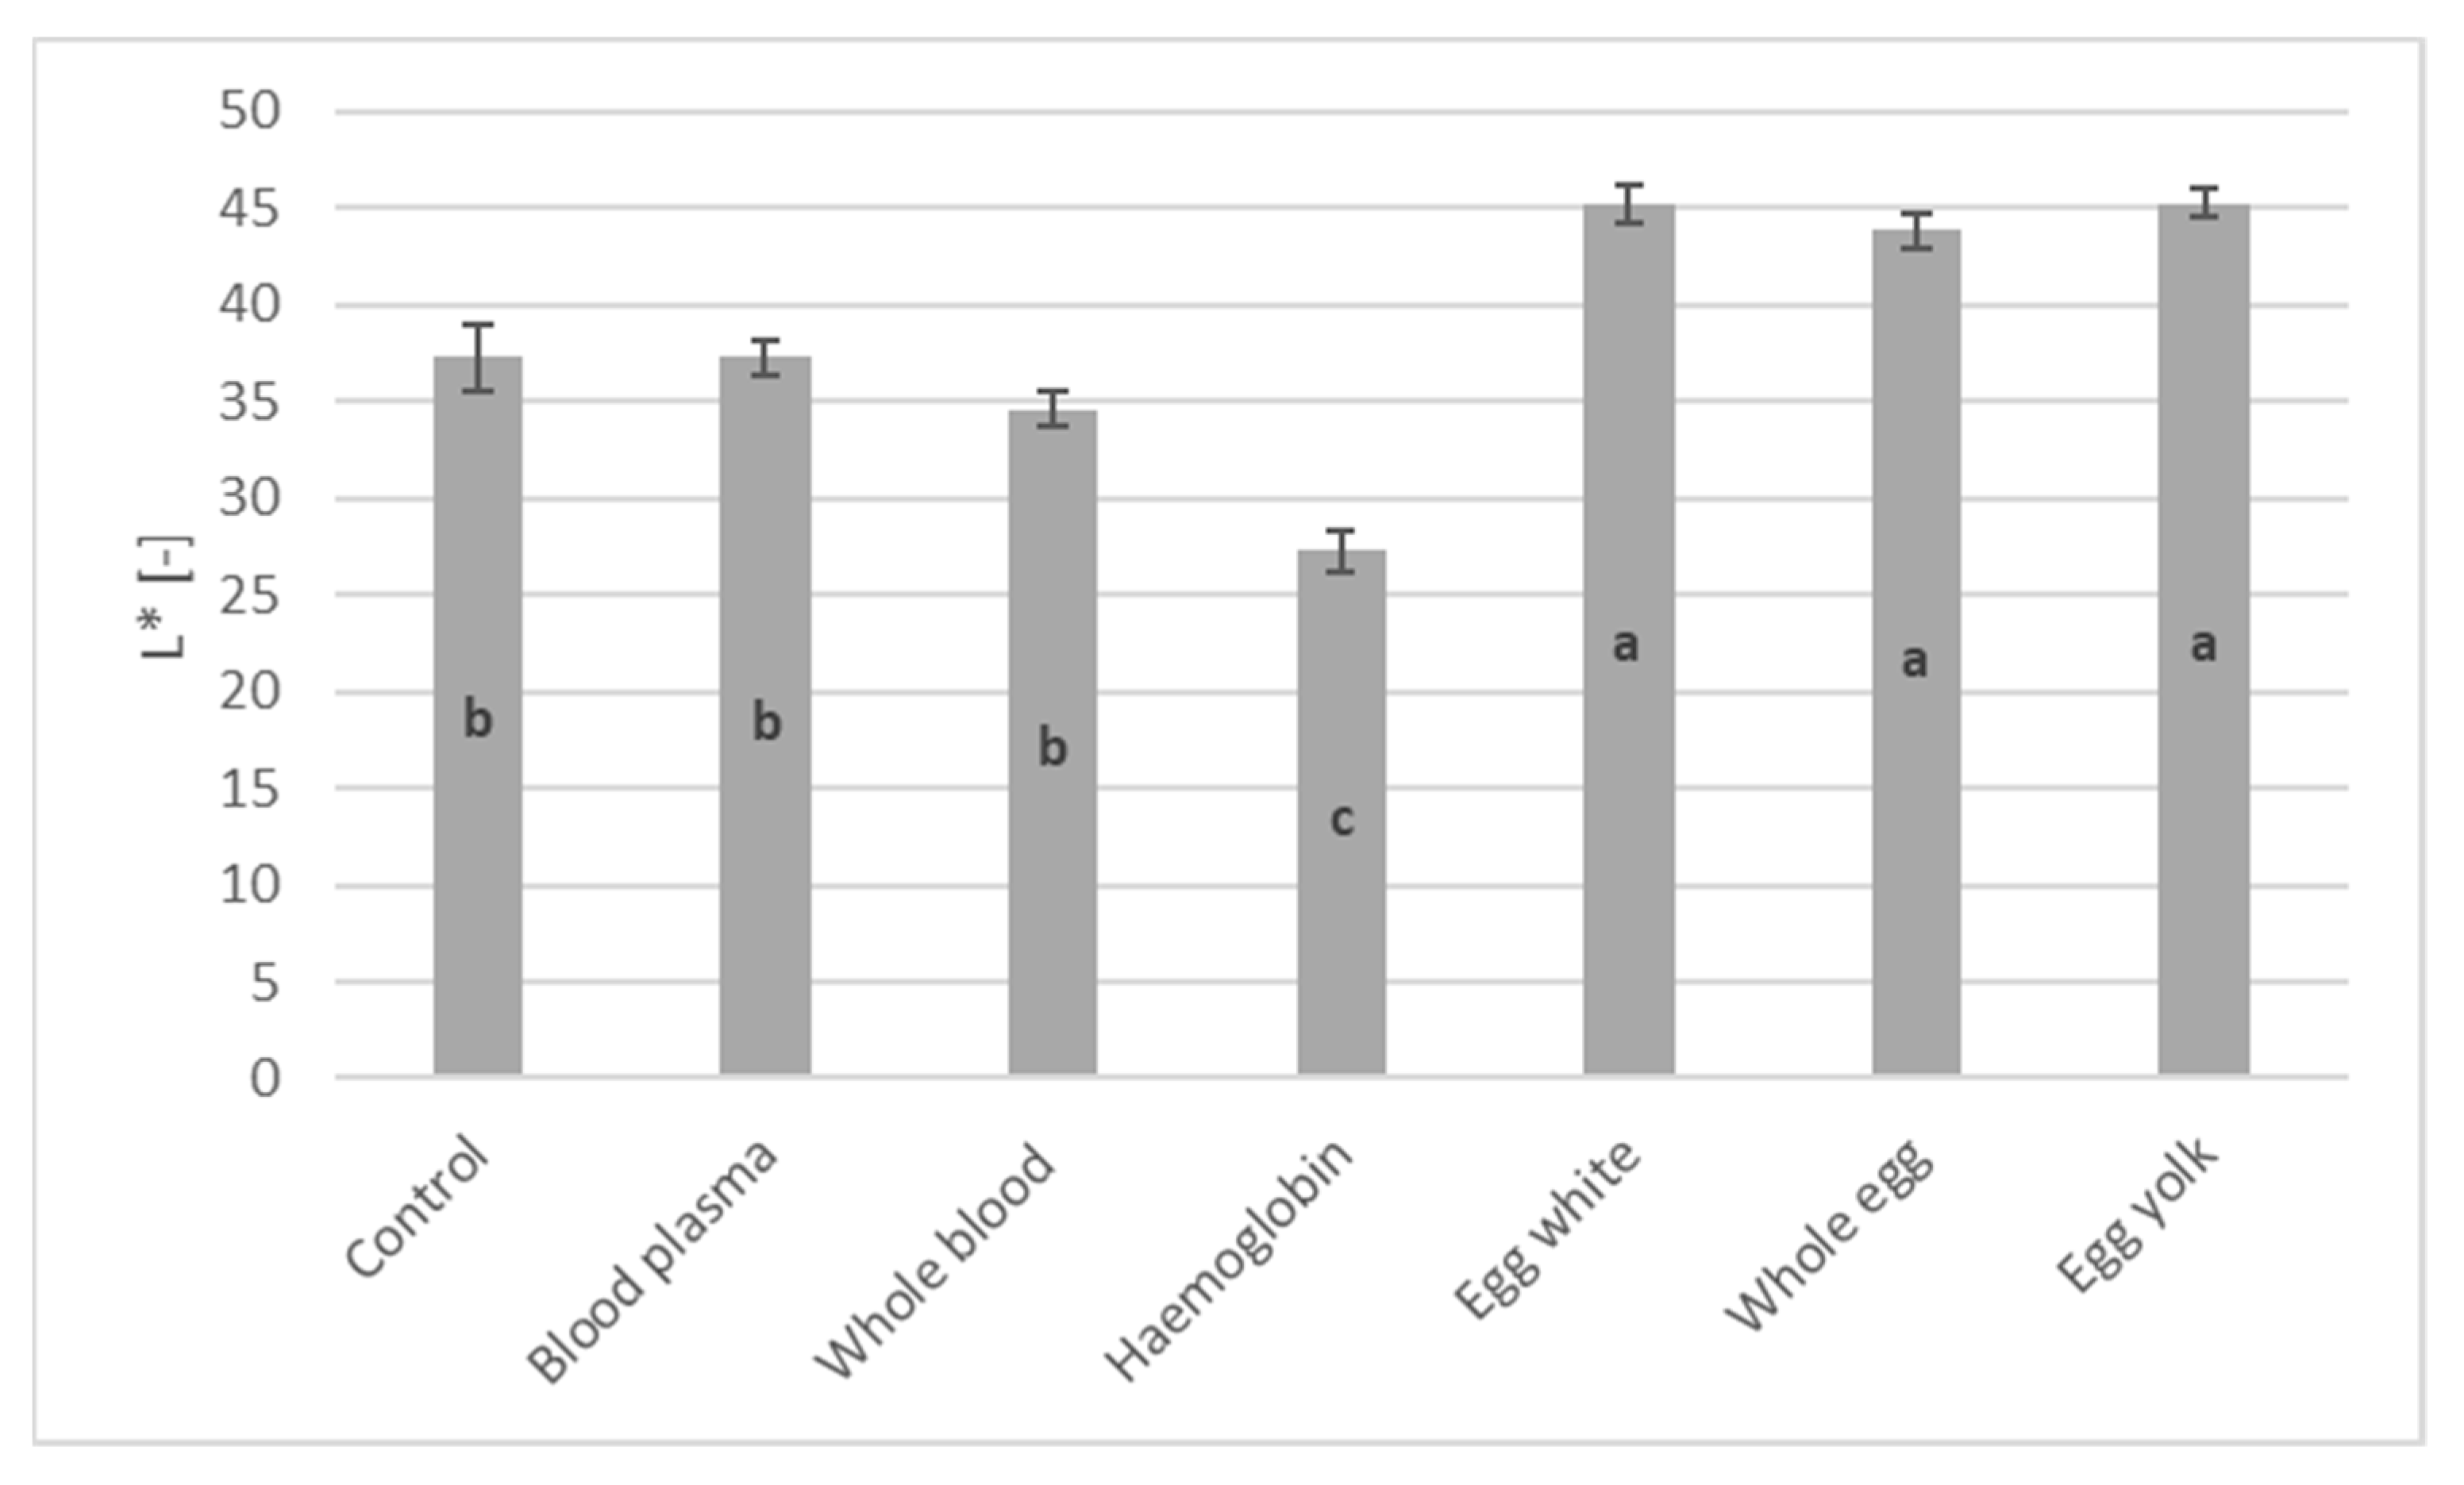
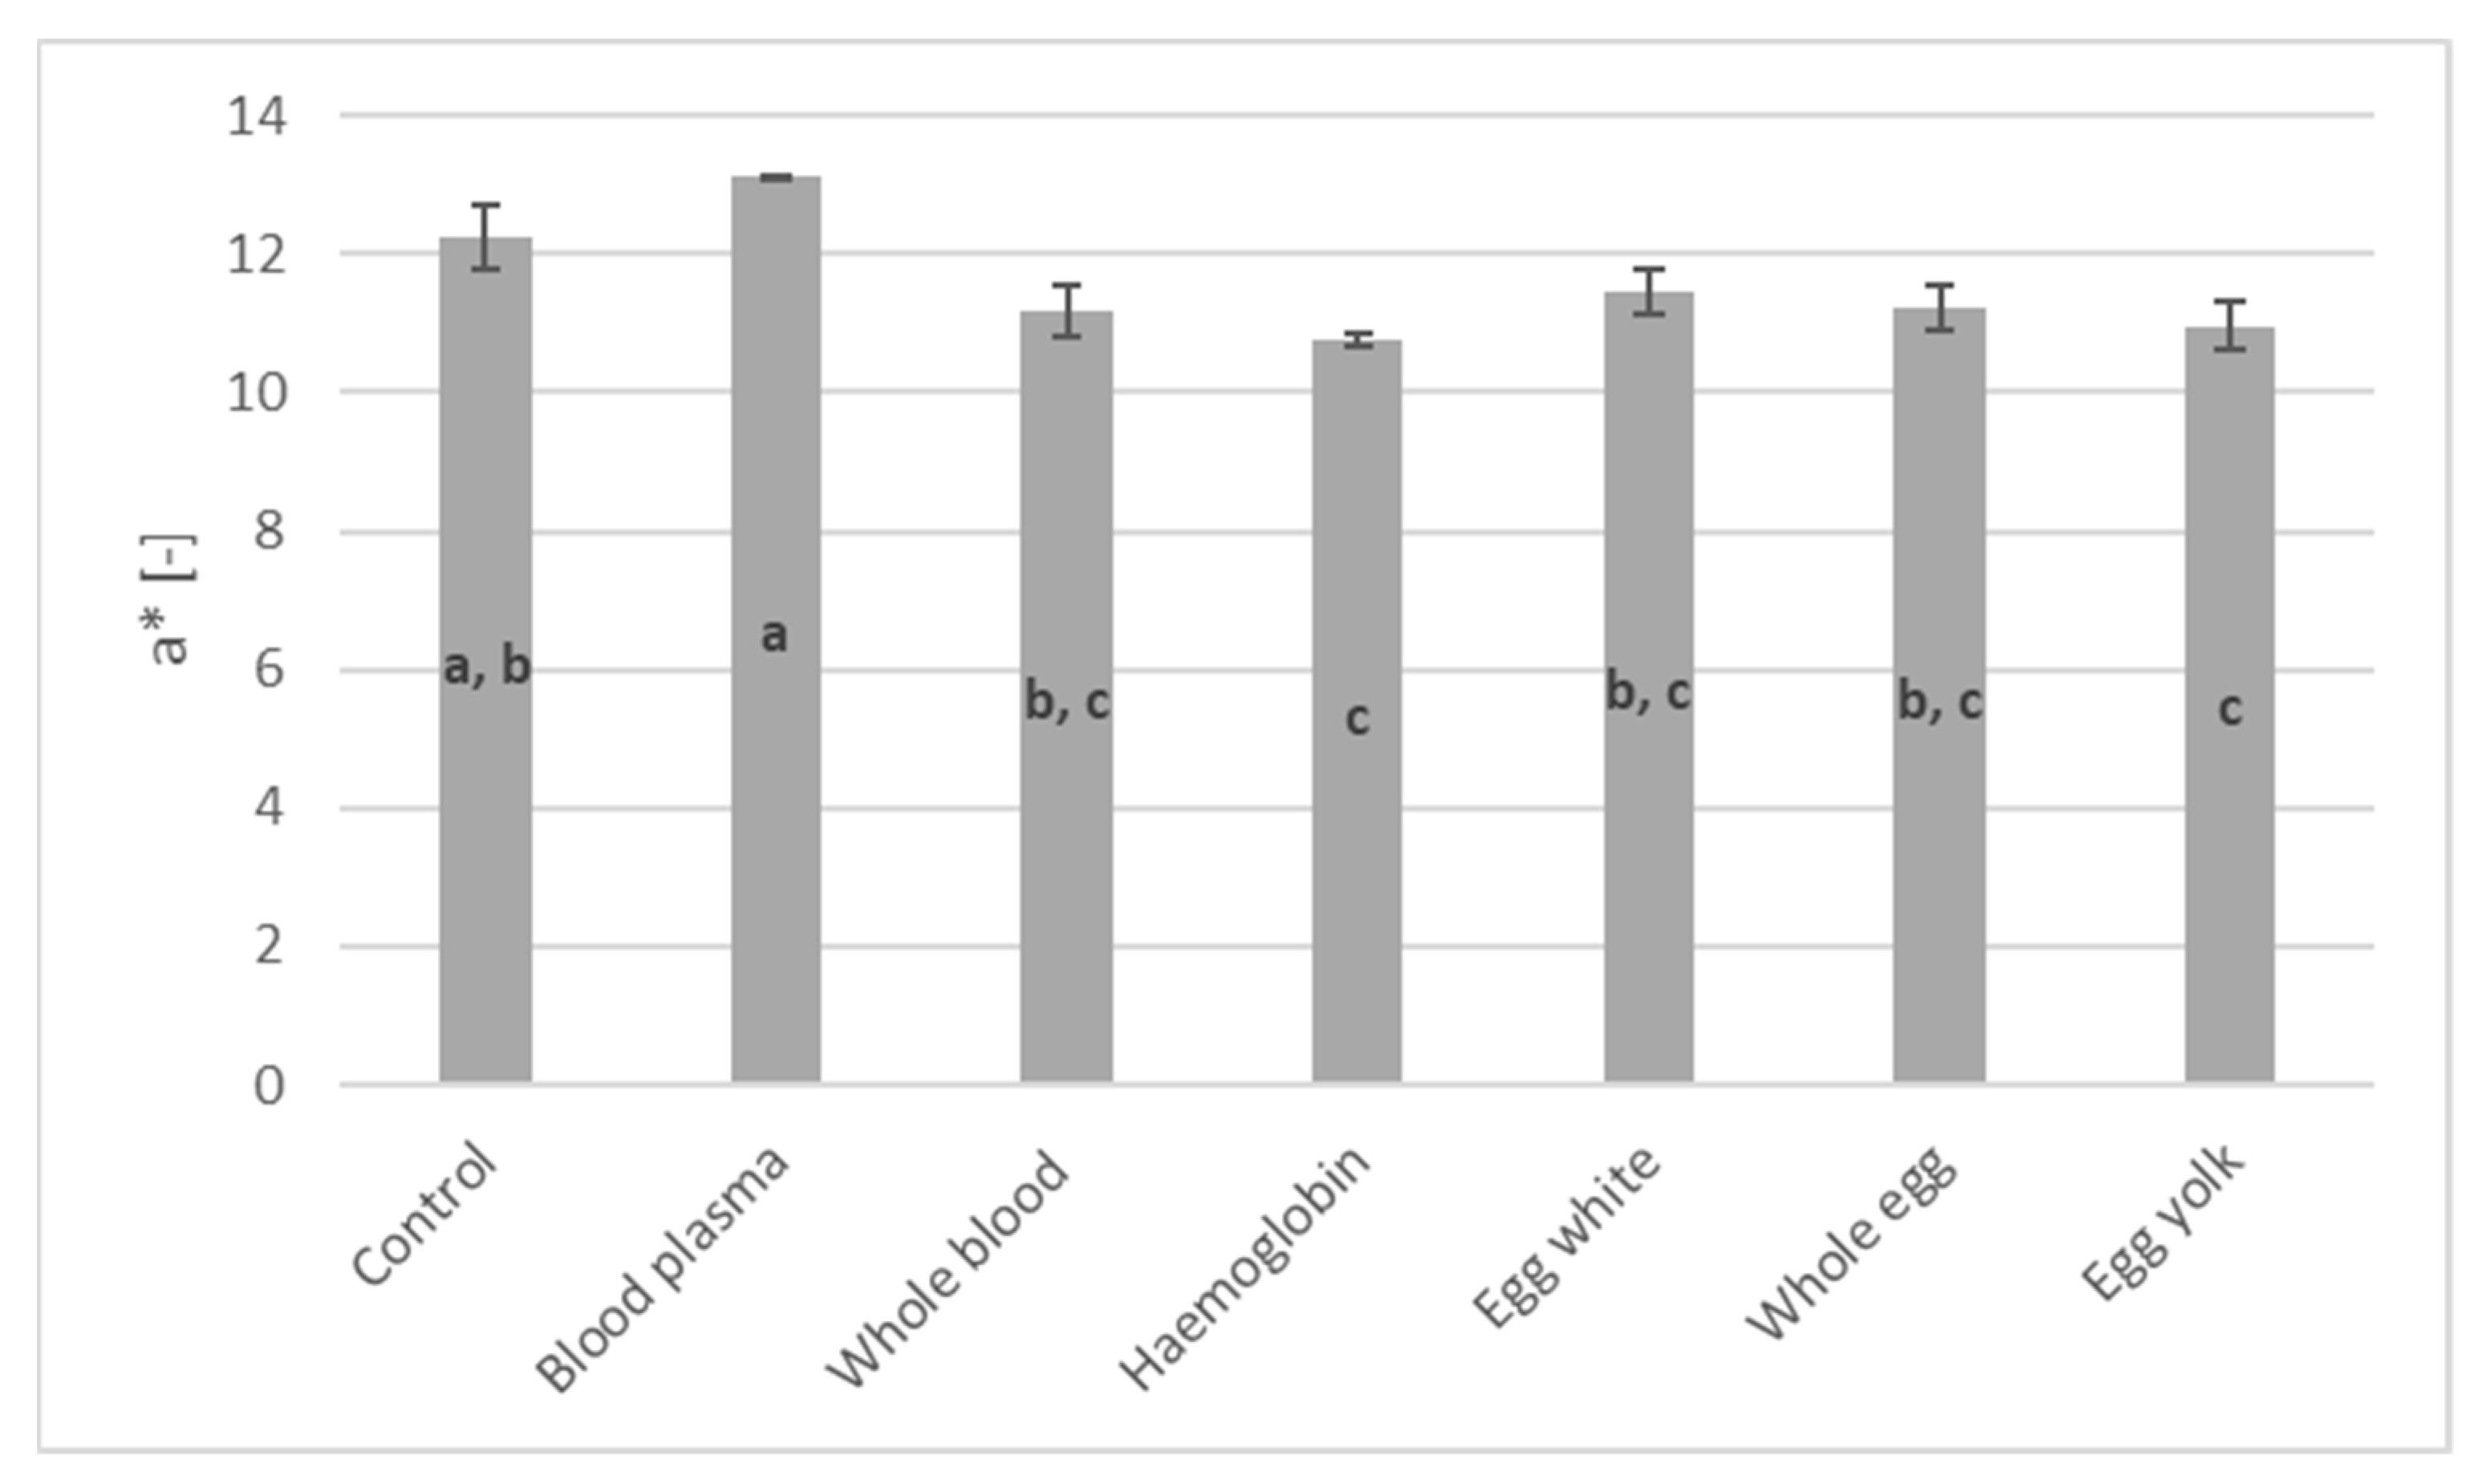
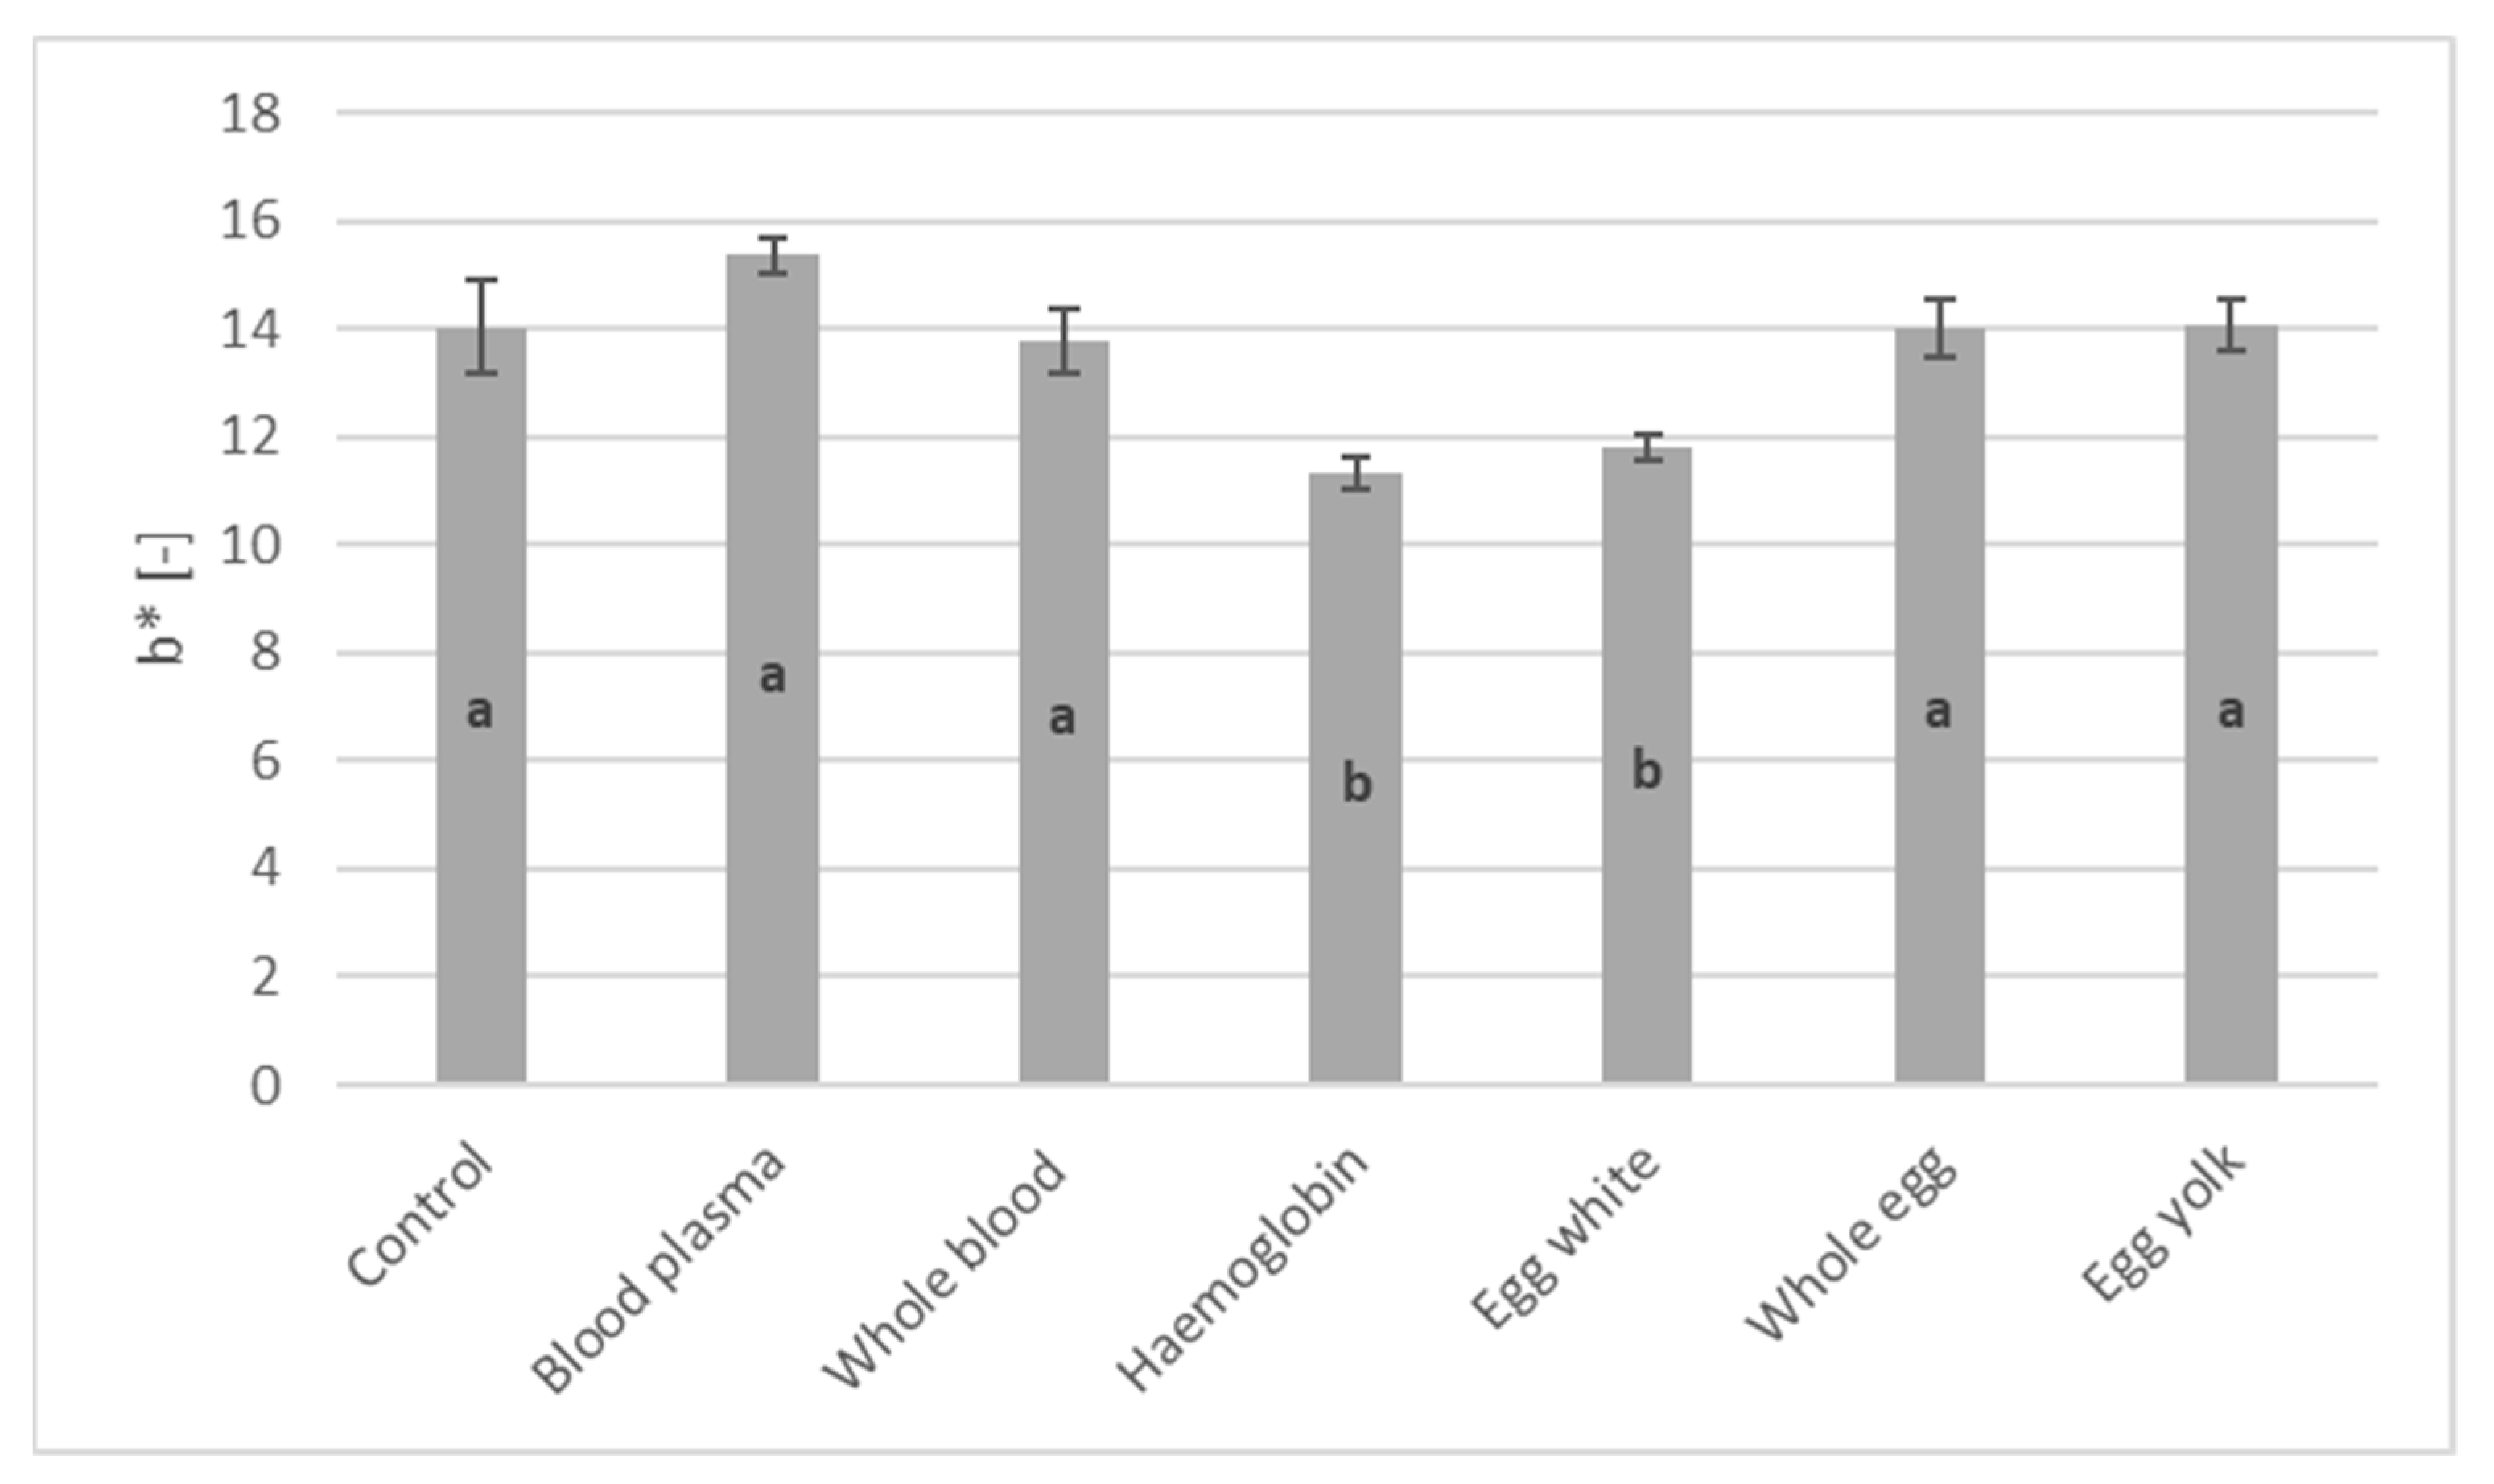
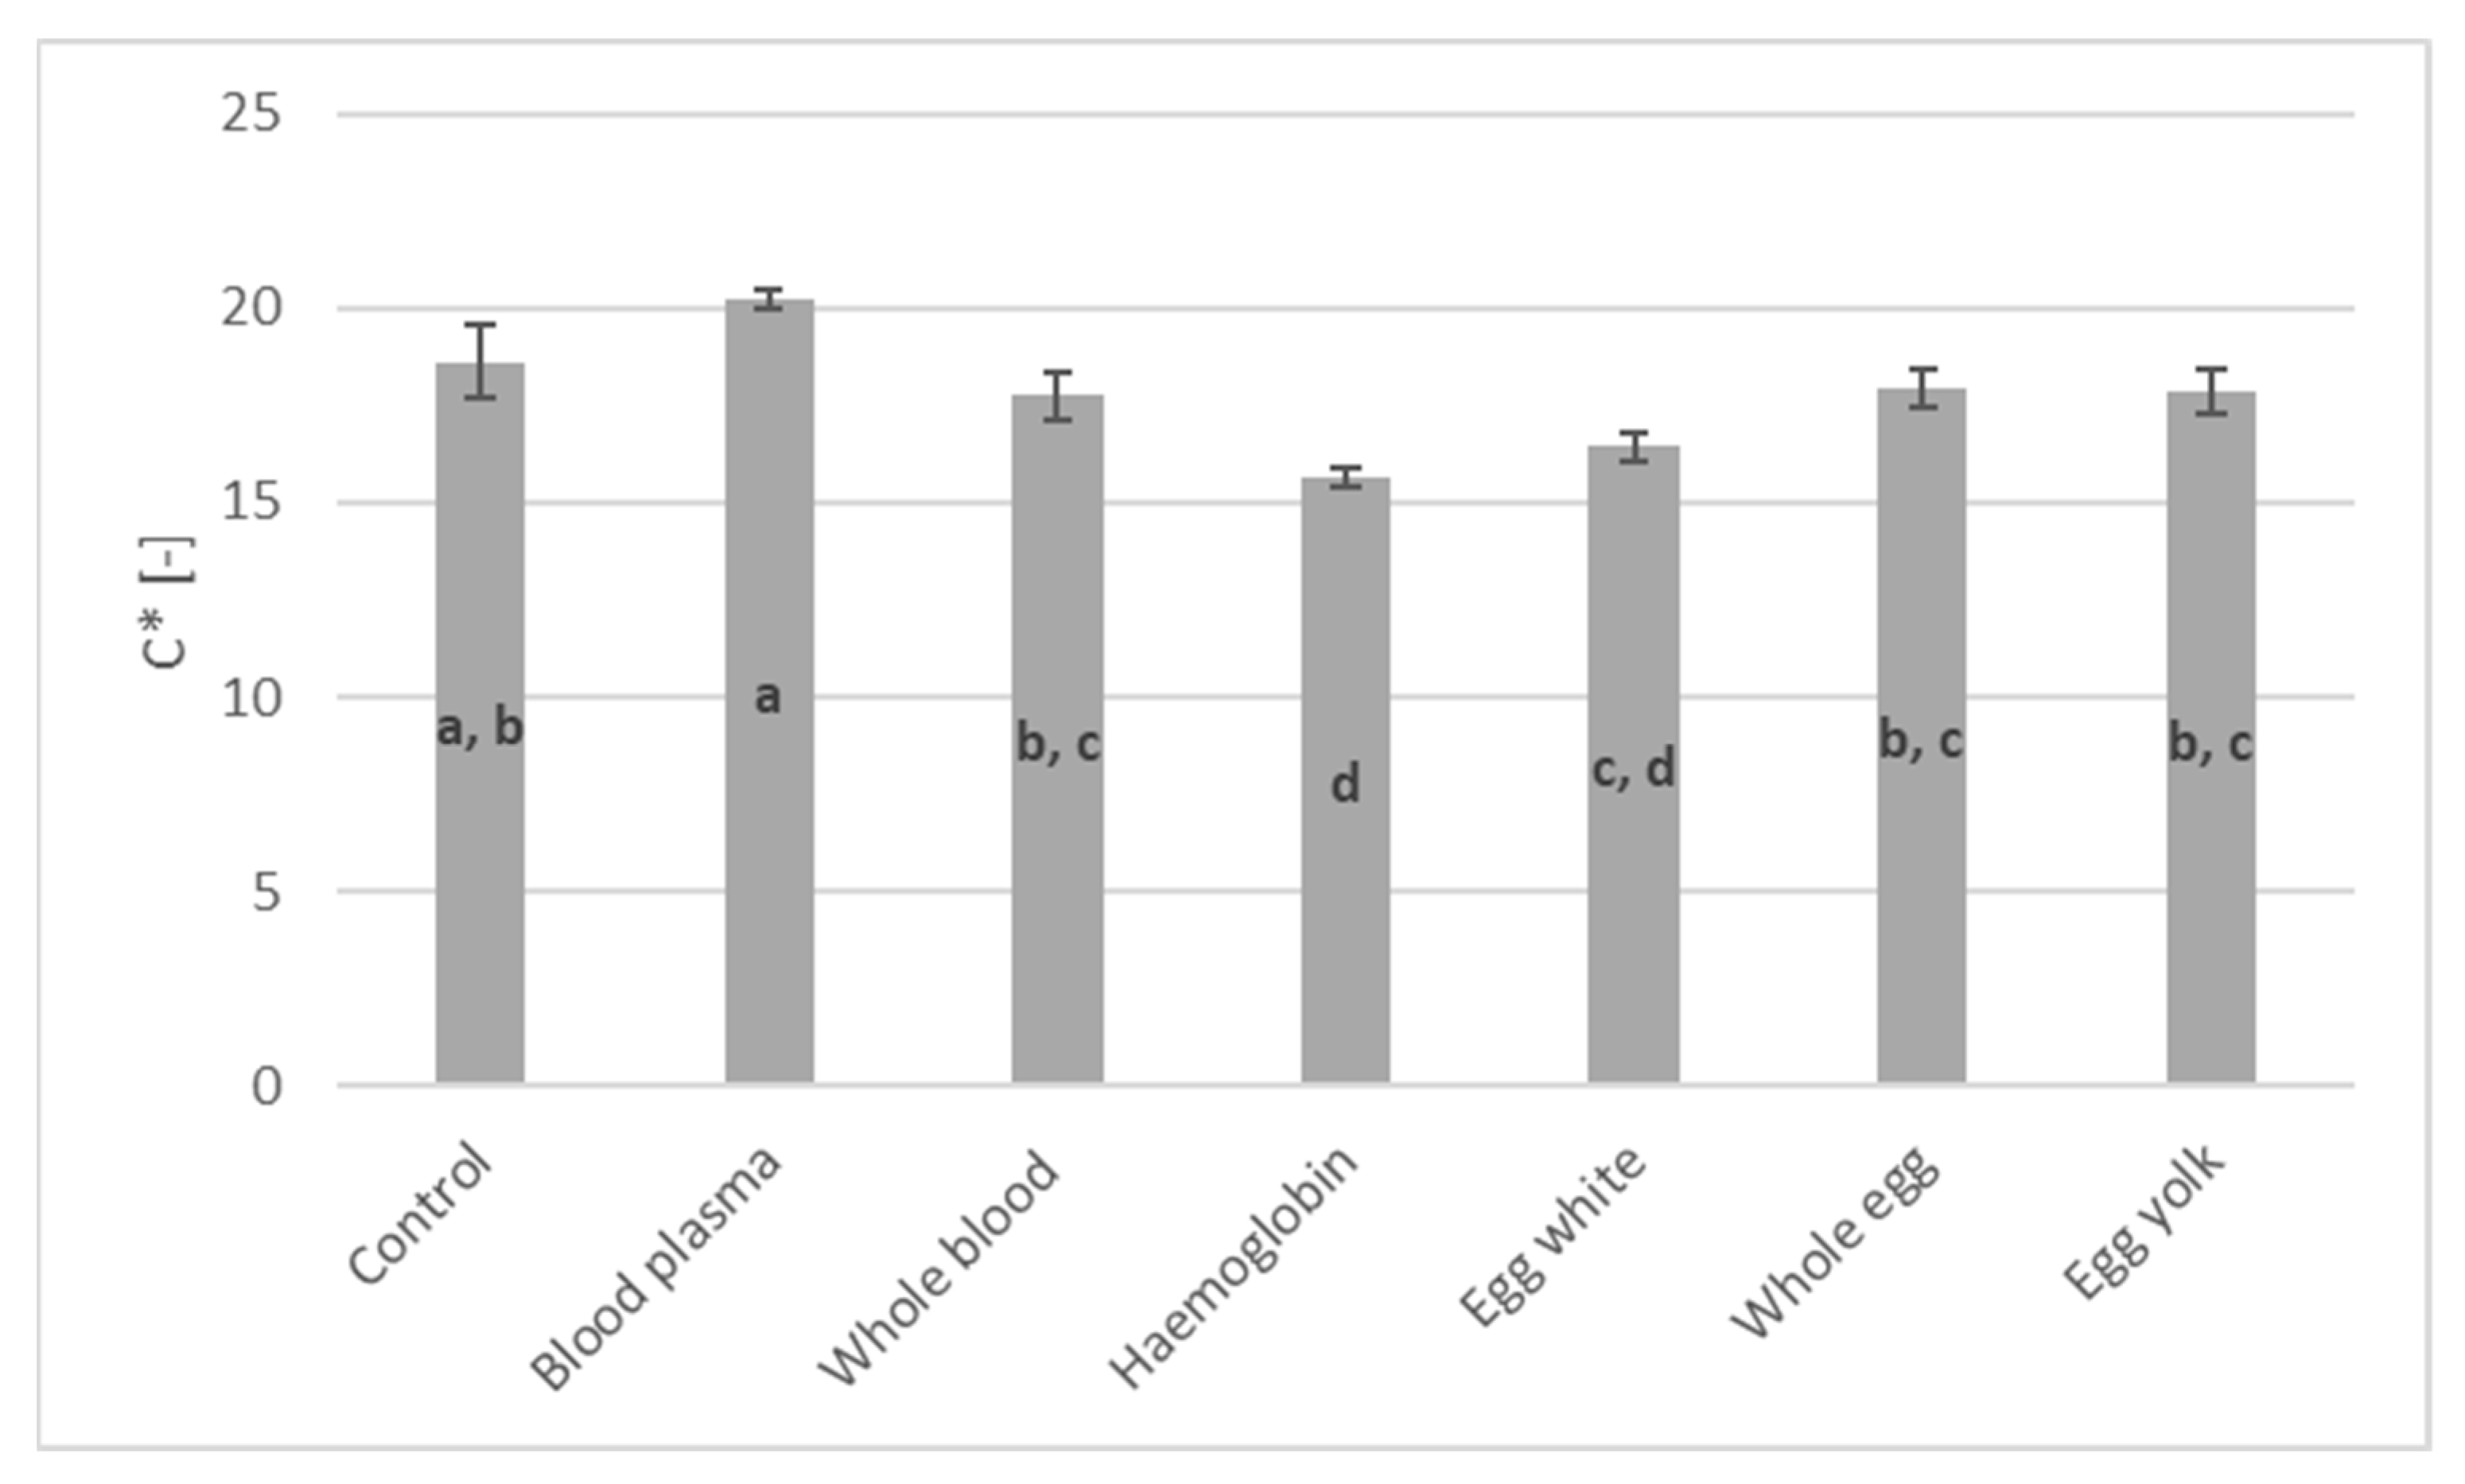
After checking equality of error variances [L*: F(6,53) = 1.934, p = 0.092; a*: F(6,53) = 6.853, p < 0.001; b*: F(6,53) = 7.031, p < 0.001; C*: F(6,53) = 7.960, p < 0.001] and normal distribution of residuals [L*: W(60) = 0.991, p = 0.931; a*: D(60) = 0.136, p = 0.008; b*: W(60) = 0.971, p = 0.159; C*: D(60) = 0.110, p = 0.067], results were evaluated by MANOVA. The overall MANOVA result was significant for the sample types with different enrichments and marks a strong relation between the enrichments and the colour attributes (Wilks’ lambda: 0.016, p < 0.001). The colour attributes of different sample groups are shown in Figure 4, Figure 5, Figure 6 and Figure 7. In the case of lightness, the groups were well separated according to the result of MANOVA. Haemoglobin-enriched samples were the darkest because the haemoglobin turned black as a result of heat treatment [32]. Thus, red colourisation could not be observed in the case of whole blood and haemoglobin. The sample groups were enriched with whole blood and blood plasma and the control sample group had a medium lightness value. This could be explained by the lower water content of the control sample. The firmer, more concentrated control sample could absorb more and reflect less light. The haemoglobin and residual haemoglobin content of whole blood and blood plasma could result in a darker colour as well. The sample groups with egg-origin enrichments were the lightest because these contained the less dark pigments. The proteins of the plasma, through their foaming effect besides the extra bindings that stabilize the texture, probably also added air into the colloidal system, which is responsible for the higher lightness value observed in plasma-enriched ice creams [42,43]. The foamier ice cream, rich in small air bubbles, reflected more light. The nominal differences in the lightness between the separated groups were great. The difference between these three groups was visible to the naked eye. In the case of redness–greenness and yellowness–blueness, the nominal differences were very small, but a small significant difference could be observed. In case of redness–greenness, three groups could be separated by Tukey HSD: (1) the sample groups with egg and blood-origin enrichments except the blood plasma were less red; (2) the sample groups with blood-origin enrichments except the blood plasma and a part of the control sample group were more red; (3) and a part of the control sample and sample group enriched with blood plasma were the reddest. In the case of yellowness–blueness, the sample groups with haemoglobin enrichment and egg white enrichment were significantly bluer than the other sample groups, but there was no difference between these. Possibly the residual non-coagulated bluish-purple hem pigments, saturated with carbon dioxide, were the reason why haemoglobin and whole blood pore products were bluer [44]. As all samples are on the yellow side of the blueness–yellowness scale, the less yellow colour of the sample with egg white enrichment can be explained by the less yellow pigment that comes from the egg yolk. So, the bluer colour means closer to neutral in this case. Tukey’s HSD could separate four groups with overlaps based on chroma. Chroma resulted from redness–greenness and yellowness–blueness result. The sample group enriched with haemoglobin had the lowest and the sample group enriched with blood plasma had the highest chroma value.

3.3. Hardness of Frozen Ice Cream, Dry Matter Content, pH

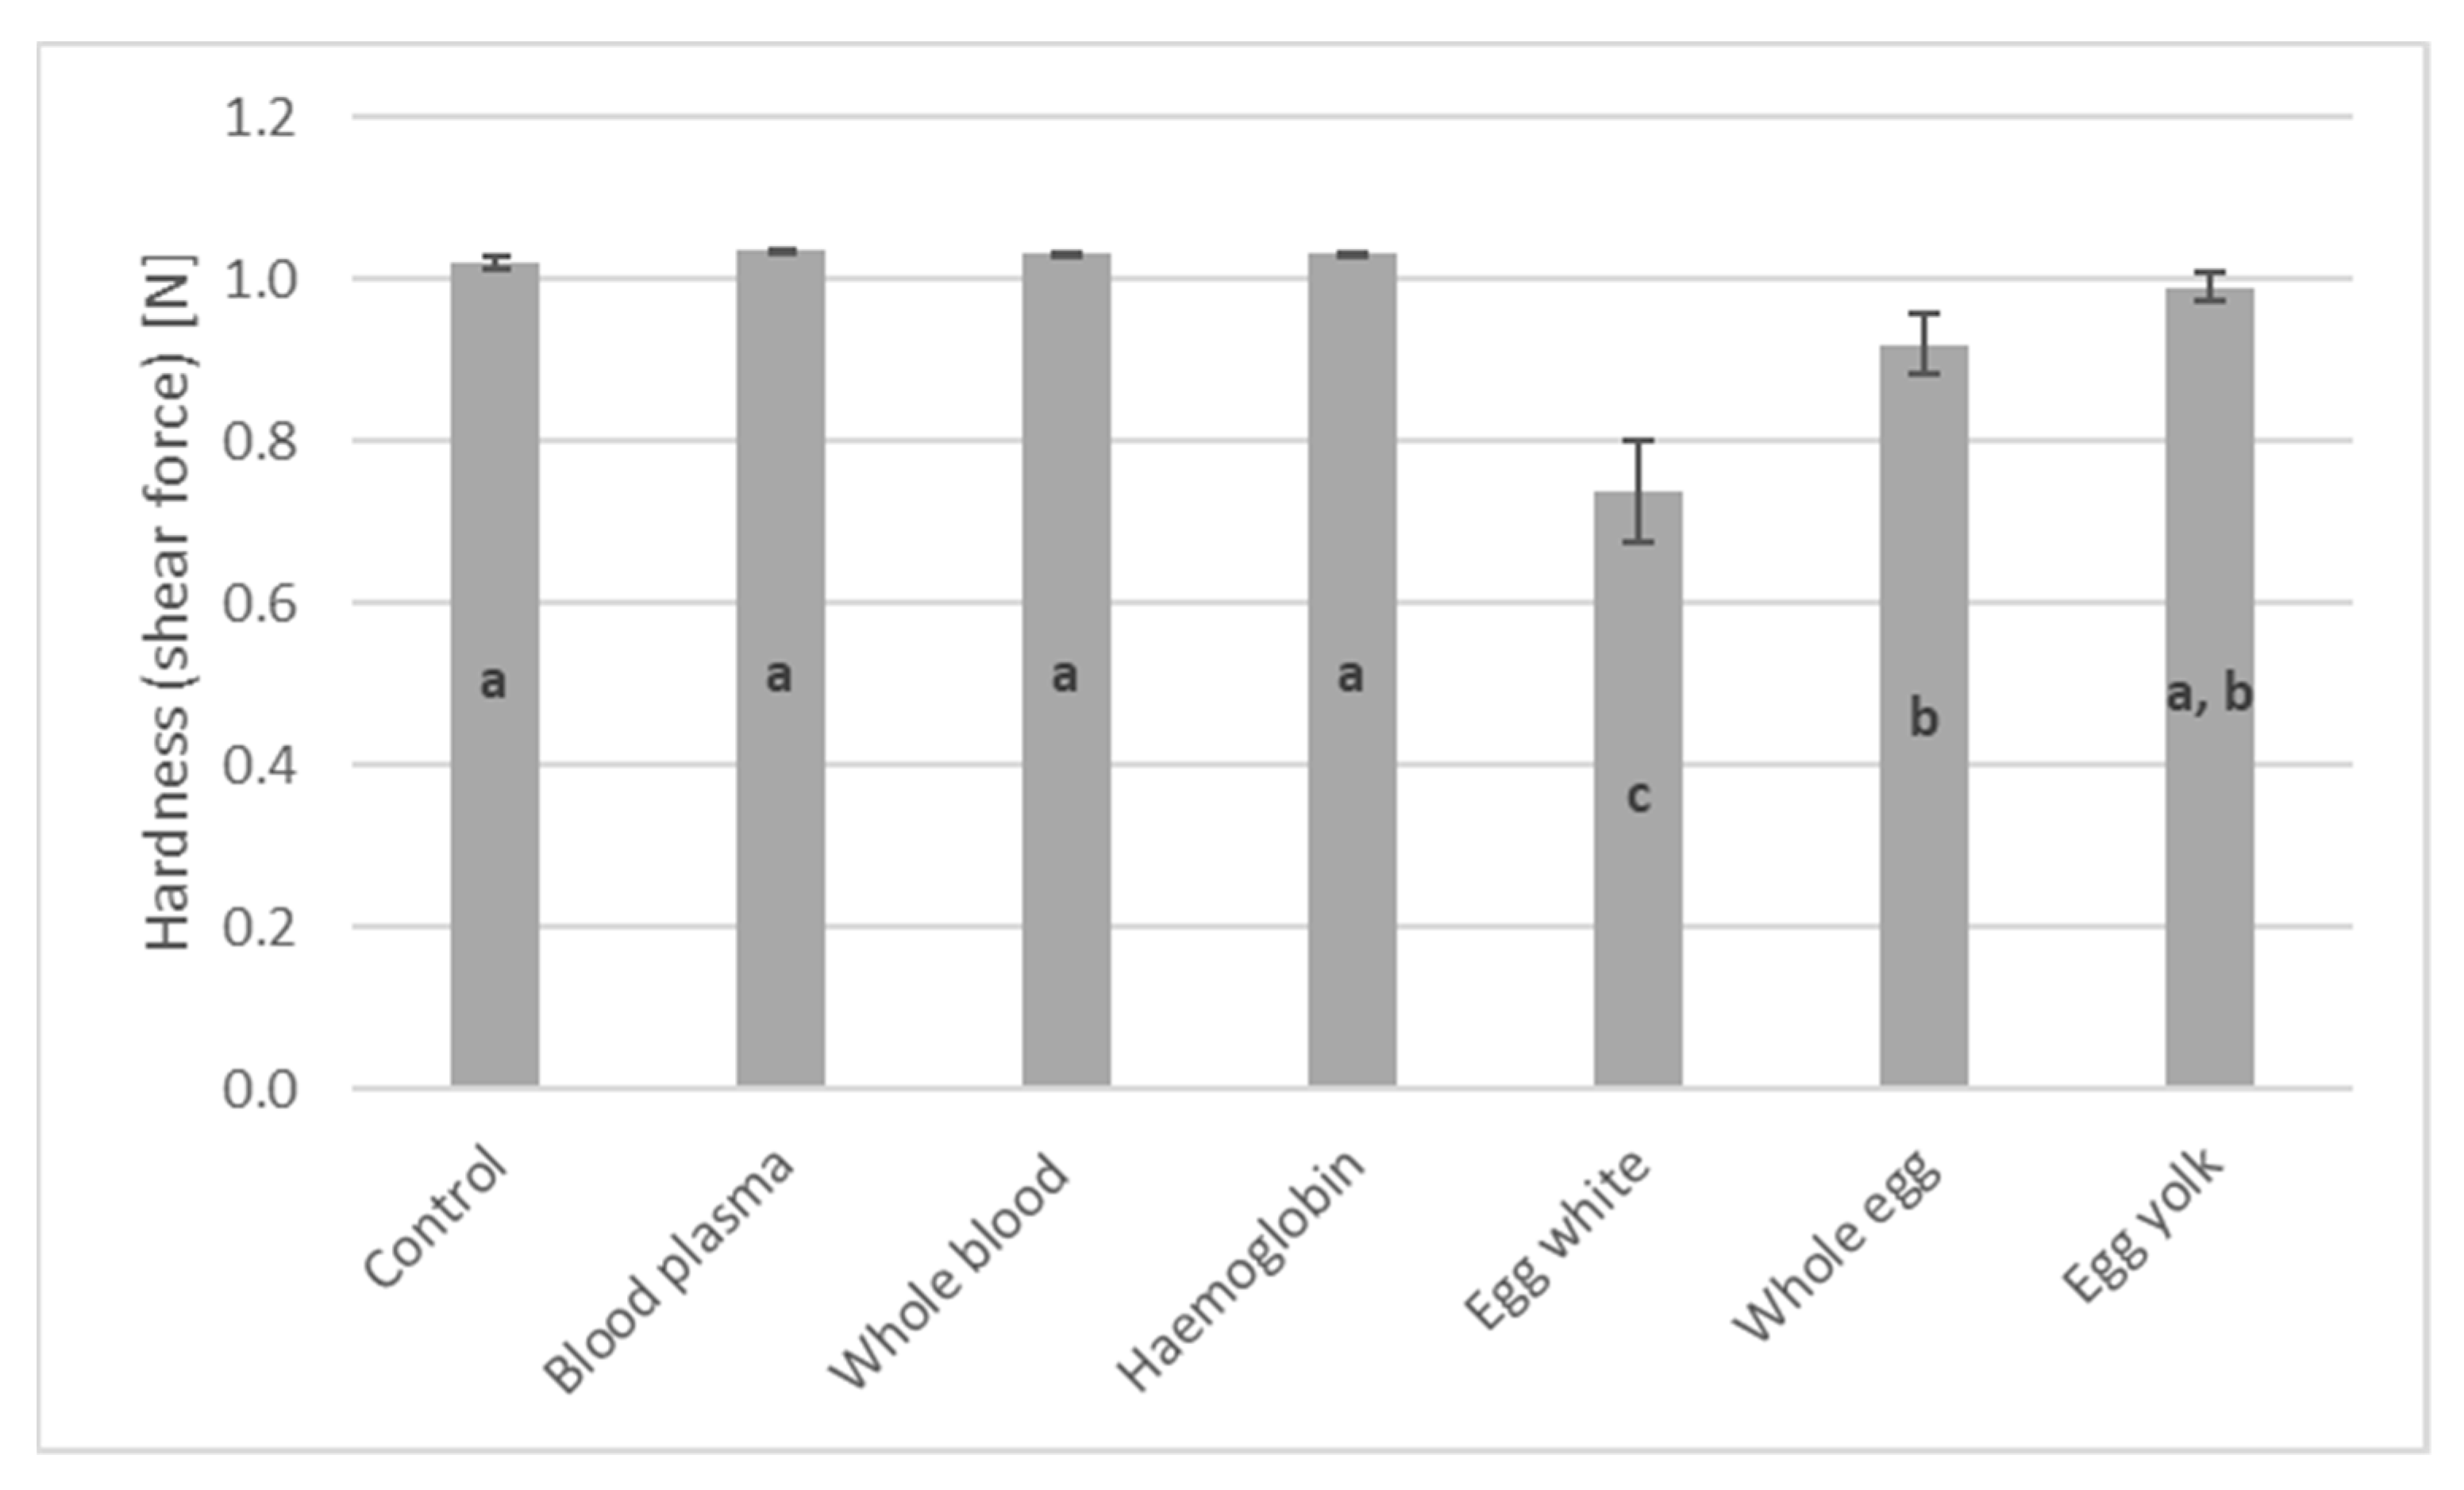
After checking equality of error variances [hardness: F(6,49) = 27.914, p < 0.001; DMC: F(6,49) = 2.924, p = 0.016; pH: F(6,49) = 0.902, p = 0.501] and normal distribution of residuals [hardness: D(56) = 0.314, p < 0.001; DMC: D(56) = 0.195, p < 0.001; pH: W(56) = 0.988, p = 0.866], results were evaluated by MANOVA. The overall MANOVA result was significant for the sample types with different enrichments and marks a very strong relation between the enrichments and the measured other techno-functional attributes (hardness, DMC, pH) (Wilks’ lambda: 0.001, p < 0.001). The hardness results are shown in Figure 8. In the case of hardness, three groups could be separated by the Tukey HSD. The control sample had the lowest water content and the highest fat content, as well as the frozen fat content, which hardened the texture. The sample group enriched with egg white was the softest. It was interesting because the texturisation effects of egg white and blood plasma proteins are similar [36,37]. Possibly it could be explained by the foaming effect of egg white proteins [45], which resulted in a lighter, softer texture, and the foam of rehydrated blood plasma was broken during the ice cream production. Therefore, only the hardening effect of blood plasma albumins could apply. The sample group enriched with whole egg and a part of the sample group enriched with egg yolk were harder. The foaming effect of liquid egg proteins could play a role in the softening of the texture. The foam could explain the greater deviation as well in the case of sample groups with egg-origin enrichments. All of the other sample groups and a part of the sample group enriched with egg yolk were the hardest and a significant difference was not found between these sample groups. It could be explained by the hardening and water-binding effect of blood proteins without their foaming effect because of the rehydration before further processing and the foam breaking during the ice cream production. Thus, a part of the sample group enriched with egg yolk could belong to the hardest separated group despite the foaming.
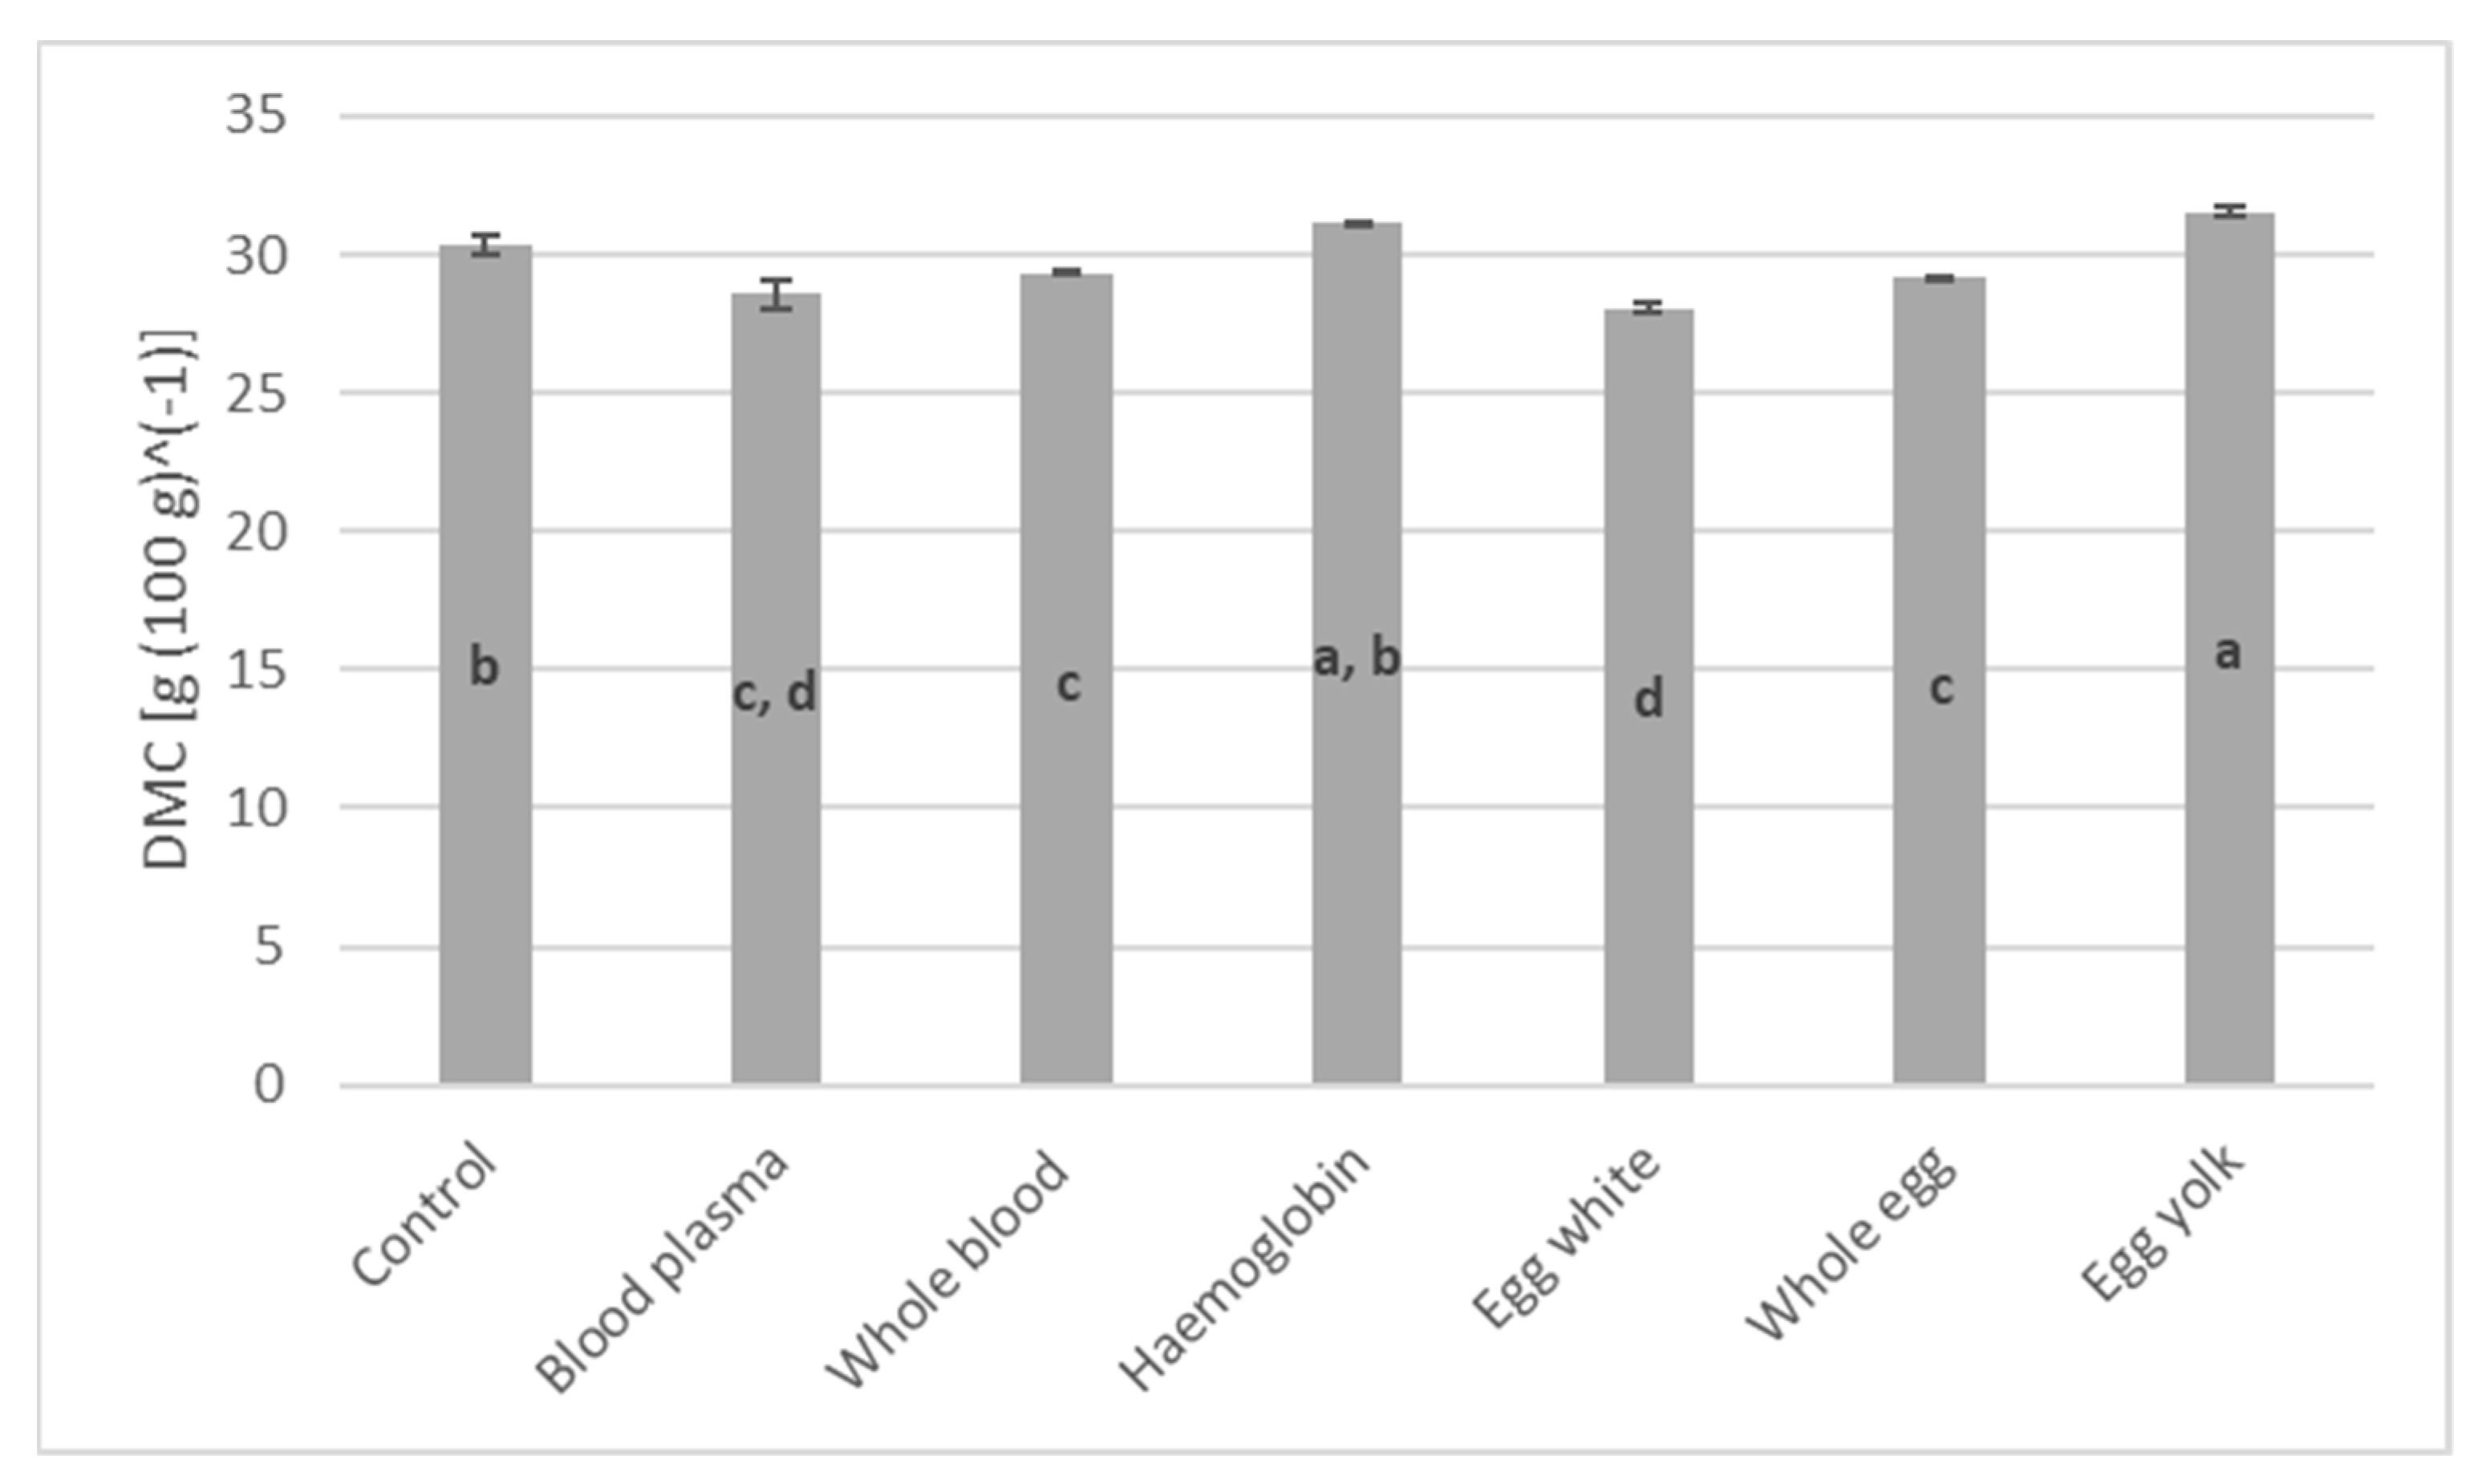
In the case of dry matter content, the results, which are shown in Figure 9, reflect the amount of enrichments and the water content of the enrichment materials. Egg yolk increased the fat content of the ice cream, while haemoglobin increased its protein content. The different water content, pigment content and protein content of the enrichment materials are also considered in the other measured properties.
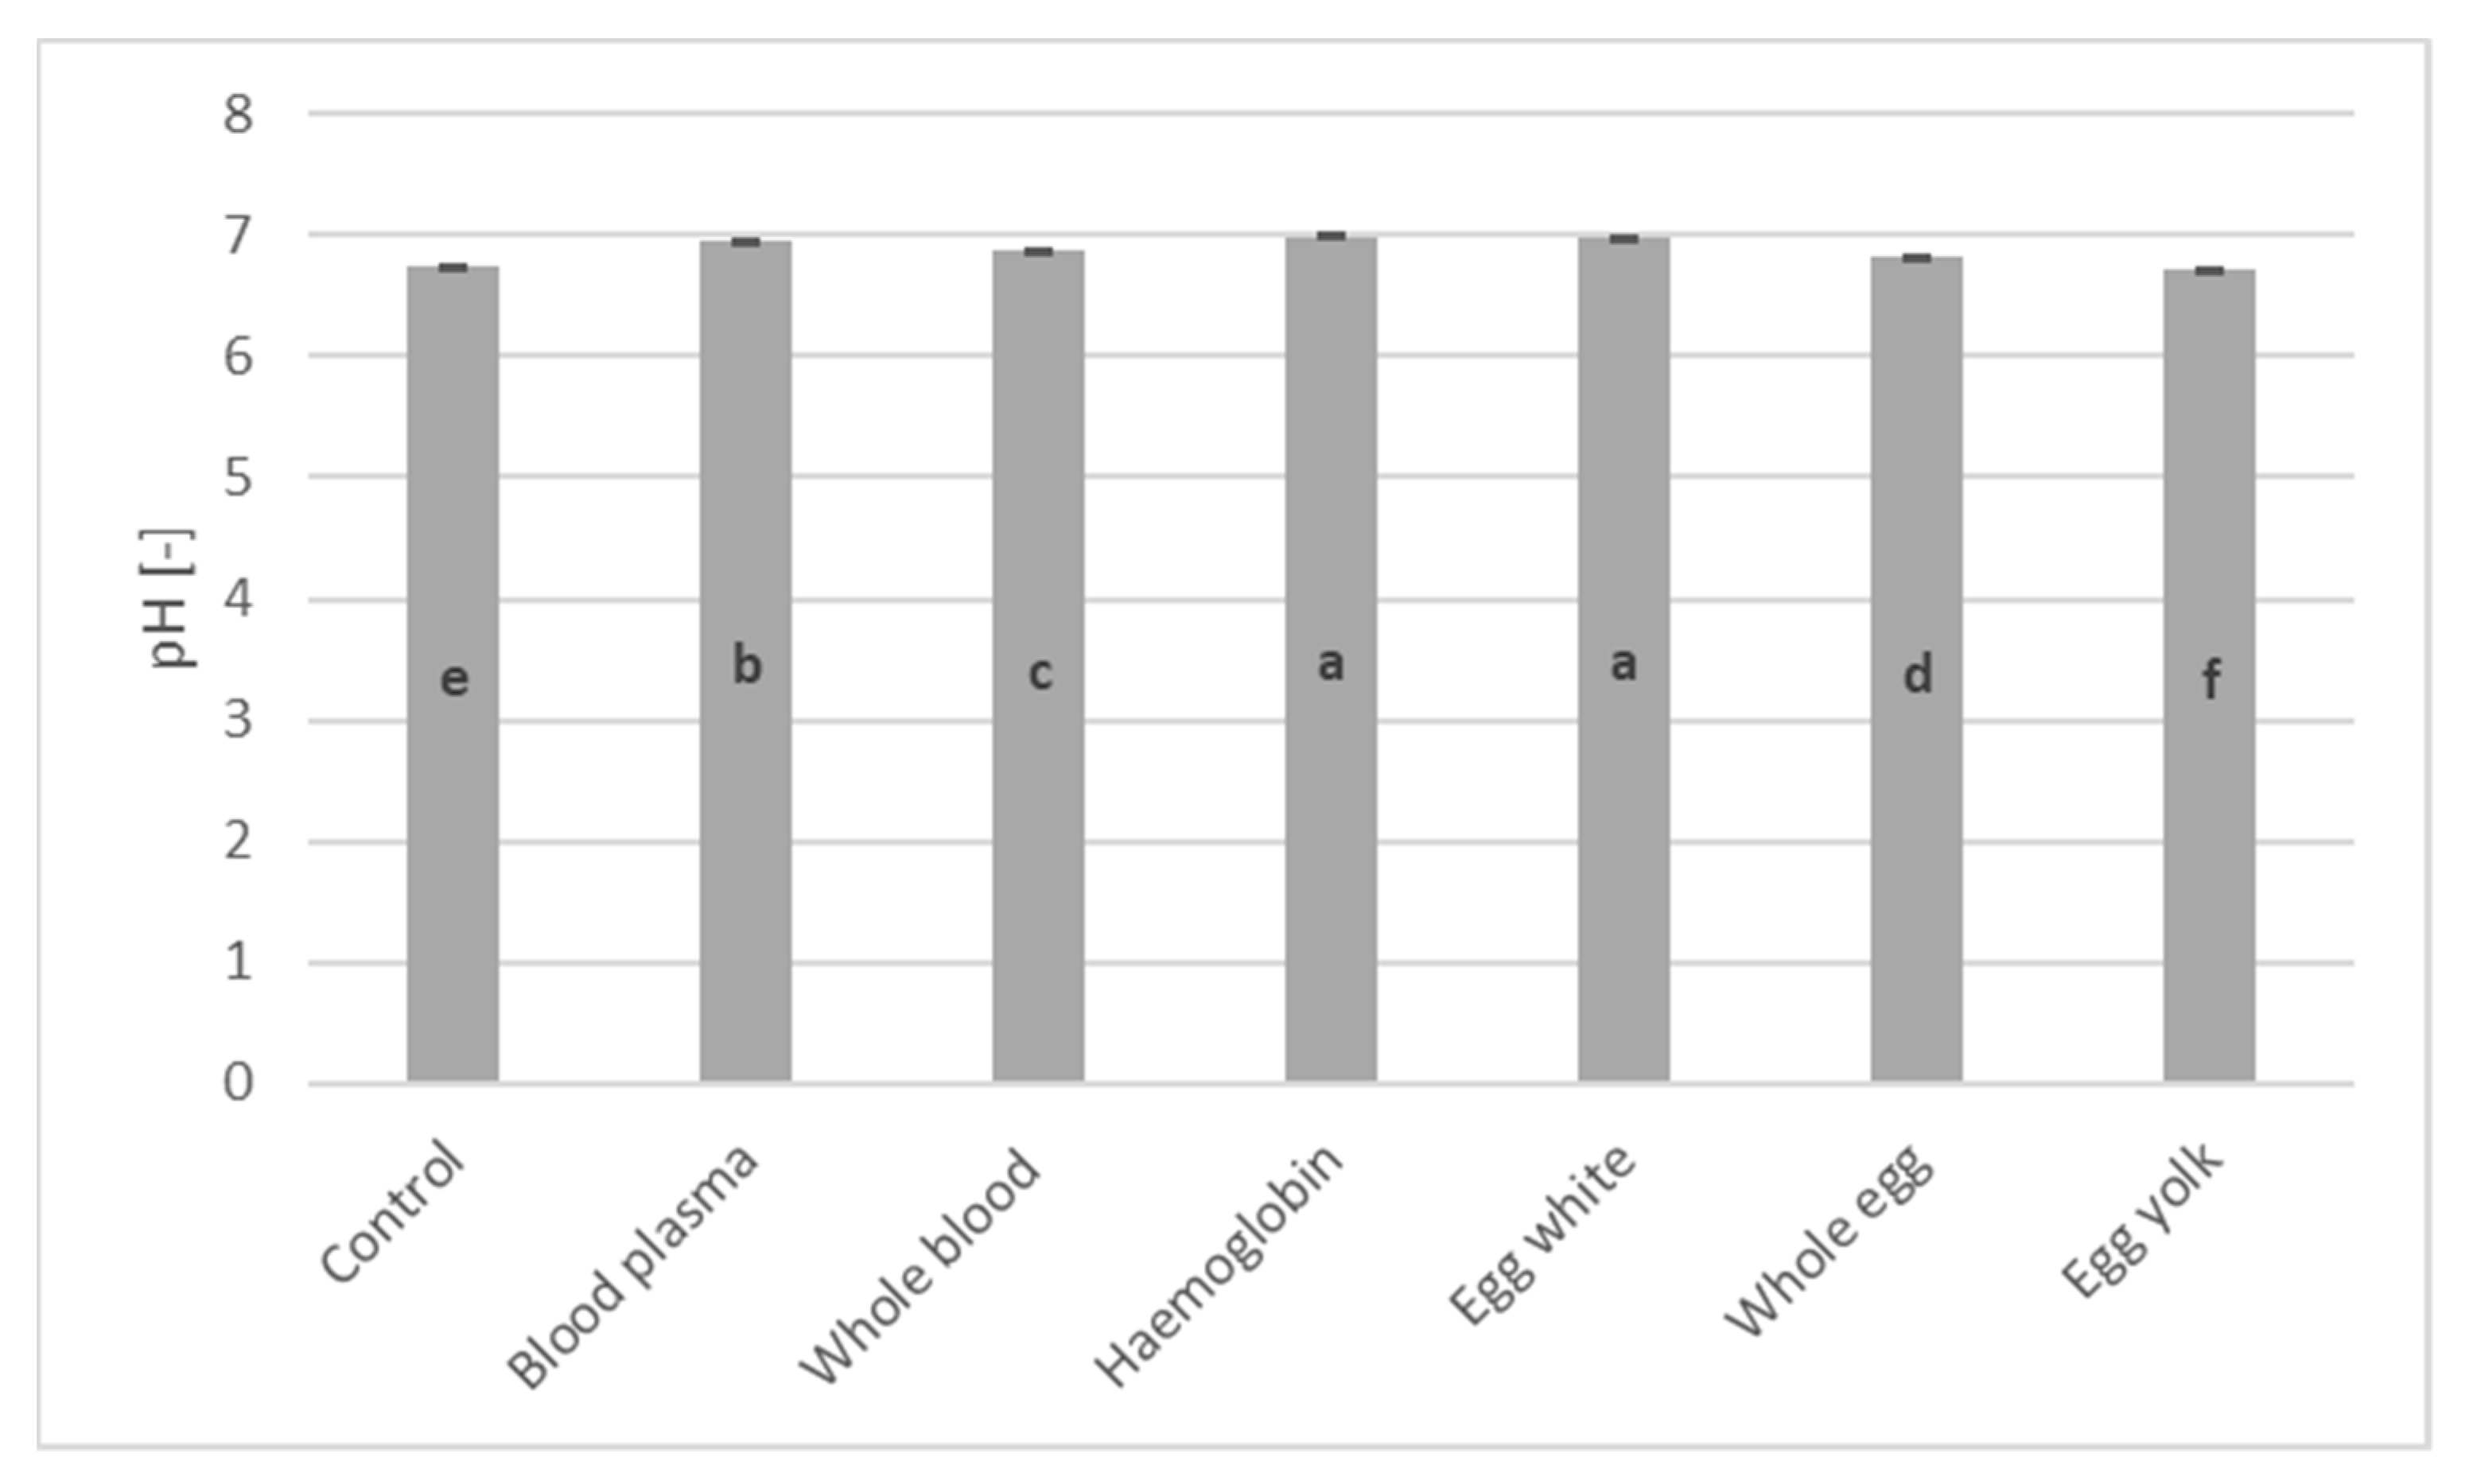
In the case of pH, six groups could be separated according to the Tuhey HSD post hoc test. The enrichment materials of sample groups, in increasing order of pH, were as follows: egg yolk, control, whole egg, whole blood, blood plasma, and, lastly, egg white and haemoglobin, which are not significantly different from each other. A trivial fact could be observed during the evaluation of pH results. The pH of used liquid egg products was the following based on our measurements: (1) egg white, 9.10 ± 0.04; (2) egg yolk, 6.38 ± 0.02; and (3) whole egg, 7.39 ± 0.05. According to the literature, the pH of egg proteins is between 7.6 and 9.4 and it changes during storage because of the carbon dioxide emission [46,47]. Blood proteins also have a basic pH and the ions in blood have a puffer capacity as well. These puffer effects influenced the pH of the base ice cream mix. The pH results are shown in Figure 10.

3.4. Sensory Properties

Statistical evaluation of sensory attributes is not possible with the limited number of panellists available, but trends and valuable information can be extracted from them. The results of sensory properties are summarised in Table 1. In the case of colour preference, the control sample and the samples enriched with blood products had similar values, while the samples enriched with egg products, which were slightly lighter, were less preferred by consumers. This can be explained by the fact that consumers expect a high-quality chocolate ice cream to be darker in colour, and it is associated with higher cocoa content. Based on colour only, panellists preferred the samples enriched with whole blood, although this cannot be stated with certainty due to the large standard deviation.
In the case of flavour preference, chocolate flavour intensity and chocolate aroma intensity, the standard deviation was much higher, but the trend is clear: the control samples and the samples enriched with blood plasma were the most preferred samples. It could be explained by the higher salt content of blood plasma, the taste sensation of which is synergistic with the intensity of other flavours as well as of the chocolate flavour [48,49]. These three attributes are related to each other. Most of the panellists gave the same rank to the chocolate flavour intensity and chocolate aroma intensity because in the case of an ice cream, smell is irrelevant. So, non-expert panellists cannot distinguish taste from aroma.
Panellists felt that the control sample was the sweetest. This can be explained by the fact that the sugar content of the other samples was diluted with the enrichment materials. Interestingly, no differences in salty flavour intensity were found between the sample groups. Probably the salt added to the blood plasma was so low that it enhanced other flavours but could not be detected by itself.

4. Conclusions

In conclusion, this study investigated the effect of enriching ice cream with animal protein sources on its techno-functional properties. The results showed that the enrichments had a significant impact on the rheological attributes of the ice cream mix, as indicated by changes in yield stress and consistency index. However, the rheological behaviour, which means the model could be fitted on the measurement points, was not changed due to the enrichments. The frozen texture of the ice cream was also affected, with variations in hardness observed among the different enrichments. Additionally, the colour analysis revealed changes in the redness/greenness, yellowness/blueness and lightness of the ice cream samples, which were caused by the different pigments and foaming effects of the enrichment materials. The enrichments also significantly affected the dry matter content or pH of the ice cream. Through changes in these two properties, changes in several other properties could be partially explained. The trend-like results of the sensory analysis show that certain enrichments can improve the taste sensation and colour, making the nutrients in the enrichments more acceptable to consumers, especially children. The findings suggest that the enrichment of ice cream with animal protein sources can offer opportunities to develop more sustainable ice cream products with improved nutritional value and unique techno-functional properties. As the investigated matrix was based on a common ice cream recipe, stored at temperatures below −18 °C and consumed in a frozen state, it is not necessary to optimise the enrichment with protein ingredients to explore their effect on stability and shelf life. Overall, this study contributes to the understanding of the potential of animal protein sources in enhancing the properties of ice cream and expanding its product range to meet consumer demands for healthier, more nutritious and sustainable options. The results of this research can be used to make other similar foods more sustainable and highlight that certain animal proteins or by-products from more sustainable sources can be natural food additives due to their beneficial techno-functional properties.

Author Contributions

Conceptualization, T.C. and K.I.H.; methodology, T.C., K.I.H. and A.V.-T.; software, T.C.; validation, T.C. and K.P.-H.; formal analysis, T.C.; investigation, T.C. and K.I.H.; resources, L.F.F.; data curation, T.C.; writing—original draft preparation, T.C.; writing—review and editing, T.C., K.I.H., A.V.-T. and I.D.; visualization, T.C.; supervision, K.P.-H. and I.D.; project administration, T.C.; funding acquisition, L.F.F. All authors have read and agreed to the published version of the manuscript.

Funding

This research received no external funding.

Institutional Review Board Statement

Not applicable. (In the case of sensory analysis, panel members were informed that the samples contained animal blood, as some religions prohibit its consumption.)

Informed Consent Statement

Not applicable. (In the case of sensory analysis, panel members were informed that the samples contained animal blood, as some religions prohibit its consumption.)

Data Availability Statement

The data presented in this study are available on request from the corresponding author.

Conflicts of Interest

The authors declare no conflict of interest.

References

  1. Csurka, T.; Pásztor-Huszár, K.; Tóth, A.; Friedrich, L.F.; Németh, C. Animal blood, as a safe and valuable resource. J. Hyg. Eng. Des. 2021, 35, 41–47. [Google Scholar]
  2. Ockerman, H.W.; Hansen, C.L. Animal Byproduct Processing and Utilization; CRC Press: Boca Raton, FL, USA, 2000; ISBN 9781566767774. [Google Scholar] [CrossRef]
  3. Sorapukdee, S.; Narunatsopanon, S. Comparative study on compositions and functional properties of porcine, chicken and duck blood. Korean J. Food Sci. Anim. Resour. 2017, 37, 228. [Google Scholar] [CrossRef] [PubMed]
  4. World Health Organization; United Nations University. Protein and Amino Acid Requirements in Human Nutrition; World Health Organization: Geneva, Switzerland, 2007; Volume 935, ISBN 9241209356. [Google Scholar]
  5. Gorbatov, V.M. Collection and Utilization of Blood and Blood Proteins for Edible Purposes in the USSR. In Advances in Meat Research; Elsevier Applied Science: London, UK; New York, NY, USA, 1988; ISSN 0885-2405. [Google Scholar]
  6. Satterlee, L.D. Improving utilization of animal by-products for human foods—A review. J. Anim. Sci. 1975, 41, 687–697. [Google Scholar] [CrossRef]
  7. Tybor, P.T.; Dill, C.W.; Landmann, W.A. Effect of decolorization and lactose incorporation on the emulsification capacity of spray-dried blood protein concentrates. J. Food Sci. 1973, 38, 4–6. [Google Scholar] [CrossRef]
  8. Bah CS, F.; Bekhit AE, D.A.; Carne, A.; McConell, A. Slaughterhouse blood: An emerging source of bioactive compounds. Compr. Rev. Food Sci. Food Saf. 2013, 12, 314–331. [Google Scholar] [CrossRef]
  9. Duarte, R.T.; Carvalho Simoes, M.C.; Sgarbieri, V.C. Bovine blood components: Fractionation, composition, and nutritive value. J. Agric. Food Chem. 1999, 47, 231–236. [Google Scholar] [CrossRef]
  10. Ofori, J.A.; Hsieh, Y.H.P. The Use of Blood and Derived Products as Food Additives; Food additive; IntechOpen: Rijeka, Croatia, 2012; ISBN 978-953-51-0067-6. [Google Scholar]
  11. Toldrá, F.; Aristoy, M.C.; Mora, L.; Reig, M. Innovations in value-addition of edible meat by-products. Meat Sci. 2012, 92, 290–296. [Google Scholar] [CrossRef] [PubMed]
  12. EUROSTAT. All Data/Agriculture, Forestry and Fisheries/Agriculture/Agricultural Production/Animal Production/Livestock and Meat/Meat Production. 2022. Available online: https://ec.europa.eu/eurostat/data/database (accessed on 15 September 2023).
  13. Molnár, S.; Szőllősi, L. Sustainability and quality aspects of different table egg production systems: A literature review. Sustainability 2020, 12, 7884. [Google Scholar] [CrossRef]
  14. Gunnarsson, S.; Arvidsson Segerkvist, K.; Göransson, L.; Hansson, H.; Sonesson, U. Systematic mapping of research on farm-level sustainability in egg and chicken meat production. Sustainability 2020, 12, 3033. [Google Scholar] [CrossRef]
  15. Gross, J.J.; Bruckmaier, R.M. Invited review: Metabolic challenges and adaptation during different functional stages of the mammary gland in dairy cows: Perspectives for sustainable milk production. J. Dairy Sci. 2019, 102, 2828–2843. [Google Scholar] [CrossRef]
  16. Hagemann, M.; Hemme, T.; Ndambi, A.; Alqaisi, O.; Sultana, M.N. Benchmarking of greenhouse gas emissions of bovine milk production systems for 38 countries. Anim. Feed. Sci. Technol. 2011, 166, 46–58. [Google Scholar] [CrossRef]
  17. Salter, A.M. Improving the sustainability of global meat and milk production. Proc. Nutr. Soc. 2017, 76, 22–27. [Google Scholar] [CrossRef] [PubMed]
  18. Arrieta, E.M.; Aguiar, S.; Fischer, C.G.; Cuchietti, A.; Cabrol, D.A.; González, A.D.; Jobbágy, E.G. Environmental footprints of meat, milk and egg production in Argentina. J. Clean. Prod. 2022, 347, 131325. [Google Scholar] [CrossRef]
  19. Ayar, A.; Siçramaz, H.; Öztürk, S.; Öztürk Yilmaz, S. Probiotic properties of ice creams produced with dietary fibres from by-products of the food industry. Int. J. Dairy Technol. 2018, 71, 174–182. [Google Scholar] [CrossRef]
  20. El-Nagar, G.; Clowes, G.; Tudoricǎ, C.M.; Kuri, V.; Brennan, C.S. Rheological quality and stability of yog-ice cream with added inulin. Int. J. Dairy Technol. 2002, 55, 89–93. [Google Scholar] [CrossRef]
  21. Gabbi, D.K.; Bajwa, U.; Goraya, R.K. Physicochemical, melting and sensory properties of ice cream incorporating processed ginger (Zingiber officinale). Int. J. Dairy Technol. 2018, 71, 190–197. [Google Scholar] [CrossRef]
  22. Kalicka, D.; Znamirowska, A.; Pawlos, M.; Buniowska, M.; Szajnar, K. Physical and sensory characteristics and probiotic survival in ice cream sweetened with various polyols. Int. J. Dairy Technol. 2019, 72, 456–465. [Google Scholar] [CrossRef]
  23. Tiwari, A.; Sharma, H.K.; Kumar, N.; Kaur, M. The effect of inulin as a fat replacer on the quality of low-fat ice cream. Int. J. Dairy Technol. 2015, 68, 374–380. [Google Scholar] [CrossRef]
  24. FrØst, M.B.; Heymann, H.; Bredie, W.L.; Dijksterhuis, G.B.; Martens, M. Sensory measurement of dynamic flavour intensity in ice cream with different fat levels and flavourings. Food Qual. Prefer. 2005, 16, 305–314. [Google Scholar] [CrossRef]
  25. Rossa, P.N.; Burin, V.M.; Bordignon-Luiz, M.T. Effect of microbial transglutaminase on functional and rheological properties of ice cream with different fat contents. LWT—Food Sci. Technol. 2012, 48, 224–230. [Google Scholar] [CrossRef]
  26. Hartel, R.W.; Muse, M.R.; Sofjan, R. Effects of structural attributes on hardness and meltingrate of ice cream. Ice cream II. In Proceedings of the Second IDF International Symposium on Ice Cream, International Dairy Federation, Thessaloniki, Greece, 14–16 May 2003; pp. 124–139, ISBN 9290980389. [Google Scholar]
  27. Javidi, F.; Razavi SM, A.; Behrouzian, F.; Alghooneh, A. The influence of basil seed gum, guar gum and their blend on the rheological, physical and sensory properties of low fat ice cream. Food Hydrocoll. 2016, 52, 625–633. [Google Scholar] [CrossRef]
  28. Putnam, F.W. The Plasma Proteins: Structure, Function, and Genetic Control; Academic Press: New York, NY, USA; San Francisco, CA, USA; London, UK, 1977; ISBN 0-12-568403-7. [Google Scholar]
  29. Liberal, Â.; Pinela, J.; Vívar-Quintana, A.M.; Ferreira, I.C.; Barros, L. Fighting iron-deficiency anemia: Innovations in food fortificants and biofortification strategies. Foods 2020, 9, 1871. [Google Scholar] [CrossRef]
  30. Weintraub, L.R.; Weinstein, M.B.; Huser, H.J.; Rafal, S. Absorption of hemoglobin iron: The role of a heme-splitting substance in the intestinal mucosa. J. Clin. Investig. 1968, 47, 531–539. [Google Scholar] [CrossRef]
  31. Pereira, A.D.; Gomide LA, M.; Cecon, P.R.; Fontes EA, F.; Fontes, P.R.; Ramos, E.M.; Vidigal, J.G. Evaluation of mortadella formulated with carbon monoxide-treated porcine blood. Meat Sci. 2014, 97, 164–173. [Google Scholar] [CrossRef]
  32. Oellingrath, I.M.; Slinde, E. Color, pigment and iron content of meat loaves with blood, blood emulsion, or mechanically deboned meat added. J. Food Sci. 1985, 50, 1551–1555. [Google Scholar] [CrossRef]
  33. Slinde, E.; Martens, M. Changes in sensory properties of sausages when small amounts of blood replace meat. J. Sci. Food Agric. 1982, 33, 760–762. [Google Scholar] [CrossRef]
  34. Ratnayake, W.S.; Geera, B.; Rybak, D.A. Effects of egg and egg replacers on yellow cake product quality. J. Food Process. Preserv. 2012, 36, 21–29. [Google Scholar] [CrossRef]
  35. Csurka, T.; Varga-Tóth, A.; Kühn, D.; Hitka, G.; Badak-Kerti, K.; Alpár, B.; Surányi, J.; Friedrich, L.F.; Pásztor-Huszár, K. Comparison of techno-functional and sensory properties of sponge cakes made with egg powder and different quality of powdered blood products for substituting egg allergen and developing functional food. Front. Nutr. 2022, 9, 979594. [Google Scholar] [CrossRef]
  36. Johnson, L.A.; Havel, E.F.; Hoseney, R.C. Bovine plasma as a replacement for egg in cakes. Cereal Chem. 1979, 56, 339–342. [Google Scholar]
  37. Lee, C.C.; Johnson, L.A.; Love, J.A.; Johnson, S. As an Egg White Substitute in Cakes’. Cereal Chem. 1991, 68, 100–104. [Google Scholar]
  38. Hidas, K.I.; Nyulas-Zeke, I.C.; Szepessy, A.; Romvári, V.; Gerhart, K.; Surányi, J.; Laczay, P.; Darnay, L. Physical properties of hemp drink-based ice cream with different plant proteins guar gum and microbial transglutaminase. LWT 2023, 182, 114865. [Google Scholar] [CrossRef]
  39. Varga-Tóth, A.; Németh Cs Dalmadi, I.; Csurka, T.; Csorba, R.; Elayan, M.; Enkhbold, M.; Hidas, K.; Friedrich, L.F. Investigation of the effects of bovine collagen peptides and mixed berries on rheological properties and biological activity of egg white-based beverage via central composite design. Front. Nutr. 2023, 9, 1011553. [Google Scholar] [CrossRef] [PubMed]
  40. Mezger, T.G. The Rheology Handbook: For Users of Rotational and Oscillatory Rheometers, 3rd ed.; Vincentz Network: Hannover, Germany, 2006; ISBN 978-3-86630-890-9. [Google Scholar]
  41. De Huidobro, F.R.; Miguel, E.; Blázquez, B.; Onega, E. A comparison between two methods (Warner–Bratzler and texture profile analysis) for testing either raw meat or cooked meat. Meat Sci. 2005, 69, 527–536. [Google Scholar] [CrossRef] [PubMed]
  42. Cofrades, S.; Guerra, M.A.; Carballo, J.; Fernández-Martyn, F.; Colmenero, F.J. Plasma protein and soy fiber content effect on bologna sausage properties as influenced by fat level. J. Food Sci. 2000, 65, 281–287. [Google Scholar] [CrossRef]
  43. Pietrasik, Z.; Jarmoluk, A.; Shand, P.J. Effect of non-meat proteins on hydration and textural properties of pork meat gels enhanced with microbial transglutaminase. LWT 2007, 40, 915–920. [Google Scholar] [CrossRef]
  44. Nassu, R.T.; Uttaro, B.; Aalhus, J.L.; Zawadski, S.; Juárez, M.; Dugan, M.E. Type of packaging affects the colour stability of vitamin E enriched beef. Food Chem. 2012, 135, 1868–1872. [Google Scholar] [CrossRef]
  45. Nagy, D.; Zsom-Muha, V.; Németh Cs Felföldi, J. Sonication effect on foam properties of egg white. Prog. Agric. Eng. Sci. 2021, 17, 1–8. [Google Scholar] [CrossRef]
  46. Froning, G.W. Egg Products Industry and Future Perspectives. In Egg Bioscience and Biotechnology; Mine, Y., Ed.; John Wiley & Sons: Hoboken, NJ, USA, 2008; pp. 307–326. [Google Scholar] [CrossRef]
  47. Herald, T.J.; Osorio, F.A.; Smith, D.M. Rheological Properties of Pasteurized Liquid Whole Egg During Frozen Storage. J. Food Sci. 1989, 54, 35–38. [Google Scholar] [CrossRef]
  48. Kilcast, D.; Den Ridder, C. Sensory issues in reducing salt in food products. In Reducing Salt in Foods, Practical Strategies; Woodhead Publishing Series in Food Science, Technology and Nutrition; Woodhead Publishing: Sawston, UK, 2007; pp. 201–220. [Google Scholar] [CrossRef]
  49. Salger, M.; Stark, T.D.; Hofmann, T. Taste modulating peptides from overfermented cocoa beans. J. Agric. Food Chem. 2019, 67, 4311–4320. [Google Scholar] [CrossRef]
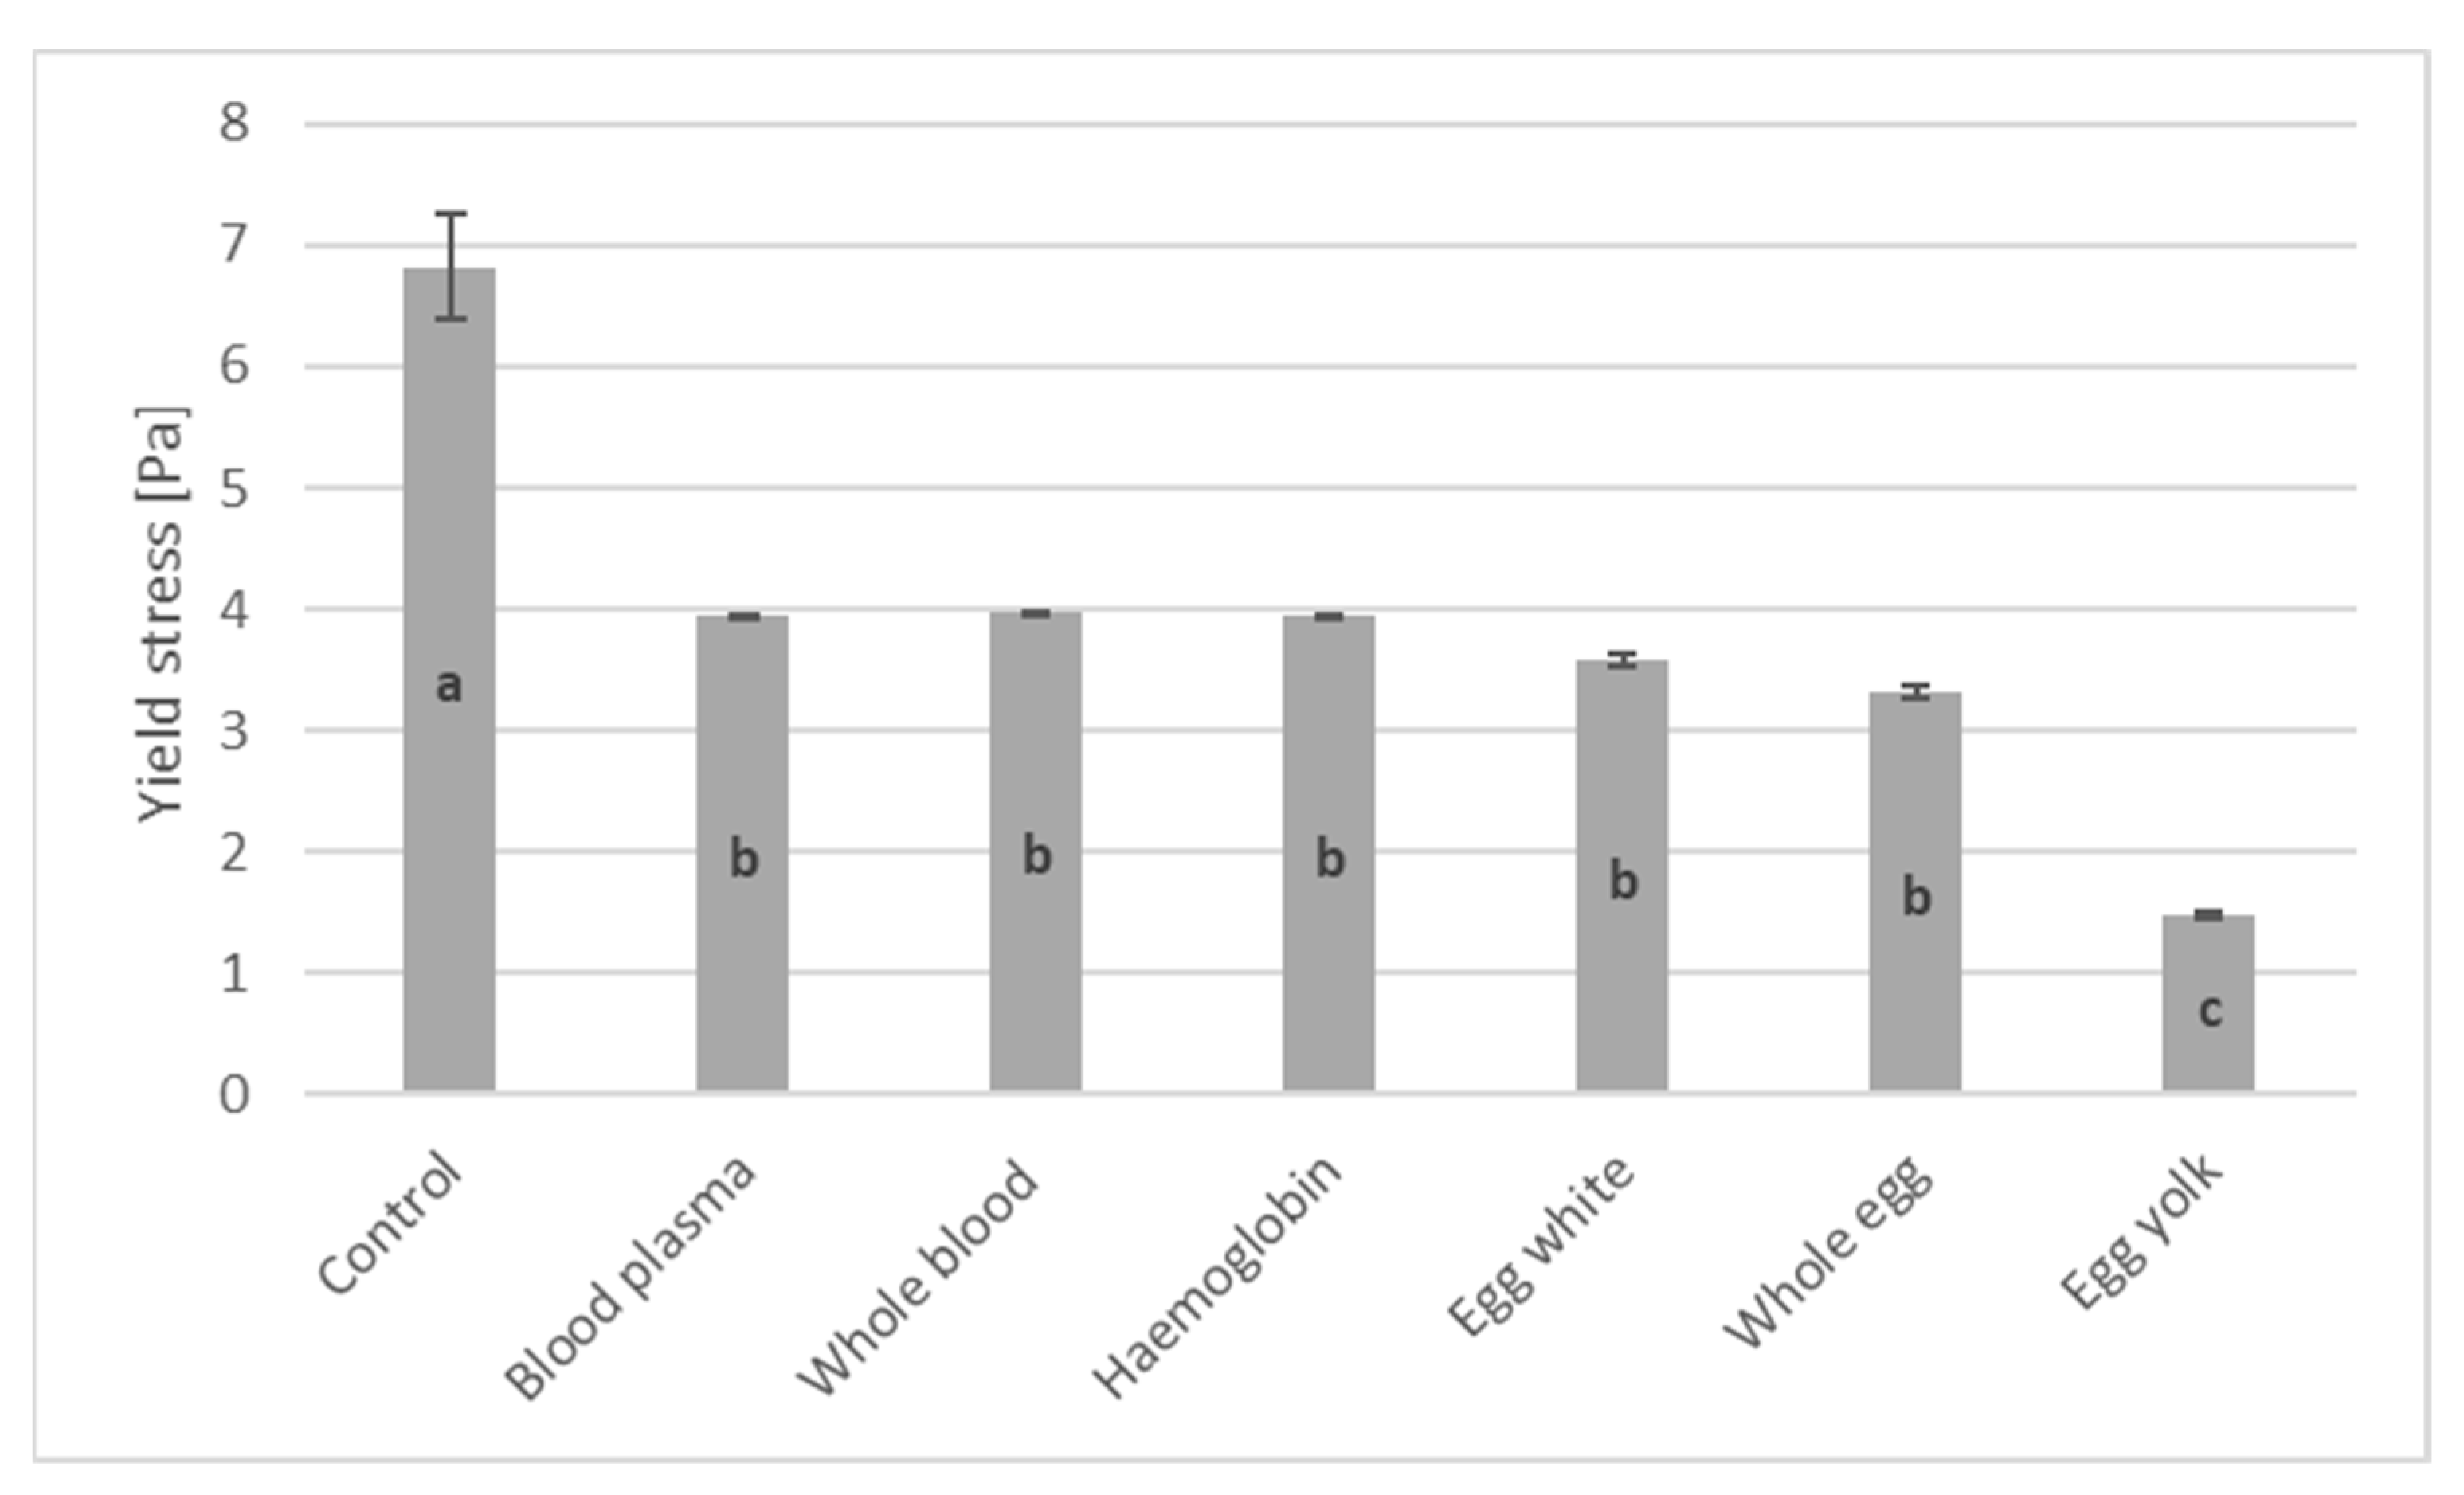
Figure 1. Yield stress (Pa) of ice cream mix sample groups with 10 g (100 g)−1 of different protein raw material enrichments. Different superscript letters on the bars indicate significant differences.
Sustainability 15 16794 g001
Figure 2. Consistency index (Pa sn) of ice cream mix sample groups with 10 g (100 g)−1 of different protein raw material enrichments. Different superscript letters on the bars indicate significant differences.
Sustainability 15 16794 g002
Figure 3. Flow behaviour index [-] of ice cream mix sample groups with 10 g (100 g)−1 of different protein raw material enrichments. Different superscript letters on the bars indicate significant differences.
Sustainability 15 16794 g003
Figure 4. Lightness (L*) [-] of ice cream sample groups with 10 g (100 g)−1 of different protein raw material enrichments. Different superscript letters on the bars indicate significant differences.
Sustainability 15 16794 g004
Figure 5. Redness–greenness (a*) [-] of ice cream sample groups with 10 g (100 g)−1 of different protein raw material enrichments. Different superscript letters on the bars indicate significant differences.
Sustainability 15 16794 g005
Figure 6. Yellowness–blueness (b*) [-] of ice cream sample groups with 10 g (100 g)−1 of different protein raw material enrichments. Different superscript letters on the bars indicate significant differences.
Sustainability 15 16794 g006
Figure 7. Chroma (C*) [-] of ice cream sample groups with 10 g (100 g)−1 of different protein raw material enrichments. Different superscript letters on the bars indicate significant differences.
Sustainability 15 16794 g007
Figure 8. Hardness (shear force) [N] of frozen ice cream sample groups with 10 g (100 g)−1 of different protein raw material enrichments. Different superscript letters on the bars indicate significant differences.
Sustainability 15 16794 g008
Figure 9. Dry matter content (DMC) [g (100 g)−1] of ice cream mix sample groups with 10 g (100 g)−1 of different protein raw material enrichments. Different superscript letters on the bars indicate significant differences.
Sustainability 15 16794 g009
Figure 10. pH [-] of ice cream mix sample groups with 10 g (100 g)−1 of different protein raw material enrichments. Different superscript letters on the bars indicate significant differences.
Sustainability 15 16794 g010
Table 1. Sensory attributes of ice cream sample groups with 10 g (100 g)−1 of different protein raw material enrichments.
Enrichment MaterialSensory AttributeAverageStandard DeviationNumber of Samples
ControlColour preference9.380.8332
Flavour preference8.591.2932
Chocolate flavour intensity8.251.3732
Chocolate aroma intensity8.311.1832
Sweet flavour intensity7.51.5232
Salty flavour intensity1.691.3332
Blood plasmaColour preference9.50.8932
Flavour preference8.881.6316
Chocolate flavour intensity8.51.7116
Chocolate aroma intensity8.751.4416
Sweet flavour intensity6.751.9116
Salty flavour intensity1.50.7316
Whole bloodColour preference9.750.5816
Flavour preference7.562.5316
Chocolate flavour intensity7.38216
Chocolate aroma intensity7.132.0316
Sweet flavour intensity5.751.5316
Salty flavour intensity1.50.7316
HaemoglobinColour preference9.50.6316
Flavour preference8.131.7816
Chocolate flavour intensity7.251.6116
Chocolate aroma intensity7.51.3716
Sweet flavour intensity6.251.6116
Salty flavour intensity1.50.7316
Egg whiteColour preference9.250.7716
Flavour preference7.751.7716
Chocolate flavour intensity6.881.0916
Chocolate aroma intensity6.881.0916
Sweet flavour intensity6.191.6816
Salty flavour intensity1.380.7216
Whole eggColour preference9.190.8316
Flavour preference8.191.2816
Chocolate flavour intensity7.061.2916
Chocolate aroma intensity7.061.2916
Sweet flavour intensity6.632.0916
Salty flavour intensity1.440.8116
Egg yolkColour preference9.191.1116
Flavour preference7.691.316
Chocolate flavour intensity7.130.9616
Chocolate aroma intensity7.130.9616
Sweet flavour intensity7.191.0516
Salty flavour intensity1.250.5816
Disclaimer/Publisher’s Note: The statements, opinions and data contained in all publications are solely those of the individual author(s) and contributor(s) and not of MDPI and/or the editor(s). MDPI and/or the editor(s) disclaim responsibility for any injury to people or property resulting from any ideas, methods, instructions or products referred to in the content.