
Congestion Relief Services by Vehicle-to-Grid Enabled Electric Vehicles Considering Battery Degradation


Abstract
1. Introduction
2. Materials and Methods
2.1. Congestion Relief and Financial Transmission Rights
2.2. Utility Scale Energy Storage Projects for Congestion Relief
2.3. Locational Marginal Price
2.4. Node Selection Process
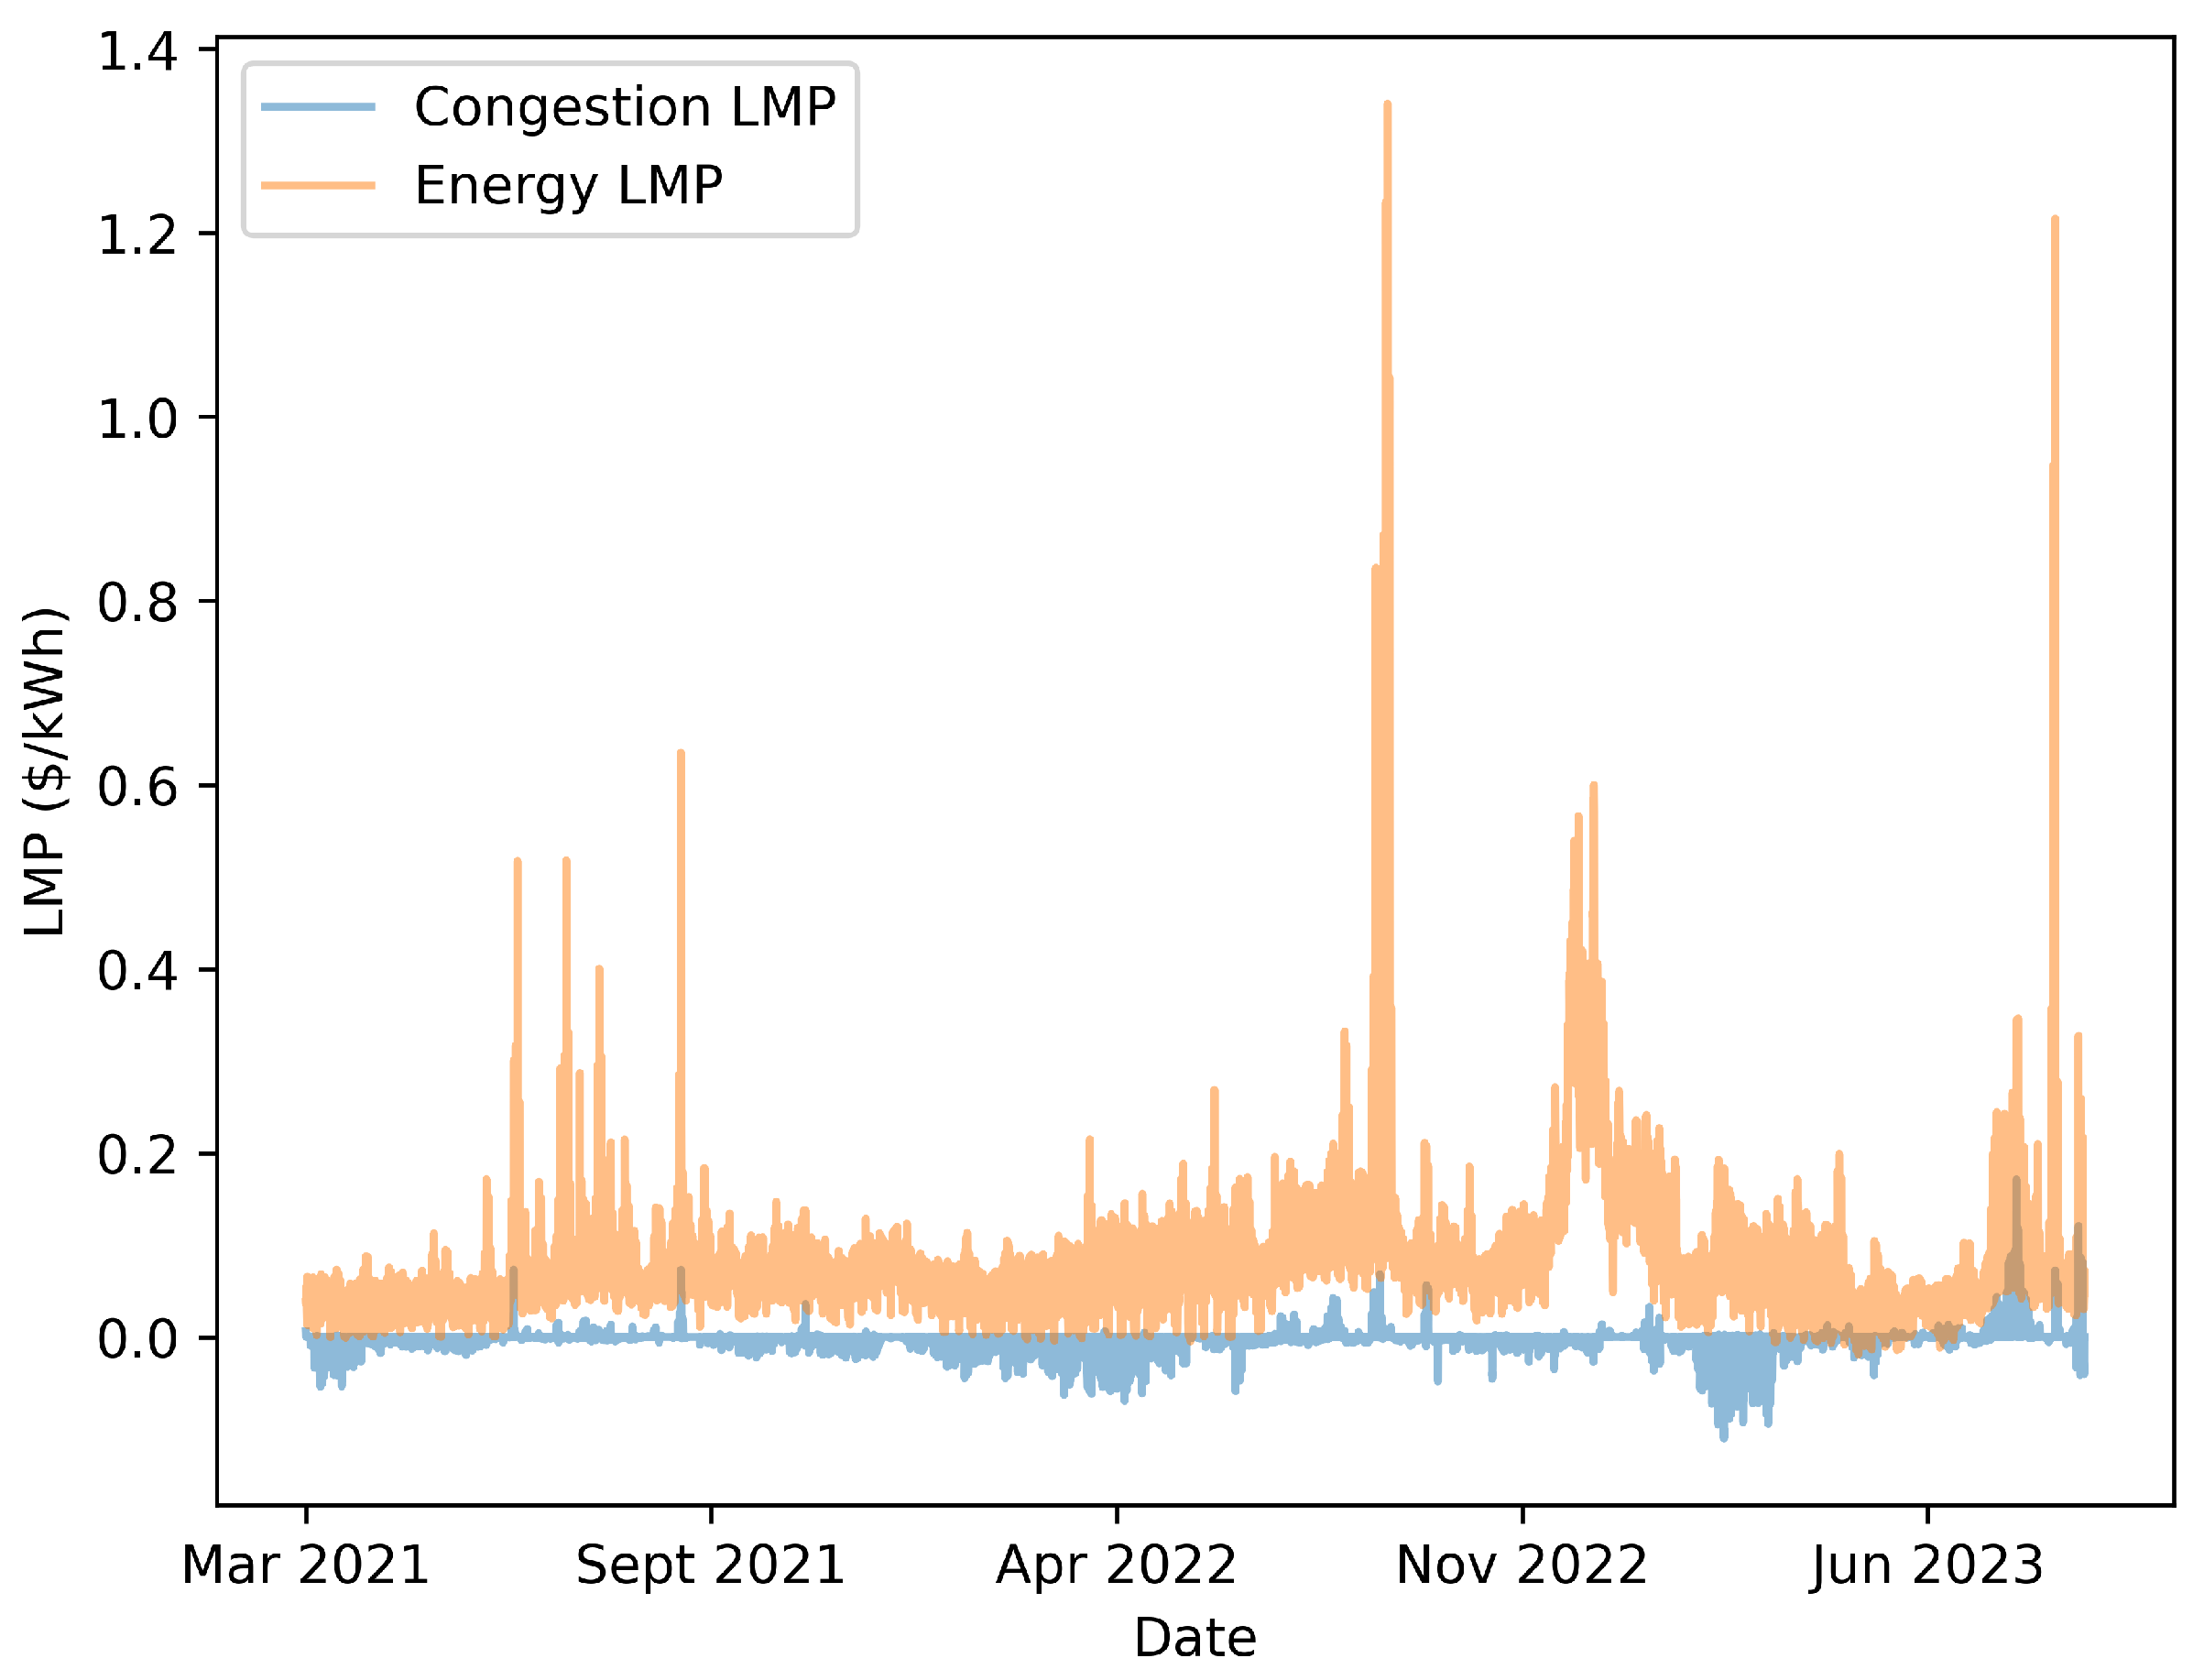
2.5. LMP Visualization
2.6. Battery Degradation
2.7. Optimization
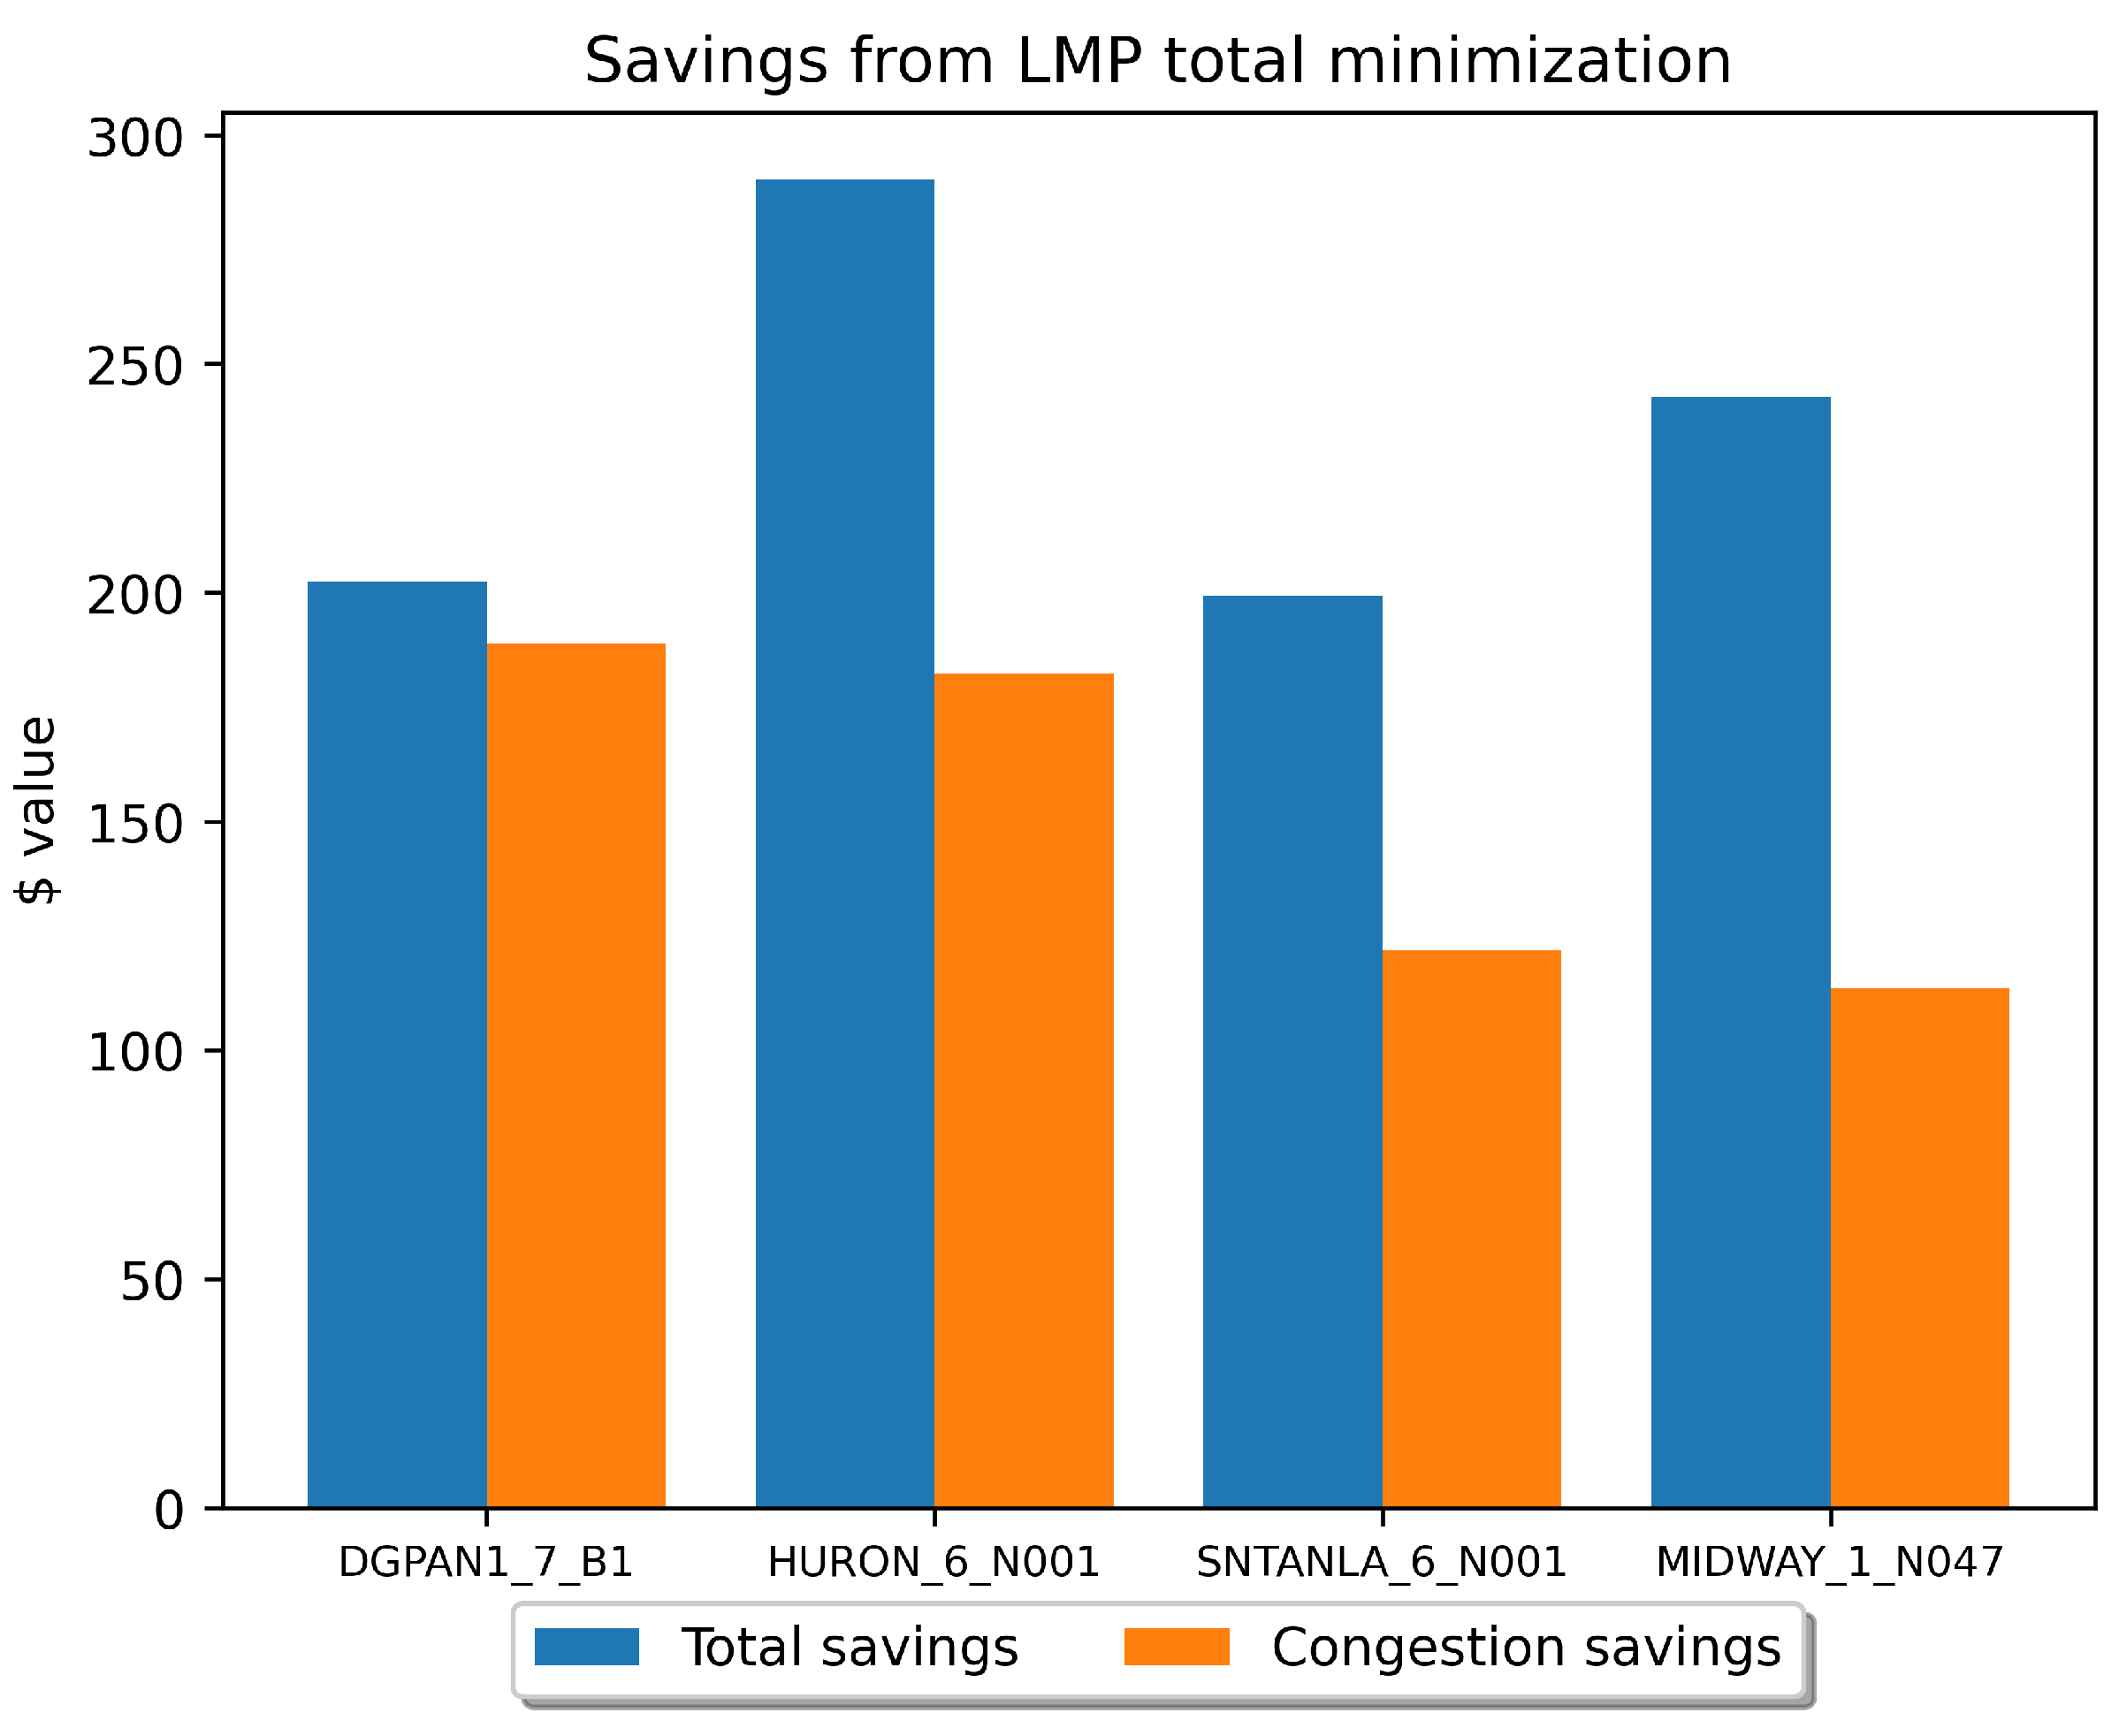
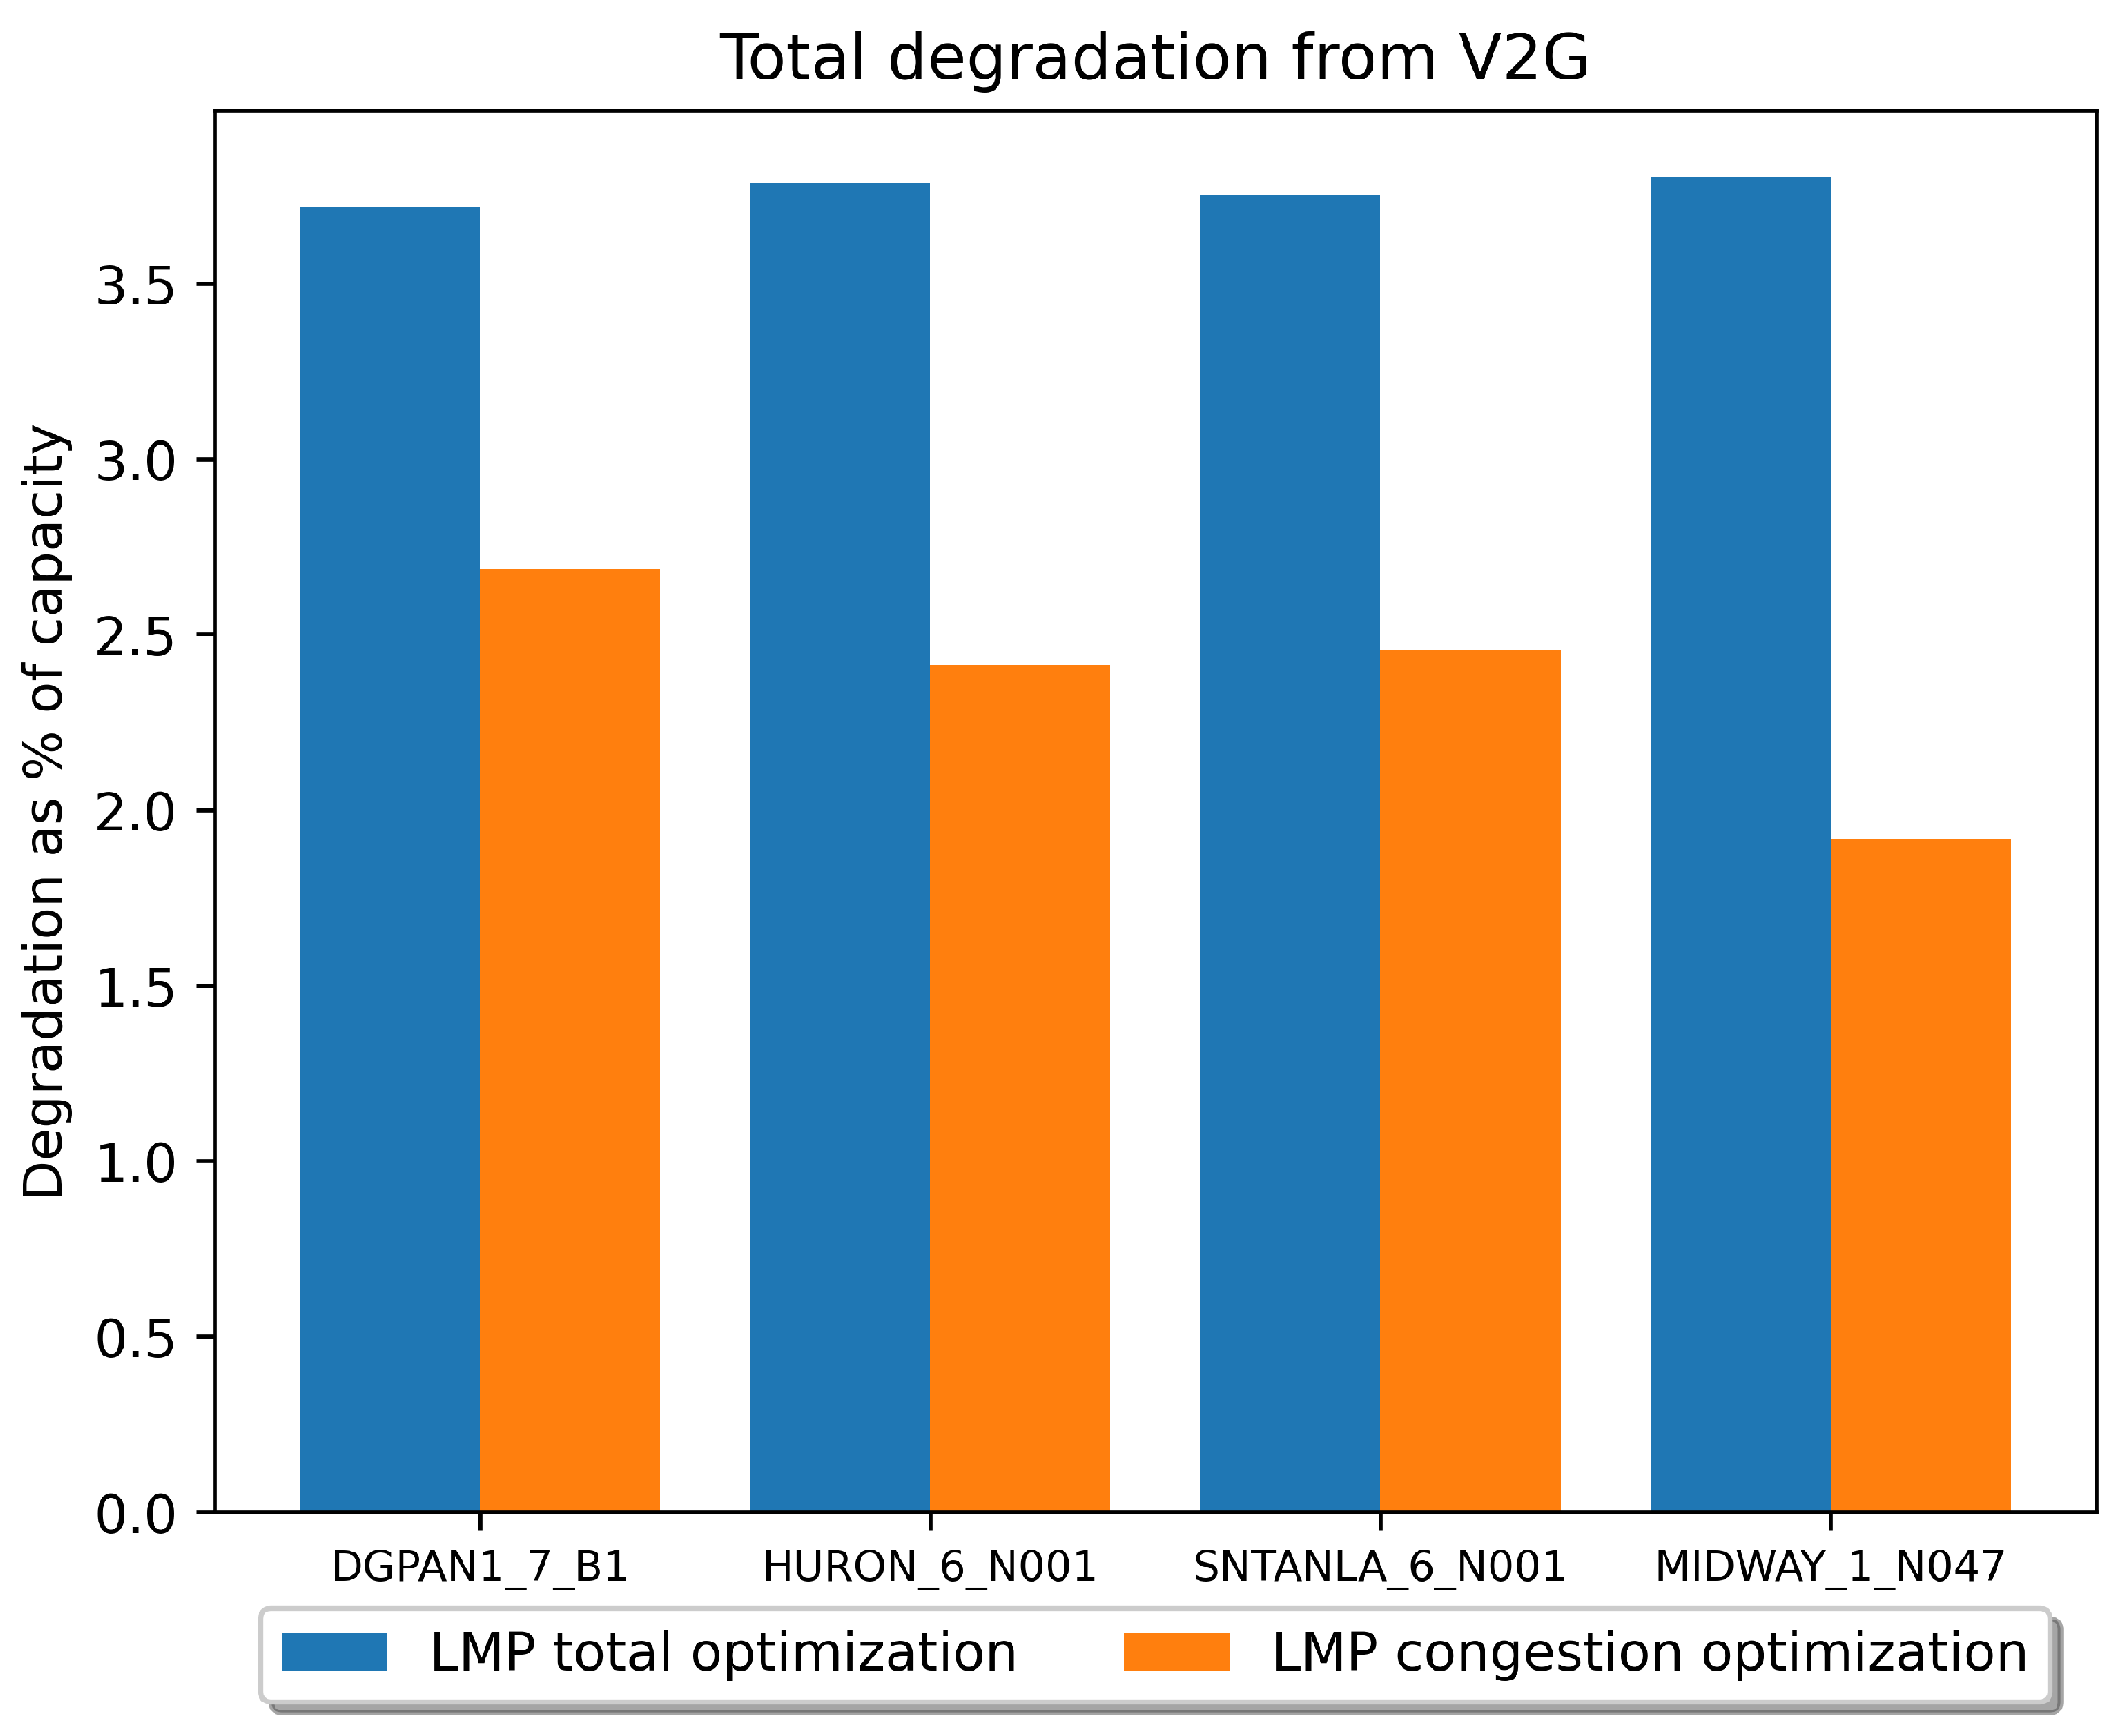
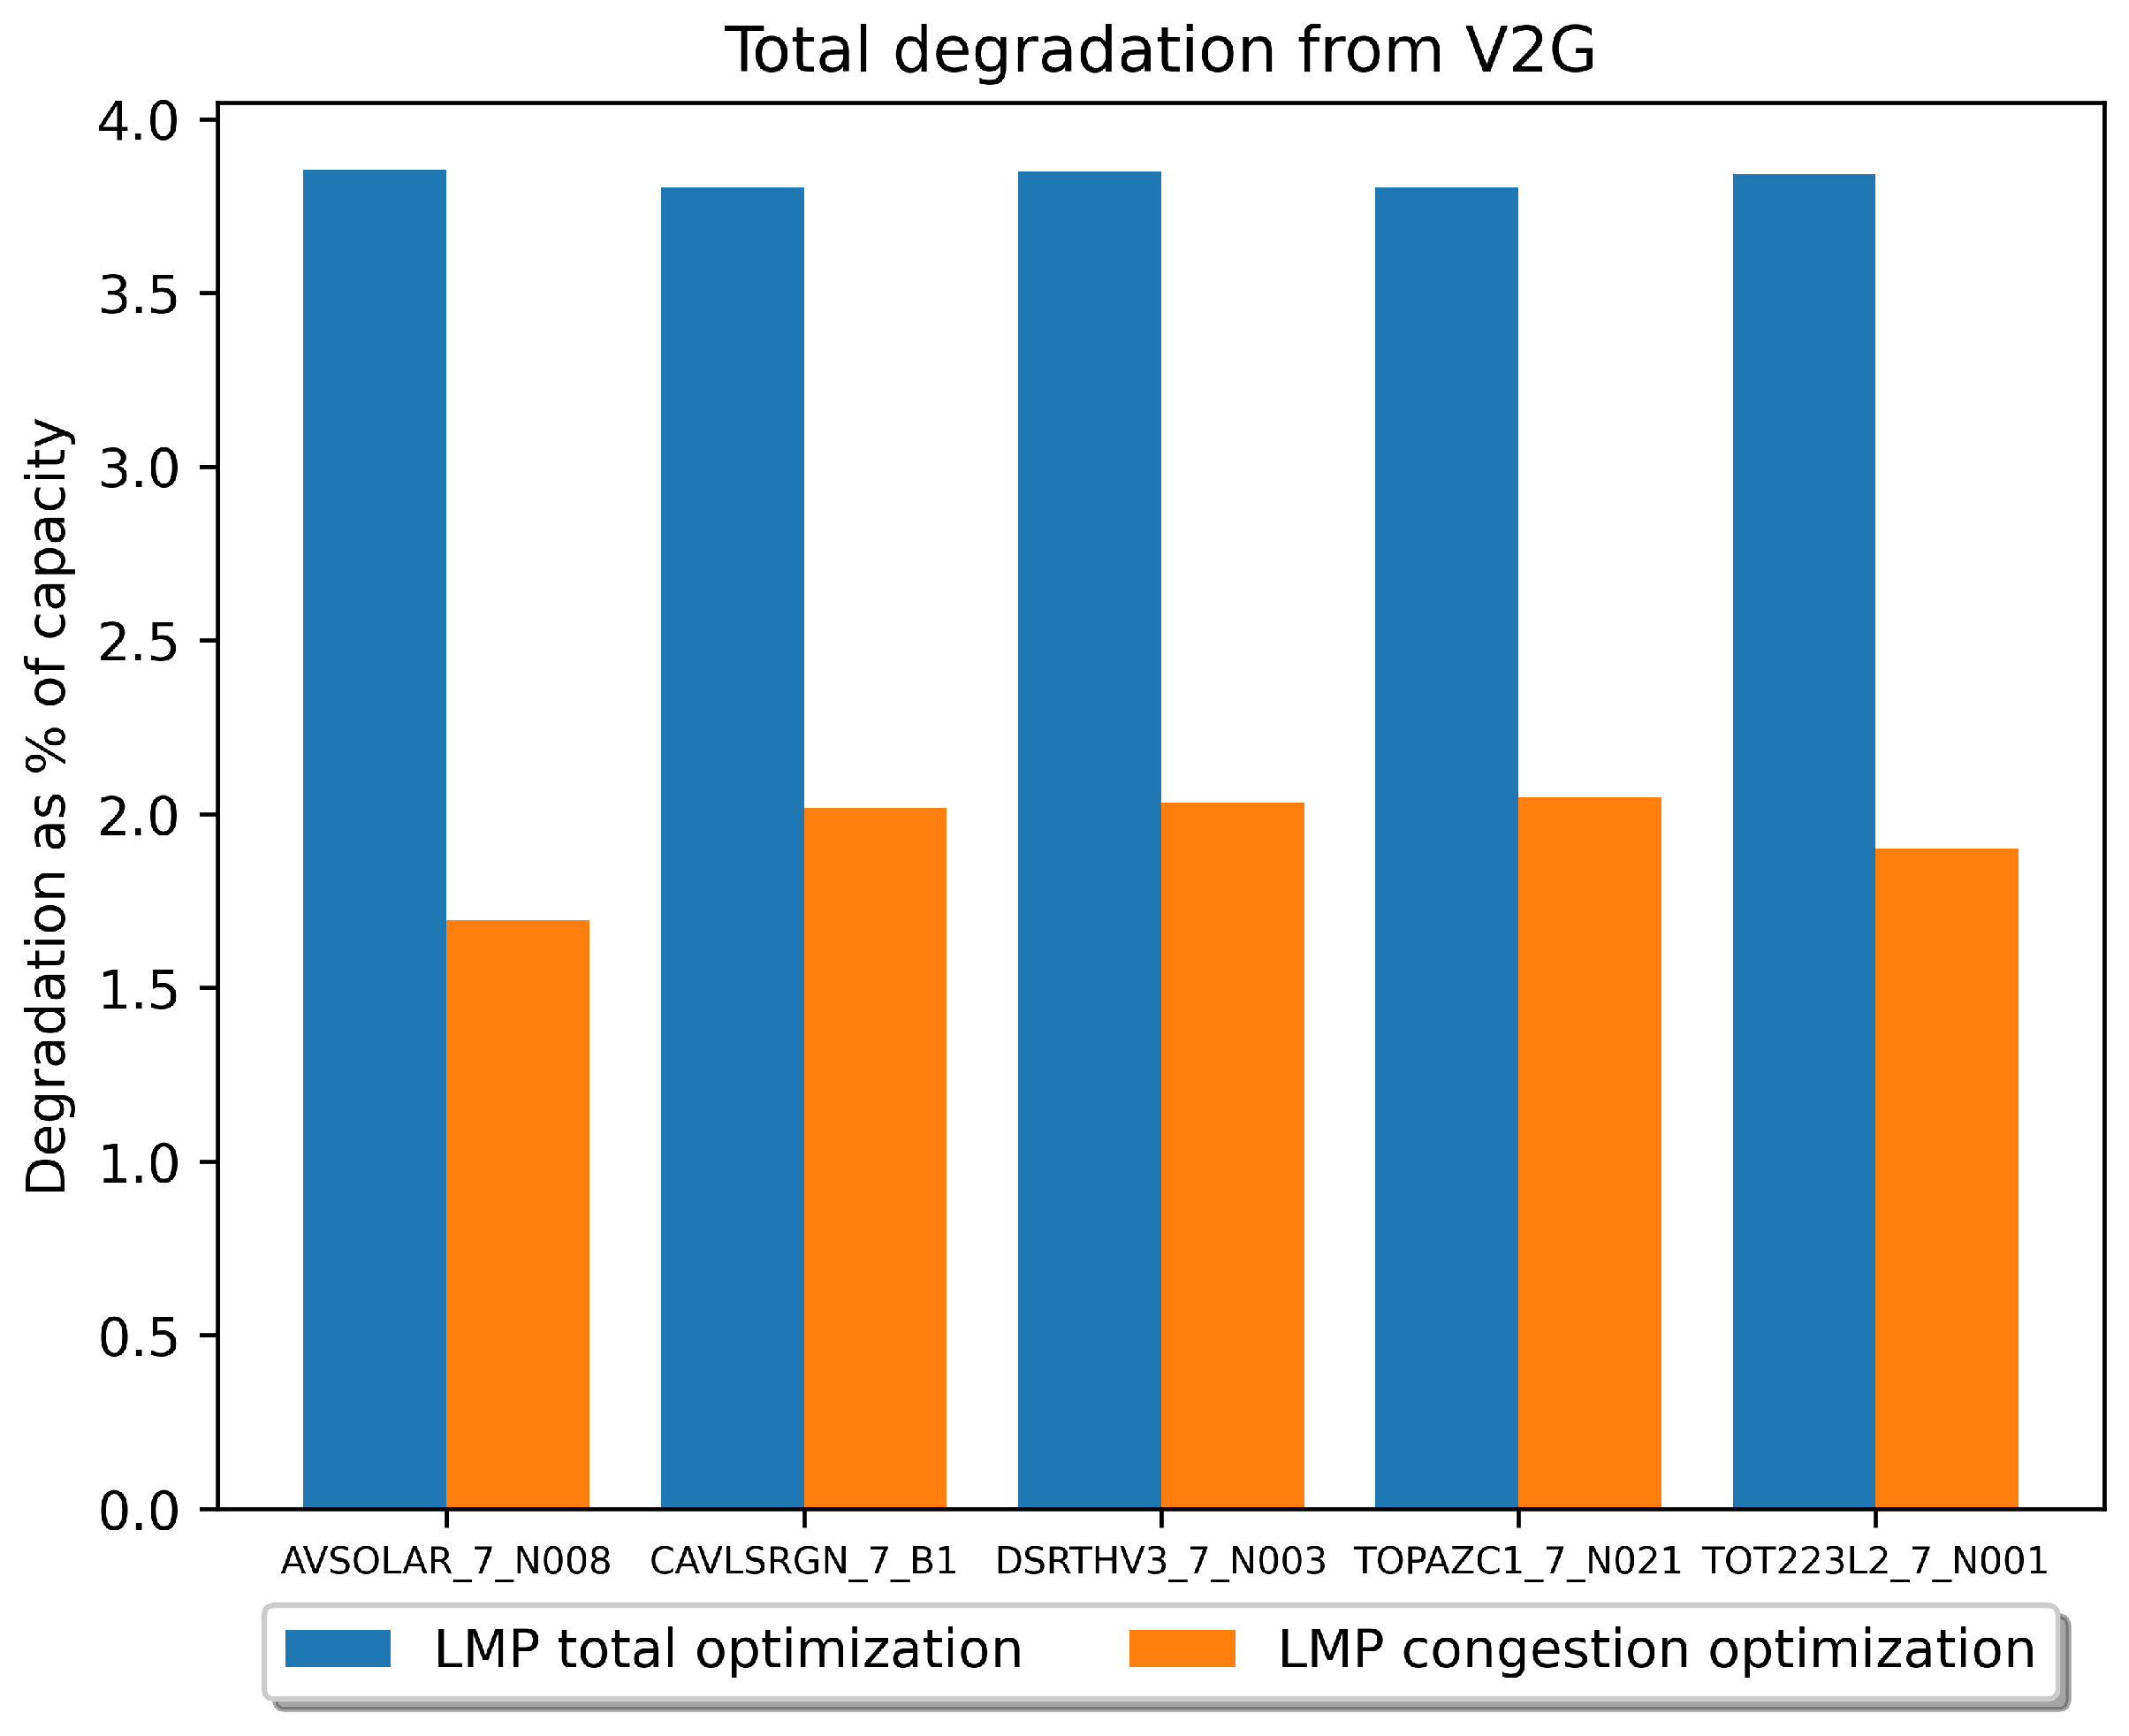
3. Results
4. Discussion
Author Contributions
Funding
Institutional Review Board Statement
Informed Consent Statement
Data Availability Statement
Acknowledgments
Conflicts of Interest
Abbreviations
| BEV | Battery Electric Vehicle |
| V2G | Vehicle-to-Grid |
| LMP | Locational Marginal Price |
| CAISO | California Independent System Operator |
| RES | Renewable Energy Sources |
| BESS | Battery Energy Storage System |
| ISO | Independent System Operator |
| RTO | Regional Transmission Organization |
| BTM | Behind-the-meter |
| PV | Photovoltaic |
| TOU | Time-of-use |
| DAM | Day-Ahead Market |
| RTM | Real-Time Market |
| GHG | Greenhouse gas |
| NHTA | National Household Travel Survey |
| PJM | Pennsylvania Jersey Maryland RTO |
| SPP | Southwest Power Pool |
| TCC | Transmission Congestion Contracts |
| CRR | Congestion Revenue Rights |
| DOE | Department of Energy |
| RTOD | Real Time Optimal Dispatch |
| TCR | Transmission Congestion Relief |
| MILP | Mixed Integer Linear Program |
References
- Priessner, A.; Hampl, N. Can product bundling increase the joint adoption of electric vehicles, solar panels and battery storage? Explorative evidence from a choice-based conjoint study in Austria. Ecol. Econ. 2020, 167, 106381. [Google Scholar] [CrossRef]
- Edelenbosch, O.Y.; Hof, A.F.; Nykvist, B.; Girod, B.; Van Vuuren, D.P. Transport electrification: The effect of recent battery cost reduction on future emission scenarios. Clim. Chang. 2018, 151, 95–108. [Google Scholar] [CrossRef]
- Sufyan, M.; Rahim, N.A.; Aman, M.M.; Tan, C.K.; Raihan, S.R.S. Sizing and applications of battery energy storage technologies in smart grid system: A review. J. Renew. Sustain. Energy 2019, 11, 014105. [Google Scholar] [CrossRef]
- Fitzgerald, G.; Mandel, J.; Morris, J.; Touati, H. The Economics of Battery Energy Storage: How Multi-Use, Customer-Sited Batteries Deliver the Most Services and Value to Customers and the Grid; Rocky Mountain Institute: Basalt, CO, USA, 2015; Volume 6. [Google Scholar]
- Rezaeimozafar, M.; Monaghan, R.F.; Barrett, E.; Duffy, M. A review of behind-the-meter energy storage systems in smart grids. Renew. Sustain. Energy Rev. 2022, 164, 112573. [Google Scholar] [CrossRef]
- Li, T.; Tao, S.; He, K.; Lu, M.; Xie, B.; Yang, B.; Sun, Y. V2G multi-objective dispatching optimization strategy based on user behavior model. Front. Energy Res. 2021, 9, 739527. [Google Scholar] [CrossRef]
- Sevilla, F.R.S.; Parra, D.; Wyrsch, N.; Patel, M.K.; Kienzle, F.; Korba, P. Techno-economic analysis of battery storage and curtailment in a distribution grid with high PV penetration. J. Energy Storage 2018, 17, 73–83. [Google Scholar] [CrossRef]
- Gowda, S.N.; Ahmadian, A.; Anantharaman, V.; Chu, C.C.; Gadh, R. Power Management via Integration of Battery Energy Storage Systems with Electric Bus Charging. In Proceedings of the 2022 IEEE Power & Energy Society Innovative Smart Grid Technologies Conference (ISGT), New Orleans, LA, USA, 24–28 April 2022; IEEE: Piscataway, NJ, USA, 2022; pp. 1–5. [Google Scholar]
- Englberger, S.; Jossen, A.; Hesse, H. Unlocking the potential of battery storage with the dynamic stacking of multiple applications. Cell Rep. Phys. Sci. 2020, 1, 100238. [Google Scholar] [CrossRef]
- Gusev, Y.P.; Subbotin, P. Using battery energy storage systems for load balancing and reactive power compensation in distribution grids. In Proceedings of the 2019 International Conference on Industrial Engineering, Applications and Manufacturing (ICIEAM), Sochi, Russia, 25–29 March 2019; IEEE: Piscataway, NJ, USA, 2019; pp. 1–5. [Google Scholar]
- Ma, H.; Balthasar, F.; Tait, N.; Riera-Palou, X.; Harrison, A. A new comparison between the life cycle greenhouse gas emissions of battery electric vehicles and internal combustion vehicles. Energy Policy 2012, 44, 160–173. [Google Scholar] [CrossRef]
- Van Vliet, O.; Brouwer, A.S.; Kuramochi, T.; van Den Broek, M.; Faaij, A. Energy use, cost and CO2 emissions of electric cars. J. Power Sources 2011, 196, 2298–2310. [Google Scholar] [CrossRef]
- McGuckin, N.A.; Fucci, A. Summary of Travel Trends: 2017 National Household Travel Survey; US Department of Transportation, Federal Highway Administration: Washington, DC, USA, 2018.
- Kempton, W.; Letendre, S.E. Electric vehicles as a new power source for electric utilities. Transp. Res. Part D Transp. Environ. 1997, 2, 157–175. [Google Scholar] [CrossRef]
- Galus, M.D.; Vayá, M.G.; Krause, T.; Andersson, G. The role of electric vehicles in smart grids. Wiley Interdiscip. Rev. Energy Environ. 2013, 2, 384–400. [Google Scholar] [CrossRef]
- Lopes, J.A.P.; Soares, F.J.; Almeida, P.M.R. Integration of electric vehicles in the electric power system. Proc. IEEE 2011, 99, 168–183. [Google Scholar] [CrossRef]
- Sortomme, E.; El-Sharkawi, M.A. Optimal charging strategies for unidirectional vehicle-to-grid. IEEE Trans. Smart Grid 2011, 2, 131–138. [Google Scholar] [CrossRef]
- Gowda, S.N.; Eraqi, B.A.; Nazaripouya, H.; Gadh, R. Assessment and tracking electric vehicle battery degradation cost using blockchain. In Proceedings of the 2021 IEEE Power & Energy Society Innovative Smart Grid Technologies Conference (ISGT), Washington, DC, USA, 16–18 February 2021; IEEE: Piscataway, NJ, USA, 2021; pp. 1–5. [Google Scholar]
- Denholm, P.; O’Connell, M.; Brinkman, G.; Jorgenson, J. Overgeneration from Solar Energy in California. A Field Guide to the Duck Chart; Technical Report; National Renewable Energy Lab. (NREL): Golden, CO, USA, 2015.
- Sioshansi, R.; Denholm, P. Emissions impacts and benefits of plug-in hybrid electric vehicles and vehicle-to-grid services. Environ. Sci. Technol. 2009, 43, 1199–1204. [Google Scholar] [CrossRef]
- Yu, H.; Niu, S.; Shang, Y.; Shao, Z.; Jia, Y.; Jian, L. Electric vehicles integration and vehicle-to-grid operation in active distribution grids: A comprehensive review on power architectures, grid connection standards and typical applications. Renew. Sustain. Energy Rev. 2022, 168, 112812. [Google Scholar] [CrossRef]
- Inci, M.; Savrun, M.M.; Çelik, Ö. Integrating electric vehicles as virtual power plants: A comprehensive review on vehicle-to-grid (V2G) concepts, interface topologies, marketing and future prospects. J. Energy Storage 2022, 55, 105579. [Google Scholar] [CrossRef]
- Rivera, S.; Kouro, S.; Vazquez, S.; Goetz, S.M.; Lizana, R.; Romero-Cadaval, E. Electric vehicle charging infrastructure: From grid to battery. IEEE Ind. Electron. Mag. 2021, 15, 37–51. [Google Scholar] [CrossRef]
- Gowda, S.N.; Zhang, T.; Kim, C.J.; Gadh, R.; Nazaripouya, H. Transmission, Distribution deferral and Congestion relief services by Electric Vehicles. In Proceedings of the 2019 IEEE Power & Energy Society Innovative Smart Grid Technologies Conference (ISGT), Washington, DC, USA, 18–21 February 2019; IEEE: Piscataway, NJ, USA, 2019; pp. 1–5. [Google Scholar]
- Byrne, R.H.; Nguyen, T.A.; Copp, D.A.; Chalamala, B.R.; Gyuk, I. Energy management and optimization methods for grid energy storage systems. IEEE Access 2017, 6, 13231–13260. [Google Scholar] [CrossRef]
- Eyer, J.M.; Corey, G.P.; Iannucci, J.J., Jr. Energy Storage Benefits and Market Analysis Handbook: A Study for the DOE Energy Storage Systems Program; Technical Report; Sandia National Laboratories: Albuquerque, NM, USA, 2004.
- Lyons, K.; Fraser, H.; Parmesano, H. An introduction to financial transmission rights. Electr. J. 2000, 13, 31–37. [Google Scholar] [CrossRef]
- Rudkevich, A.M.; Caramanis, M.C.; Goldis, E.A.; Li, X.; Ruiz, P.A.; Tabors, R.D. Financial Transmission Rights in Changing Power Networks. In Proceedings of the 2016 49th Hawaii International Conference on System Sciences (HICSS), Koloa, HI, USA, 5–8 January 2016; IEEE: Piscataway, NJ, USA, 2016; pp. 2326–2334. [Google Scholar]
- Hogan, W.W. Contract networks for electric power transmission. J. Regul. Econ. 1992, 4, 211–242. [Google Scholar] [CrossRef]
- Ye, H.; Ge, Y.; Shahidehpour, M.; Li, Z. Uncertainty marginal price, transmission reserve, and day-ahead market clearing with robust unit commitment. IEEE Trans. Power Syst. 2016, 32, 1782–1795. [Google Scholar] [CrossRef]
- Kristiansen, T. Markets for financial transmission rights. Energy Stud. Rev. 2004, 13, 25–74. [Google Scholar] [CrossRef][Green Version]
- Leslie, G.W. Who benefits from ratepayer-funded auctions of transmission congestion contracts? Evidence from New York. Energy Econ. 2021, 93, 105025. [Google Scholar] [CrossRef]
- Del Rosso, A.D.; Eckroad, S.W. Energy storage for relief of transmission congestion. IEEE Trans. Smart Grid 2013, 5, 1138–1146. [Google Scholar] [CrossRef]
- Khani, H.; Zadeh, M.R.D.; Hajimiragha, A.H. Transmission congestion relief using privately owned large-scale energy storage systems in a competitive electricity market. IEEE Trans. Power Syst. 2015, 31, 1449–1458. [Google Scholar] [CrossRef]
- Arteaga, J.; Zareipour, H.; Amjady, N. Energy storage as a service: Optimal pricing for transmission congestion relief. IEEE Open Access J. Power Energy 2020, 7, 514–523. [Google Scholar] [CrossRef]
- Nguyen, T. DOE Global Energy Storage Database; Sandia National Laboratories: Albuquerque, NM, USA, 2021.
- Staudt, P.; Schmidt, M.; Gärttner, J.; Weinhardt, C. A decentralized approach towards resolving transmission grid congestion in Germany using vehicle-to-grid technology. Appl. Energy 2018, 230, 1435–1446. [Google Scholar] [CrossRef]
- Asrari, A.; Ansari, M.; Khazaei, J.; Fajri, P. A market framework for decentralized congestion management in smart distribution grids considering collaboration among electric vehicle aggregators. IEEE Trans. Smart Grid 2019, 11, 1147–1158. [Google Scholar] [CrossRef]
- California ISO, Monthly Market Performance Reports. Available online: https://www.caiso.com/Pages/DocumentsByGroup.aspx?GroupID=A9180EE4-8972-4F3B-9CB8-21D0809B645E (accessed on 10 September 2023).
- California Energy Commission—California State Geoportal, California Electric Transmission Lines. Available online: https://gis.data.ca.gov/datasets/260b4513acdb4a3a8e4d64e69fc84fee/explore (accessed on 15 September 2023).
- California ISO, Today’s Outlook—Price Map. Available online: https://www.caiso.com/TodaysOutlook/Pages/prices.html (accessed on 15 September 2023).
- California Energy Commission—California State Geoportal, California Power Plants. Available online: https://cecgis-caenergy.opendata.arcgis.com/datasets/CAEnergy::california-power-plants/explore?location=37.174065%2C-118.394256%2C6.74 (accessed on 15 September 2023).
- California ISO, Managing Oversupply. Available online: https://www.caiso.com/informed/Pages/ManagingOversupply.aspx (accessed on 15 August 2023).
- Preis, V.; Biedenbach, F. Assessing the incorporation of battery degradation in vehicle-to-grid optimization models. Energy Inform. 2023, 6, 33. [Google Scholar] [CrossRef]
- Farzin, H.; Fotuhi-Firuzabad, M.; Moeini-Aghtaie, M. A practical scheme to involve degradation cost of lithium-ion batteries in vehicle-to-grid applications. IEEE Trans. Sustain. Energy 2016, 7, 1730–1738. [Google Scholar] [CrossRef]
- Naumann, M.; Spingler, F.B.; Jossen, A. Analysis and modeling of cycle aging of a commercial LiFePO4/graphite cell. J. Power Sources 2020, 451, 227666. [Google Scholar] [CrossRef]
- Yue, Q.; He, C.; Wu, M.; Zhao, T. Advances in thermal management systems for next-generation power batteries. Int. J. Heat Mass Transf. 2021, 181, 121853. [Google Scholar] [CrossRef]
- Gurobi Optimization, LLC. Gurobi Optimizer Reference Manual. Available online: https://www.gurobi.com/documentation/current/refman/refman.html (accessed on 15 August 2023).


| Project Name | Rated | Storage | State | City |
|---|---|---|---|---|
| Power | Capacity | |||
| (kW) | (kWh) | |||
| Long Island Bus BESS—New York Power Authority | 1000 | 6500 | New York | Garden City |
| Redding Electric Utilities (Phase 1)—Ice Energy | 1000 | 6000 | California | Redding |
| SustainX Inc Isothermal Compressed Air Energy Storage | 1500 | 1500 | New Hampshire | Seabrook |
| Tehachapi Wind Energy Storage Project | 8000 | 32,000 | California | Tehachapi |
| Glendale Water and Power/Skylar Energy BESS Pilot | 2000 | 960 | California | Glendale |
| University of Hawaii Smart Grid Regional and Energy | 1000 | 1000 | Hawaii | Wailea |
| Storage Demonstration Project (Maui Smart Grid) | ||||
| PDE Smart Microgrid System | 90 | 29.7 | California | Commerce |
| Borrego Springs Microgrid—SDG&E | 500 | 1500 | California | Borrego Springs |
| Redding Electric Utilities (Phase 2)—Ice Energy | 6000 | 12,000 | California | Redding |
| Transmission Line | Nodes |
|---|---|
| 230 kV Panoche–Gates | DGPAN1_7_B1, HURON_6_N001 |
| 500 kV Los Banos–Gates | SNTANLA_6_N001, HURON_6_N001 |
| 230 kV Gates–Midway | HURON_6_N001, MIDWAY_1_N047 |
| Name | Capacity (MW) | Node |
|---|---|---|
| Topaz Solar Farm | 550 | TOPAZC1_7_N021 |
| Antelope Valley Solar | 250 | AVSOLAR_7_N008 |
| Desert Stateline Solar Facility | 300 | DSRTHV3_7_N003 |
| California Valley Solar Ranch | 250 | CAVLSRGN_7_B1 |
| Genesis Solar Energy Project | 250 | TOT223L2_7_N001 |
Disclaimer/Publisher’s Note: The statements, opinions and data contained in all publications are solely those of the individual author(s) and contributor(s) and not of MDPI and/or the editor(s). MDPI and/or the editor(s) disclaim responsibility for any injury to people or property resulting from any ideas, methods, instructions or products referred to in the content. |
© 2023 by the authors. Licensee MDPI, Basel, Switzerland. This article is an open access article distributed under the terms and conditions of the Creative Commons Attribution (CC BY) license (https://creativecommons.org/licenses/by/4.0/).
Share and Cite
Narayana Gowda, S.; Nazaripouya, H.; Gadh, R. Congestion Relief Services by Vehicle-to-Grid Enabled Electric Vehicles Considering Battery Degradation. Sustainability 2023, 15, 16733. https://doi.org/10.3390/su152416733
Narayana Gowda S, Nazaripouya H, Gadh R. Congestion Relief Services by Vehicle-to-Grid Enabled Electric Vehicles Considering Battery Degradation. Sustainability. 2023; 15(24):16733. https://doi.org/10.3390/su152416733
Chicago/Turabian StyleNarayana Gowda, Shashank, Hamidreza Nazaripouya, and Rajit Gadh. 2023. "Congestion Relief Services by Vehicle-to-Grid Enabled Electric Vehicles Considering Battery Degradation" Sustainability 15, no. 24: 16733. https://doi.org/10.3390/su152416733
APA StyleNarayana Gowda, S., Nazaripouya, H., & Gadh, R. (2023). Congestion Relief Services by Vehicle-to-Grid Enabled Electric Vehicles Considering Battery Degradation. Sustainability, 15(24), 16733. https://doi.org/10.3390/su152416733