Abstract
Geological hazards significantly threaten the safety of China’s railway network. As the railway system continues to expand, particularly with the effects of accelerated climate change, approximately 70% of the newly encountered geohazards occur outside of known areas. This study proposes a novel approach that can be applied to railway systems to identify potential geohazards, analyze risk areas, and assess section vulnerability. The methodology uses integrated remote sensing technology to effectively enhance potential railway hazard identification timeliness. It combines kernel density, hotspot, and inverse distance-weighted analysis methods to enhance applicability and accuracy in the risk assessment of railway networks. Using a case study in southeastern Gansu as an example, we identified 3976 potential hazards in the study area, analyzed five areas with high concentrations of hazards, and 11 districts and counties prone to disasters that could threaten the railway network. We accurately located 16 sections and 20 significant landslide hazards on eight railway lines that pose operational risks. The effectiveness of the methodology proposed in this paper has been confirmed through field investigations of significant landslide hazards. This study can provide a scientific basis for the sustainability of the railway network and disaster risk management.
1. Introduction
As the backbone of the integrated transportation system, railways play a vital role in economic and social development [1,2,3]. In recent decades, China has proactively pursued a strategy of developing a well-developed railway transportation infrastructure. As of the end of 2022, the operating mileage of railways in China reached 155,000 km, including 42,000 km of high-speed railways [4]. With the continuous planning, construction, and operation of new railway lines, the challenges of ensuring the safety of railway operations are becoming increasingly severe [5,6,7].
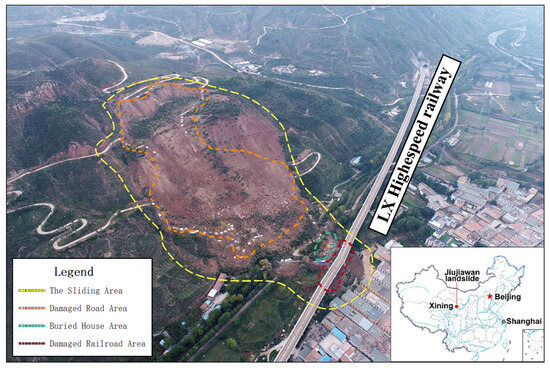
Due to the complexity of China’s natural environment, the railway network is exposed to various disaster risks at different stages throughout its life cycle [8]. Records show 445 rail service disruptions caused by geological hazards, such as landslides and mudslides, between 1981 and 2019, an average of 12 per year [9,10]. The Jiujiawan landslide (Figure 1) that occurred in 2022 even caused the Lanzhou-Xinjiang high-speed railway to stop running for a year [11]. Geological hazards also pose a significant threat to the lives of travelers [12,13,14,15]. Between 2008 and 2020, a series of landslides caused by earthquakes and localized continuous rainfall led to at least 18 fatalities, four severe injuries, and more than 120 injuries [15,16,17]. With global warming, the expected increase in extreme precipitation events may raise the probability of future railway disasters [18], and around 70% of newly occurring geological hazards extend beyond known areas [19]. Hence, conducting a thorough and efficient early identification of geological hazards along the railway network is crucial.
Figure 1.
Location, panoramic photograph, and damage of the Jiujiawan landslide. (Adapted with permission from Ref. [11]. 2023, Wang F.W. et al.).
In recent decades, researchers have used various qualitative and quantitative methodologies to assess geological hazard susceptibility [20,21,22,23,24,25,26,27,28,29]. Since the above methods are primarily constrained by limited available technical means and the accuracy of input data, there is still the potential for improving the identification of hidden risks on railway networks using correlation analysis methods [30,31]. In recent years, the rapid development of multi-source remote sensing (RS) technology has made it possible to survey large-scale geohazards [32]. Researchers have been carrying out large-scale testing and applying landslide deformation monitoring in the Three Gorges Reservoir area, the mountainous areas of western Sichuan, and the loess areas of Gansu by combining multi-source data from satellite interferometric synthetic-aperture radar (InSAR), high-resolution optical satellites, aerial or unmanned aerial vehicles (UAVs), and light detection and ranging (LiDAR) [33,34,35,36,37,38,39,40]. The successful application of these integrated RS techniques has made possible the detection and monitoring of geohazards on the railway network.
Building upon these advancements, Qiang X. et al. proposed an integrated space–air-ground investigation system that allows for the early detection, real-time prediction, and warning of catastrophic geohazards [19]. Compared to previous qualitative and quantitative research methods, this approach to the early identification of geological hazards takes advantage of the wide-area investigation capabilities offered by RS technology, and it enables a detailed characterization of major geological hazard entities’ morphology and deformation characteristics. As a result, it allows for a more accurate risk assessment and timely hazard warning. Scholars have already applied the above techniques to identify and monitor potential hazards in specific railroad sections and have achieved remarkable results [32,41,42,43,44]. However, few studies have focused on the identification, inventory, and fine monitoring of geological hazards throughout the entire railway network of the wide-ranging region.
Based on the information mentioned above, this paper proposes a methodology applicable to railway networks to identify potential geohazards, assess hazardous regions and sections of the railway network, and satisfy the need to carry out regional engineering applications. Further, the application value and shortcomings of the methodology proposed in this paper in the prevention and control of geohazards and risk management in the railway network are discussed through an application case study in southeastern Gansu Province. This study provides scientific methods for preventing and resolving potential geologic disaster risks in the railroad system and technical support for safe railway operation sustainability.
2. Methodology
Generally speaking, conventional methods of the early identification of geological hazard potentials are mainly based on RS data of different resolutions and investigation means of different scales to carry out relevant work [19]. When larger survey areas are involved, they often need to be backed up by special funding. Considering the wide range of routes in the railway system, regional censuses and detailed investigations along the routes based on RS can effectively balance macro and micro disaster prevention and control needs and realize the cost-effective early identification of potential geological disaster risks in railways.
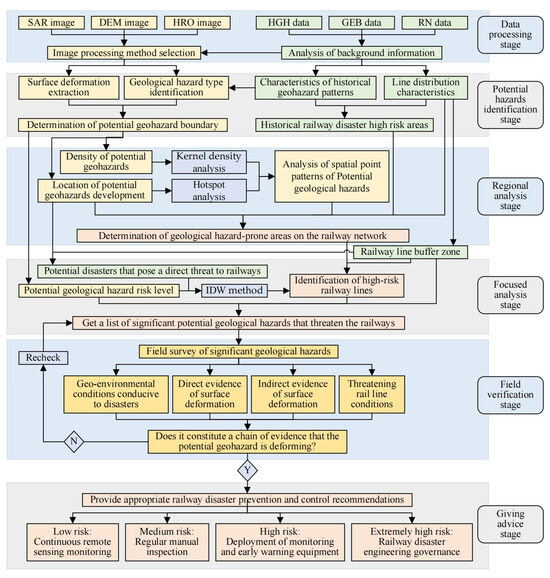
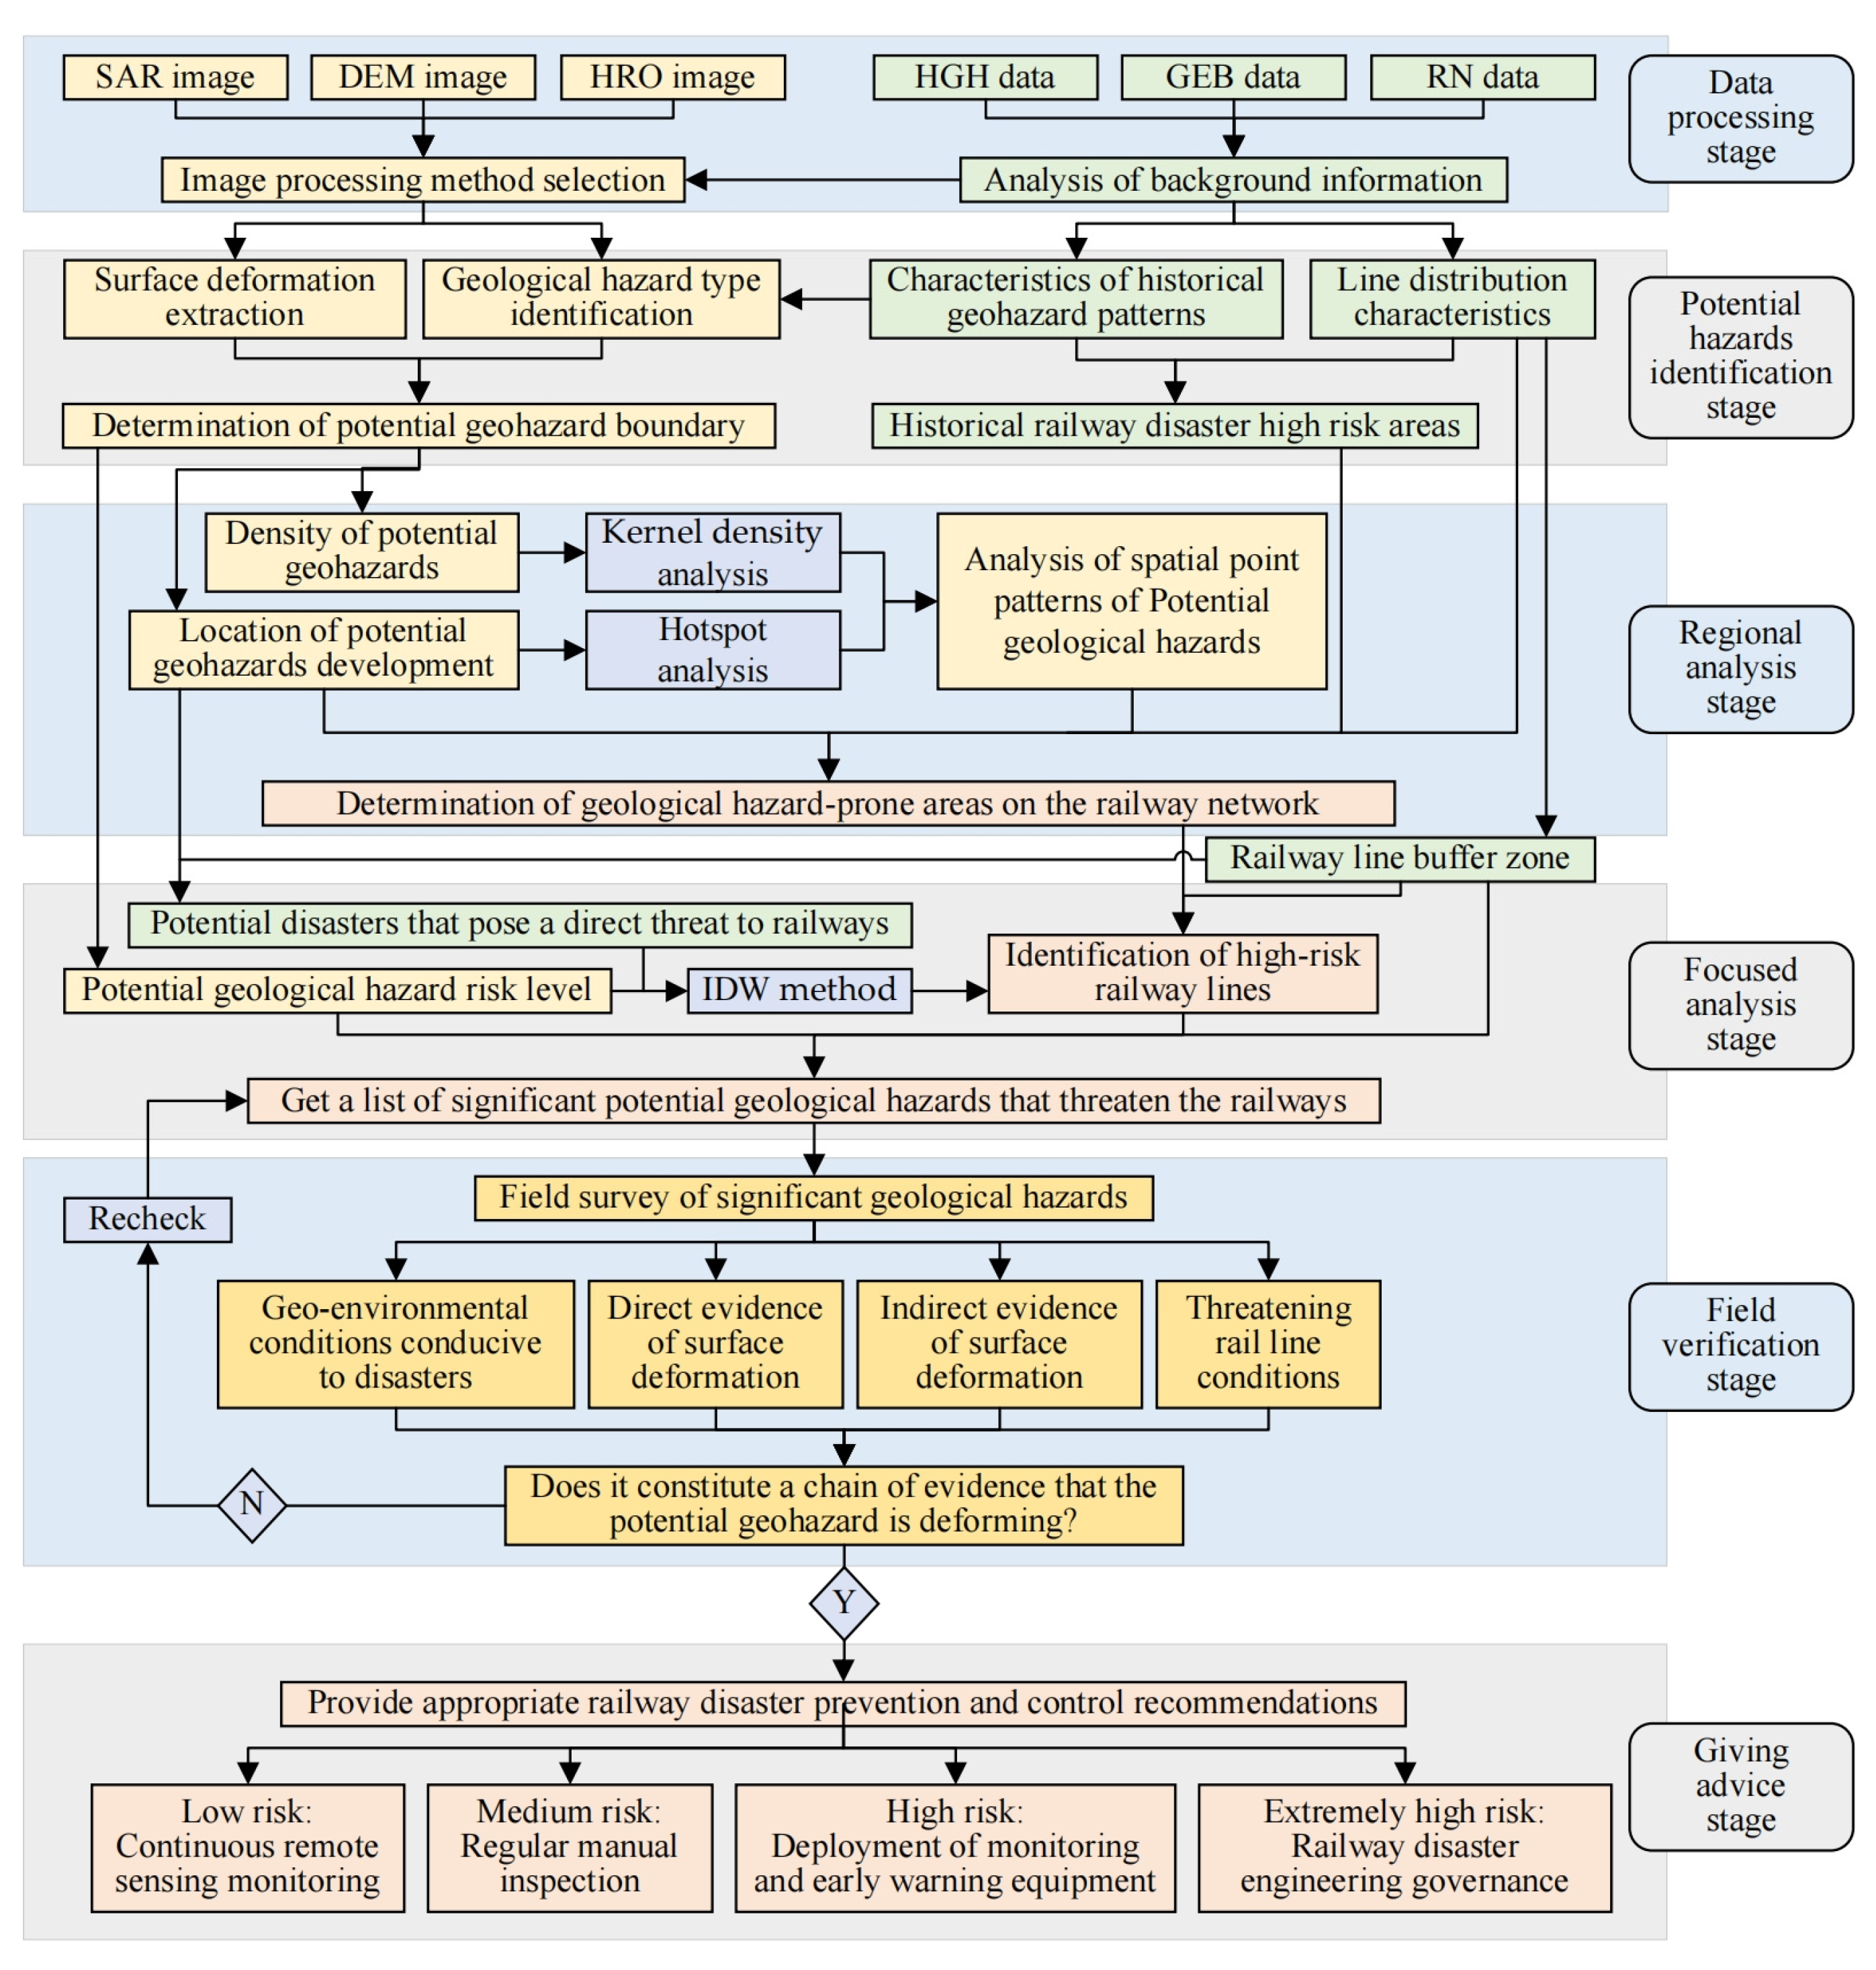
Therefore, this paper proposes a technical method for the early identification of potential geohazards that are applicable to railway networks. The method consists of six steps: data preparation, data processing, regional analysis, focused analysis, field investigation, and providing advice. Figure 2 illustrates the specific technical process depicted in this study.
Figure 2.
Technical method of early identification of geological hazards in a railway network.
This methodology focuses on the timeliness of geohazard hazard analysis and practicality in specialized fields. In general, previous qualitative and quantitative geohazard susceptibility analyses use historically recorded hazard information as background data, and therefore have a certain lag. The methodology proposed in this paper, based on the advantages of multi-source remote sensing technology, enables the accurate acquisition of the latest trends in overall morphology and surface deformation during the development of geohazards, thus providing an accurate basis for the subsequent comprehensive analysis. On the other hand, the use of kernel density analysis (KDA), hotspot analysis (HSA), and the inverse distance-weighted (IDW) methods to analyze the spatial aggregation of hidden hazards, as well as the development density of potential geohazards and the characteristics of the risk of the railway, enables to grasp the development pattern of potential disaster potentials and the scope of influence at different scales from the macro-region to the specific line section to enhance the pertinence of the deployment of the disaster prevention and control work on the railway network.
2.1. Data Preparation Stage
The study data consisted of both multi-source RS data and regional background data. Multi-source RS data, such as synthetic-aperture radar (SAR) data, digital-elevation model (DEM) data, and high-resolution optical (HRO) data, are mainly used to identify suspected geological disasters comprehensively. We collected historical geological hazard (HGH) data, geo-environmental background (GEB) data, and railway network (RN) data, mainly to understand the primary conditions of the survey area and provide information in the subsequent analysis process.
Currently, various SAR satellites in different bands have been launched globally, including Sentinel-1A/B and Radarsat-1/2 in the C-band, ALOS/PALSAR-1/2 and LuTan-1 in the L-band, Cosmo/SkyMed and TerraSAR-X in the X-band, and the BIOMASS plan in the P-band [45]. Compared with other satellites, the Sentinel-1A/B satellites provide freely available and widely accessible SAR data, which is both economical and practical [33,38,40,45,46]. Therefore, Sentinel satellite data are an ideal choice when carrying out large-scale disaster surveys of the railway network. In this methodology, the data we propose to use is from the SAR imagery in the C-band, which is provided by the European Space Agency (ESA) sentinel-1A /B satellites.
The DEM data are essential in RS data processing and geohazard feature information extraction in this technical approach. In the open data domain, a wide range of DEM data, such as the 12.5 m DEM from ALOS-PALSAR, 30 m DEM from ASTER-global, 90 m DEM from SRTM global, and so on, can be accessed free of charge [47]. Generally, 12.5 m or 30 m DEM data are acceptable. In this methodology, we suggest using the ASTER GDEM V3 data with a spatial resolution of 30 m, downloaded from the NASA official website, as the reference for SAR image processing.
The HRO data are mainly used for identifying the morphological characteristics of potential disasters and determining the extent of disaster boundaries, combined with the deformation anomaly areas detected by InSAR for comprehensive discrimination. Previous studies have shown that sub-meter optical data can better identify geohazards, with desirable results [34,38]. In this methodology, we propose using the Gaofen-2 (GF-2) satellite image with a spatial resolution of 0.8 m, which is provided by the China Center for Resources Satellite Applications (CRSA).
Natural conditions, such as topography and geological formations, are intrinsic factors in determining the occurrence of geological disasters, and the GEB data helps to analyze the causes of disasters. Although the spatial development characteristics of historical geological hazards cannot fully represent the trend of future disasters, the analysis of HGH data can establish the occurrence mechanism and early warning signs of disasters under different geological conditions, which is of great significance for the early identification of hidden railway geological disasters. The above data are generally collected and obtained from the management and investigation departments related to geologic hazards.
OpenStreetMap (OSM) is the most up-to-date and detailed spatial database available. In general, the RN data obtained in the OSM database can fulfill the research needs. The railway network is the subject of disaster prevention and control, and the accuracy and timeliness of RN data directly impact the effectiveness of subsequent analyses. Therefore, RN data must be checked and cleaned, and invalid redundant information must be removed.
At the data preparation stage, an important task is the selection of appropriate methods for preprocessing remotely sensed data, which is particularly important for SAR satellite data. Over the last two decades, traditional InSAR technology has evolved and improved significantly. Commonly used InSAR techniques, suitable for wide-scale railway geohazard identification, include D-InSAR, stacking-InSAR, permanent scatterer InSAR (PS-InSAR), and small-baseline-subset InSAR (SBAS-InSAR) [34,35,36,37,39]. Previous scholars have conducted numerous studies on the advantages, disadvantages, and applicable scenarios of the above methods [48,49], as shown in Table 1. The results of the comparative study showed that the stacking-InSAR might miss a few potential geohazards with small spatial scales, trim displacement levels, and the ones affected by the atmosphere. However, it performed well in poor coherence, with the advantages of low technical requirements and low computational effort [50]. Considering economy, efficiency, and accuracy, the stacking-InSAR is more suitable for carrying out the identification of potential disasters on railways in a large area.
Table 1.
Comparison of InSAR technical methods commonly used for wide-scale monitoring of railway geological hazards [41,42,43,44,48,49].
It assumes that the ground deformation in the study area is linear in the stacking-InSAR technique. To improve the signal-to-noise ratio (SNR) in the stacked phase and reduce the influence of noise, the unwrapped phases of a series of interferograms are stacked and average weighted. Its model can be simply expressed as Equation (1):
where is the annual average deformation rate in the LOS (line of sight) direction; is the unwrapped phase of the interferogram, and is the time baseline corresponding to the interferogram. is the number of stacked interferograms. The standard deviation of the average deformation rate can be expressed as Equation (2):
2.2. Potential Hazards Identification Stage
InSAR provides surface movement and deformation data, regionally solving the challenge of quickly surveying and identifying potential hazards on railways on a large scale. Based on the spectral features and texture differences of the HRO images, the type, scope, and threat objects of potential railway disasters can be qualitatively detected. Further, the DEM images are supplemented with hazard-related geomorphological features and some quantitative data. The determination of potential geohazard boundaries should be based on a comprehensive judgment by combining the deformation characteristics of InSAR and HRO data; otherwise, the results are prone to bias.
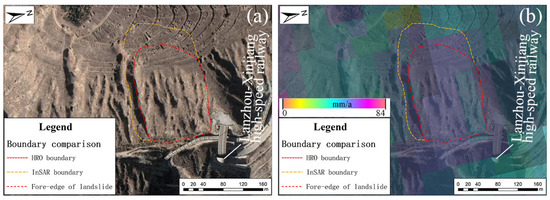
Differences in the principles, technical approaches, and boundary interpretations between HRO and InSAR have led to slightly different perceptions and results when the two methods are used together to identify potential railway hazards. The deformation of slopes will generally be reflected in hard buildings such as road surfaces and house walls. When the deformation is not large enough, it is difficult to cause signs of cracks and collapses at the surface. At this point, it becomes difficult to observe slope deformation relying on HRO; however, clear evidence can be found on InSAR. In some cases, the range of potential hazards indicated by the InSAR deformation will extend beyond the actual area where the disaster may occur, resulting in an overly large identification boundary. Figure 3 shows the results of identifying a potential landslide boundary, which threatens the Lanzhou–Xinjiang high-speed railway, based on HRO and InSAR, and it can be seen that the HRO boundary is more in line with the actual situation.
Figure 3.
Comparison of results based on HRO and InSAR for determining potential railway hazard boundaries: (a) is the morphological characteristics seen in the HRO image. (b) is the deformation signature by InSAR.
In summary, the identification of potential railway geological hazards is a comprehensive process, which not only requires a clear understanding of the formation mechanism of the disaster but also requires sufficient experience to integrate the advantages of HRO and InSAR data to make an accurate judgment on the type and boundary of the geohazard. In addition, full consideration of the environmental geology of the survey area and route-planning background information, such as the distribution features of historical geological hazards and the spatial distribution characteristics of the route, can help improve the efficiency and accuracy of the identification of potential railway geological hazards.
2.3. Regional Analysis Stage
The early identification of geological hazards on railways is a judgment of future line risk, not only by considering potential hazards along the line but prioritizing a risk analysis on a regional basis. The shortcomings of conventional qualitative and quantitative geohazard susceptibility analysis methods have been discussed previously. By utilizing the distribution location and development density of identified potential railway geohazard sites, in combination with suitable spatial analysis methods, it is possible to determine areas on the railway network that are prone to disasters.
In this technical approach, the spatial aggregation characteristics of potential geohazards are obtained through the KDA and the administrative units where densely hidden disasters are identified via the HSA. Further, the spatial analysis results are superimposed on the railway network data to determine the geological hazard-prone areas through which the line passes.
The KDA was applied to all potential railway hazard sites across the region to visualize the spatial pattern of geohazard occurrences with different aggregation characteristics and the spatial pattern of line outage events that could result from a hazard. The HSA was applied to the values of potential geohazard development density, counted using the scale of administrative units. The method complements the KDA by identifying discrete spatial clusters of administrative units with a high density of potential railway hazard development (hot spots) and a low density of potential railway geohazard development (cold spots) and their respective statistical significance confidence levels. The detailed derivation and justification of these formulas can be found in [32,51]. Using ArcGIS 10.8 as the spatial analysis platform, the above calculations can be completed quickly and accurately.
2.4. Focused Analysis Stage
At this stage, the focus of the analysis will move away from the impact of potential regional geological hazards on the rail network and focus further on specific line segments and particular hazards. An accurate evaluation of the risk level of potential geohazards that directly threaten the safety of railway operations is an essential prerequisite for conducting subsequent analyses. Combined with the morphological characteristics of the HRO of potential disasters, the deformation characteristics of InSAR and the situation of the threat objects can provide a more accurate risk level.
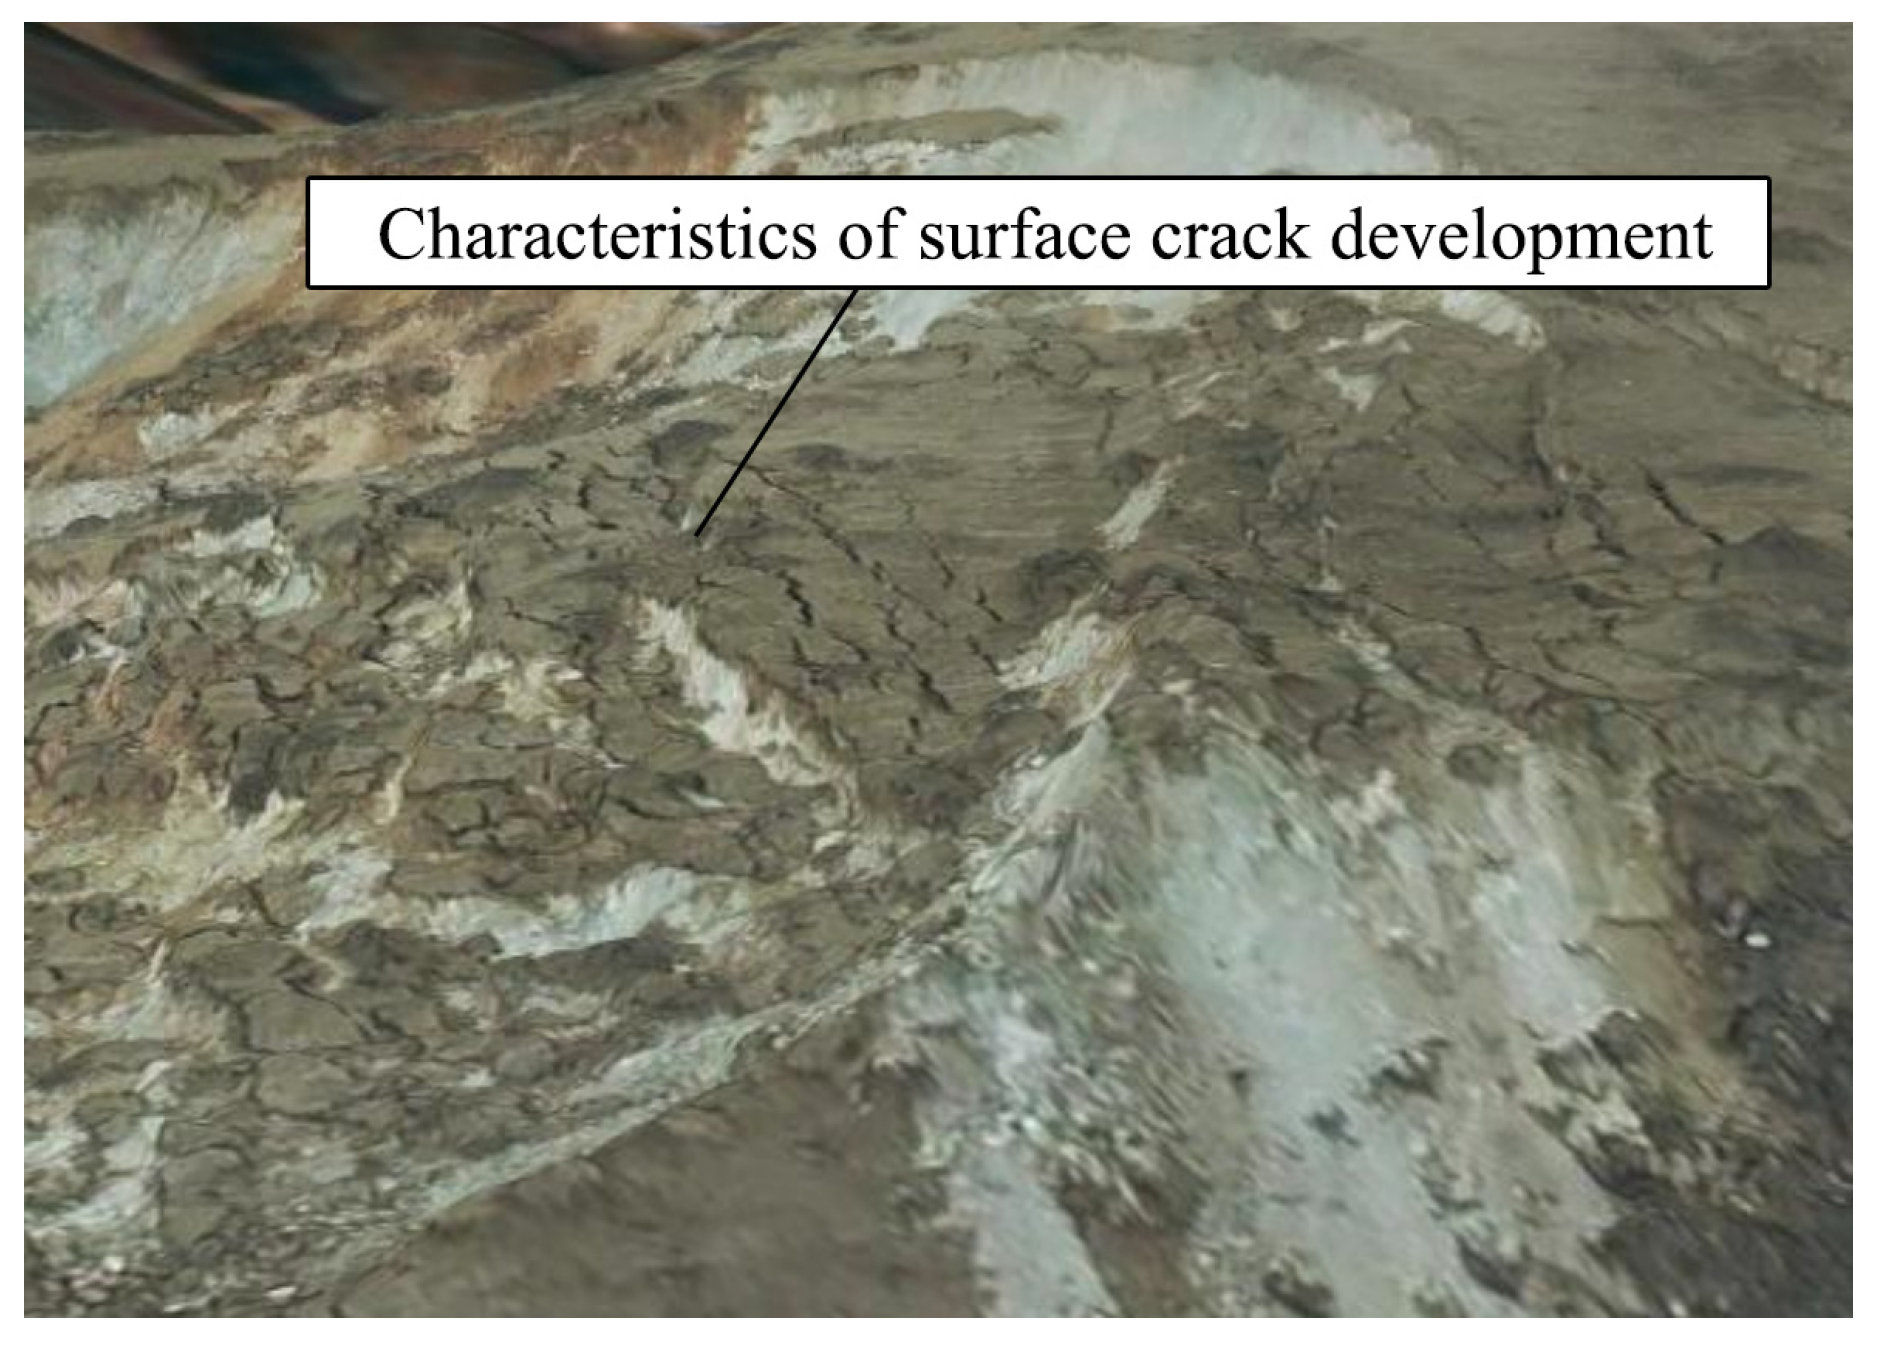
With HRO data, the developmental characteristics of potential geohazards can be observed. For example, a potential landslide with multiple significant fractures at the surface (Figure 4) could be considered extremely high risk (EHR), one with localized through-fracture development would be high risk (HR), one with a small number of minor fractures occurring would be medium risk (MR), and one with no fractures occurring but with sliding conditions would be low risk (LR).
Figure 4.
Characterization of surface crack development at the trailing edge of landslides based on the HRO data.
In terms of the deformation characteristics of InSAR, the larger the deformation area, the more significant the degree of deformation, and the more pronounced the aggregation characteristics, the higher the risk level of potential geological hazards. In addition, the grade of the railway line, the number of people at risk, and the predicted economic losses due to line stoppages are essential bases for assessing the risk level of potential geological hazards. Specific reference indicators are given in Table 2.
Table 2.
Classification of potential railway geological hazard risk based on threat objects.
The distances to potential geological hazards that threaten railway network safety vary with the changes in topography. Therefore, the railway buffer-zone distances (i.e., the distances of direct threats to line hazards) must be adjusted according to the actual situation. In general, the buffer-zone setting distance for lines in the high mountain canyon area will be less than that in the plains area but at least greater than 1 km. On this basis, the IDW technique of spatial interpolation can be used to achieve a geographic visualization of the spatial variations in potential geohazard risk levels within the buffer zone of a designated railway line. Using ArcGIS 10.8, we applied the IDW technique to create a vulnerability map of the railway line and provide a list of significant geological hazards.
2.5. Field Verification Stage
It is important to note that all potential railway geohazards were detected early based on integrated RS technology systems and were only confirmed once field investigations were carried out. The field verification included geological environmental surveys, direct and indirect evidence of surface deformation, and threats to the railway line.
Geological environment background investigation includes understanding the overall topography, water system, and vegetation of the area where the hidden danger is located, in addition to analyzing the lithology, tectonics, hydrogeology, and slide-prone strata, as well as grasping the material structure of slopes and the conditions conducive to the occurrence of disasters.
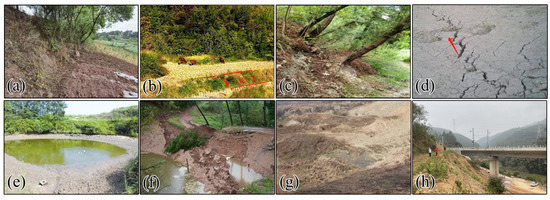
Direct evidence of surface deformation includes road and house cracks and secondary damage features after repair. Evidence should be collected in a specific spatial order during the verification process. Evidence of indirect deformation at the surface can also be used to determine the likelihood of potential railway geohazards on partially unbuilt slopes. The threat to railway lines from early identified hazards needs to be an equal focus of the investigation. Typical site survey photographs are shown in Figure 5. After detailed and accurate documentation of the field verification, all evidence should be analyzed comprehensively. Of the above, potential geological hazards that spatially form a chain of evidence of surface deformation can be recognized as a real threat to the railway line.
Figure 5.
Typical photographs of undirect evidence of surface deformation and railway line verification: (a) is a micro-geomorphic mutation; (b) is localized subsidence in arable land; (c) is diverted trees; (d) is soil tension cracks; (e) is a leaky pond; (f) is a tensile crack at the trailing edge of a slope; (g) is bulging soil at the leading edge of a slope; (h) is a slope that poses a threat to the railway line.
2.6. Giving Advice Stage
Countermeasure recommendations should be provided for the geological hazards identified as a significant threat to railway lines so that the relevant departments can deploy appropriate work according to the risk level of the hazards. Through continuous RS monitoring, regular manual inspection, monitoring and early warning equipment deployment, and engineering management, the impact of geological disasters on regular railway operations is effectively reduced.
3. Case Study Description and Materials
3.1. Study Area
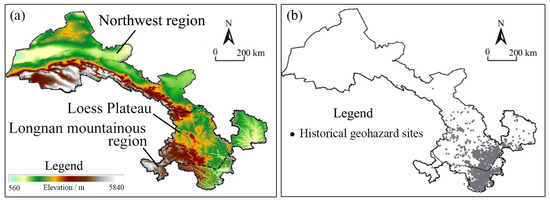
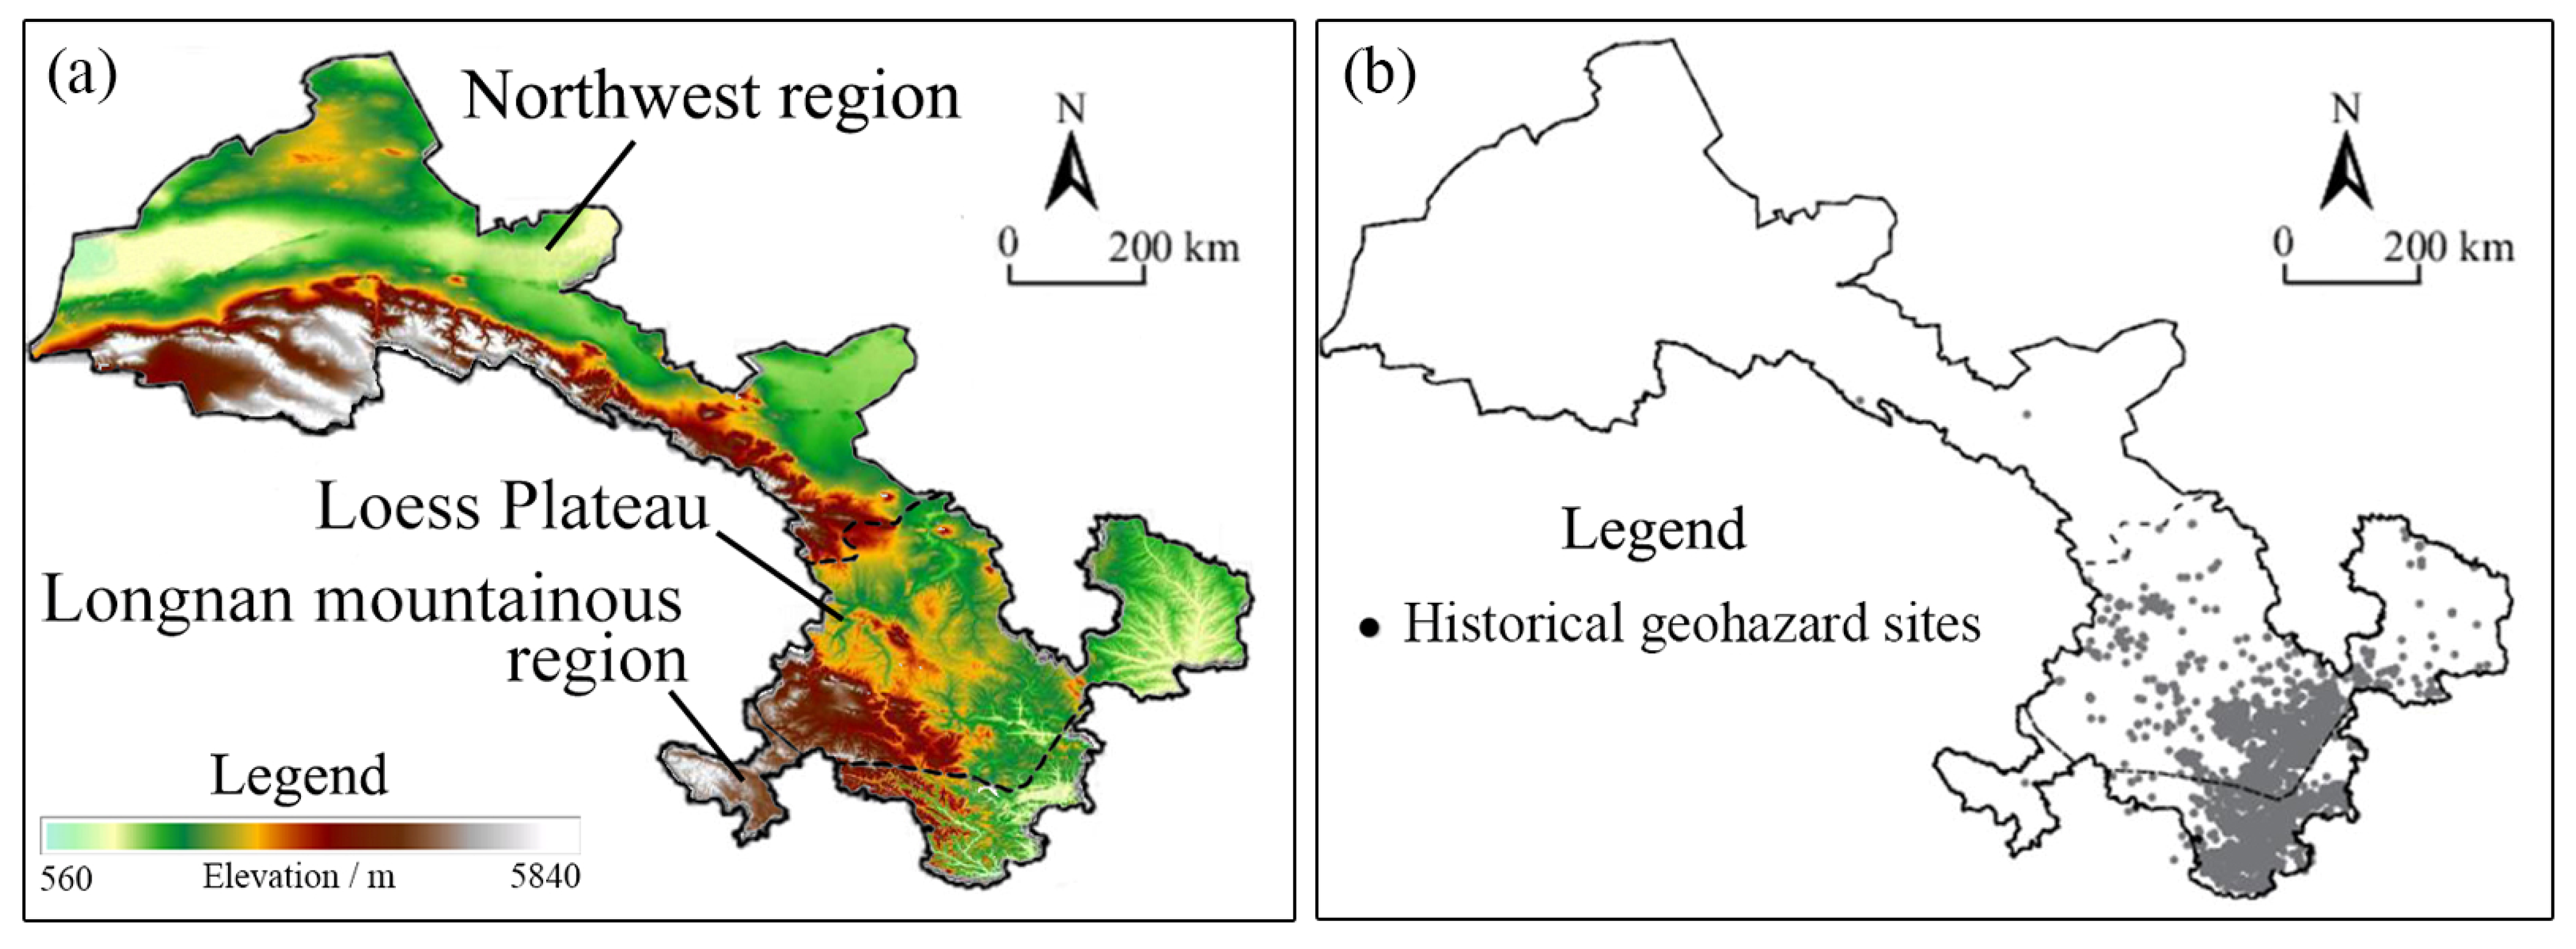
Gansu Province is located at the intersection of the Loess Plateau, the Qinghai-Tibetan Plateau, and the Mongolian Plateau, with administrative boundaries spanning the Yellow River basin, the upper reaches of the Yangtze River basin, and the inland river basins, with complex geological formations, significant differences in terrain, and low vegetation cover in most areas. This is coupled with the gradual enhancement of human engineering activities and the increase in localized short-term precipitation in recent years, resulting in the frequency of geological hazards. According to the characteristics of precipitation and climate, vegetation distribution, topography, and geomorphology of Gansu Province, the province can be divided into three regions, namely, the northwest region (the Inland River basin), the Loess Plateau (the Yellow River basin), and the Longnan Mountainous region (the Yangtze River basin), as shown in Figure 6a.
Figure 6.
Characteristics of geomorphological zoning and distribution of historical geological hazards in Gansu Province. (a) The characteristic of landform unit zoning in Gansu Province. (b) Distribution of geological disaster points in Gansu Province from April to October during 2013-2020. (Adapted with permission from Ref. [52]. 2023, Zhang J.X. et al.).
Zhang Junxia et al. recorded historical data on the geological disasters in Gansu Province from April to October during 2013–2020. [52]. The results showed that the spatial distribution of geohazards in Gansu Province presents the characteristics of high in the east and low in the west, with the number of disasters in the Yellow River and Yangtze River basin in the east being large and occurring with a high frequency. The number of geological disasters in the inland river basins in the west, especially in the corridor plains, is sparse and belongs to the low-risk zone, as shown in Figure 6b.
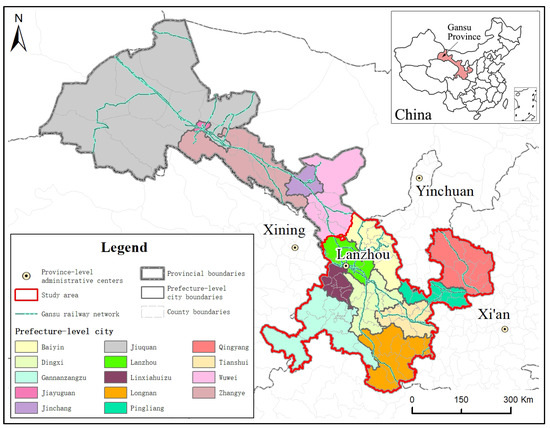
Therefore, this study focuses on the early identification and prevention of potential geological hazards on the railway network in southeastern Gansu Province (See Figure 7). There are numerous railway lines in the study area, and the overall spatial pattern of the railway network shows that Lanzhou West Railway Station is the passenger hub center and extends to the surrounding areas in the “X” shape. The railway network in the study area is prone to frequent seismic activity, which is affected by multiple potential source areas, with co-seismic landslide hazards often disrupting railway operations [23]. The 6.9-magnitude earthquake in Menyuan, Qinghai, caused damage to some railway equipment in Gansu, and the Lanzhou–Xinjiang high-speed railway was suspended [7]. During 2000–2016, 17 incidents of rainfall-induced landslides, mudslides, and other disasters led to railway shutdowns in Gansu Province [30].
Figure 7.
The geographical location map of the study area: Southeastern Gansu, China.
3.2. Data
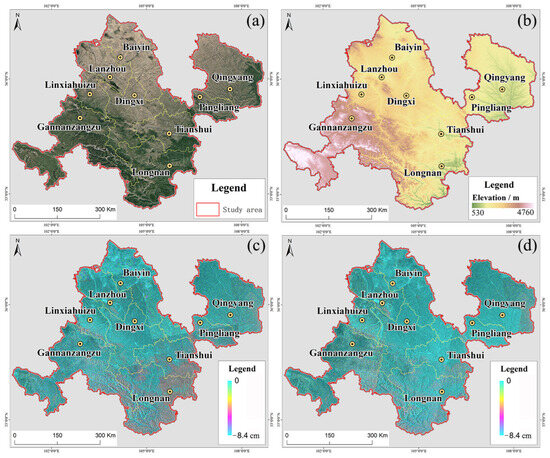
In this study, we selected satellite images with a spatial resolution of 0.8 m, acquired by the GF-2 satellite sensor from January 2022 to June 2023 as the HRO data source, which comes from the CRSA Land Observing Satellite Data Retrieval System. The GF-2 image contains four bands (the B, G, R, and NIR ranges) that indicate the Earth’s surface information. The bands and spectral ranges are listed as follows: B 0.40–0.52 μm, G 0.52–0.59 μm, R 0.63–0.69 μm, and NIR 0.77–0.89 μm. The data preprocessing steps, including ortho-correction, atmospheric correction, spatial alignment, image cropping, and data fusion, are performed in the ENVI 5.3 software. The Universal Transverse Mercator (UTM) and the World Geodetic System (WGS) 1984 coordinate system geo-rectified the images. The result of true color synthesis after processing is shown in Figure 8a.
Figure 8.
Processing results of multi-source RS data covering the study area: (a) HRO data, (b) DEM data, and (c,d) are the Sentinel-1 ascending and descending track data processed based on the stacking-InSAR method.
ASTER GDEM V3, released by NASA and the Japan Aerospace Exploration Agency (JAXA) in 2019, was used to assist in processing remotely sensed data and obtaining regional topographic features, as shown in Figure 8b. It is the most up-to-date, complete digital topographic dataset of the Earth available to the public, which covers the global land surface from 83 degrees north to 83 degrees south latitude. The root mean square error (RMSE) measured for GDEM v3 is 8.52 m.
Considering that the currently acquired X-band and L-band systems for acquiring SAR data are limited by availability and cost, this paper used Sentinel-1 data provided by the ESA as the SAR data resource. Based on the selected ascending and descending track data from January 2017 to December 2022, the annual deformation is calculated using the stacking-InSAR method. The data processing was performed in GAMMA software v202307 in this study. During processing, the single-look complex (SLC) format data of the VV polarization mode in the interferometric wide (IW) mode were used and aligned with DEM data and precision orbit data. After forming a differential interferometric network with the threshold on the perpendicular and temporal baseline, the interferograms were generated. Adaptive filtering and phase unwrapping were performed to acquire a series of unwrapped differential interferograms. The results of the Sentinel-1 ascending and descending trajectory data, processed according to the stacking-InSAR method, are shown in Figure 8c,d.
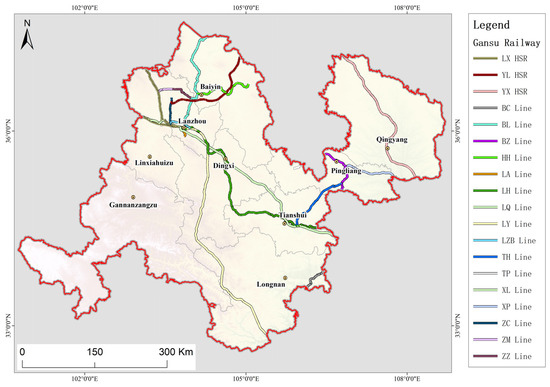
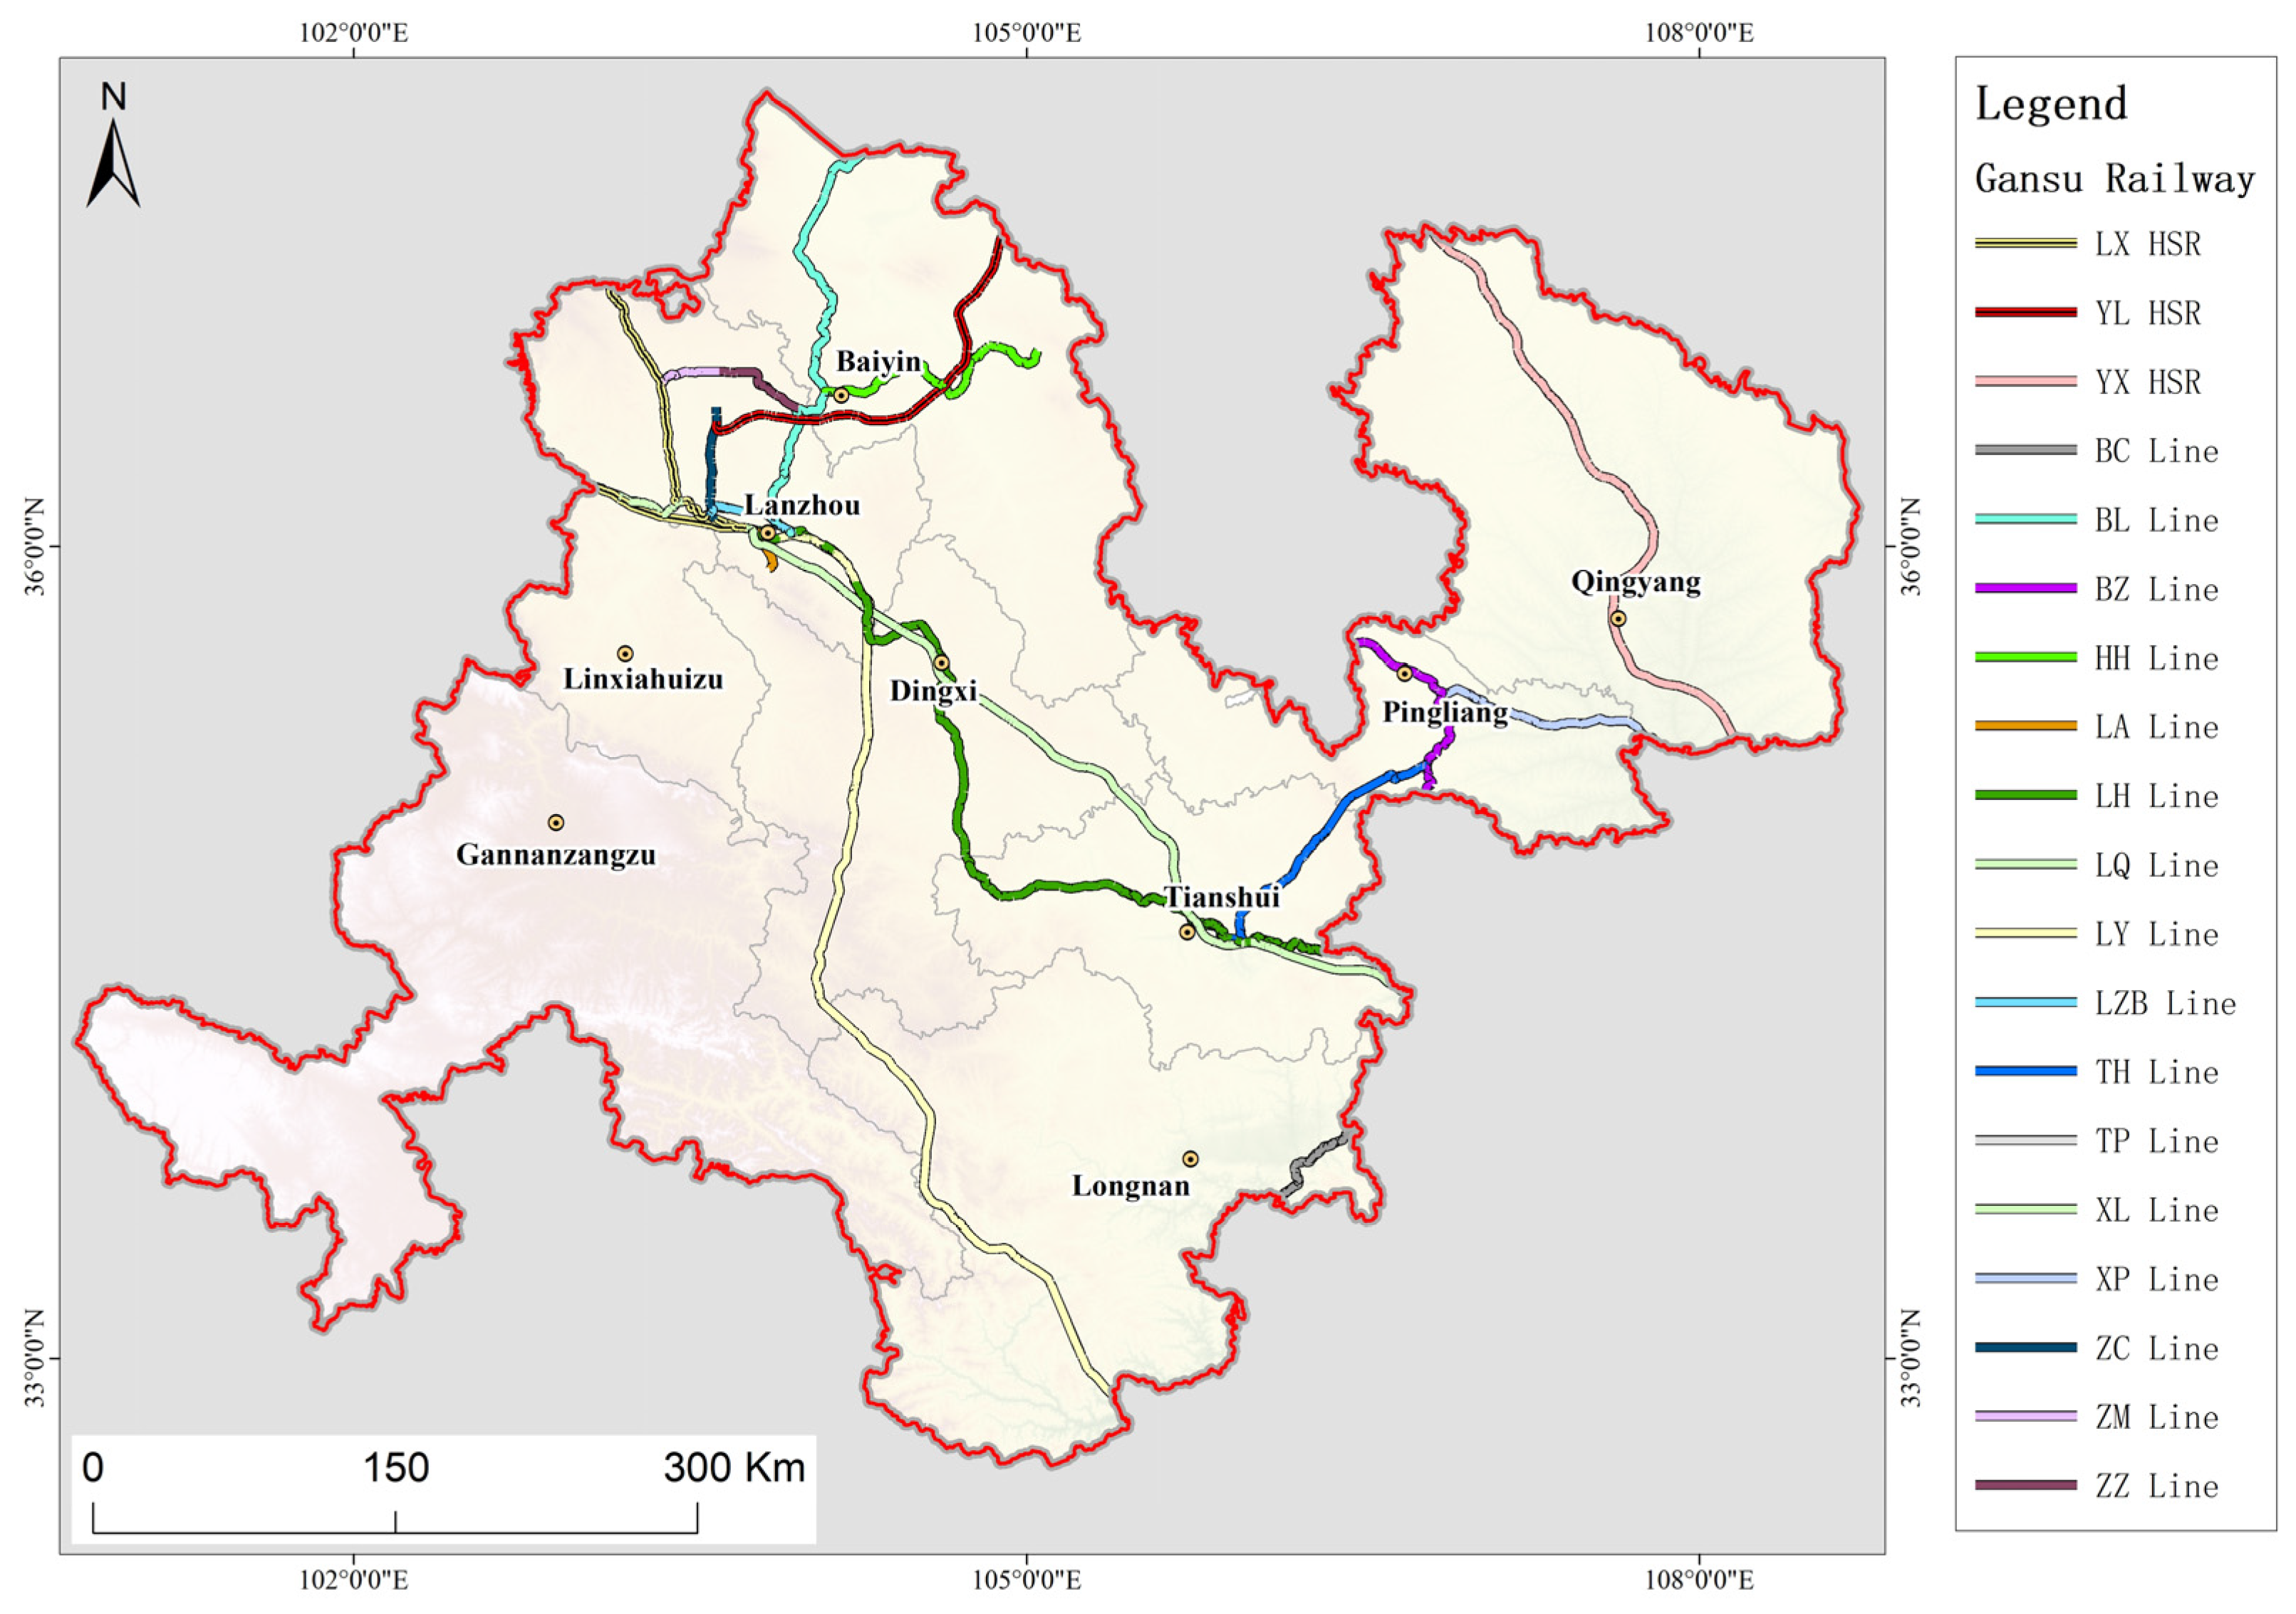
The railway network data within the study area was obtained from the OSM and includes three high-speed railways and nineteen ordinary railway lines. The raw OSM data were converted to shp format by GeoConvert and then imported into ArcGIS for processing. The processing flow includes checking and correcting railroad line connection nodes, path information, and topological relationships, supplementing missing information in the attribute table, and deleting redundant information. The processing results are shown in Figure 9.
Figure 9.
Distribution of the railway network in the study area.
Additionally, the GEB and HGH data used for the risk analysis were provided by the Gansu Provincial Geological Environment Monitoring Institute (GGEM). The GEB data provided information on the stratigraphic lithology, geological formations, slope structure, and hydrogeology of potential geohazard hazards, which helped analyze the causes of geohazards. The HGH data were mainly used to compare and analyze whether the potential railroad hazards identified were new and whether further attention should be paid. This study involved data acquisition, as shown in Table 3.
Table 3.
Summary of data used in case studies, date ranges, application, and sources.
4. Results and Analysis
4.1. Potential Hazard Identification Results
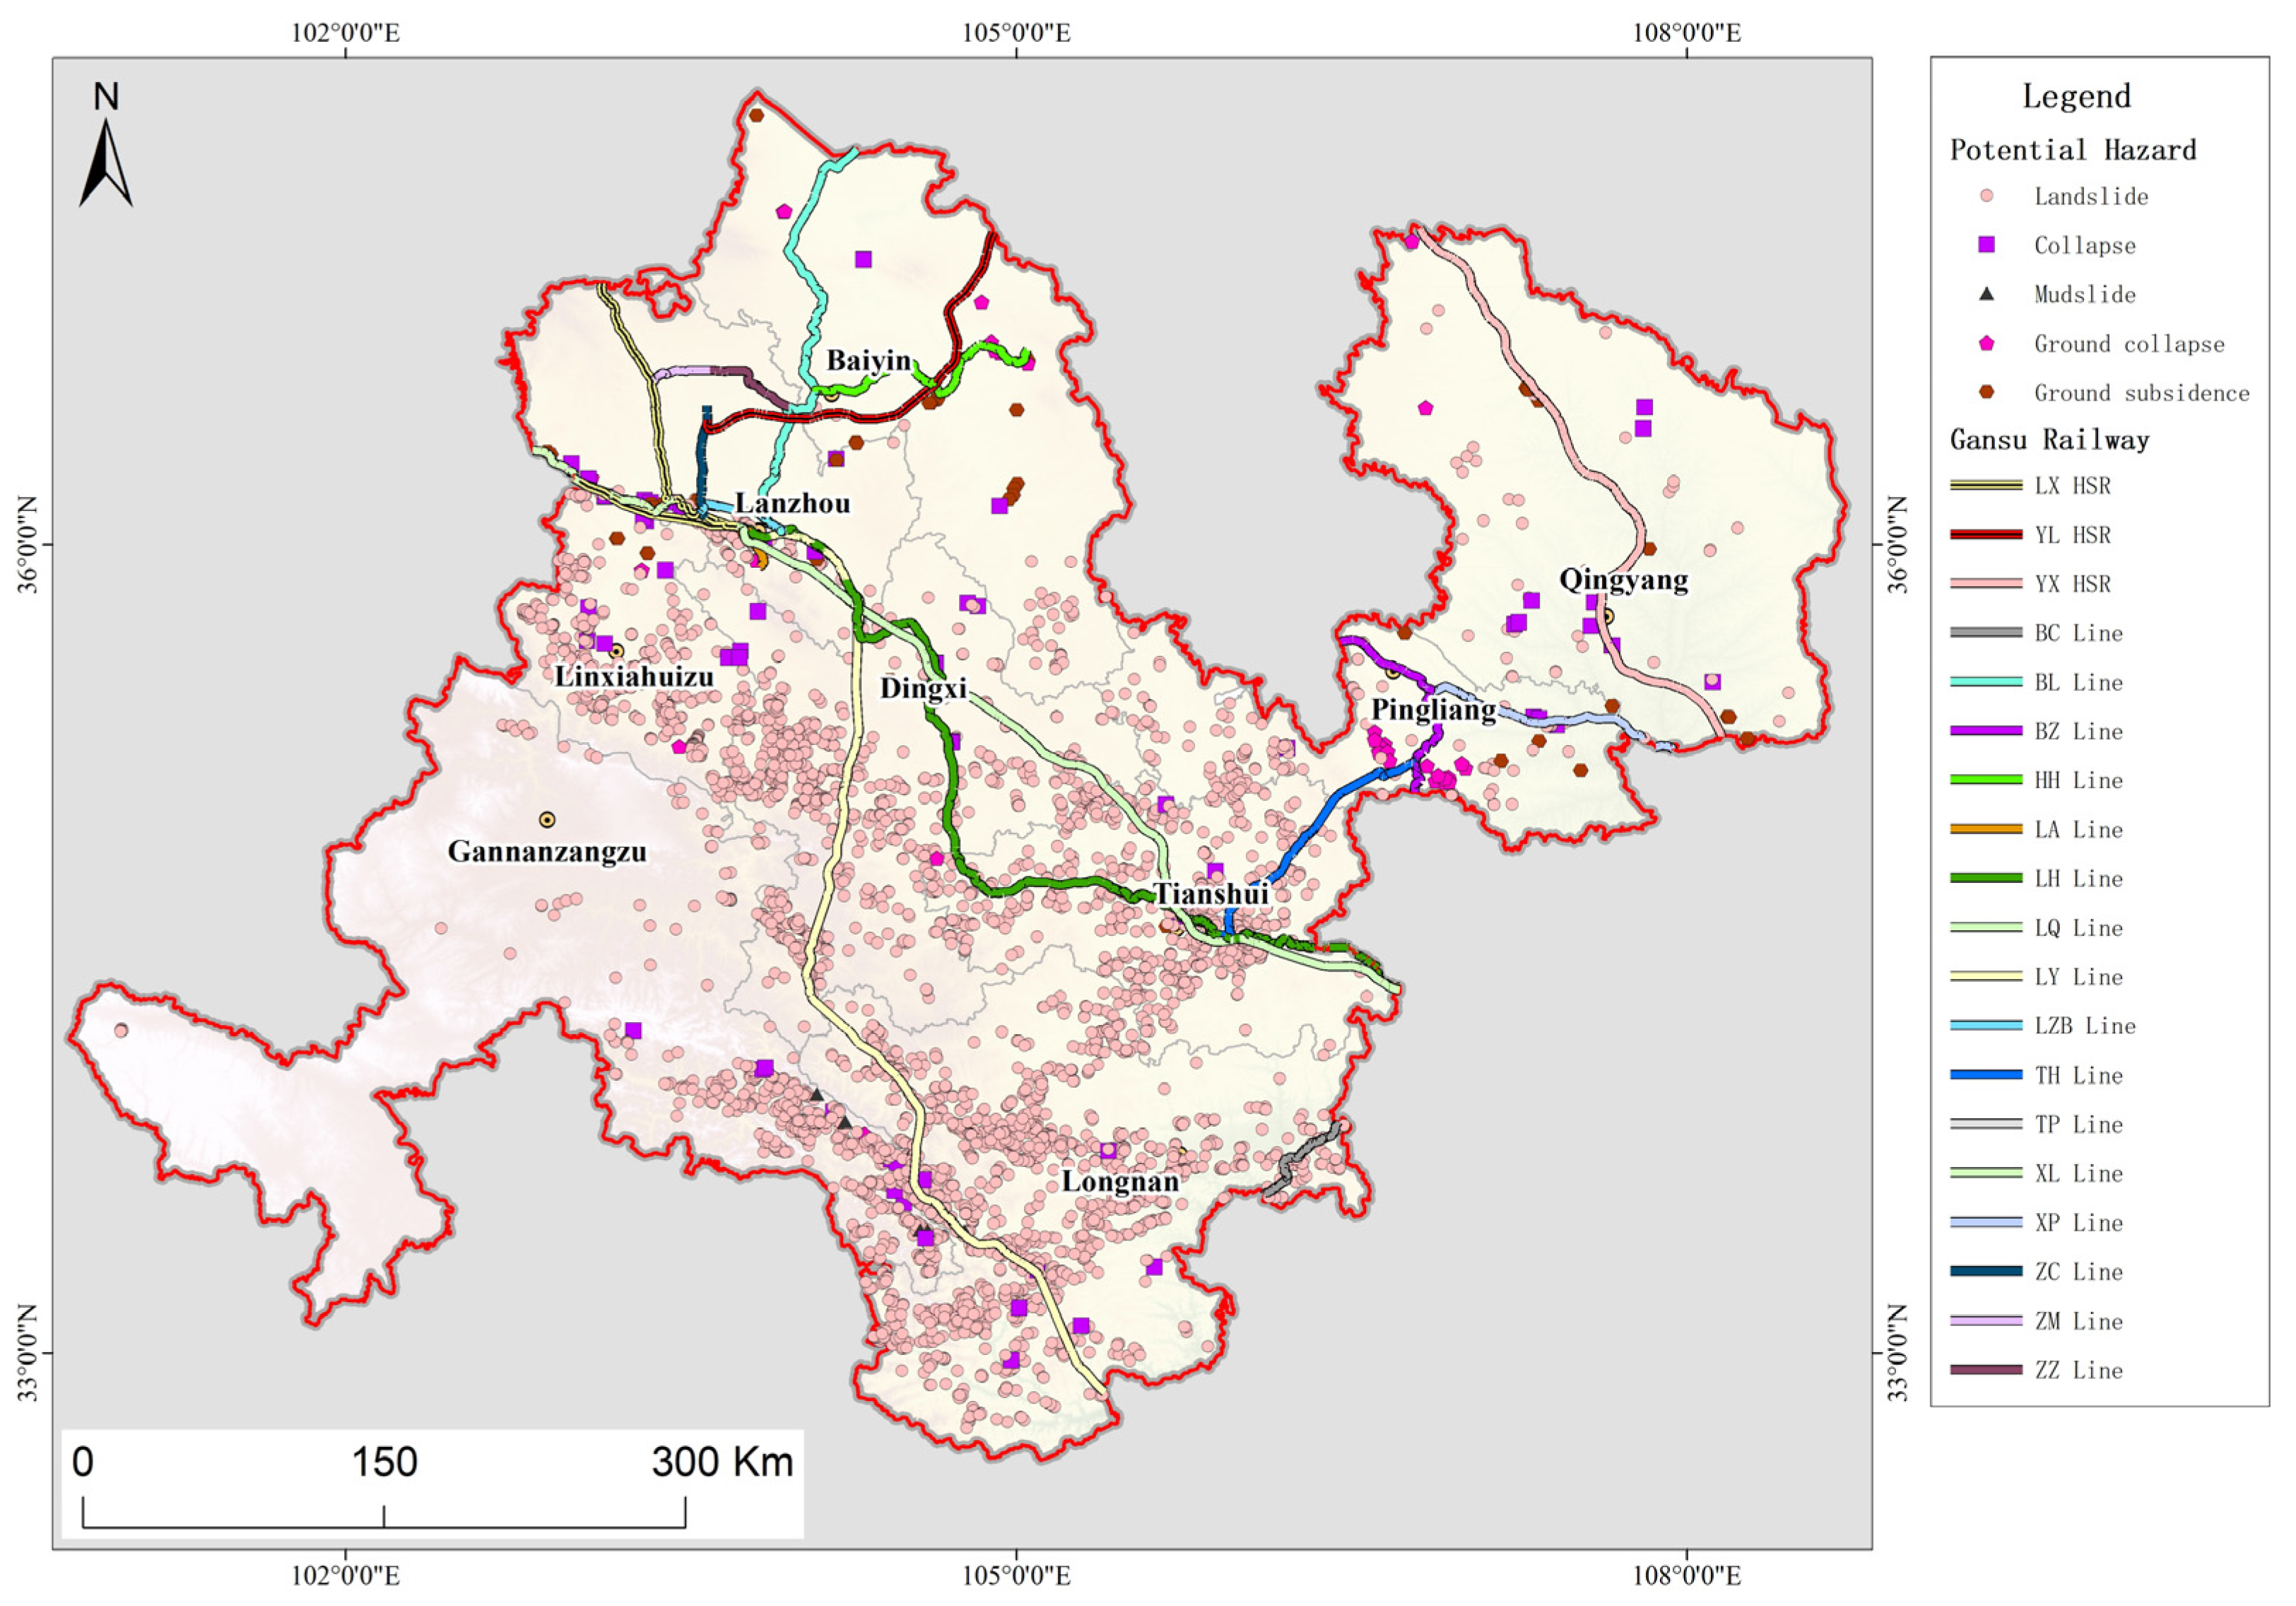
During the identification stage of a potential geohazard, a total of 3976 suspected hazards were recognized in the study area, of which 3822 were landslides, 66 were collapses, 6 were mudslides, 35 were ground collapses, and 47 were ground subsidences, with percentages of 96.13%, 1.66%, 0.15%, 0.88%, and 1.18%, respectively. By the end of 2020, there were 13,988 potential sites of geologic hazards, such as landslides, mudslides, and avalanches in Gansu Province, of which 13,456 were located within the study area [52]. In terms of spatial location, about 78% of the potential hazards identified in this study were newly identified geologic hazards. Regarding the spatial distribution characteristics, the results of this identification were distributed in strips in the central and southern parts of the study area (Figure 10), which was different from the characteristics of the historical disaster data that showed a dense distribution in the southeastern part of the area (Figure 6b). In addition, the distribution of these identified hazardous sites was more spread out than the historical record. Notably, while some hazards away from the railway network may pose a lower direct threat to line safety, they are still indicative and cannot be ignored.
Figure 10.
Characteristics of the spatial distribution of potential geological hazards in the study area.
4.2. Regional Analysis of Potential Risks to Network Rail
4.2.1. Potential Geohazard Development Density Map Obtained via KDA
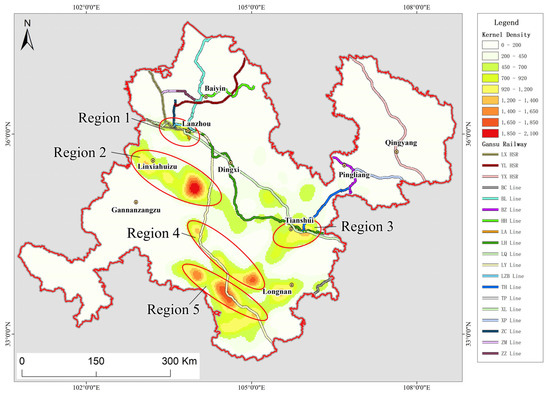
The density of the spatial development of potential geological hazards is positively correlated with the degree of hazard threat to the railway line [23,30,42]. Based on the KDA, we can find obvious spatial density clustering features of potential disasters in the areas where multiple railway lines pass through. By establishing a spatial correspondence between the railway network and the KDA values of early identified hazards, an assessment of the potential risks faced by each line in the future can be conducted. Figure 11 illustrates the presence of five distinct regions within the study area that pose certain threats to the railway line.
Figure 11.
KDA, based on the distribution characteristics of potential geological hazards and the regional distribution of impacts on the railway network in the study area.
- (1)
- Region 1 is in the northernmost part of the study area, with a core location at Lanzhou railway station. The KDA value shows moderate potential geohazard aggregation in Region 1. However, due to the importance of Lanzhou railway station as a comprehensive transport hub, it should be given priority attention.
- (2)
- Region 2 is located south of Region 1, with a significant area of high KDA values on the east side of its interior. The Lanzhou–Chongqing railway (LY Line) runs longitudinally through the eastern side of Region 2, and its length of approximately 5.2 km may pose an operational safety risk due to densely distributed potential geological hazards.
- (3)
- Region 3 is in the east-central part of the study area, and its KDA values are moderately clustered and most significant at Tianshui railway station. Tianshui railway station is a first-class station for passengers and goods in Gansu Province. It is a vital hub station for the Lanzhou–Lianyungang Railway (LH Line), Tianshui–Huating Railway (TH Line), and Xuzhou–Lanzhou Railway (XL Line). Therefore, considering the importance of Tianshui railway station in the railway network of Gansu Province, the prevention of geological disasters there is of great significance.
- (4)
- Regions 4 and 5 are located parallel to each other in the southern part of the study area, and the peak areas of KDA within them are distributed in an isolated manner. The only railway in the area is the LH Line, which crosses it in an S-shape. As such, although potential geological hazards are densely distributed within Regions 4 and 5, they merely threaten a section of the LH Line, which is approximately 124 km long.
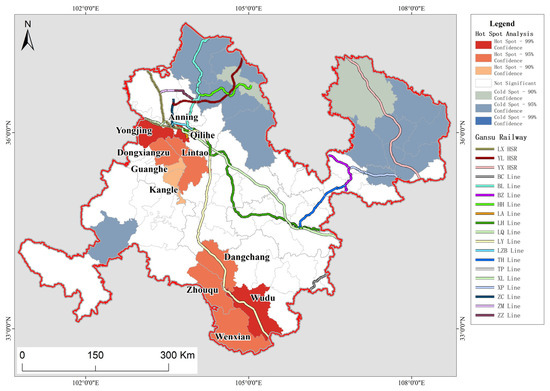
4.2.2. Administrative Unit-Scale Disaster Density Hotspot Maps Obtained via HSA
The HSA is used to analyze the development density values of potential geological hazards in the various administrative units of the study area to help prioritize railway lines that should be considered for risk assessment and disaster prevention. The HSA calculates the Getis-Ord Gi* statistic for the density of potential geohazard development in each district and county of the study area. In the calculation results, if a district has a high Z-score and a small p-value, it means that there is a dense spatial clustering of disasters. In addition, the clustering characteristics of the surrounding areas were taken into account in the statistical process. For example, a hotspot county indicates that it has a higher value of potential hazard development density, both on its own and in the neighborhood. The statistical results for the study area belonging to the hotspot counties are given in Table 4, where bin values of 3, 2, and 1 correspond to a confidence level of 99%, 95%, and 90% statistical significance, respectively.
Table 4.
Statistical results for counties that are hotspots in the study area via HAS.
Figure 12 shows the result for the HSA, where a similar pattern with the KDA can be observed: the southern part of Lanzhou and the western of Longnan have a higher density of development of potential geological hazards aggregation areas, posing a specific threat to the safety of railway operation. Differently, Yongjing and Anning counties, to the west of the Lanzhou railway station, show higher potential hazard aggregation characteristics, where the safe operation of the Lanzhou–Xinjiang high-speed railway (LX HSR) within their boundaries may be affected.
Figure 12.
The HSA for potential hazard development density in each district and county in the study area.
4.3. Focused Analysis of Potential Risks to Rail Network
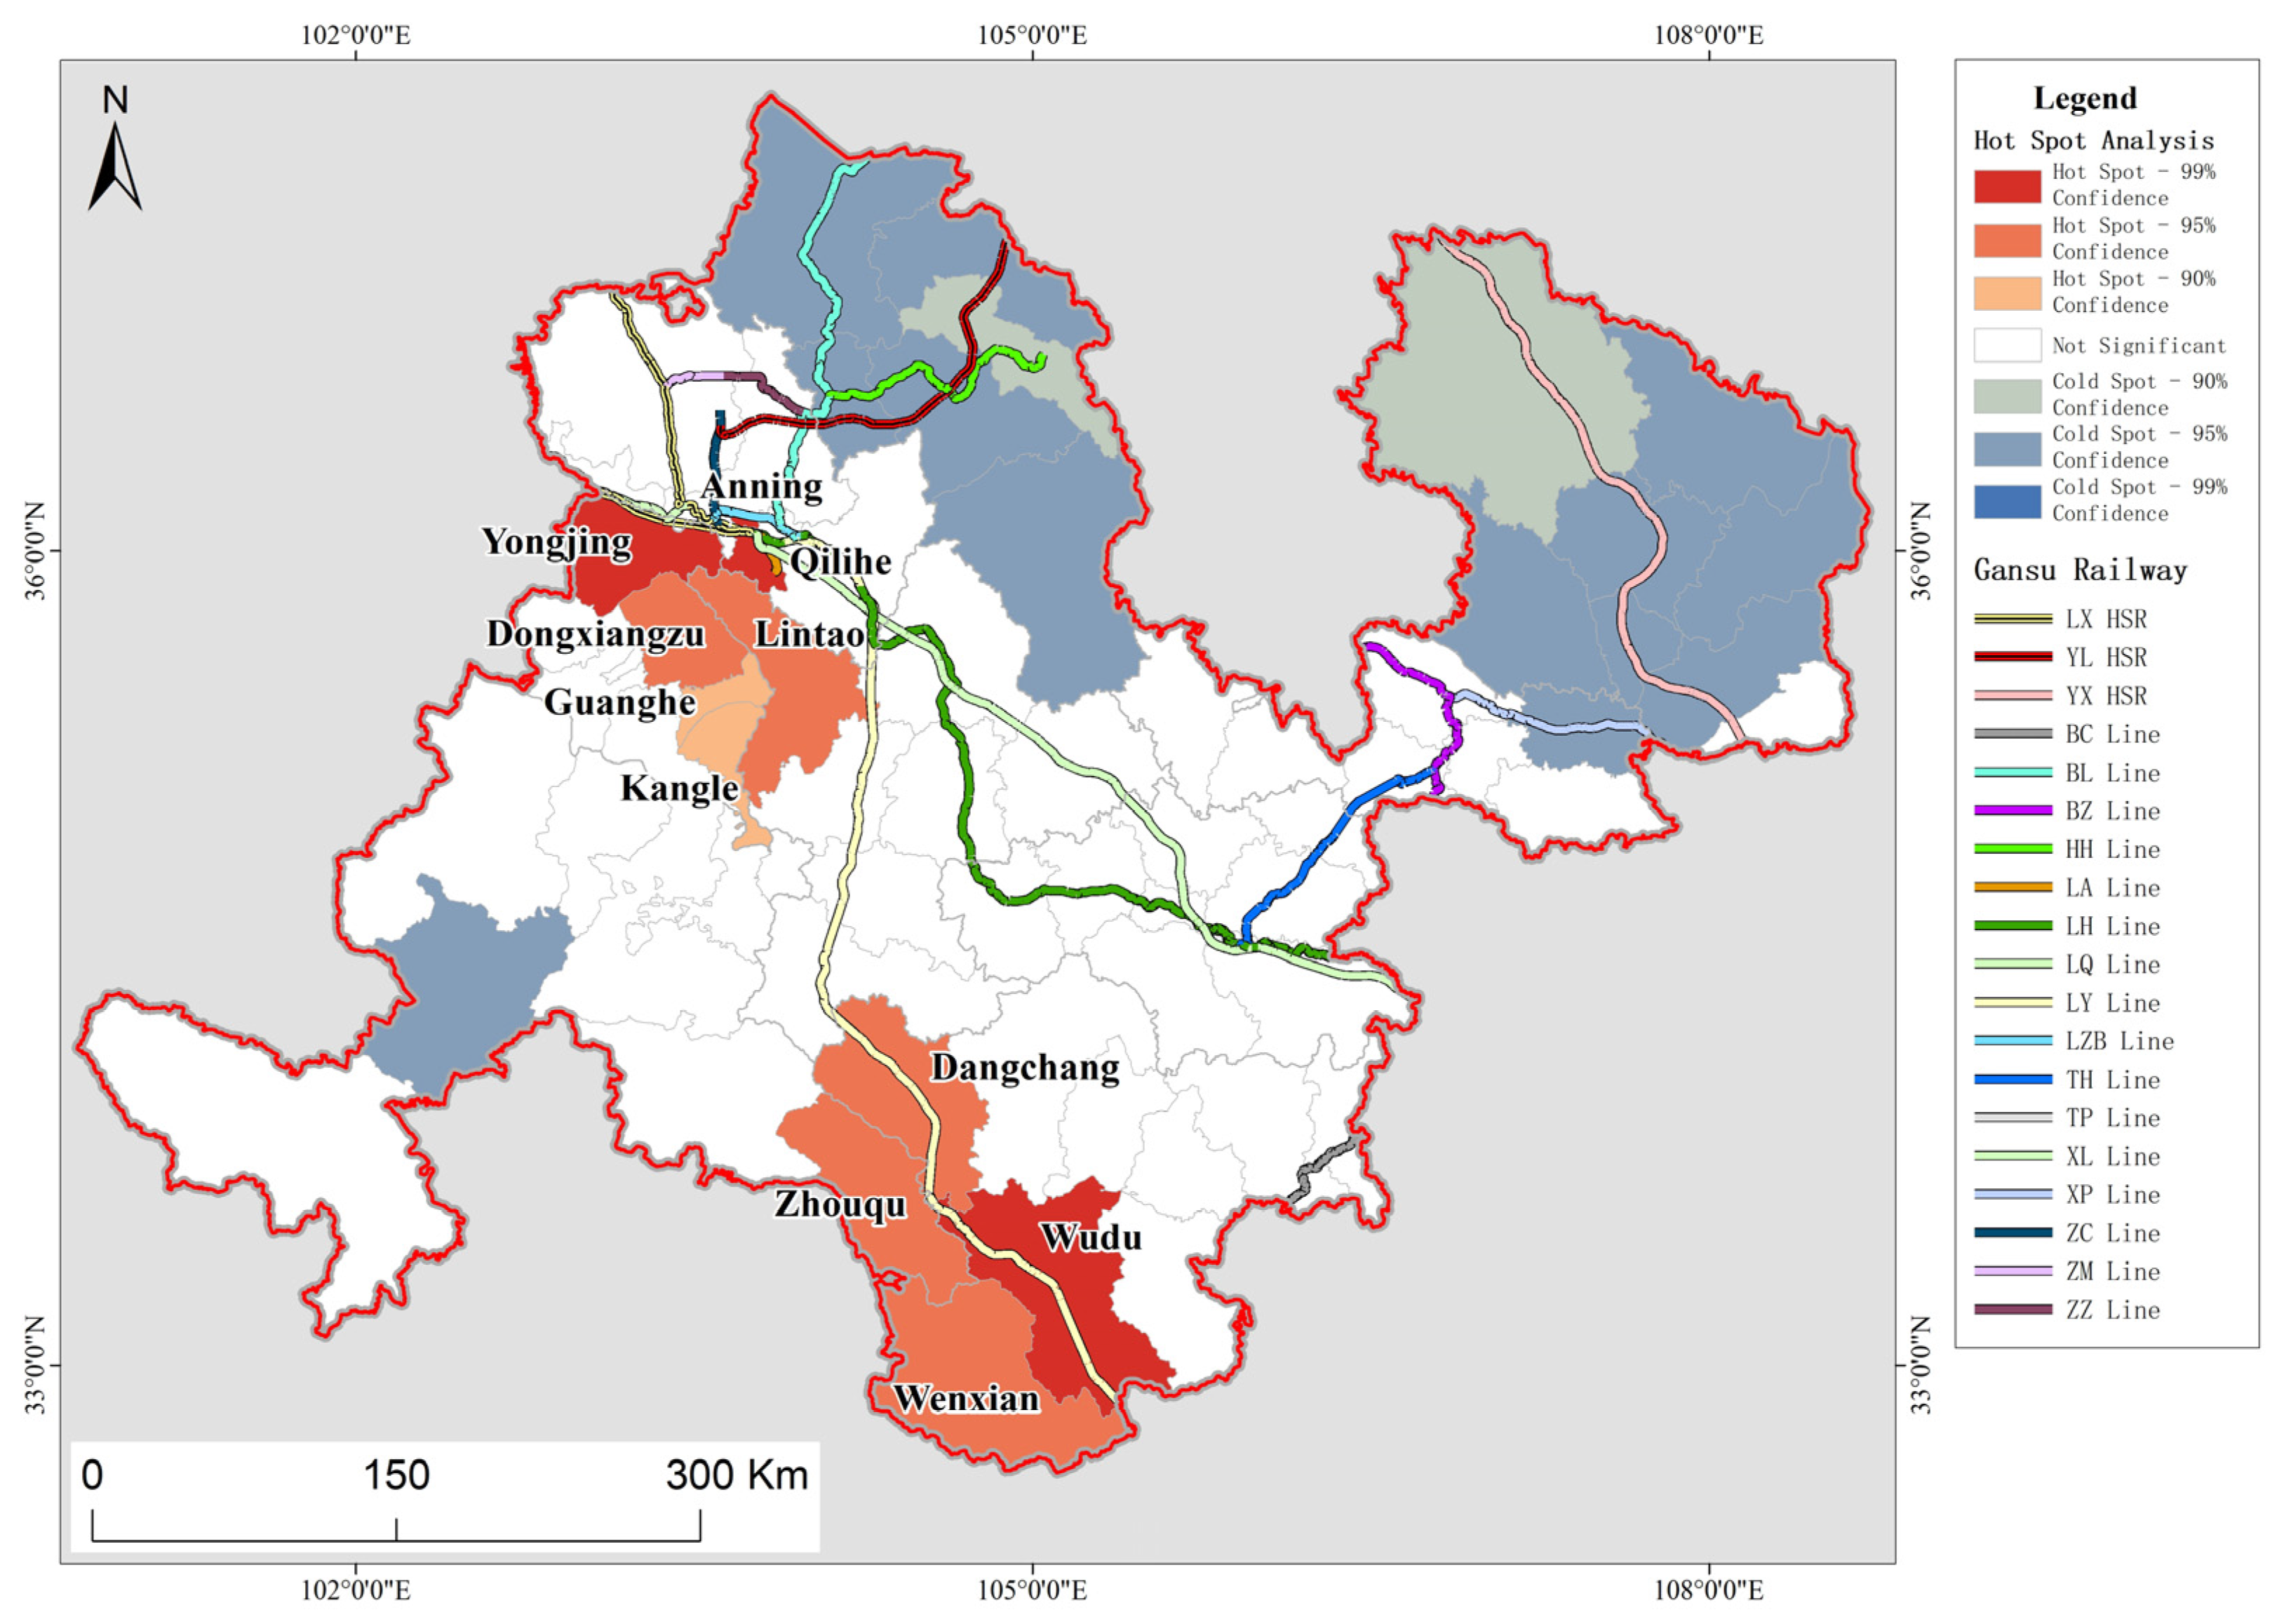
Regional analyses of potential geohazards provide a better picture of the possible threats to the railway network from the macroscopic view. However, capturing the vulnerability of specific railway lines in their actual spatial location requires that the distance and risk level of potential hazards from the line should be considered. By combining the morphological characteristics of the HRO of potential disasters, the deformation characteristics of InSAR, and the situation of the threat objects, the risk level of hazards within the 5 km buffer zone along the railway line in the study area is determined. The equivalent risk values for different routes in the railway network are obtained through the IDW analysis in ArcGIS to measure the degree of the impact of potential geohazards.
As a result, the equivalent risk values are superimposed on the buffer zone of the railway line to obtain a hazard diagram of the railway network under the influence of potential geological hazards, and it is classified into four levels, as shown in Figure 13. The ELR zone is an extremely low-risk zone, where the railway will be hardly influenced by potential geological hazards. The LR zone indicates that the railway will be influenced by potential geohazards, but the magnitude of the effect and the possibility of damaging the line is relatively low. The EHR zone indicates that the railway is susceptible to potential hazards and that damage to the line in the event of a disaster is very high. The MR and the HR zones indicate conditions between the two. The railway lines in the study area that are directly and highly affected by disaster hazards are mainly located in the northwest, middle eastern, and southern regions. Comparatively speaking, the impacts are relatively small in the southeast region.
Figure 13.
Assessment of potential hazards on the railway network.
Figure 13 shows the direct threat of potential geohazards, mainly to the eight railway lines. In the northwest region, railway sections directly threatened by potential geological hazards mainly include Lanzhou–Xinjiang High-Speed Railway Section 1 (LX HSR RS 1), Lanzhou–Xining Railway Section 1 (LQ Line RS 1), Lanzhou–Agan Railway Section 1 (LA Line RS 1), Xuzhou–Lanzhou Railway Section 1 (XL Line RS 1), and Lanzhou–Chongqing Railway Section 1 (LY Line RS 1). In the middle eastern region, railway sections directly threatened by potential geological hazards mainly include Lanzhou–Lianyungang Railway Section 1, Section 2, and Section 3 (LH Line RSs 1, 2, and 3), Xuzhou–Lanzhou Railway Section 2 and Section 3 (XL Line RSs 2 and 3), and Tianshui–Huating Railway Section 1 (TH Line RS 1). In the southern region, railway sections directly threatened by potential geological hazards mainly include Lanzhou–Chongqing Railway Section 2, Section 3, Section 4, and Section 5 (LY Line RSs 2, 3, 4, and 5) and Baoji–Chengdu Railway Section 1 (BC Line RS 1).
Differences in risk levels of potential geological hazards have differing impacts on the railway network. Compared with the regional analysis of potential risks on the railway network carried out in the previous section, the railway line hazard assessment based on the risk level can be further focused on specific railway sections. Restricted by the unique nature of railway line engineering, even though a disaster occurs in a local section, it will seriously impact the overall railway network. Therefore, when deploying railway geological disaster prevention and control work, the relevant departments need to consider the actual needs at both macro and micro levels.
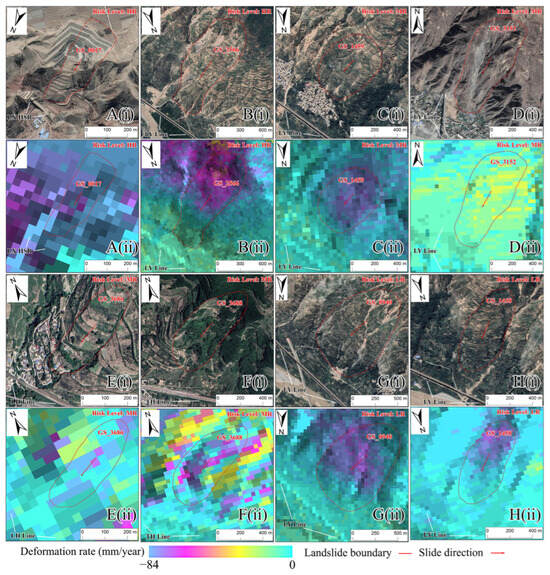
A list of potential geological hazards that significantly threaten the safety of railway operations is given in Table 5, which are characterized by their proximity to the railway line, strong InSAR deformation characteristics, significant morphological features on HRO imagery, and relatively high levels of risk, as shown in Figure 14.
Table 5.
List of potential geohazards that significantly threaten the safety of railway operations.
Figure 14.
Enlarged results for typical potential landslides. (A–H) are a portion of the potential landslide hazards given in Table 5. (i) HOR images of potential landslides and the railway they threaten. (ii) Stacking-InSAR results for potential landslides.
4.4. Field Validation of Major Potential Railway Hazard
Conducting field verification is one of the essential elements of verifying the effectiveness of methodology for the early identification of potential geohazards applicable to the railway network. Since most of the significant railway hazards identified in this study are located on slopes with no hardened surface distribution (Figure 14), such as houses or roads, the evidence of direct surface deformation that could be collected is relatively limited—however, the No. GS_0017 potential landslide is located on a slope that had been engineering governance, and the areas of surface deformation are all located within regions of artificial modification, making it possible for us to carry out the validation work. In addition, this potential hazard is at a high-risk level, and its field survey result is more represented.
The HGH data show that the hazard is a known HR disaster site that threatens the line of the LX HSR between Jiaojia village and Hexi town, as shown in Figure 14A(i). The terrain where the hazard is located is higher in the south and lower in the north, with a slope ranging from approximately 21–35° with a slope direction close to 180°. It belongs to a tectonically eroded low mountainous terrain. Slope treatment projects have been implemented for this potential landslide hazard (Figure 15). However, stacking-InSAR results show that significant deformation features remain on the current slope, as shown in Figure 14A(ii).
Figure 15.
Field photos of slope treatment project.
Synthesizing the GEB data and the field survey results, we have identified that the stratigraphic structure of the slope, where the hidden danger is located, can be divided into five layers. The uppermost layer consists of wind-deposited loess, characterized by a loose structure and a thickness of approximately 24 m. The second layer is composed of alluvial loess, exhibiting a relatively dense structure with a thickness of about 20 m. The third layer is a pulverized clay layer with visible internal stratification and a dense, hard structure, measuring approximately 8 m in thickness. The fourth layer is a pebble and gravel layer, about 5 m thick, corresponding to the accumulated sediment from the fourth terrace of the Yellow River. The lowest part comprises purplish-red sandy mudstone belonging to the Cretaceous Hekou Group. The elevation of the rear edge of the potential landslide hazard is 1711 m, approximately 130 m above the modern riverbed. The GEB data show that the hydrogeological structure of this slope is relatively unique, affected by the water-isolating effect of the clay layer in the third layer, the upper loess layer has been in a water-saturated state for a long time, and its stability is poor.
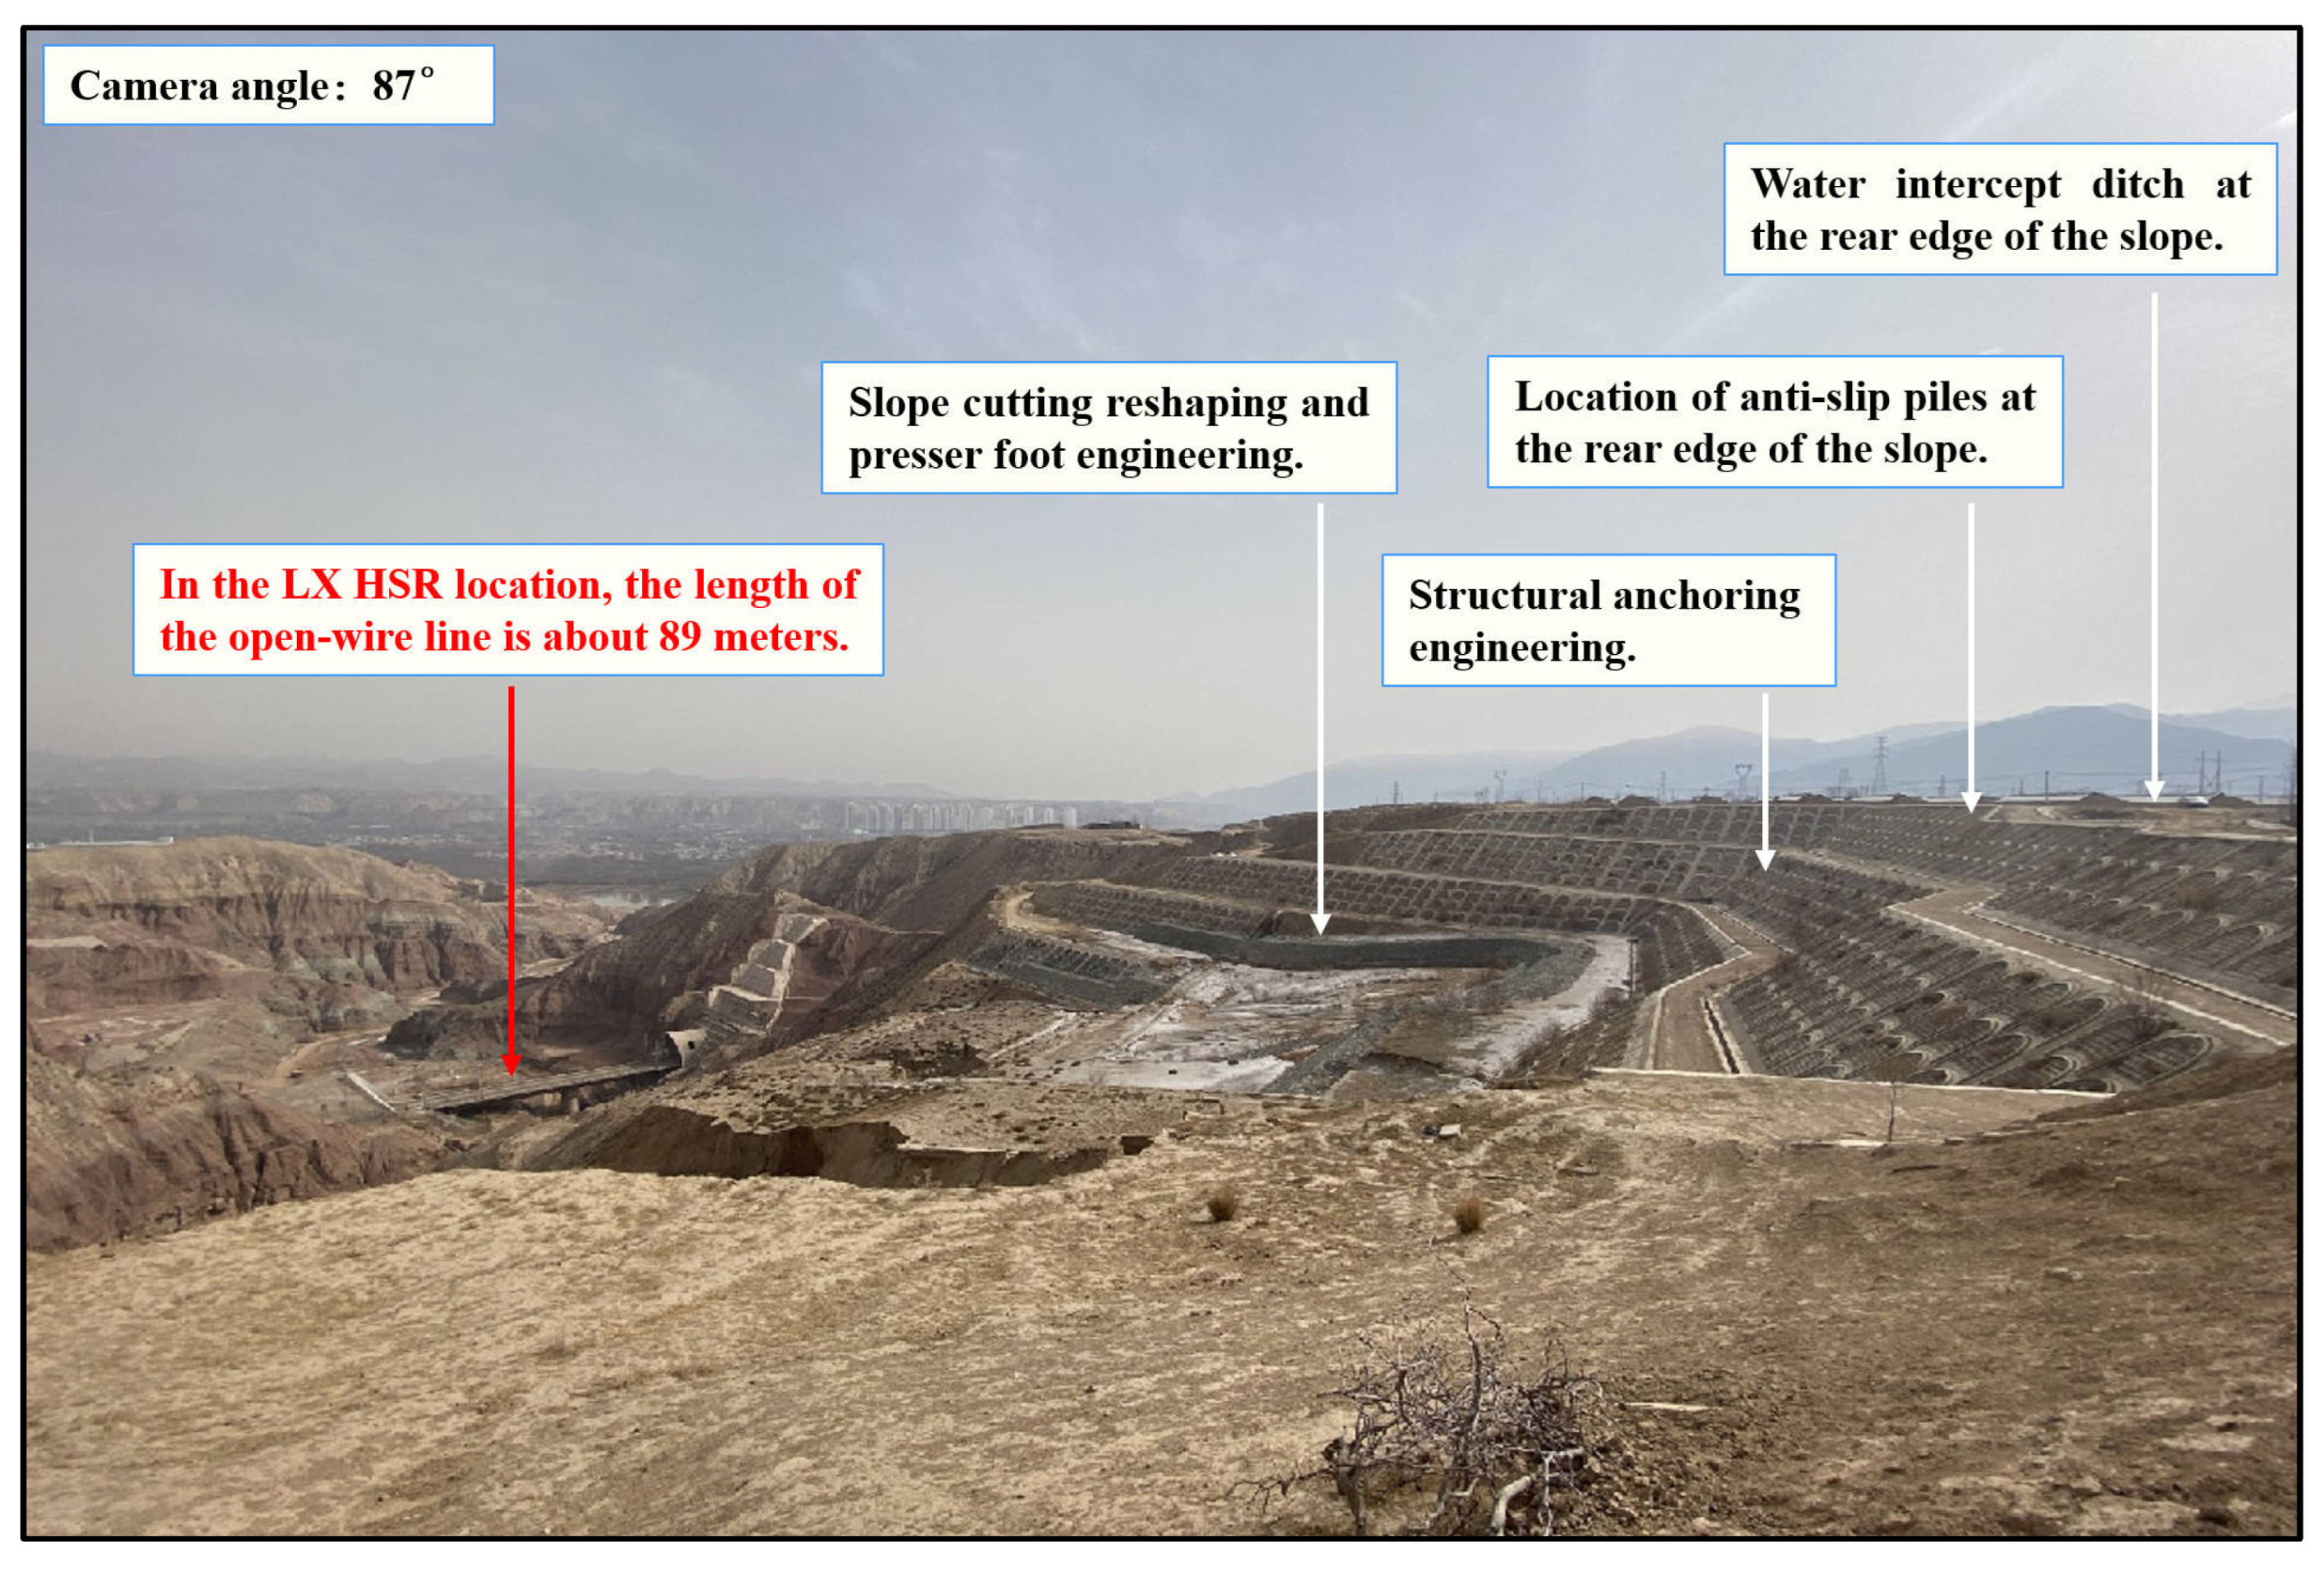
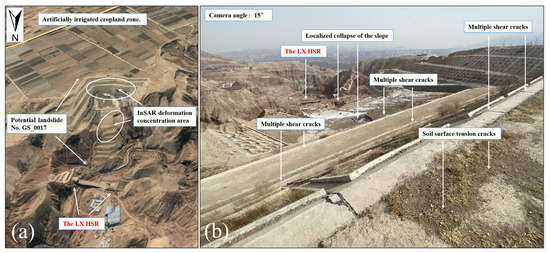
To ensure the operation safety of the LX HSR, the relevant departments have carried out comprehensive engineering management measures for potential landslides, including the construction of the water intercept ditch at the rear edge of landslides, cutting and shaping of slope, foot of slope stabilization and compaction and structural anchoring engineering, and the deployment of anti-slip piles within the weak soils, as shown in Figure 15. However, due to the long-term artificial water diversion for irrigation in the cultivated zone on the south side of the slope (Figure 16a), coupled with the blocking effect of the clay layer within the slope on the external water diversion, comprehensive management projects that were rationally implemented have been destroyed twice. We found multiple evidence of surface deformation in the InSAR deformation aggregation areas in the middle and back edge of the slope (Figure 16a), including tension cracks in the soil surface at the rear edge of the slope, multiple shear cracks in the surface of the structural anchoring engineering at the middle and rear of the slope, and localized slumps in the central part of the slope (Figure 16b).
Figure 16.
The No. GS_0017 potential landslide surroundings and local deformation characteristics. (a) The zone of artificially irrigated cropland is located south of the potential landslide. (b) Field investigation evidence of the potential landslide deformation.
In summary, the results of the field investigation coincide with the characteristics of the No. GS_0017 potential landslide, based on the comprehensive identification of RS. The location of deformations occurring in the field showed high consistency with the predicted areas of identified deformations. Considering that the potential geohazard hazards identified in this study that threaten the safe operation of railroads all belong to loess-type landslides and have similar characteristics in terms of slope structure, material composition, morphology, and scale, we believe that the results of the identification in this study can more accurately reflect the actual situation of unstable slopes.
In addition, the field verification cases illustrate that even unstable slopes treated by engineering may still exhibit persistent deformation characteristics under the influence of anthropogenic activities. In order to eliminate the threat of a No. GS_0017 landslide hazard to the operation safety of the LX High-Speed Railway completely, the focus of later disaster prevention and control should be on controlling the amount of artificial irrigation water for the cultivated land in its vicinity.
5. Conclusions and Future Works
Considering the limitations of using qualitative or quantitative historical data in analyzing regional hazard susceptibilities and the absence of a time-sensitive vulnerability assessment approach for railway networks, this paper presents a novel technical methodology for identifying potential geohazards and evaluating hazardous zones and sections of rail networks. The proposed methodology was then applied to a case study in southeastern Gansu Province, China. First, combined with the actual disaster prevention and control needs in the railway system, a complete technical methodology for the early identification of potential geohazards in the railway network was given. Second, through the application of a case study, we identified 3976 potential hazards in the study area, analyzed five hazard-intensive areas and 11 disaster-prone districts and counties that may pose a threat to the railroad network, and accurately located 16 sections and 20 significant landslide hazards on eight railway lines that pose operational risks. Finally, the correspondence between the predicted deformation area and the actual deformation location was verified through a field investigation of a significant landslide hazard, proving the validity of the methodology proposed in this paper.
Although this paper proposed a complete methodology from the perspective of potential geohazard prevention and control in railroad networks, verified its reliability through application cases, and provided a scientific basis for the railway department to establish emergency plans, there are still some deficiencies.
First, based on the cost considerations, the SAR data used in this paper come from the open-source Sentinel-1 satellite provided by the ESA, and there is still room for further improvement in the accuracy of the subsequent surface deformation information extraction if it can be coupled with commercial data, such as the ALOS satellite.
Second, the effectiveness of the methodology proposed in this paper has been preliminarily verified in the distribution area of the railroad network with low vegetation cover (e.g., the loess hilly area of Gansu), and it can be generalized for use in the same type of area. However, limited by the characteristics of the side-view imaging of SAR satellites as well as the impact of high altitude differences in mountainous areas, dense vegetation, ice, and snow cover, and a complicated and changeable climate, realizing large-scale applications in the southeast coastal area, southwest high mountain valley area, and even the whole land scale in China is still a complex problem to overcome in the future.
Third, this paper focuses on the vulnerability of the railway network under the influence of potential geohazards but fails to consider the social attributes of sustainable operational development of railroads. Factors such as the frequency of operation of different railroad lines, the number of passenger trips, and the potential economic losses resulting from line disruptions should also be considered in future research.
Finally, the methodology proposed in this paper focuses on the integrated RS identification of potential hazards, spatial distribution characterization, and risk assessment of the railway network, and future research should incorporate the triggers of geohazards such as heavy rainfalls and earthquakes into the technical system, as well as use scenario-specific simulations to conduct a comprehensive analysis of the vulnerability of the railway network.
Author Contributions
Conceptualization, P.H. and Z.G.; methodology, P.H. and Z.G.; validation, P.H., Z.G. and H.C.; formal analysis, P.H. and G.W.; investigation, P.H., P.S. and X.Z.; writing—original draft preparation, P.H.; writing—review and editing, Z.G.; visualization, P.H. All authors have read and agreed to the published version of the manuscript.
Funding
This research was funded by the Geological Survey Project of China Geological Survey (Grant nos. DD20211365 and DD20230083). This work was also supported by the Gansu Province 2023 Geological Hazard Comprehensive Remote-Sensing Identification and Hidden Danger-Point Verification Project technical services and hardware procurement project (GSZYTC-ZCGK-23029).
Institutional Review Board Statement
Not applicable.
Informed Consent Statement
Not applicable.
Data Availability Statement
Data are contained within the article.
Conflicts of Interest
The authors declare no conflict of interest.
References
- Gansu Provincial Development and Reform Commission. “14th Five-Year Plan” and Medium and Long-term Railway Network Development Plan. 2021. Available online: https://fzgg.gansu.gov.cn/fzgg/c106108/202111/1899076.shtml (accessed on 2 October 2023).
- Jin, F.J.; Ding, J.X.; Liu, D.; Wang, C.J. Transportation development transition in China. Chin. Geogr. Sci. 2012, 22, 319–333. [Google Scholar] [CrossRef]
- Wang, W.; Cai, K.Q.; Du, W.B.; Wu, X.; Tong, L.; Zhu, X.; Cao, X.B. Analysis of the Chinese railway network as a complex network. Chaos Solitons Fractals 2020, 130, 109408. [Google Scholar] [CrossRef]
- Ministry of Transport of the People’s Republic of China. Statistical Bulletin on Transportation Sector Development, 2022. 2023. Available online: https://www.gov.cn/govweb/lianbo/bumen/202306/content_6887539.htm (accessed on 4 October 2023).
- Jiao, J.J.; Wang, J.; Jin, F.J. Impacts of high-speed rail lines on the city network in China. J. Transp. Geogr. 2017, 60, 257–266. [Google Scholar] [CrossRef]
- Wu, C.L.; Fang, D.P.; Li, N. Roles of owners’ leadership in construction safety: The case of high-speed railway construction projects in China. Int. J. Proj. Manag. 2015, 33, 1665–1679. [Google Scholar] [CrossRef]
- Yin, L.Z.; Wang, Y.F. Network characteristics and vulnerability analysis of Chinese railway network under earthquake disasters. ISPRS Int. J. Geo-Inf. 2020, 9, 697. [Google Scholar] [CrossRef]
- Cui, P.; Ge, Y.; Li, S.; Li, Z.; Xu, X.; Zhou, G.G.D.; Chen, H.; Wang, H.; Lei, Y.; Zhou, L.; et al. Scientific challenges in disaster risk reduction for the Sichuan–Tibet Railway. Eng. Geol. 2022, 309, 106837. [Google Scholar] [CrossRef]
- Liu, K.; Wang, M.; Cao, Y.; Zhu, W.; Yang, G. Susceptibility of existing and planned Chinese railway network subjected to rainfall-induced multi-hazards. Transp. Res. Part A Policy Pract. 2018, 117, 214–226. [Google Scholar] [CrossRef]
- Zhu, W.H.; Liu, K.; Wang, M.; Koks, E.E. Seismic risk assessment of the railway network of China’s mainland. Int. J. Disaster Risk Sci. 2020, 11, 452–465. [Google Scholar] [CrossRef]
- Wang, F.W.; Chen, Y.; Yan, K.M. A destructive mudstone landslide hit a high-speed railway on 15 September 2022 in Xining city, Qinghai province, China. Landslides 2023, 20, 871–874. [Google Scholar] [CrossRef]
- Chen, X.Z.; Lu, Q.C.; Peng, Z.R.; Ash, J.E. Analysis of transportation network vulnerability under flooding disasters. Transp. Res. Rec. 2015, 2532, 37–44. [Google Scholar] [CrossRef]
- Li, W.L.; Zhu, J.; Fu, L.; Zhu, Q.; Xie, Y.K.; Hu, Y. An augmented representation method of debris flow scenes to improve public perception. Int. J. Geogr. Inf. Sci. 2021, 35, 1521–1544. [Google Scholar] [CrossRef]
- Christopher, S.; Nikola, B. Passenger-centered vulnerability assessment of railway networks. Transp. Res. Part B Methodol. 2020, 136, 30–61. [Google Scholar]
- Yin, L.Z.; Zhu, J.; Li, W.S.; Wang, J.H. Vulnerability analysis of geographical railway network under geological hazard in China. ISPRS Int. J. Geo-Inf. 2022, 11, 342. [Google Scholar] [CrossRef]
- Wei, M.; Fang, S.J.; Chen, S.; Lin, R.Y.; Huang, Y.; Yang, L. Resilience Assessment of Road Networks in the Extremely Severe Disaster Areas of the Wenchuan Earthquake. Front. Earth Sci. 2022, 10, 834302. [Google Scholar] [CrossRef]
- Zheng, Q.; Shen, S.L.; Zhou, A.N.; Cai, H. Investigation of landslides that occurred in august on the Chengdu–Kunming railway, Sichuan, China. Geosciences 2019, 9, 497. [Google Scholar] [CrossRef]
- Sun, S.; Gao, G.; Li, Y.; Zhou, X.Y.; Huang, D.P.; Chen, D.L.; Li, Y.Q. A comprehensive risk assessment of Chinese high-speed railways affected by multiple meteorological hazards. Weather Clim. Extrem. 2022, 38, 100519. [Google Scholar] [CrossRef]
- Xu, Q.; Dong, X.J.; Li, W.L. Integrated space-air-ground early detection, monitoring and warning system for potential catastrophic geohazards. Geomat. Inf. Sci. Wuhan Univ. 2019, 44, 957–966. (In Chinese) [Google Scholar]
- Jiang, N.; Li, Y.; Han, Z.; Li, J.Y.; Fu, B.J.; Yang, J.M. A dataset-enhanced Linformer model for geo-hazards susceptibility assessment: A case study of the railway in Southwest China. Environ. Earth Sci. 2023, 82, 397. [Google Scholar] [CrossRef]
- Panchal, S.; Shrivastava, A.K. Landslide hazard assessment using analytic hierarchy process (AHP): A case study of National Highway 5 in India. Ain Shams Eng. J. 2022, 13, 101626. [Google Scholar] [CrossRef]
- Yoshimatsu, H.; Abe, S. A review of landslide hazards in Japan and assessment of their susceptibility using an analytical hierarchic process (AHP) method. Landslides 2006, 3, 149–158. [Google Scholar] [CrossRef]
- Bhatt, B.P.; Awasthi, K.D.; Heyojoo, B.P.; Silwal, T.; Kafle, G. Using geographic information system and analytical hierarchy process in landslide hazard zonation. Appl. Ecol. Environ. Sci. 2013, 1, 14–22. [Google Scholar]
- Aditian, A.; Kubota, T.; Shinohara, Y. Comparison of GIS-based landslide susceptibility models using frequency ratio, logistic regression, and artificial neural network in a tertiary region of Ambon, Indonesia. Geomorphology 2018, 318, 101–111. [Google Scholar] [CrossRef]
- Zhang, H.J.; Song, Y.X.; Xu, S.L.; He, Y.H.; Li, Z.W.; Yu, X.Y.; Liang, Y.; Wu, W.C.; Wang, Y. Combining a class-weighted algorithm and machine learning models in landslide susceptibility mapping: A case study of Wanzhou section of the Three Gorges Reservoir, China. Comput. Geosci. 2022, 158, 104966. [Google Scholar] [CrossRef]
- Xiong, J.N.; Sun, M.; Zhang, H.; Cheng, W.M.; Yang, Y.H.; Sun, M.Y.; Cao, Y.F.; Wang, J.Y. Application of the Levenburg–Marquardt back propagation neural network approach for landslide risk assessments. Nat. Hazards Earth Syst. Sci. 2019, 19, 629–653. [Google Scholar] [CrossRef]
- Xu, S.L.; Niu, R.Q. Displacement prediction of Baijiabao landslide based on empirical mode decomposition and long short-term memory neural network in Three Gorges area, China. Comput. Geosci. 2018, 111, 87–96. [Google Scholar] [CrossRef]
- Hong, H.Y.; Pourghasemi, H.R.; Pourtaghi, Z.S. Landslide susceptibility assessment in Lianhua County (China): A comparison between a random forest data mining technique and bivariate and multivariate statistical models. Geomorphology 2016, 259, 105–118. [Google Scholar] [CrossRef]
- Chen, Z.; Liang, S.Y.; Ke, Y.T.; Yang, Z.K.; Zhao, H.L. Landslide susceptibility assessment using different slope units based on the evidential belief function model. Geocarto Int. 2020, 35, 1641–1664. [Google Scholar] [CrossRef]
- Zhao, J.; Liu, K.; Wang, M. Exposure analysis of Chinese railways to multihazards based on datasets from 2000 to 2016. Geomat. Nat. Hazards Risk 2020, 11, 272–287. [Google Scholar] [CrossRef]
- Liu, H.; Min, O.Y.; Peeta, S.; He, X.Z.; Yan, Y.Z. Vulnerability assessment and mitigation for the Chinese railway network under floods. Reliab. Eng. Syst. Saf. 2015, 137, 58–68. [Google Scholar]
- Zhang, J.M.; Zhu, W.; Cheng, Y.Q.; Li, Z.H. Landslide Detection in the Linzhi–Ya’an Section along the Sichuan–Tibet Railway Based on InSAR and Hot Spot Analysis Methods. Remote Sens. 2021, 13, 3566. [Google Scholar] [CrossRef]
- Zhou, C.; Cao, Y.; Hu, X.; Yin, K.L.; Wang, Y.; Catani, F. Enhanced dynamic landslide hazard mapping using MT-InSAR method in the Three Gorges Reservoir Area. Landslides 2022, 19, 1585–1597. [Google Scholar] [CrossRef]
- Zhou, C.; Cao, Y.; Yin, K.L.; Wang, Y.; Shi, X.G.; Catani, F.; Ahmed, B. Landslide characterization applying sentinel-1 images and InSAR technique: The muyubao landslide in the three Gorges Reservoir Area, China. Remote Sens. 2020, 12, 3385. [Google Scholar] [CrossRef]
- Liu, S.H.; Segoni, S.; Raspini, F.; Yin, K.L.; Zhou, C.; Zhang, Y.Y.; Casagli, N. Satellite InSAR as a new tool for the verification of landslide engineering remedial works at the regional scale: A case study in the Three Gorges Reservoir Area, China. Appl. Sci. 2020, 10, 6435. [Google Scholar] [CrossRef]
- Luo, X.J.; Wang, C.C.; Long, Y.; Yi, Z.H. Analysis of the decadal kinematic characteristics of the Daguangbao landslide using multiplatform time series InSAR observations after the Wenchuan earthquake. J. Geophys. Res. Solid Earth 2020, 125, e2019JB019325. [Google Scholar] [CrossRef]
- Zheng, Z.Z.; Xie, C.H.; He, Y.; Zhu, M.C.; Huang, W.F.; Shao, T.M. Monitoring potential geological hazards with different InSAR algorithms: The case of western Sichuan. Remote Sens. 2022, 14, 2049. [Google Scholar] [CrossRef]
- Dai, K.R.; Xu, Q.; Li, Z.H.; Tomás, R.; Fan, X.M.; Dong, X.J.; Li, W.L.; Zhou, Z.W.; Gou, J.S.; Ran, P.L. Post-disaster assessment of 2017 catastrophic Xinmo landslide (China) by spaceborne SAR interferometry. Landslides 2019, 16, 1189–1199. [Google Scholar] [CrossRef]
- Dai, C.; Li, W.L.; Wang, D.; Lu, H.Y.; Xu, Q.; Jian, J. Active landslide detection based on Sentinel-1 data and InSAR technology in Zhouqu county, Gansu province, Northwest China. J. Earth Sci. 2021, 32, 1092–1103. [Google Scholar] [CrossRef]
- Meng, Q.K.; Li, W.L.; Raspini, F.; Xu, Q.; Peng, Y.; Ju, Y.Z.; Zheng, Y.Z.; Casagli, N. Time-series analysis of the evolution of large-scale loess landslides using InSAR and UAV photogrammetry techniques: A case study in Hongheyan, Gansu Province, Northwest China. Landslides 2021, 18, 251–265. [Google Scholar] [CrossRef]
- Meng, X.M.; Qi, T.J.; Zhao, Y.; Dijkstra, T.; Shi, W.; Luo, Y.F.; Wu, Y.Z.; Su, X.J.; Zhao, F.M.; Ma, J.H. Deformation of the Zhangjiazhuang high-speed railway tunnel: An analysis of causal mechanisms using geomorphological surveys and D-InSAR monitoring. J. Mt. Sci. 2021, 18, 1920–1936. [Google Scholar] [CrossRef]
- Chen, B.B.; Gong, H.L.; Chen, Y.; Lei, K.C.; Zhou, C.F.; Si, Y.; Li, X.J.; Pan, Y.; Gao, M.L. Investigating land subsidence and its causes along Beijing high-speed railway using multi-platform InSAR and a maximum entropy model. Int. J. Appl. Earth Obs. Geoinf. 2021, 96, 102284. [Google Scholar] [CrossRef]
- Meng, Z.G.; Shu, C.Z.; Wu, Q.; Yang, Y.; Fu, Z. In monitoring surface deformation of high-speed railway using time-series InSAR method in northeast China. IOP Conf. Ser. Earth Environ. Sci. 2021, 660, 012011. [Google Scholar] [CrossRef]
- Zhang, Q.Y.; Li, Y.S.; Zhang, J.F.; Luo, Y. InSAR technique applied to the monitoring of the Qinghai–Tibet Railway. Nat. Hazards Earth Syst. Sci. 2019, 19, 2229–2240. [Google Scholar] [CrossRef]
- Cai, Y.H.; Wang, R.; Yu, W.D.; Liang, D.; Liu, K.Y.; Zhang, H.; Chen, Y.F. An advanced approach to improve synchronization phase accuracy with compressive sensing for LT-1 bistatic spaceborne SAR. Remote Sens. 2022, 14, 4621. [Google Scholar] [CrossRef]
- Olen, S.; Bookhagen, B. Mapping damage-affected areas after natural hazard events using Sentinel-1 coherence time series. Remote Sens. 2018, 10, 1272. [Google Scholar] [CrossRef]
- Meena, S.R.; Nachappa, T.G. Impact of spatial resolution of digital elevation model on landslide susceptibility mapping: A Case Study in Kullu Valley, Himalayas. Geosciences 2019, 9, 360. [Google Scholar] [CrossRef]
- Batuhan, O.; Filiz, S.; Shimon, W.; Enrique, C.-C. Time series analysis of InSAR data: Methods and trends. ISPRS J. Photogramm. Remote Sens. 2016, 115, 90–102. [Google Scholar]
- Li, S.W.; Xu, W.B.; Li, Z.W. Review of the SBAS InSAR Time-series algorithms, applications, and challenges. Geod. Geodyn. 2022, 13, 114–126. [Google Scholar] [CrossRef]
- Zhang, L.L.; Dai, K.R.; Deng, J.; Ge, D.Q.; Liang, R.B.; Li, W.L.; Xu, Q. Identifying potential landslides by stacking-InSAR in southwestern China and its performance comparison with SBAS-InSAR. Remote Sens. 2021, 13, 3662. [Google Scholar] [CrossRef]
- He, Y.Y.; Lindbergh, S.; Graves, C.; Rakas, J. Airport exposure to lightning strike hazard in the Contiguous United States. Risk Anal. 2021, 41, 1323–1344. [Google Scholar] [CrossRef]
- Zhang, J.X.; Huang, W.B.; Li, T.A.; Yang, X.M.; Li, Q.; Bian, H.W. Fine meteorological risk early warning forecast of main geological disasters in Gansu Province. Arid Land Geogr. 2023, 46, 1443–1452. (In Chinese) [Google Scholar]


Disclaimer/Publisher’s Note: The statements, opinions and data contained in all publications are solely those of the individual author(s) and contributor(s) and not of MDPI and/or the editor(s). MDPI and/or the editor(s) disclaim responsibility for any injury to people or property resulting from any ideas, methods, instructions or products referred to in the content. |
© 2023 by the authors. Licensee MDPI, Basel, Switzerland. This article is an open access article distributed under the terms and conditions of the Creative Commons Attribution (CC BY) license (https://creativecommons.org/licenses/by/4.0/).