Abstract
To evaluate the dynamic stability of dangerous rock masses under seismic excitation more reasonably, a mass viscoelasticity model was adopted to simulate the two main controlling surfaces of a toppling dangerous rock mass. Based on the principles of structural dynamics, a dynamic response analysis model and motion equations were established for toppling dangerous rock masses. The Newmark-β method was utilized to establish a calculation method for the dynamic stability coefficient of a toppling dangerous rock mass. This method was applied to the WY2 dangerous rock mass developed in a steep cliff zone in Luoyi Village, and the dynamic stability coefficient time history was calculated. Subsequently, the acceleration response signals of the dangerous rock mass in different directions were analyzed using wavelet packet transform. The results show that the sum of the energy proportions of the first to third frequency bands in the n1 and s2 directions exceeded 95%. This suggests that the n1 and s2 directions of the WY2 dangerous rock mass suffered the initial damage under bidirectional seismic actions. Finally, the marginal spectra variations of the acceleration response signals in different directions were analyzed based on the HHT. The results show that the seismic energy in the n1 and s2 directions of the dangerous rock mass was found to be the most significant under seismic loading, indicating that the rock mass experienced the most severe damage along these two directions. This reveals that the failure mode of the dangerous rock mass is inclined toppling, consistent with the results of wavelet packet analysis.
1. Introduction
The collapse of dangerous rock masses is a common geological disaster in the western mountainous area of China, which threatens the environment and causes the loss of human lives and property, and also has adverse effects on engineering construction [1,2]. China is a country that experiences severe earthquake disasters, and earthquakes became a major cause of dangerous rock mass collapse in the western region [3,4]. Therefore, it is of great significance to study the dynamic stability analysis methods of dangerous rock masses under seismic action. The calculation methods for the dynamic stability of rock slopes under deterministic seismic actions mainly include the pseudo-static method [5], Newmark sliding block displacement method [6], numerical simulation [7], model testing [8], and structural dynamics methods [9]. Moreover, the selection of seismic loads is usually divided into unidirectional and bidirectional seismic excitations. Therefore, Table 1 compares the advantages and limitations of different calculation methods and seismic loads in the analysis of the dynamic stability of rock slopes in previous studies.

Table 1.
Advantages and limitations of different methods and seismic loads [8,9,10,11,12].
According to the comparison results in Table 1, in order to reflect the dynamic characteristics of seismic motion, this study starts from the perspective of structural dynamics, considering the bidirectionality of seismic motion, to explore the calculation method for the dynamic stability of toppling dangerous rock masses under bidirectional seismic action.
The variation patterns of the spectral characteristics of the dynamic response signals of rock slopes under seismic action can clearly reflect the seismic damage and failure within the slope, which helps to further reveal the failure mechanism of rock slopes under seismic action [13,14,15,16,17]. Fan et al. [18] utilized the Hilbert –Huang Transform (HHT) to identify the time frequency amplitude characteristics of seismic waves in the time-frequency domain, and proposed a time-frequency calculation method for the instantaneous seismic safety factor of bedding rock slopes, which simultaneously considers the time-frequency amplitude characteristics of seismic waves. Zhang et al. [19] employed the HHT method and shaking table test to study the seismic dynamic response and instability mechanism of layered rock slopes under different seismic amplitudes, and verified that the results of the HHT method to identify the development process of seismic damage inside the slope are in good agreement with the results of the shaking table test. Song et al. [20], based on the marginal spectrum variation in slope seismic response signals, proposed an energy-based method for identifying the seismic failure mechanism of discontinuous rock slopes, and they believed that the Hilbert energy of the seismic response could clarify the development process and failure mechanism of slope damage caused by earthquakes. Studies showed that [21,22,23,24] seismic energy can cause damage to the interior of slopes, which cannot be observed by the naked eye. Therefore, the development process of slope damage can be indirectly reflected by analyzing the marginal spectrum variation in slope seismic response signals. This method can more conveniently determine the development process of slope damage caused by earthquakes and can be applied to the identification of the failure mode of dangerous rock masses under seismic action. In addition, this method is widely used in the identification of damage caused by earthquakes in slopes that already took preventive measures [25,26,27,28,29], which can verify whether the preventive structures in the slope are effective during the earthquake process and further optimize the preventive measures.
To promote sustainable social development, enhance the comprehensive defense capability of the entire society against seismic disasters, and reduce the losses caused by collapse disasters to society, it is necessary to actively conduct research on collapse disasters. Therefore, in this study, the calculation method of dynamic stability for a toppling dangerous rock mass under bidirectional earthquakes is explored. Subsequently, based on signal processing techniques, the dynamic response signals of a dangerous rock mass under seismic actions are analyzed to identify the development process of seismic damage, reveal the dynamic instability modes of the dangerous rock mass, and validate the reliability of the theoretical methods proposed in this paper. Finally, the method is applied to engineering examples, which provides a basis for predicting toppling dangerous rock mass collapse disaster in practical engineering projects, and improves the ability of earthquake prevention and disaster reduction when people encounter earthquake disasters.
2. Overview of the Project
The research area is located in Luoyi Village, Leshan City, Sichuan Province. The steep cliff zone developed in the research area is situated on the eastern bank of the Dadu River, with the Lesha Avenue in close proximity below, which has a heavy traffic flow of vehicles and pedestrians. Under adverse conditions, once the steep cliff zone experiences collapse, it will seriously threaten the safety of vehicles and pedestrians below, as well as cause damage to the top rural road infrastructure, leading to severe casualties and economic losses. Through field investigation, it was determined that there are three dangerous rock masses developed within the steep cliff zone, with a total width of approximately 36.3 m, and their heights range from 12.1 to 15.4 m. This study primarily focuses on the analysis of WY2. Through on-site measurements, it was determined that the height of the WY2 dangerous rock mass in Luoyi Village is approximately 13.4 m, the width is about 12.6 m, the thickness is around 12.1 m, and the volume of the rock mass is approximately 2042.96 m3. The main direction of collapse is 255°, and the height of the rock cavity is about 6.4 m, with a depth of approximately 5.7 m.
The lithology of the dangerous rock mass is composed of limestone and marl of the Leikoupo Formation (T2l) in the Middle Triassic. The base and rock cavity of the dangerous rock mass mainly consist of marl and thin-layered mudstone, and the top of the rock mass is covered by sandy clay of the Quaternary Holocene alluvial–pluvial layer (Q4al+pl), with a thickness of about 1.5 m and dense vegetation. The on-site photo of the dangerous rock mass zone in Luoyi Village and the sectional profile of the WY2 dangerous rock mass are shown in Figure 1 and Figure 2, respectively. Based on the geological conditions of the dangerous rock mass zone in Luoyi Village, and referring to the rock mass parameter values from references [30,31], the physical and mechanical parameters of the WY2 dangerous rock mass and its structural planes are listed in Table 2.
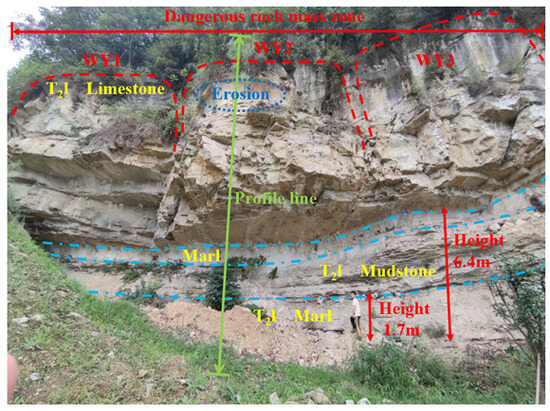
Figure 1.
Photos of steep cliff zone in Luoyi Village.
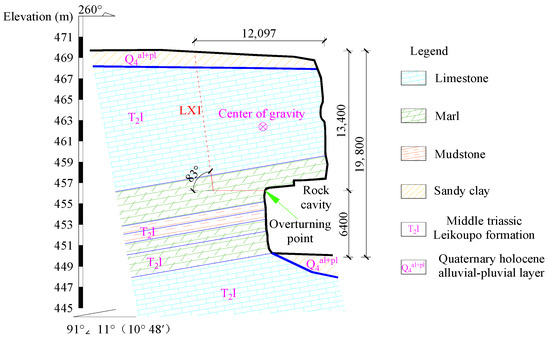
Figure 2.
Geological section of WY2 dangerous rock mass (unit: mm).

Table 2.
Physical and mechanical parameters of WY2 dangerous rock mass and structural plane.
3. Calculation Model for Seismic Response of the Toppling Dangerous Rock Mass
3.1. Dynamic Response Calculation Model
The stability of the toppling dangerous rock mass is determined mainly by the tensile strength of the back edge main structural plane of the rock mass and the tensile strength between the dangerous rock mass and the foundation. Therefore, the dynamic failure mode of the toppling dangerous rock mass is simplified into a dynamic model controlled by the main structural plane (cs1) and rock layer interface (cs2). This article considers both horizontal and vertical seismic actions and establishes a dynamic calculation model for the toppling dangerous rock mass with the center of gravity located inside the overturning point, as shown in Figure 3 [32].
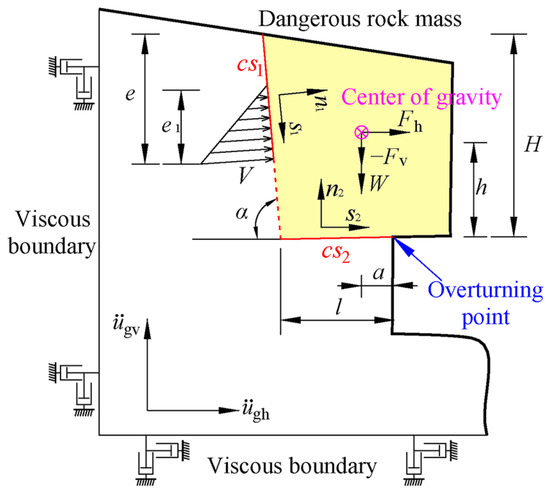
Figure 3.
Dynamic calculation model of toppling dangerous rock mass.
In the figure, W is the weight of the dangerous rock mass (kN/m); V is the fissure water pressure (kN/m); Fh and Fv represent the horizontal and vertical seismic forces, respectively (kN/m); H is the height of the dangerous rock mass (m); h and a are the height and horizontal distance from the gravity center of the dangerous rock mass to the overturning point, respectively (m); e is the height of the through section of the control fissure (m); e1 is the water filling height of the fissure water (m); l is the distance from the tip of the control fissure of the dangerous rock mass to the overturning point (m); α is the inclination angle of the control fissure (°); and represent the input horizontal and vertical seismic wave accelerations, respectively; n1 and s1 are the normal and shear directions of the main structural plane (cs1), respectively; and n2 and s2 are the normal and shear directions of the rock layer interface (cs2), respectively.
3.2. Dynamic Equation of Motion
By considering the damping force, inertia force, and elastic restoring force of a dynamic system, the following basic equations of motion can be established [33]:
where M, C, and K are the mass matrix, damping matrix, and stiffness matrix of the system, respectively; , , and are the acceleration, velocity, and displacement responses of the system under dynamic action, respectively; is the input seismic excitation acceleration; and t is the seismic excitation time.
The dynamic response model of the toppling dangerous rock mass is simplified using the method of concentrated mass. The toppling dangerous rock mass is considered as a rigid body and is equivalent to a single-degree-of-freedom system, and its two main control surfaces are simulated using a mass viscoelastic model [34], where springs and dampers are connected in parallel to simulate the main control surface. Therefore, a mass viscoelastic model for dynamic response analysis of the toppling dangerous rock mass is established, as shown in Figure 4. In the figure, m is the mass of the dangerous rock mass; cn1 and cs1 are the normal and shear damping coefficients of the main control surface cs1, respectively; kn1 and ks1 are the normal and shear stiffnesses of the main control surface cs1, respectively; cn2 and cs2 are the normal and shear damping coefficients of the main control surface cs2, respectively; and kn2 and ks2 are the normal and shear stiffnesses of the main control surface cs2, respectively.
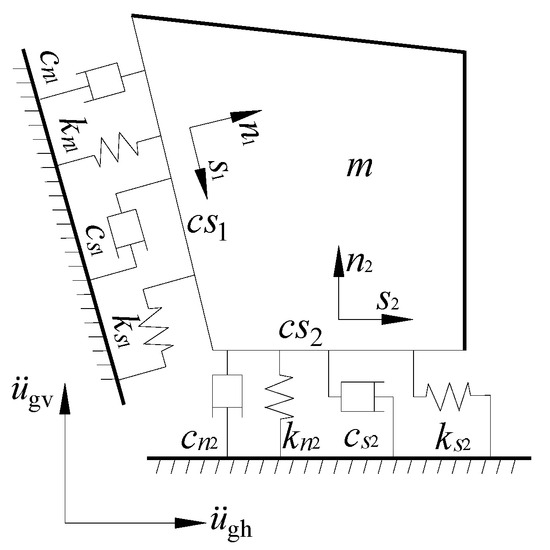
Figure 4.
Mass viscoelastic model of toppling dangerous rock mass.
Based on the D’Alembert principle and the dynamic response model of the toppling dangerous rock mass, the dynamic motion equations for the toppling dangerous rock mass on its two main controlling surfaces, cs1 and cs2, are established as follows:
The motion equation of toppling dangerous rock mass in shear direction s1 and normal direction n1 of the main structural plane cs1 is
The motion equation of toppling dangerous rock mass in shear direction s2 and normal direction n2 of the rock interface cs2 is
where and are the seismic acceleration responses of the dangerous rock mass in the s1 and n1 directions, respectively; and are the seismic velocity responses of the dangerous rock mass in the s1 and n1 directions, respectively; and are the seismic displacement responses of the dangerous rock mass in the s1 and n1 directions, respectively; and are the seismic acceleration responses of the dangerous rock mass in the s1 and n1 directions, respectively; and are the seismic velocity responses of the dangerous rock mass in the s1 and n1 directions, respectively; and and are the seismic displacement responses of the dangerous rock mass in the s1 and n1 directions, respectively.
4. Seismic Dynamic Response and Stability of Toppling Dangerous Rock Mass
4.1. Newmark-β Method
To solve the above motion differential equations, considering the nonlinear characteristics of the parameters of the dangerous rock mass, combined with the dynamic response characteristics of the toppling dangerous rock mass under seismic excitation, this paper adopts the Newmark-β method in the time domain step-by-step integration method to solve the seismic dynamic response. The idea of the Newmark-β method is to assume the acceleration variation pattern from ti to ti+1 and assume that the acceleration, velocity, and displacement at ti were obtained. Then, the acceleration is integrated within the time step to calculate the motion at ti+1. In the Newmark-β method, the variation in acceleration in the period from ti to ti+1 is mainly controlled by adjusting the parameters β and γ. When γ is set to 1/2 and β is set to 1/4, the acceleration within the ti to ti+1 interval is assumed to be constant, which makes the Newmark-β method unconditionally stable. According to the basic recursion equation of the Newmark-β method, the recurrence equation of acceleration , velocity and displacement at time ti+1 can be obtained [33]:
where Δt is the calculation time step, is the equivalent stiffness, and is the equivalent load at time ti+1, which can be calculated according to Equation (9):
where is the seismic excitation at time ti.
Therefore, by using Equations (6)–(8) for step-by-step calculations, we can directly solve Equations (2)–(5) to obtain the acceleration, velocity, and displacement response of the dangerous rock mass during the entire duration of the earthquake.
4.2. Solution of Dynamic Response of Dangerous Rock Mass under Seismic Excitation
By solving the dynamic motion equations of the toppling dangerous rock mass, the tangential and normal displacements of the dangerous rock mass on the main control surfaces (cs1 and cs2) are obtained. Based on Equations (10)–(13), the shear force (Fs1 and Fs2) and normal force (Fn1 and Fn2) can be calculated.
The resultant seismic force Fh(t) and Fv(t) in the horizontal and vertical directions for the toppling dangerous rock mass can be calculated using Equations (14) and (15).
By applying the established dynamic analysis model and solving method for the motion differential equation to the WY2 engineering case in this article, the dynamic response of the WY2 dangerous rock mass under horizontal and vertical seismic excitation can be obtained. The seismic excitation input in this article is the NS and UD seismic waves recorded by the Wolong seismic station during the 2008 Wenchuan earthquake, with a duration of 150 s, and the sampling period Δt is 0.02 s. The damping ratio ξ of the dangerous rock mass is 0.05. Since the basic seismic intensity of the engineering site is VII degree, the acceleration amplitude of the seismic waves is adjusted to 0.1 g. The acceleration time history of the horizontal and vertical seismic waves input is shown in Figure 5.
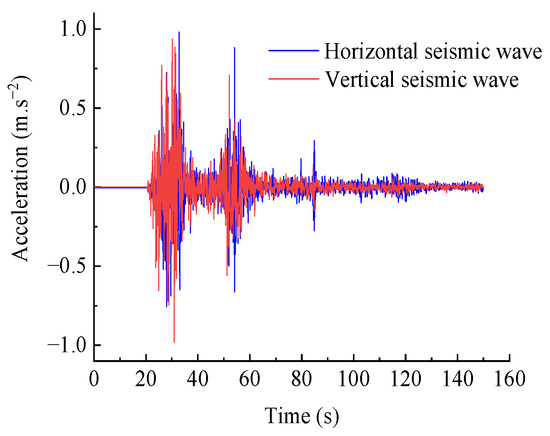
Figure 5.
Acceleration time history curve of Wolong seismic wave.
Using MATLAB programming for numerical calculations and substituting the relevant parameters of the WY2 dangerous rock mass into the calculation process of the Newmark-β method, the seismic displacement response result of the dangerous rock mass at any point in time can be obtained. The displacement response result of the WY2 dangerous rock mass is shown in Figure 6. Based on the seismic displacement response results of the toppling dangerous rock mass in different directions, the tangential and normal seismic forces generated by the dangerous rock mass on the two main control planes can be, respectively, obtained according to Equations (10)–(13), as shown in Figure 7. Finally, the horizontal and vertical seismic force response results of the dangerous rock mass can be calculated according to Equations (14) and (15), as shown in Figure 8.
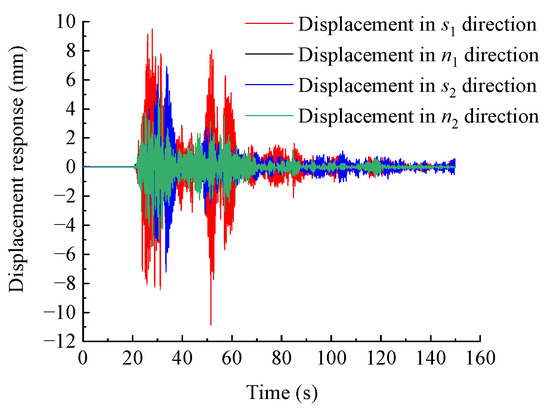
Figure 6.
Seismic displacement response results of WY2 dangerous rock mass in different directions.
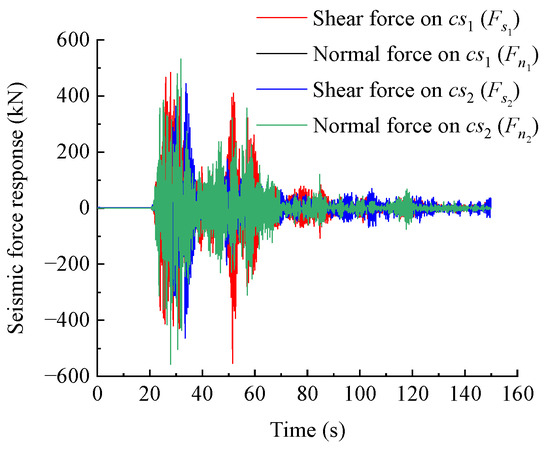
Figure 7.
Seismic force response results of WY2 dangerous rock mass in different directions.
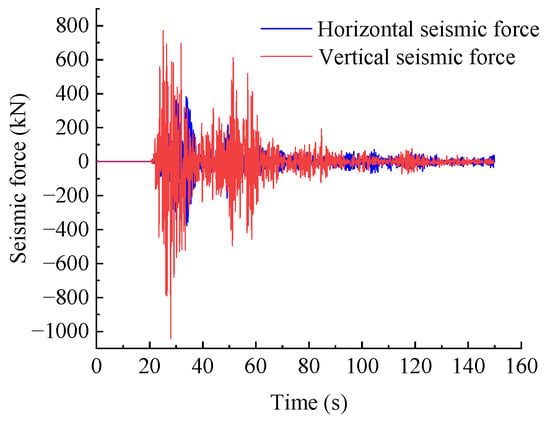
Figure 8.
Horizontal and vertical seismic force response results of the WY2 dangerous rock mass.
From Figure 6 and Figure 7, it can be observed that the maximum displacement in the s1 direction under seismic excitation for the WY2 dangerous rock mass is 10.849 mm, and the maximum shear force is 553.277 kN. The maximum displacement in the n1 direction is 1.112 mm, and the maximum normal force is 91.219 kN. In the s2 direction, the maximum displacement is 7.232 mm, and the maximum shear force is 462.838 kN. In the n2 direction, the maximum displacement is 5.455 mm, and the maximum normal force is 556.397 kN. Additionally, the occurrence time of the maximum displacement response and maximum seismic force response in different directions is consistent. This result is in accordance with the proportional relationship between seismic forces and displacement responses represented by Equations (10)–(13), indicating the rationality of these equations. According to Figure 8, the maximum horizontal seismic force response of the WY2 dangerous rock mass under horizontal and vertical seismic excitations is 475.756 kN, occurring at t = 33.4 s. The maximum vertical seismic force response is 1042.647 kN, occurring at t = 27.9 s. After obtaining the horizontal and vertical seismic force responses of the dangerous rock mass, the limit equilibrium method can be used to establish a calculation formula for the dynamic stability coefficient of the toppling dangerous rock mass to solve the dynamic stability of the toppling dangerous rock mass.
4.3. Solution of Dynamic Stability Coefficient of Dangerous Rock Mass under Seismic Excitation
Based on the Newmark-β method, the displacement and seismic force response time history curves of the dangerous rock mass under seismic excitation can be obtained, so that the horizontal and vertical seismic forces of the dangerous rock mass during the earthquake duration can be obtained. Therefore, based on the limit equilibrium method, the calculation formula for the dynamic stability coefficient Fs(t) of the dangerous rock mass can be established under bidirectional seismic excitation as follows:
where flk represents the standard tensile strength of the dangerous rock mass (kPa), fok represents the standard tensile strength between the dangerous rock mass and the foundation (kPa), Fh(t) represents the horizontal seismic force time history, Fv(t) represents the vertical seismic force time history, and the remaining variables remain the same as before.
According to the calculation formula of dynamic stability coefficient of the toppling dangerous rock mass established by Equation (16), the relevant physical and mechanical parameters of the WY2 dangerous rock mass in Luoyi Village are substituted into Equation (16), and the time history curve of dynamic stability coefficient of dangerous rock mass under a bidirectional earthquake can be obtained, as shown in Figure 9. To validate the rationality of the calculated formula for the dynamic stability coefficient of the toppling dangerous rock mass established in this study, Figure 9 also presents the results obtained using the pseudo-static method. Without considering the seismic excitation, the pseudo-static method primarily calculates the stability coefficient of the dangerous rock mass under the action of the self-weight and fissure water pressure, and the result is 1.698. When seismic excitation is taken into account, the pseudo-static method treats seismic forces as constant inertial forces and fails to reflect the time-varying characteristics of seismic excitation. Therefore, the stability coefficient obtained using the pseudo-static method remains a constant value independent of time. This is illustrated in Figure 9.
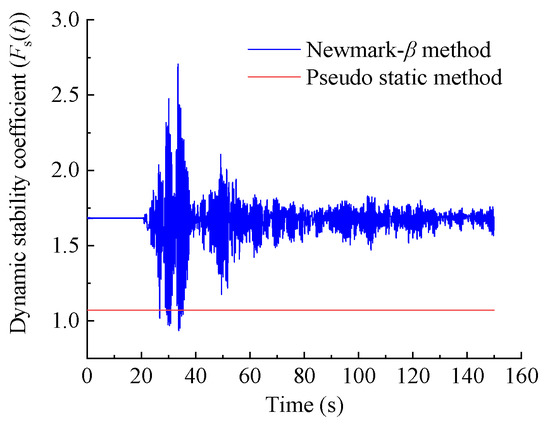
Figure 9.
Time history curve of dynamic stability coefficient for the WY2 dangerous rock mass.
According to Figure 9, it can be seen that when seismic excitation is not considered, the stability coefficient of the toppling dangerous rock mass in the static state is Fs0 = 1.689, indicating a stable condition. When horizontal and vertical seismic actions are taken into account and calculated using the pseudo-static method, the stability coefficient of the dangerous rock mass is Fs = 1.071. Furthermore, considering both horizontal and vertical seismic excitation and calculated using the Newmark-β method, the minimum value of the dynamic stability coefficient for the dangerous rock mass is Fs(t)min = 0.935 at t = 33.7 s. Moreover, based on the time history curve of the dynamic stability coefficient for the toppling dangerous rock mass, a method for evaluating the dynamic stability coefficient of the toppling dangerous rock mass is established by referring to the minimum average safety factor evaluation method proposed by Liu et al. [35]. Specifically, the dynamic stability coefficient Fs of the toppling dangerous rock mass, obtained by using the Newmark-β method, can be calculated according to Equation (17).
where Fs0 is the stability coefficient of dangerous rock mass calculated under static action, and Fs min is the minimum stability coefficient of dangerous rock mass calculated by the Newmark-β method.
Based on the time history curve of the dynamic stability coefficient of the dangerous rock mass in Figure 9, when t = 33.7 s, the stability coefficient of the dangerous rock mass reaches its minimum value, Fs(t)min = 0.935. Therefore, according to the calculation method in Equation (17), the dynamic stability coefficient Fs of the WY2 toppling dangerous rock mass in Luoyi Village, calculated using the Newmark-β method, is 1.198. The stability coefficient calculated using the Newmark-β method is approximately 10.6% higher than that obtained from the pseudo-static method, which is consistent with the actual law.
In practical engineering calculations, the pseudo-static method is often adopted to simplify the calculation, where the seismic load is considered as an inertial force acting at the center of gravity of the rock mass. The calculation results obtained by this method are usually conservative. On the other hand, using the Newmark-β method to calculate the dynamic stability coefficient can clearly reflect the time-varying stability state of the toppling dangerous rock mass under seismic excitation, and the calculation results are more consistent with the actual stability state of the dangerous rock mass.
5. Wavelet Packet Transform of Acceleration Response Signal of Dangerous Rock Mass
5.1. Wavelet Packet Transform
The wavelet packet transform is suitable for analyzing nonstationary signals such as seismic waves. It overcomes the drawback of wavelet decomposition being unable to capture the high-frequency components of a signal. It can analyze both the low-frequency and high-frequency parts of seismic waves and adaptively select frequency bands that match the spectral characteristics of the seismic wave signal, providing a more refined analysis method for seismic wave signals. When analyzing the acceleration response signal of the dangerous rock mass using wavelet packet transform, the number of decomposition levels k can be determined according to Equation (18) [36].
where Ls is the length of the signal.
When performing wavelet packet analysis on the acceleration response signal of the dangerous rock mass, the sampling period of the acceleration signal is 0.02 s, which corresponds to a frequency of 50 Hz. Based on the Shannon sampling theorem [37], the sampling frequency is set to 100 Hz. Since the duration of the acceleration signal is 150 s, the length of the signal Ls is approximately 213. By substituting Ls into Equation (18), we can obtain that the number of decomposition levels k for the wavelet packet transform should be between 0 and 13 layers. To achieve a good balance between accuracy and efficiency, k = 3 layers are selected. Therefore, the original acceleration signal is decomposed into 23 frequency bands, each corresponding to a frequency range as shown in Table 3. Meanwhile, the db8 wavelet was chosen as the wavelet packet basis function for its relatively higher precision.

Table 3.
The frequency range corresponding to each frequency band of wavelet packet decomposition.
5.2. Results of Wavelet Packet Analysis
The dynamic response calculation method of the toppling dangerous rock mass based on the Newmark-β method established in this paper can solve the acceleration response of the dangerous rock mass under bidirectional seismic action, and the results are shown in Figure 10. Using MatlabR2019b software to implement the program, the acceleration response signals in the tangential and normal directions of the two main control planes of the dangerous rock mass can be subjected to wavelet packet transform, obtaining the wavelet packet components of the acceleration responses in different directions, as shown in Figure 11.
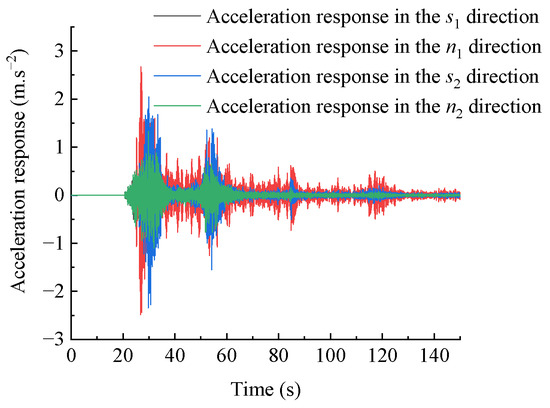
Figure 10.
Acceleration response time history curve of dangerous rock mass in various directions.
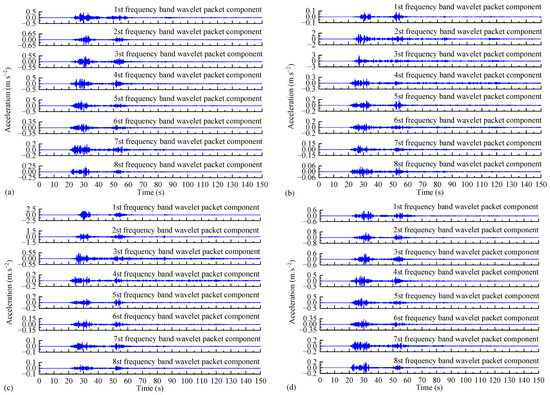
Figure 11.
The wavelet packet components of the acceleration response of WY2 dangerous rock mass in s1 direction (a), n1 direction (b), s2 direction (c), and n2 direction (d).
From Figure 11, it can be observed that the wavelet packet components of the acceleration response in the s1 and n2 directions of the dangerous rock mass are distributed in various frequency bands, with larger amplitude in bands 1~5 and smaller amplitude in bands 6~8. The wavelet packet components of the acceleration response in the n1 and s2 directions of the dangerous rock mass are mainly concentrated in bands 1~3, and the amplitudes are much larger than those in other bands. This indicates that under bidirectional seismic action, the frequency ranges of acceleration response signals in the s1 and n2 directions varies greatly, resulting in a smaller amplitude of the acceleration response and weakened destructive effect on the dangerous rock mass. However, the frequency of acceleration response signals in the n1 and s2 directions is concentrated in lower frequencies, leading to a larger amplitude of the acceleration response and a stronger destructive effect on the dangerous rock mass.
Through the wavelet packet analysis of the acceleration response signal of the dangerous rock mass, the energy proportion of various frequency bands was also obtained, as shown in Figure 12, which helps to reveal the energy distribution of the wavelet packet components in each frequency band. In this study, earthquake waves below 18.75 Hz are all considered as low-frequency waves, and the energy proportion of the first frequency band (0~6.25 Hz) is represented by E1, and the energy proportion of the other frequency bands is represented by Ei. According to Figure 12, the wavelet packet energy of the acceleration response signal of the dangerous rock mass in the s1 and n2 directions is distributed in various frequency bands, and E1 to E5 are all greater than 10%, and the sum of E1, E2, and E3 is greater than 50%. This indicates that although the frequency range of the acceleration signal in the s1 and n2 directions varies greatly, it mainly concentrates in the low-frequency part (0~18.75 Hz). The energy of the wavelet packet of the acceleration signal of the dangerous rock mass in the n1 and s2 directions is more concentrated in the low-frequency part, and the sum of E1, E2 and E3 is greater than 95%, indicating that the acceleration signal in the n1 and s2 directions almost all belongs to low-frequency signal.
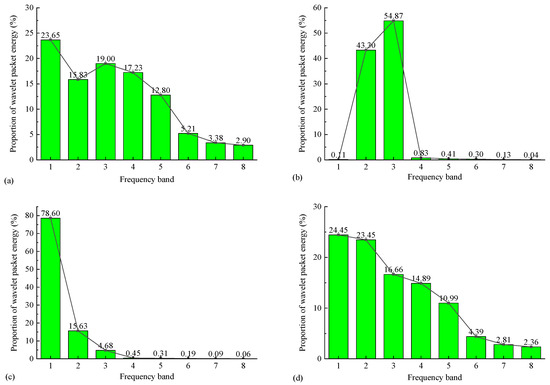
Figure 12.
Energy proportion of each frequency band of WY2 dangerous rock mass in s1 direction (a), n1 direction (b), s2 direction (c), and n2 direction (d).
It is known that low-frequency vibration waves are the main frequency components that cause damage to rock masses [38]. The above results indicate that under the bidirectional seismic action, the WY2 dangerous rock mass is most likely to suffer from seismic damage in the n1 and s2 directions, causing the rock mass to be damaged along these two directions. The frequency range of vibration wave in the s1 and n2 directions is relatively large, and the resulting seismic damage is not obvious, and the possibility of rock mass damage along these two directions is relatively small. The fact that the dangerous rock mass is damaged along the n1 and s2 directions indicates that its damage mode is mainly dominated by toppling, which is consistent with our qualitative judgment result of the failure mode for the WY2 toppling dangerous rock mass in Luoyi Village.
6. Identification of the Seismic Failure Mode of Dangerous Rock Mass
6.1. Hilbert–Huang Transform
The Hilbert–Huang Transform (HHT) method decomposes a signal into a series of intrinsic mode functions (IMFs) using the empirical mode decomposition (EMD) method, and then performs a Hilbert transform on these IMF components to obtain the Hilbert spectrum, which depicts the energy distribution on the time-frequency domain [39]. By using the HHT method, the limitation of the uncertainty principle can be overcome, and the information of the signal in the time-frequency domain can be accurately represented. The HHT method can accurately identify the signal mutation caused by structural damage during the nonlinear and nonstationary signal transmission process, so it can be used to identify the damage and failure of the dangerous rock mass under seismic action.
The expression for performing the Hilbert–Huang Transform on any time series X(t) is as follows [39]:
where PV is the Cauchy principal value.
According to this definition, when X(t) and H[X(t)] form complex conjugates, an analytic signal Z(t) can be constructed [39]:
where is the amplitude function, is the phase function.
In this way, the Hilbert transform provides a unique function that defines the amplitude and phase, and the instantaneous frequency ω(t) of the signal can be defined as [39]:
After performing the Hilbert transform on each IMF component, the instantaneous frequency of each IMF can be obtained. By combining the spectral information of all IMF components, the Hilbert spectrum is formed, which is denoted as [39]:
Equation (22) shows that the Hilbert–Huang spectrum of X(t) represents the distribution of instantaneous amplitudes in the frequency-time domain. The Hilbert marginal spectrum of X(t) can be obtained by integrating the Hilbert spectrum H(ω,t) with time [39]:
The marginal spectrum obtained from HHT represents the accumulation of amplitude (energy) over time at each frequency. It reflects the energy distribution at different frequencies, indicating the distribution of the signal energy magnitude along the frequency axis. Therefore, the Hilbert marginal spectrum can clearly represent the internal damage characteristics of the structure in terms of energy in the time-frequency domain.
6.2. Principles for Identifying the Failure State of Dangerous Rock Mass
When seismic waves propagate into the interior of the dangerous rock mass, if there is damage or cracking within the rock mass at a certain location, it will hinder the complete propagation of seismic energy at that position, and the energy will be dissipated, resulting in significant fluctuations and mutations in the marginal spectrum amplitude of the dynamic response of the dangerous rock mass [21,23]. Based on this principle, the damage location within the dangerous rock mass can be identified by observing the changes in the marginal spectrum amplitude of the dynamic response, which can further reveal the dynamic failure mode of the dangerous rock mass.
Based on the previously established model for calculating the dynamic response of the toppling dangerous rock mass, the focus of the calculations is mainly on the s1, n1, s2, and n2 directions. The acceleration time history response of the dangerous rock mass in these four directions is analyzed using HHT, and the marginal spectrum of the acceleration response is obtained. This can be considered as setting up a sensor array on the dangerous rock mass, including four measurement points, to reflect the internal damage status of the dangerous rock mass based on the changes in marginal spectrum amplitude of each measurement point. Therefore, as the input peak ground acceleration (PGA) gradually increases, there will be damage events inside the dangerous rock mass, namely the initiation and propagation of structural fractures. The marginal spectrum amplitude and characteristic frequency of the measurement points located above the damaged area will inevitably undergo significant changes. By observing these changes, the development process of damage and failure in the dangerous rock mass under seismic action can be identified, further revealing the dynamic failure mode of the toppling dangerous rock mass.
6.3. Marginal Spectrum Analysis of Acceleration Signal of Dangerous Rock Mass
Firstly, the original Wolong seismic wave is decomposed using EMD, and the time-frequency characteristics of the seismic wave are preliminarily analyzed. The IMF components of each order obtained by decomposition are shown in Figure 13. From Figure 13, it can be seen that a total of nine IMF components are obtained after the EMD decomposition of the seismic wave, with the last component being the residual. Among them, the IMF2 has a high amplitude, rich frequency components, and a high identification clarity. Therefore, in this study, when calculating the marginal spectrum amplitude of the seismic acceleration response of dangerous rock mass, the IMF2 of the acceleration response in each direction can be selected for relevant calculations and analysis.
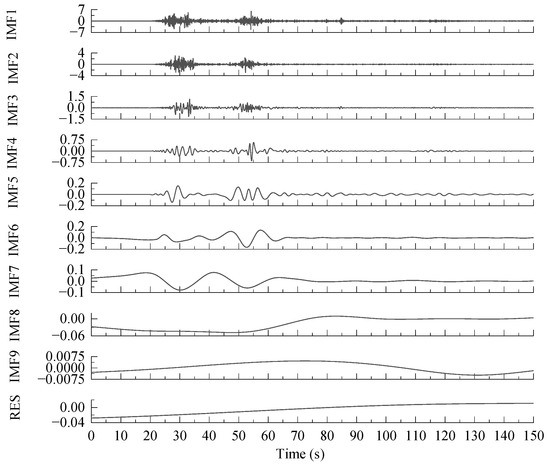
Figure 13.
EMD results of Wolong seismic wave.
In this study, the Wolong seismic waves with PGAs of 0.05 g, 0.1 g, 0.15 g, 0.2 g, 0.3 g, and 0.4 g were applied to the WY2 dangerous rock mass in Luoyi Village. The acceleration responses of the dangerous rock mass under different seismic loads were investigated. The seismic waves with different PGAs were input into the dynamic response analysis model established in this paper. The Newmark-β method, a structural dynamics method, was used to solve the acceleration response of the WY2 dangerous rock mass at various directions (measurement points) under different seismic loads. The results are shown in Figure 14.
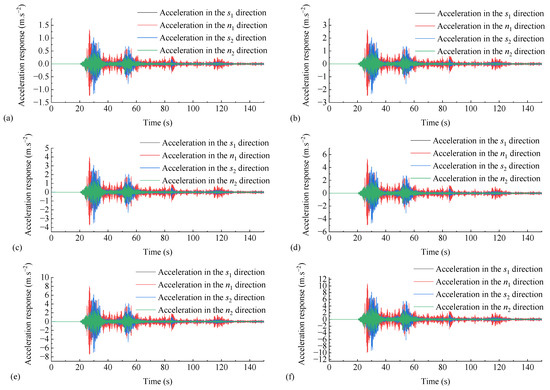
Figure 14.
Acceleration response of WY2 dangerous rock mass subjected to seismic waves with 0.05 g PGA (a), 0.1 g PGA (b), 0.15 g PGA (c), 0.2 g PGA (d), 0.3 g PGA (e), and 0.4 g PGA (f).
It can be observed from Figure 14 that as the seismic acceleration increases, the dynamic response of the dangerous rock mass in different directions also increases. The dangerous rock mass gradually transitions from a stable state to an unstable state. However, it is not possible to directly determine the stability status and failure process of the dangerous rock mass based solely on its acceleration response. Further analysis is required using the HHT method to investigate the acceleration response of the dangerous rock mass in each direction. This will reveal the dynamic failure process of the dangerous rock mass under seismic action.
Based on the acceleration response results of the dangerous rock mass under different seismic loads, the HHT method is used to perform a Hilbert transform, resulting in the marginal spectral curves of the acceleration response in different directions, as shown in Figure 15. A diagram of Figure 15 is drawn to show that as the seismic load increases, the marginal spectral amplitudes of the dangerous rock mass in four different directions continuously increase. This indicates a linear increase in seismic energy, which is consistent with the actual situation. However, according to the identification method in Section 6.2, if the marginal spectral amplitudes show a linear increasing trend, it implies that the dangerous rock mass did not experience significant seismic damage under increasing seismic loads. This is obviously not in line with reality because the dynamic response calculation method based on the Newmark-β method used in this paper cannot reflect the dynamic response process of the dangerous rock mass after instability. Therefore, with the increase in seismic load, the marginal spectral amplitudes of dynamic response will exhibit a linear increase. Hence, the degree of change in marginal spectral amplitudes can be used to judge the failure mechanism of the dangerous rock mass under different seismic loads.
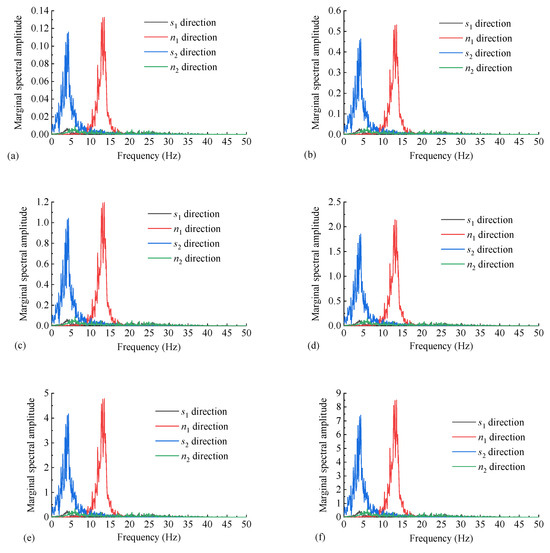
Figure 15.
The marginal spectrum curves of WY2 dangerous rock mass in different directions under the action of 0.05 g (a), 0.1 g (b), 0.15 g (c), 0.2 g (d), 0.3 g (e), and 0.4 g (f) seismic waves.
Figure 15 also shows that the marginal spectral amplitudes of the dynamic response in the four directions of the dangerous rock mass under different seismic loads follow the order: n1 direction > s2 direction > s1 direction ≈ n2 direction. This indicates that the seismic energy is most pronounced in the n1 and s2 directions under seismic loads, and damage in the dangerous rock mass always occurs first along these two directions, which is consistent with the analysis results obtained from the wavelet packet analysis in the previous sections.
6.4. Seismic Damage Mode Analysis of Dangerous Rock Mass
To further explore the development process and related laws of seismic damage of the WY2 dangerous rock mass in Luoyi Village, the marginal spectral peaks of the acceleration response in the four directions were analyzed under the Wolong earthquake waves with PGA of 0.05 g, 0.1 g, 0.15 g, 0.2 g, 0.3 g, and 0.4 g. The results of the marginal spectral peaks in different directions under different seismic loads are shown in Figure 16.
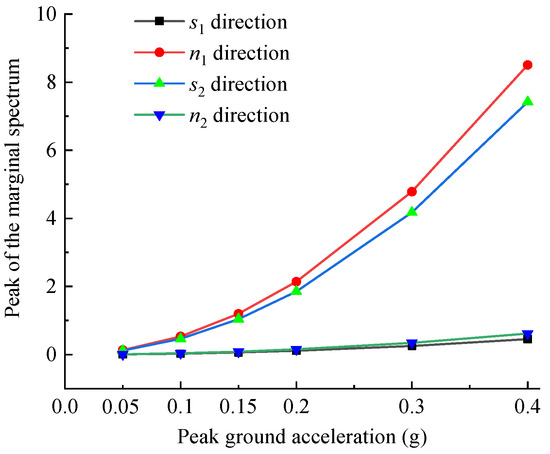
Figure 16.
Marginal spectral peaks of dangerous rock mass in all directions under different seismic loads.
A diagram of Figure 16 is drawn to show that when the seismic acceleration increases from 0.05 g to 0.4 g, the marginal spectral peak values in the s1 and n2 directions of the dangerous rock mass linearly increase with relatively small amplitude changes, which indicates that there is no significant seismic damage in the s1 and n2 directions, implying that there is no apparent sliding failure along the main structural planes or significant damage in the normal direction of the rock layer interface. On the other hand, the marginal spectral peak values in the n1 and s2 directions of the dangerous rock mass undergo abrupt changes with a larger amplitude variation as the seismic load varies, which suggests that there is significant seismic damage in the n1 and s2 directions, indicating that the main damage and failure of the dangerous rock mass occurs along the normal direction of the main structural plane and the direction of the rock layer interface. These two phenomena indicate that the energy of the dominant seismic waves primarily concentrates in the n1 and s2 directions of the WY2 dangerous rock mass in Luoyi Village, so that the seismic damage mainly occurs in these two directions. In other words, the primary seismic failure mode of the dangerous rock mass is toppling along these directions, and the possibility of sliding failure along the main structural planes is relatively small. This finding is consistent with the wavelet packet analysis results mentioned earlier and confirms the rationality and correctness of the established method for calculating the dynamic response and stability of the toppling dangerous rock mass.
Figure 16 also shows that when the PGA of the seismic motion is less than or equal to 0.2 g, the marginal spectral peak values in various directions of the dangerous rock mass exhibit minor variations. However, when PGA exceeds 0.2 g, significant variations in the marginal spectral peak values occur in all directions, indicating a pronounced effect of seismic damage. According to the previous calculations, when the PGA is 0.1 g, the dynamic stability coefficient of the dangerous rock mass is 1.198, indicating that the rock mass is in a state of basic stability to slight instability. At this point, the dangerous rock mass begins to experience seismic damage in various directions (mainly concentrated in the n1 and s2 directions), and internal cracks within the rock mass gradually expand, and the main structural planes and rock layer interface start to crack. However, since the range of variation in the marginal spectral peak values is relatively small at this stage, the dangerous rock mass did not exhibit obvious signs of failure or significant crack propagation. Therefore, we can infer that when the PGA is 0.05 g, the marginal spectral peak values of the acceleration response in all four directions shows minor variations, which indicates that the dangerous rock mass did not experience significant seismic damage, and there is no obvious expansion or penetration of internal cracks. Thus, the dangerous rock mass remains in a state of basic stability to stable. Additional, when the PGA is in the range of 0.15 g to 0.2 g, a significant abrupt change occurs in the marginal spectral peak values in the n1 and s2 directions of the dangerous rock mass. This phenomenon corresponds to the process of crack propagation along the main structural planes and rock layer interface, indicating that the dangerous rock mass is in a state of slight instability to instability. When the PGA exceeds 0.2 g, the marginal spectral peak values in the n1 and s2 directions rapidly increase, and the magnitude of variation in the marginal spectral amplitudes becomes significant. At this point, the cracks along the main structural planes and rock layer interface are fully penetrated, resulting in the failure of the dangerous rock mass.
7. Conclusions
This article is based on the principles of structural dynamics and establishes a dynamic response and stability calculation method for toppling dangerous rock masses under bidirectional seismic excitations. The method is applied to the WY2 dangerous rock mass developed in a steep cliff zone in Luoyi Village, and the dynamic stability coefficient is obtained. The acceleration response signal of the dangerous rock mass under seismic excitations is analyzed using signal processing methods to reveal the dynamic failure mode of the dangerous rock mass. The following conclusions are drawn:
- (1)
- Using the Newmark-β method, the displacement and seismic force time history curves of the toppling dangerous rock mass under bidirectional seismic excitations are solved. The dynamic stability coefficient of the toppling dangerous rock mass is determined as 1.198, while the stability coefficient calculated using traditional pseudostatic methods is 1.071. The calculated results in this study are about 10.6% higher than those obtained using traditional methods.
- (2)
- The frequency range of the acceleration response in the n1 and s2 directions is mainly concentrated in the low-frequency range, with large amplitudes. The sum of E1, E2, and E3 in the n1 and s2 directions is greater than 95%, which indicates that the WY2 dangerous rock mass is most likely to be damaged and indicates failure along the n1 and s2 directions under bidirectional seismic actions.
- (3)
- The marginal spectrum amplitude of the n1 direction is greater than that of the s2 direction, which is greater than that of the s1 direction, and the marginal spectrum amplitude in the s1 direction is approximately equal to that in the n2 direction. This shows that the seismic energy of the dangerous rock mass in the n1 and s2 directions is the most obvious under the seismic loads, and the dangerous rock mass always experiences seismic damage and failure primarily along these two directions, with the main failure mode being outward toppling, which is consistent with the results of qualitative judgment.
- (4)
- Based on the dynamic stability coefficient results of the dangerous rock mass under 0.1 g seismic wave loading, it can be inferred that when the PGA is 0.05 g, the dangerous rock mass does not experience significant seismic damage and remains in a generally stable state. When the PGA ranges from 0.15 g to 0.2 g, there is a noticeable abrupt change in the peak values of the marginal spectra along the n1 and s2 directions, indicating that the dangerous rock mass is in a state of slight instability to instability. When the PGA exceeds 0.2 g, the peak values of the marginal spectra along the n1 and s2 directions rapidly increase, indicating complete failure of the dangerous rock mass.
Author Contributions
Conceptualization, L.W. and J.Z.; methodology, J.Z.; software, J.Z.; investigation, L.W. and J.Z.; formal analysis, J.Z.; writing–original draft, J.Z.; resources, L.W.; supervision, L.W., X.H. and G.T.; funding acquisition, L.W., X.H. and G.T.; writing–review and editing, L.W., X.H. and G.T.; data curation, J.Z.; visualization, L.W. All authors have read and agreed to the published version of the manuscript.
Funding
This study was supported by the National Key Research and Development Program of China (2021YFB2600604 and 2021YFB2600600), and the Joint Funds of the National Natural Science Foundation of China (U22A20600).
Institutional Review Board Statement
Not applicable.
Informed Consent Statement
Not applicable.
Data Availability Statement
Not applicable.
Acknowledgments
This study is financially supported by the National Key Research and Development Program of China (2021YFB2600604 and 2021YFB2600600), and the Joint Funds of the National Natural Science Foundation of China(U22A20600).
Conflicts of Interest
The authors declare no conflict of interest.
References
- Jia, Y.; Li, Z.; Jiang, T.; Li, Y.; Wang, S.; Song, G. Study on Early Identification of Landslide Perilous Rocks Based on Multi-Dynamics Parameters. Sustainability 2023, 15, 6296. [Google Scholar] [CrossRef]
- Du, Y.; Xie, M. Indirect method for the quantitative identification of unstable rock. Nat. Hazards 2022, 112, 1005–1012. [Google Scholar] [CrossRef]
- Cui, S.; Wang, G.; Pei, X.; Huang, R.; Kamai, T. On the initiation and movement mechanisms of a catastrophic landslide triggered by the 2008 Wenchuan (Ms 8.0) earthquake in the epicenter area. Landslides 2016, 14, 805–819. [Google Scholar] [CrossRef]
- Wang, W.; Yuan, W.; Wang, Q.; Xue, K. Earthquake-induced collapse mechanism of two types of dangerous rock masses. Earthq. Eng. Eng. Vib. 2016, 15, 379–386. [Google Scholar] [CrossRef]
- San, K.C.; Leshchinsky, D. Seismic Slope Stability Analysis: Pseudo-Static Generalized Method. Soils Found. 1994, 34, 73–77. [Google Scholar] [CrossRef] [PubMed]
- Newmark, N.M. Effects of Earthquakes on Dams and Embankments. Géotechnique 1965, 15, 139–160. [Google Scholar] [CrossRef]
- Song, D.; Chen, Z.; Chao, H.; Ke, Y.; Nie, W. Numerical study on seismic response of a rock slope with discontinuities based on the time-frequency joint analysis method. Soil Dyn. Earthq. Eng. 2020, 133, 106112. [Google Scholar] [CrossRef]
- Wu, Z.; Zhang, D.; Wang, S.; Liang, C.; Zhao, D. Dynamic-response characteristics and deformation evolution of loess slopes under seismic loads. Eng. Geol. 2020, 267, 105507. [Google Scholar] [CrossRef]
- Chen, X.; Gao, R.; Gong, W.; Li, Y. Random Seismic Response and Dynamic Fuzzy Reliability Analysis of Bedding Rock Slopes Based on Pseudoexcitation Method. Int. J. Geomech. 2018, 18, 04017165. [Google Scholar] [CrossRef]
- Khorsandiardebili, N.; Ghazavi, M. Internal stability analysis of geocell-reinforced slopes subjected to seismic loading based on pseudo-static approach. Geotext. Geomembr. 2022, 50, 393–407. [Google Scholar] [CrossRef]
- Du, W. Effects of directionality and vertical component of ground motions on seismic slope displacements in Newmark sliding-block analysis. Eng. Geol. 2018, 239, 13–21. [Google Scholar] [CrossRef]
- Korzec, A.; Jankowski, R. Extended Newmark method to assess stability of slope under bidirectional seismic loading. Soil Dyn. Earthq. Eng. 2021, 143, 106600. [Google Scholar] [CrossRef]
- Chen, J.; Wang, L.; Wang, P.; Che, A. Failure mechanism investigation on loess–mudstone landslides based on the Hilbert–Huang transform method using a large-scale shaking table test. Eng. Geol. 2022, 302, 106630. [Google Scholar] [CrossRef]
- Lei, H.; Wu, H.; Qian, J. Seismic failure mechanism and interaction of the cross tunnel-slope system using Hilbert-Huang transform. Tunn. Undergr. Sp. Technol. 2023, 131, 104820. [Google Scholar] [CrossRef]
- Wang, Q.; Geng, P.; Chen, C.; Chen, J.; He, C. Determination of seismic response of reinforced tunnel portal slope using shaking table tests. Tunn. Undergr. Sp. Technol. 2023, 136, 105072. [Google Scholar] [CrossRef]
- Qu, H.; Wang, C.; Zhang, G.; Liu, Y.; Luo, H.; Mei, Q. Seismic damage mechanism of bedrock and overburden layer slope reinforced by sheet pile wall. J. Geophys. Eng. 2019, 16, 667–679. [Google Scholar] [CrossRef]
- Yang, C.; Feng, N.; Zhang, J.; Bi, J.; Zhang, J. Research on time-frequency analysis method of seismic stability of covering-layer type slope subjected to complex wave. Environ. Earth Sci. 2015, 74, 5295–5306. [Google Scholar]
- Fan, G.; Zhang, L.; Zhang, J.; Yang, C. Time-frequency analysis of instantaneous seismic safety of bedding rock slopes. Soil Dyn. Earthq. Eng. 2017, 94, 92–101. [Google Scholar] [CrossRef]
- Zhang, L.; Yang, C.; Ma, S.; Guo, X.; Yue, M.; Liu, Y. Seismic Response Time-Frequency Analysis of Bedding Rock Slope. Front. Phys. 2020, 8, 558547. [Google Scholar] [CrossRef]
- Song, D.; Liu, X.; Huang, J.; Zhang, J. Energy-based analysis of seismic failure mechanism of a rock slope with discontinuities using Hilbert-Huang transform and marginal spectrum in the time-frequency domain. Landslides 2020, 18, 105–123. [Google Scholar] [CrossRef]
- Fan, G.; Zhang, L.; Zhang, J.; Ouyang, F. Energy-Based Analysis of Mechanisms of Earthquake-Induced Landslide Using Hilbert–Huang Transform and Marginal Spectrum. Rock Mech. Rock Eng. 2017, 50, 2425–2441. [Google Scholar] [CrossRef]
- Fan, G.; Zhang, L.; Zhang, J.; Yang, C. Analysis of Seismic Stability of an Obsequent Rock Slope Using Time–Frequency Method. Rock Mech. Rock Eng. 2019, 52, 3809–3823. [Google Scholar] [CrossRef]
- Fan, G.; Zhang, J.; Fu, X.; Zhou, L. Dynamic failure mode and energy-based identification method for a counter-bedding rock s lope with weak intercalated layers. J. Mt. Sci. 2016, 13, 2111–2123. [Google Scholar] [CrossRef]
- Yang, C.; Zhang, J.; Bi, J. Application of Hilbert-Huang Transform to the analysis of the landslides triggered by the Wenchuan earthquake. J. Mt. Sci. 2015, 12, 711–720. [Google Scholar] [CrossRef]
- Qu, H.; Huang, X.; Gao, Y.; Deng, Y.; Li, B. HHT-Based Seismic Damage Analysis of a Subgrade Slope Reinforced by a Gravity Retaining Wall. Soil Mech. Found. Eng. 2021, 58, 425–432. [Google Scholar] [CrossRef]
- Lian, J.; Ding, X.; Zhang, L. Shaking table test on seismic response of an accumulation landslide reinforced by pile-plate retaining wall based on the time-frequency analysis method. J. Cent. South Univ. 2023, 30, 1710–1721. [Google Scholar] [CrossRef]
- Qu, H.; Huang, X.; Gao, Y.; Zhang, Z.; Wang, C. Shaking table test of subgrade slope reinforced by gravity retaining wall with geogrids. Earthq. Eng. Eng. Vib. 2022, 21, 715–727. [Google Scholar] [CrossRef]
- Chrysanidis, T.; Mousama, D.; Tzatzo, E.; Alamanis, N.; Zachos, D. Study of the Effect of a Seismic Zone to the Construction Cost of a Five-Story Reinforced Concrete Building. Sustainability 2022, 14, 10076. [Google Scholar] [CrossRef]
- Chrysanidis, T.A.; Panoskaltsis, V.P. Experimental investigation on cracking behavior of reinforced concrete tension ties. Case Stud. Constr. Mat. 2022, 16, e00810. [Google Scholar] [CrossRef]
- Liu, X.; Liu, Y.; He, C.; Li, X. Dynamic stability analysis of the bedding rock slope considering the vibration deterioration effect of the structural plane. Bull. Eng. Geol. Environ. 2016, 77, 87–103. [Google Scholar] [CrossRef]
- Li, P. Study on the Formation Mechanism of Gently Inclined Carbonate Rock Collapse under Differential Dissolution. Master’s Thesis, Guizhou University, Guiyang, China, 2021. (In Chinese). [Google Scholar]
- Chen, H.; Tang, H.; Wang, R. Calculation method of stability for unstable rock and application to the Three Gorges Reservoir. Chin. J. Rock Mech. Eng. 2004, 23, 614–619. (In Chinese) [Google Scholar] [CrossRef]
- Liu, J.; Du, X. Dynamics of Structures; China Machine Press: Beijing, China, 2005. (In Chinese) [Google Scholar]
- Xue, S.; Wang, S.; Zhang, J. The vibrating models of block rockmass and dynamic response analysis methods. In Proceedings of the 2nd Chinese Academic Conference on Rock Dynamic Mechanics, Yichang, China, 8 November 1990; pp. 22–33. (In Chinese). [Google Scholar]
- Liu, H.; Fei, K.; Gao, Y. Time history analysis method of slope seismic stability. Rock Soil Mech. 2003, 24, 553–556. (In Chinese) [Google Scholar]
- Zhang, D. MATLAB Wavelet Analysis; China Machine Press: Beijing, China, 2012. (In Chinese) [Google Scholar]
- Han, J. Seismicity Non-Stationary Characteristics Study Based on Wavelet Packet Transform. Master’s Thesis, Shenyang University of Technology, Shenyang, China, 2016. (In Chinese). [Google Scholar]
- Song, D.; Chen, Z.; Ke, Y.; Nie, W. Seismic response analysis of a bedding rock slope based on the time-frequency joint analysis method: A case study from the middle reach of the Jinsha River, China. Eng. Geol. 2020, 274, 105731. [Google Scholar] [CrossRef]
- Huang, N.E.; Shen, Z.; Long, S.R.; Wu, M.C.; Shih, H.H.; Zheng, Q.; Yen, N.C.; Tung, C.C.; Liu, H.H. The empirical mode decomposition and the Hilbert spectrum for nonlinear and non-stationary time series analysis. Proc. R. Soc. Lond. A 1998, 454, 903–995. [Google Scholar] [CrossRef]
Disclaimer/Publisher’s Note: The statements, opinions and data contained in all publications are solely those of the individual author(s) and contributor(s) and not of MDPI and/or the editor(s). MDPI and/or the editor(s) disclaim responsibility for any injury to people or property resulting from any ideas, methods, instructions or products referred to in the content. |
© 2023 by the authors. Licensee MDPI, Basel, Switzerland. This article is an open access article distributed under the terms and conditions of the Creative Commons Attribution (CC BY) license (https://creativecommons.org/licenses/by/4.0/).