Article

Assessing Hygrothermal Performance in Building Walls Engineered for Extreme Cold Climate Environments

Department of Civil, Materials, and Environmental Engineering, University of Illinois at Chicago, 842 West Taylor Street, Chicago, IL 60607, USA
*
Author to whom correspondence should be addressed.
Sustainability 2023, 15(24), 16597; https://doi.org/10.3390/su152416597
Submission received: 18 October 2023 / Revised: 30 November 2023 / Accepted: 4 December 2023 / Published: 6 December 2023

Abstract

:
Buildings located in extreme cold climates encounter challenges (e.g., heat loss, condensation, and frozen utilities), especially within their wall envelopes. These challenges also play a pivotal role in occupant health, comfort, and the structural integrity of the building. While the existing literature has primarily focused on thermal performance, this study underscores the importance of evaluating hygrothermal performance within wall envelopes, given the existence of mold growth even in cases of high thermal resistance. Therefore, the aim of this study was to evaluate the hygrothermal performance of an adaptable house wall (AHW) panel that incorporates composite infill panels paired with vacuum-insulated panels to endure harsh cold conditions in Alaska. Therefore, three steps were proposed to: (1) collect the material and thermal properties of the AHW; (2) model the hygrothermal performance of the AHW in WUFI® PRO v6.7 software; and (3) analyze the results. The results revealed a moderate risk of mold growth in the inner plywood layer of the AHW, whereas the outer plywood layer showed zero risk, indicating an acceptable condition. The findings aid decisionmakers in recognizing potential mold-related issues in building walls before advancing to the construction phase.

1. Introduction

In the United States, buildings account for approximately 74% of electricity usage and about 41% of primary energy consumption [1,2]. Moreover, in regions characterized by harsh climatic conditions such as Alaska, a significant proportion of the energy consumption and resulting environmental pollution are attributed to the heating of residential buildings [3,4]. A substantial proportion, within the range of 60% to 80%, of the demands for heating and cooling in buildings is attributed to heat transmission through building envelopes specifically on walls [5,6]. Therefore, it is crucial to understand the climate adaptation and resiliency of building walls, especially in extreme climate conditions like Alaska.
Most of the previous studies have solely focused on evaluating the thermal performance (i.e., thermal resistance or thermal transmittance) of building envelopes [5,6,7,8,9]. One critical factor influencing the thermal performance of exterior wall envelopes is the thickness of insulation along with its orientation relative to sun exposure, resulting in varying solar radiation intensities [10,11]. However, the building envelope may still be vulnerable to water condensation and mold growth, even with a high thermal resistance (R-value). Accordingly, it is essential to analyze the hygrothermal (i.e., movement of heat and moisture through building envelopes) performance of building walls, especially in extreme cold climates like Alaska due to the risk of mold growth [12,13,14,15,16]. Efficient hygrothermal performance can substantially extend the durability of the building while preventing biological growth within the structure and maintaining a favorable indoor environment [17]. However, inefficient hygrothermal performance leads to the following consequences: (1) effects on the comfort level of occupants, leading to respiratory issues, allergies, sinus infections, asthma, bronchitis, hypersensitivity pneumonitis, fungal infections, mycotoxin exposure, etc. [18,19,20,21]; (2) reduction in insulation effectiveness and increase in the energy consumption of heating, ventilation, and air conditioning (HVAC), resulting in a significant negative effect on the thermal performance (i.e., thermal resistance) of walls [22]; and (3) the development of mold growth, which is a significant hazard to the overall structural integrity of the building as it can deface surfaces, destroy wall structures, and adversely impact indoor aesthetics due to its growth on indoor building components [23].
Accordingly, a thorough hygrothermal performance assessment of the building wall system during the design stage can help identify mold-related issues in building walls before proceeding with the construction phase. The objective of this study was to assess the hygrothermal performance of a distinctive wall panel (an adaptable house wall in this study) engineered to satisfy thermal and energy standards (e.g., International Energy Conservation Code, International Building Code, ASHRAE 90.1 [24]) in extremely cold climate conditions, following ASHRAE 160 guidelines [25]. This evaluation encompassed both the thermal and moisture aspects, employing hygrothermal performance modeling software. This study addresses a critical gap by emphasizing that solely enhancing the thermal resistance of building walls is not sufficient to ensure their sustained performance. Instead, it is essential for decisionmakers (e.g., designers and homebuilders) to conduct comprehensive assessments of the hygrothermal performance—evaluating both thermal and moisture aspects in parallel—prior to the construction phase. Long-term exposure to excessive moisture or sustained high relative humidity (>70%) can significantly diminish both the thermal resistance and the lifespan of building walls due to potential mold growth. Therefore, preventative assessment becomes vital. This study’s approach will pave the way to: (1) the adoption of hygrothermal assessments to specific climate zones or microclimates, which could provide more advanced and context-specific recommendations for decisionmakers to save substantial construction costs during the design phase; and (2) the evaluation of the long-term performance of diverse wall designs or materials, including factors like maintenance, durability, and energy efficiency, which proves pivotal in forecasting the life cycle of building construction. This foresight can result in substantial cost efficiencies throughout the building’s operational lifespan.
The adaptable house wall (AHW) panel features composite infill panels paired with vacuum-insulated panels (VIPs) and is specifically designed to withstand the extreme climatic conditions of Alaska. The examined wall panels seal an adaptable house constructed by the Cold Climate Housing Research Center (CCHRC) of the National Renewable Energy Laboratory (NREL), based in Fairbanks, Alaska [26,27].

2. Literature Review
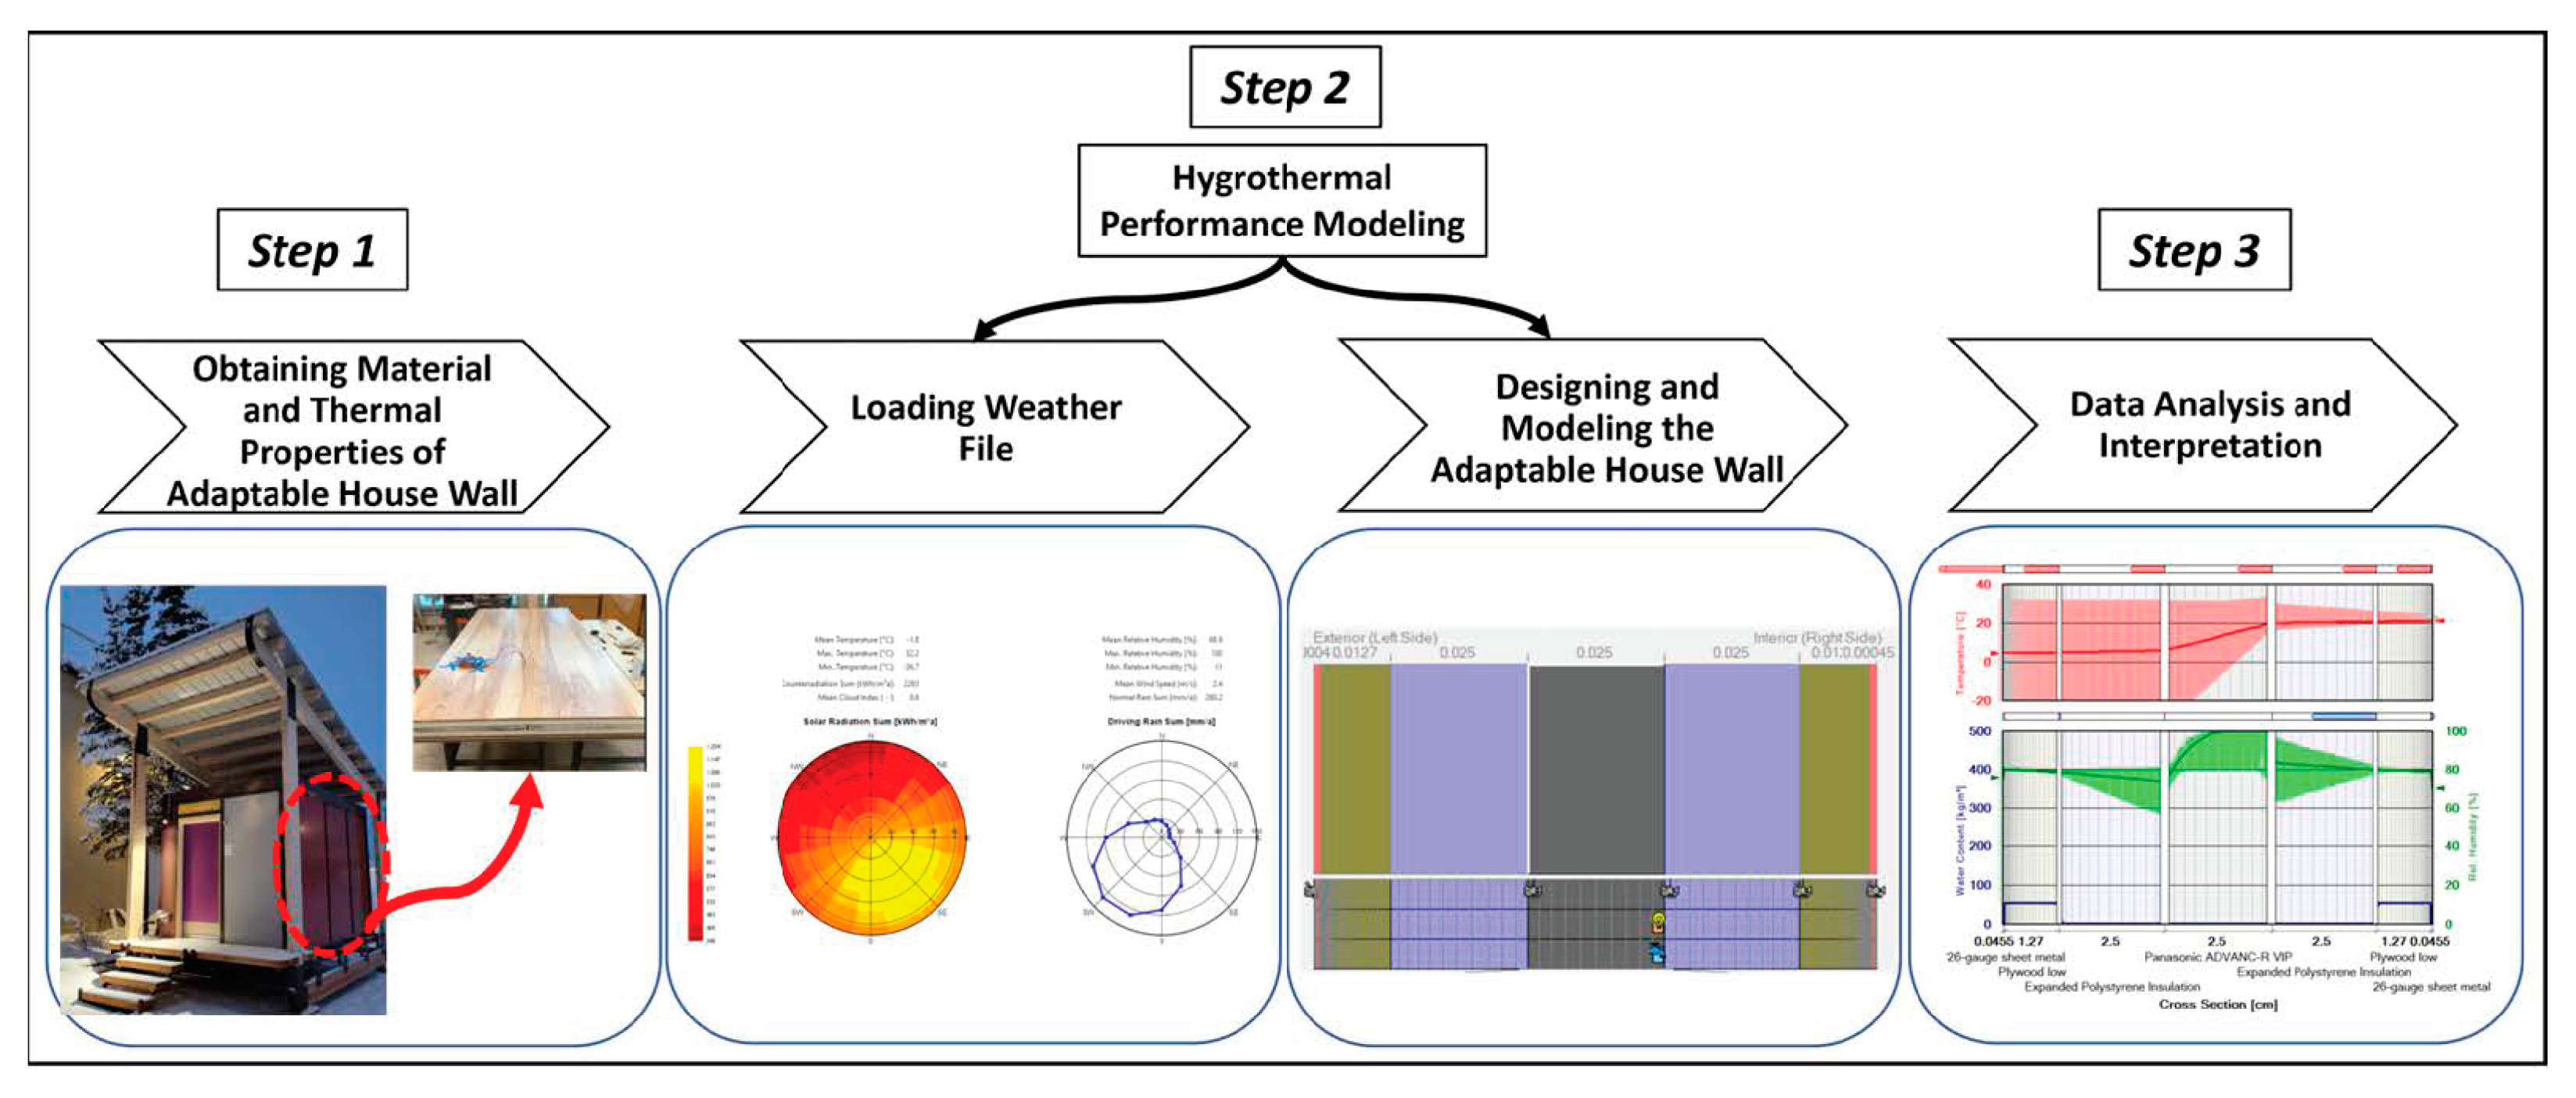
In the existing literature, the impact of the hygrothermal performance (i.e., thermal and moisture performance) of building envelopes has been investigated in various climatic conditions using different simulation software like EnergyPlus v8.8, COMSOL Multiphysics v6.1, and WUFI® [15,16,17,28,29,30,31,32,33]. For instance, Fedorik et al. [17] simulated the hygrothermal conditions in typical basement walls with various retrofitting methods and with different insulation materials, including expanded polystyrene (EPS) and extruded polystyrene (XPS) boards. The findings indicated that inner insulation without adequate capillary water transport properties could create colder and more humid structures with mold issues [17]. Similarly, Almeida and Barreira [28] tested a typical exterior wall configuration to explore the factors affecting mold growth. They found that thermal insulation, surface coatings, and orientation exhibit significant effects. Additionally, they identified indoor air humidity and temperature as the fundamental conditions influencing mold development [28]. Bastien and Winthern-Gaasving [29] conducted an examination of the hygrothermal characteristics of a single-family wood-frame residence in a cold climate region using WUFI® software, following European and ISO standards. Their findings underscore the pivotal influence of the plaster type and wind-driven rain exposure as the primary factors shaping the hygrothermal performance of the wall assembly [29]. D’Orazio et al. [30] evaluated the growth of two types of molds on external thermal insulation composite systems. They investigated the impact of surface roughness, water absorption, and total porosity as the main variables and developed a mathematical model for these variables, with a notable finding that the latter two parameters exerted a significant influence on mold growth [30]. Furthermore, Klõšeiko et al. [32] conducted field tests on internal insulation in a historical building for nine months in a cold region in Estonia. Their evaluation of four insulation materials involved monitoring temperatures, heat flows, and relative humidity to determine their hygrothermal performance when applied for a brick wall from the inside. All cases had higher temperatures than the reference wall and improved thermal comfort. It was also discovered that built-in moisture during installation can cause interstitial condensation and risk of mold growth in walls due to high relative humidity [32]. Silveira et al. [33] used EnergyPlus software v8.8 to explore how thermal insulation and wall solar orientation affect mold growth in naturally ventilated homes in a humid climate condition. The results showed that north-facing rooms had fewer extended periods conducive to mold growth. Furthermore, comparing construction systems revealed that omitting thermal insulation reduced such instances [33].
These studies made significant contributions, underscoring the critical role of conducting hygrothermal analysis in building walls to facilitate climate adaptation and enhance overall resiliency. Moreover, they demonstrated a growing recognition of the multifaceted implications of hygrothermal performance in architectural design and preconstruction phases. By incorporating such analyses into building strategies, decisionmakers can gain deeper insights into the hygrothermal performance of building envelopes (e.g., walls) early in the design phase. This understanding empowers them to take proactive measures to enhance structures’ adaptability and resilience, ensuring long-term sustainability amid changing climatic conditions at considerably lower costs.

3. Methodology

The process of evaluating the hygrothermal performance of the AHW panel is outlined in three main steps as follows (see Figure 1): (1) obtaining material and thermal properties of the AHW from the Cold Climate Housing Research Center (CCHRC); (2) conducting hygrothermal modeling by loading the weather file for Fairbanks, AK, USA, from WUFI® software, and then designing and modeling the AHW; and (3) analyzing and interpreting the data to evaluate the potential risk of mold growth in the AHWs. These three steps are explained in detail below.
Step 1 focuses on obtaining all characteristics (i.e., thicknesses, material properties) and material parameters of the adaptable house walls constructed by the Cold Climate Housing Research Center (CCHRC) of the National Renewable Energy Laboratory (NREL), based in Fairbanks, Alaska [33]. The material parameters for simulation in this study include (1) basic parameters (e.g., bulk density, porosity), (2) thermal parameters (e.g., heat capacity, thermal conductivity, moisture supplement), and (3) hygric parameters (e.g., sorption moisture at 80% relative humidity, free water saturation, water vapor diffusion resistance factor, water absorption coefficient).
Step 2 involves loading the yearly weather file (i.e., 8760 h) of Fairbanks, AK, USA, to the hygrothermal performance model. The weather file includes various variables such as temperature, relative humidity, solar radiation, rain precipitation, wind speed, wind direction, and barometric pressure. Then, this step identifies the most vulnerable side of the AHW to rainfall exposure year-round in compliance with ASHRAE 160 standards [33].
Additionally, this step also focuses on designing and modeling the AHWs in a simulation software to evaluate its hygrothermal performance during the winter conditions of Alaska. The hygrothermal performance model leverages data obtained in step 1, encompassing material thicknesses, material properties, and thermal characteristics for each wall layer. Additionally, the model incorporates the specified wall orientation. To account for rain loads, the building’s height is defined in the model, with calculations being based on the chosen location’s (city’s) weather data. Finally, the simulation period is established, traditionally spanning five years in accordance with ASHRAE 160 standard guidelines [25].
Step 3 includes analyzing and interpreting the results from the hygrothermal performance model based on the ASHRAE 160 standard [25]. The results typically include the water content in each layer of the AHW, the temperature and relative humidity (RH%) of each layer of the wall, and the mold growth index (MGI) of the interior and exterior layers of the modeled wall meeting the ASHRAE 160 standard requirements [25].

4. Hygrothermal Performance Analysis

The hygrothermal performance analysis was performed following the three steps described in Section 3.

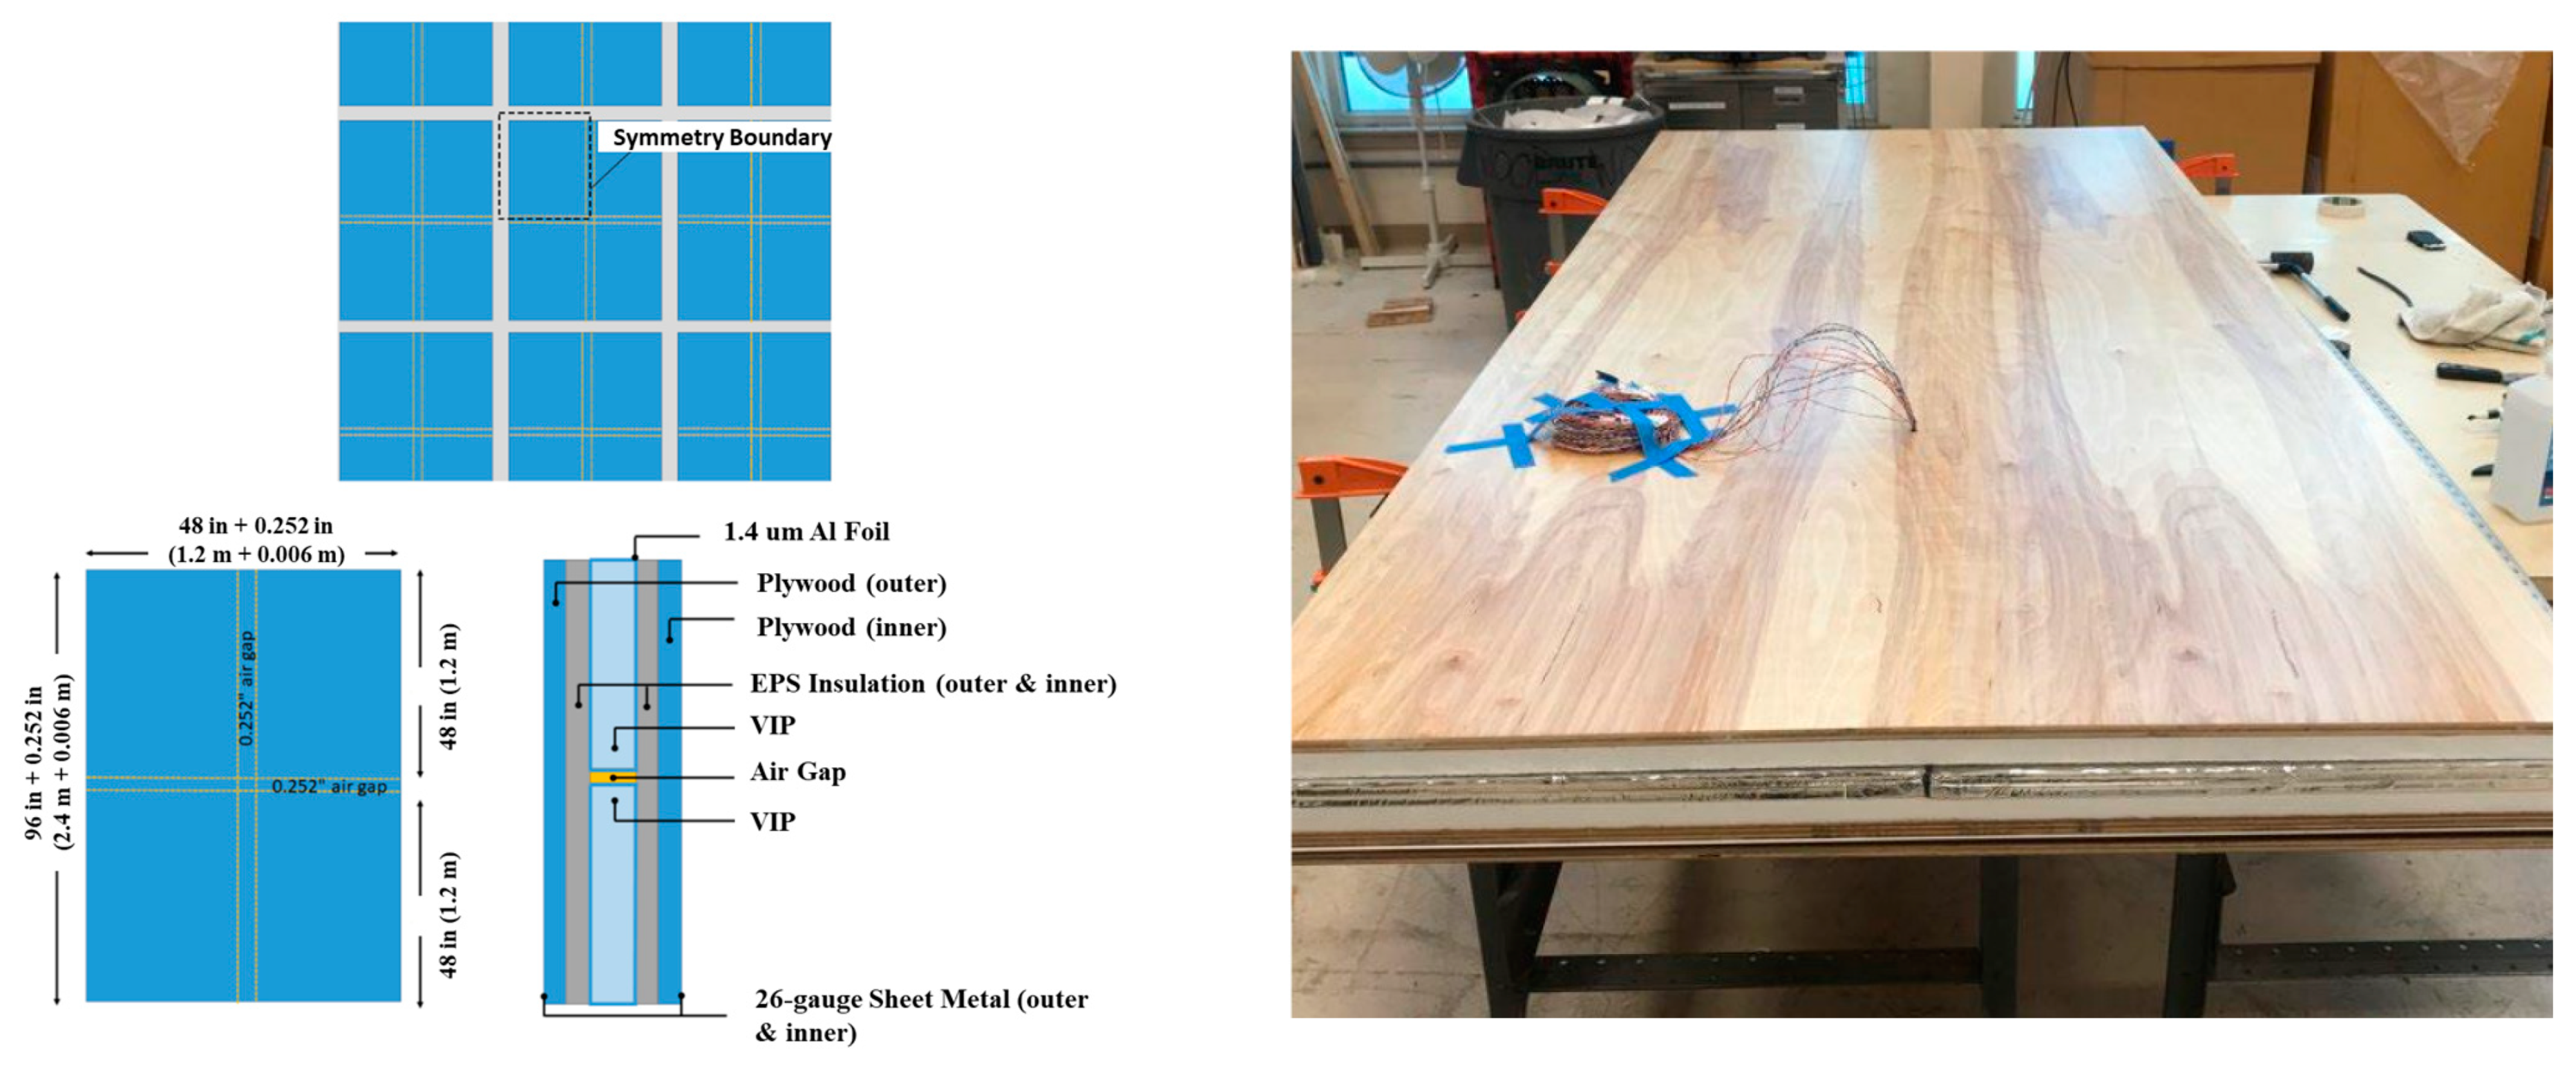
4.1. Collection of Material and Thermal Properties of Adaptable House Walls

In this section, the material and thermal characteristics (e.g., material thicknesses, thermal conductivities, and thermal resistances) of the adaptable house walls were collected (see Table 1). The resilient design of the adaptable house was specifically tailored to endure the demanding climatic conditions of Alaska to meet the International Energy Conservation Code (IECC) requirements pertinent to ASHRAE climate zones 7 and 8 in Alaska.

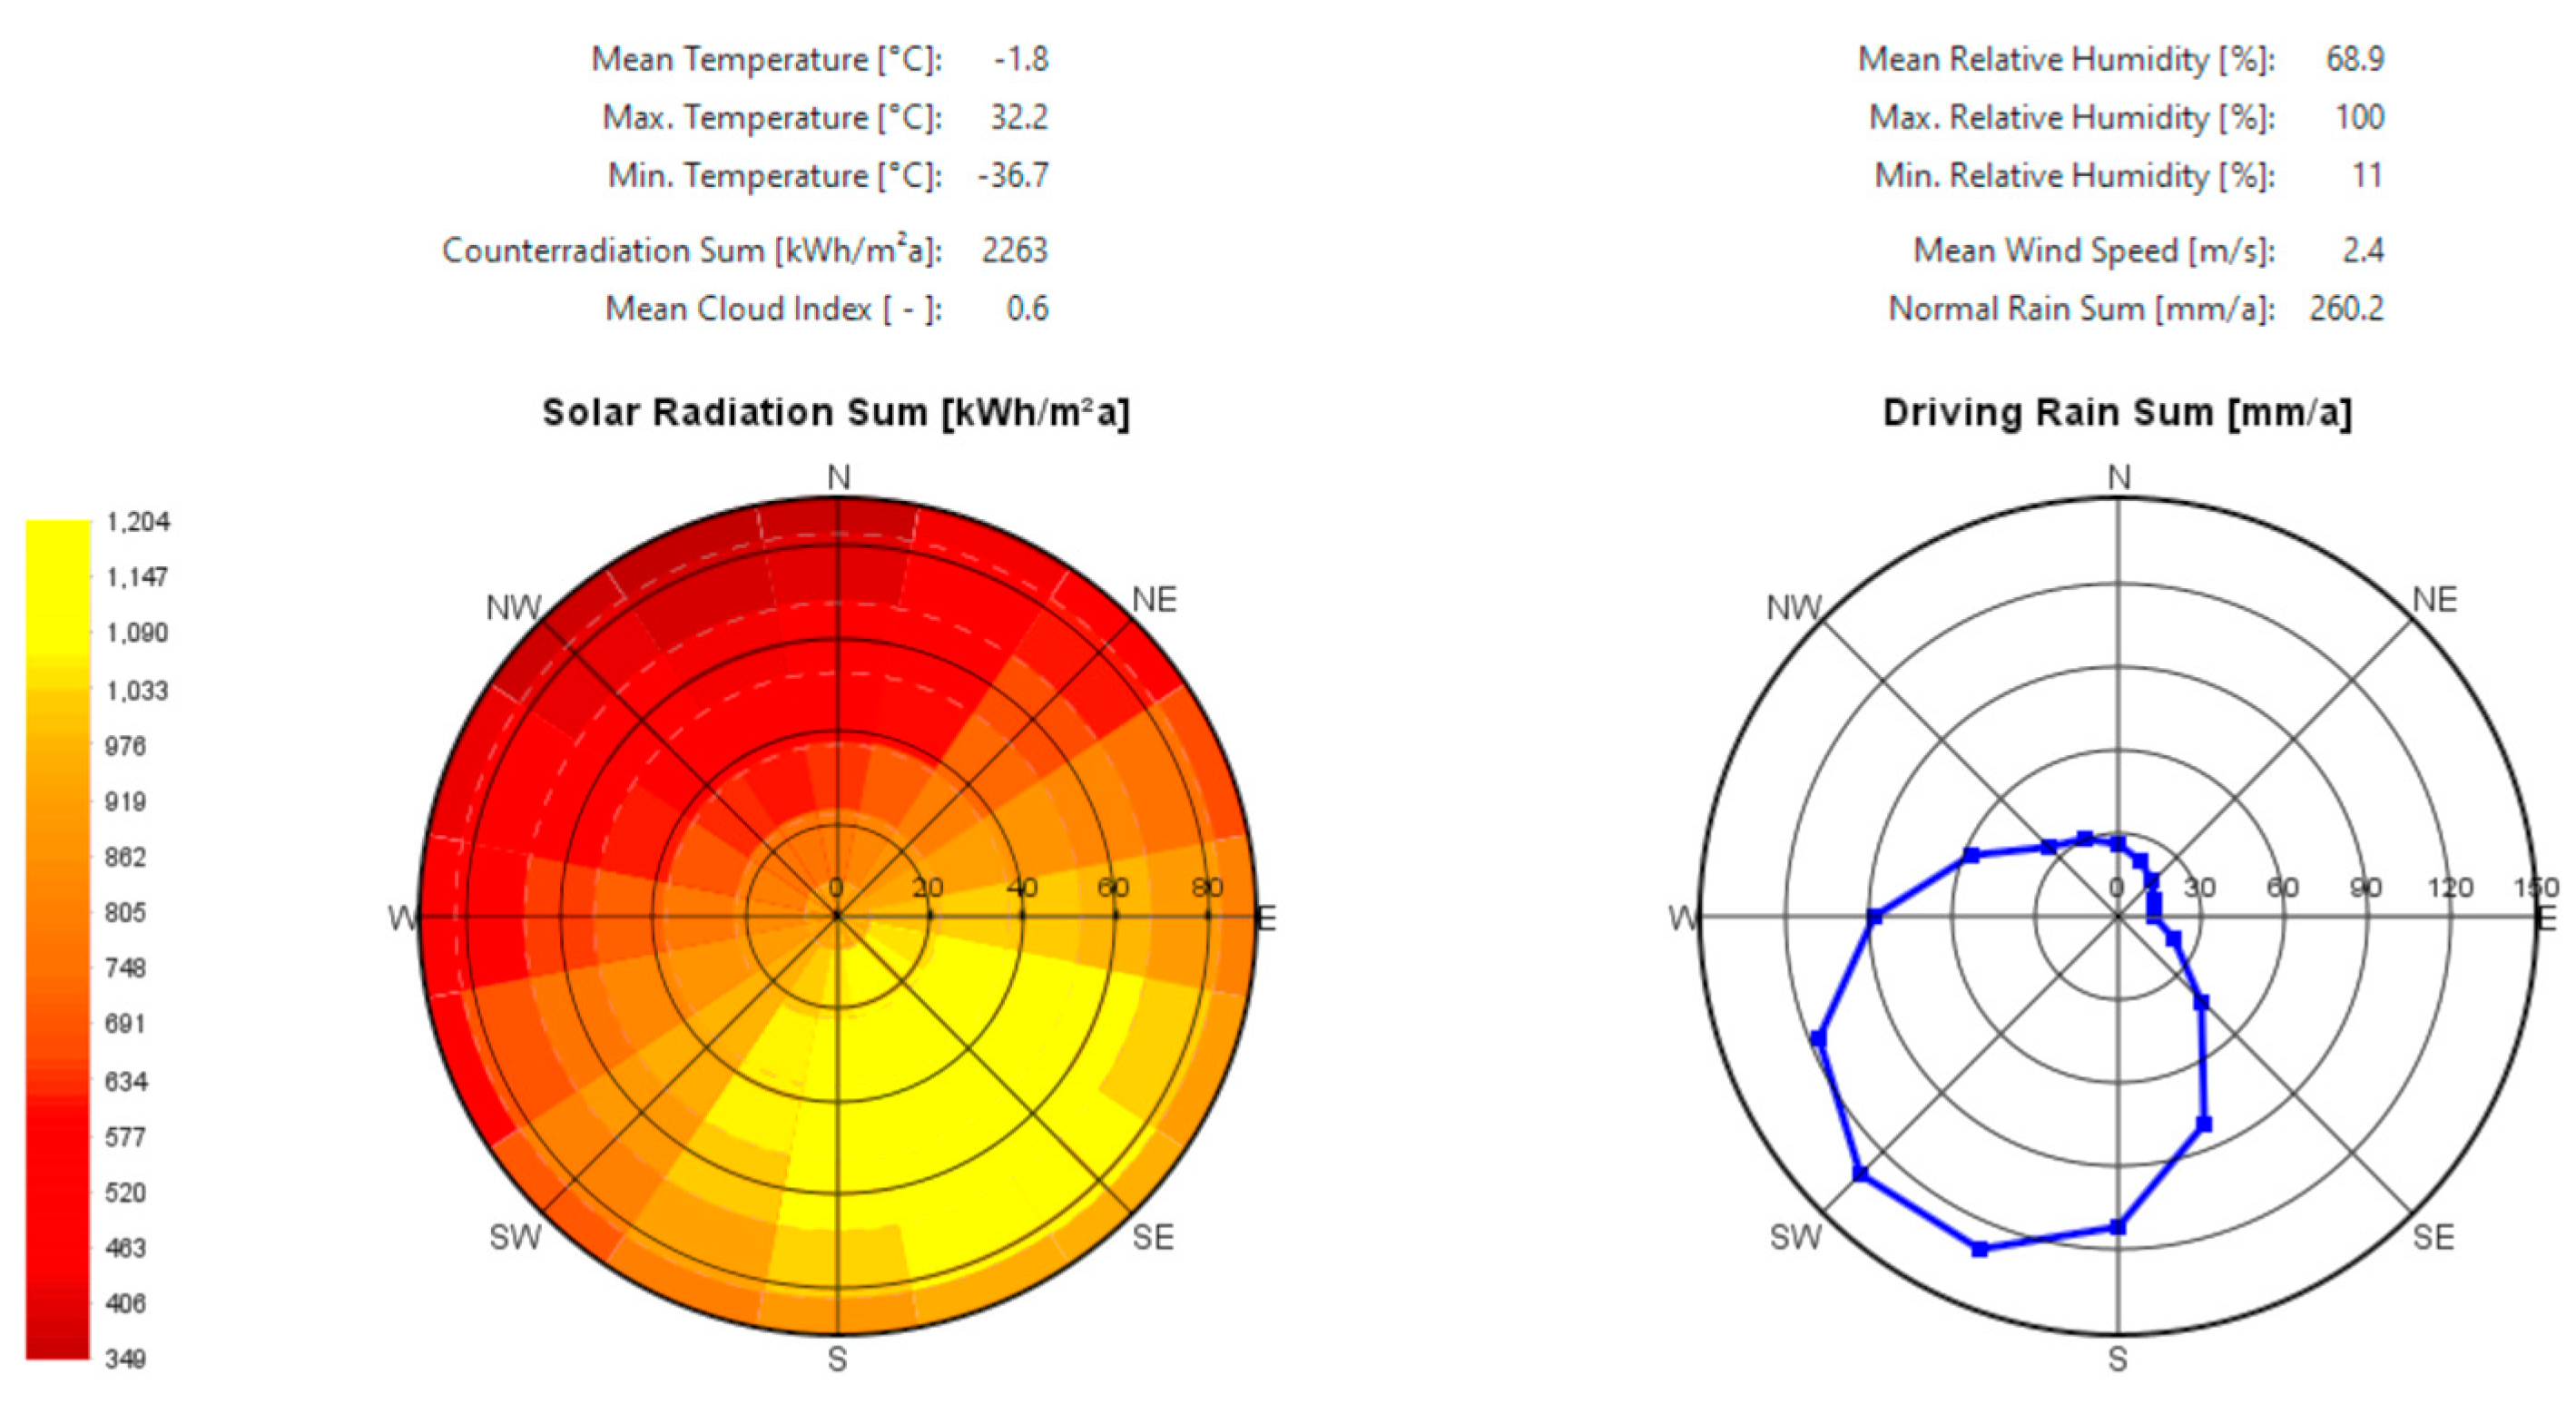
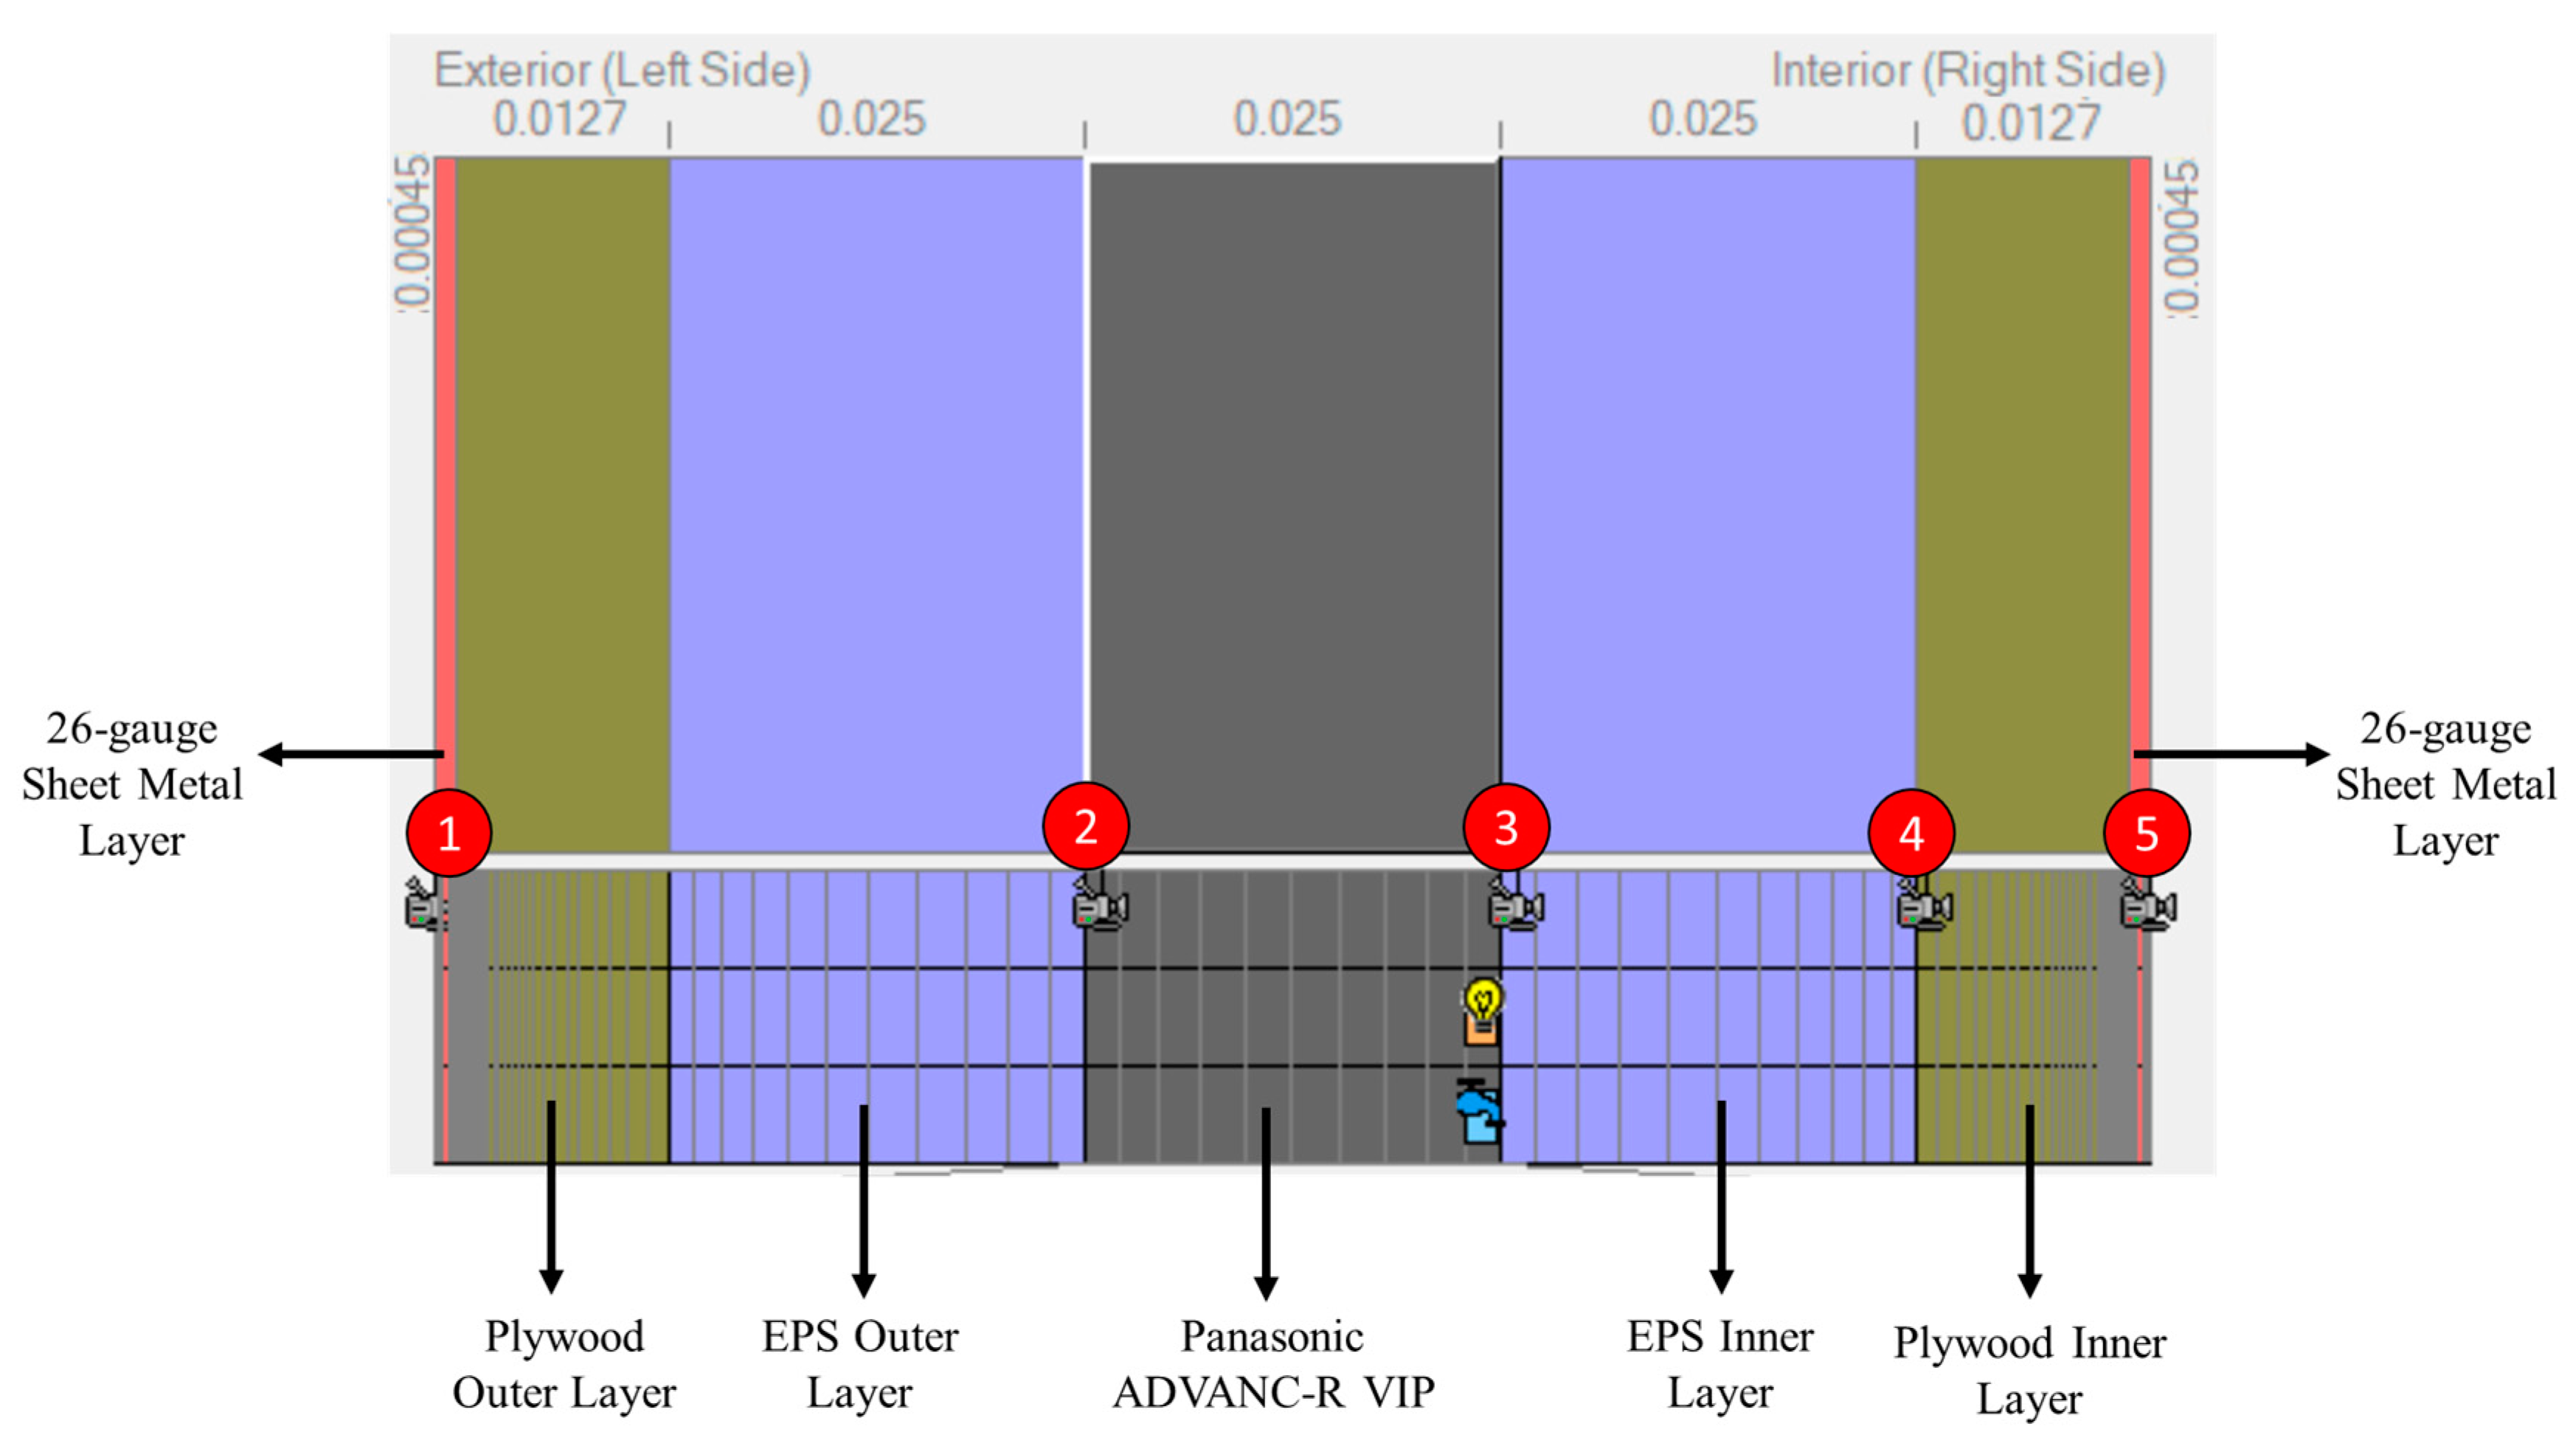
4.2. Hygrothermal Performance Modeling for Adaptable House Walls

In order to perform the hygrothermal performance analysis, WUFI® PRO v6.7 software was utilized in this study for the AHWs. Figure 2 shows the schematics and actual layout of the AHWs. WUFI® PRO stands as the industry-standard software utilized to assess moisture conditions within building envelopes. It conducts one-dimensional hygrothermal computations on cross-sections of building components, considering various factors like built-in moisture, driving rain, solar and long-wave radiation, capillary transport, and potential summer condensation. The software provides a comprehensive and dynamic analysis crucial for precise designing [34]. Such detailed dynamic hygrothermal analyses offered by WUFI® PRO are imperative for accurate design planning and are mandated by standards like DIN EN 15026 (European standard) [35] and ASHRAE 160 (USA standard) to ensure compliance [34].
Numerous studies have substantiated the efficacy of WUFI® software in evaluating the hygrothermal performance of building envelopes [36,37,38,39,40]. Kunzel [36], the establisher of the software, validated the accuracy of the results by comparing the simulation and experimental results of the moisture behavior of a natural stone wall section during natural weathering, the drying out of a moist cellular concrete roof, and the behavior of water uptake and release behavior of a masonry stone. Similarly, Ozolins et al. [37] verified WUFI® software’s accuracy in assessing the hygrothermal performance of multi-layered building walls. Holzhueter and Itonaga [38] evaluated their adapted WUFI® model by comparing it with experimental data to predict mold growth in straw bale walls. Yoo et al. [39] validated the WUFI® model accuracy by comparing the experimental and simulated results for measuring the hygrothermal behavior of cross-laminated timber (CLT) wall using different types of insulation, including XPS, phenol foam, and glass wool. Consequently, this study employs WUFI® PRO software as a precise simulation tool to evaluate the hygrothermal performance of AHWs in extreme cold climate conditions observed in Fairbanks, AK, USA. This step of the methodology was divided into two sub-steps.
First, the weather file for Fairbanks, AK, USA, was loaded in WUFI® PRO v6.7. Then, the orientation with the most vulnerable side to rainfall exposure year-round was identified to be the southwestern (SW) side of the AHW (see Figure 3). In Figure 3, the solar radiation summation for Fairbanks, AK, USA, across all orientations (displayed on the left side) spans a range from 340 to 1204 kWh/m2 per year. Furthermore, Figure 3 illustrates the cumulative driving rain at 260.2 mm per year in Fairbanks, AK, with the SW side wall at 120 degrees experiencing the highest annual rainfall exposure (displayed on the right side in Figure 3). Consequently, the SW side wall was selected for hygrothermal performance modeling in this study. It is noteworthy to indicate that while hygrothermal simulations rely on weather data, their accuracy is less demanding than meteorological or climatological analyses. Weather elements’ impact on construction depends not just on their intensity but also on surface transfer coefficients, which are often estimated values [41].
Second, the AHWs including the material and thermal characteristics for each wall layer were designed and modeled in WUFI® PRO software (see Figure 4).
The WUFI® model in this study assumed a single bedroom within the adaptable house, accommodating two occupants in adherence to the ASHRAE 160 standard [25]. The modeled house’s SW wall of the house was assumed to experience a high level of rain exposure, 260 mm/year (10 in/year), as there are no adjacent buildings on its SW side (see Figure 3).
The simulation was conducted over a five-year period (required by ASHRAE 160), spanning from 1 October 2022 to 1 October 2027. ASHRAE Year 2 was selected in the WUFI model, as it is considered the second most severe year in terms of moisture damage potential within building envelopes, as outlined by ASHRAE RP 1325 [42]. Furthermore, default HVAC control settings were applied in the WUFI model, with a heating set point of 21.1 °C and a cooling set point of 23.9 °C, following ASHRAE 160 standard.
Finally, as can be observed in Figure 2, there is an air gap between the VIPs in the AHW panel. In this study, 1-D WUFI® PRO was used as the hygrothermal performance modeling software; thus, the effective thermal resistance (R-value) of the AHW was calculated to transform the influence of the air gap from a 2-D perspective to a 1-D perspective. This was achieved by applying the parallel path R-value method, which was adopted by Kempton and colleagues [43], utilizing Equations (1) and (2).
A v e r a g e   R v a l u e = ( R T o t a l   ( V I P ) × A T o t a l   ( V I P ) ) + ( R T o t a l   ( A i r   G a p ) × A T o t a l   ( A i r   G a p ) ) A T o t a l
where:
  • R T o t a l   ( V I P ) : Total thermal resistance (R-value) of the AHW with VIP, m2·K/W;
  • R T o t a l   ( A i r   G a p ) : Total thermal resistance (R-value) of the AHW with air gap excluding VIP, m2·K/W;
  • A T o t a l   ( V I P ) : Total area of the AHW covered with VIP, m2;
  • A T o t a l   ( A i r   G a p ) : Total area of the AHW covered with air (highlighted in yellow lines in Figure 2), m2;
  • A T o t a l   ( A i r   G a p ) : Total area of the whole modeled AHW, m2.
R T o t a l   ( V I P ) = 7.6 × 10 7 + 0.192 + 0.694 + 11.364 + 0.694 + 0.192 + 7.6 × 10 7 = 13.136   m 2 · K / W
R T o t a l   ( A i r   G a p ) = 7.6 × 10 7 + 0.192 + 0.694 + 0.265 + 0.694 + 0.192 + 7.6 × 10 7 = 2.037   m 2 · K / W
A v e r a g e   R v a l u e = ( 13.136 × [ 1.2192 × 2.4384 ] ) + ( 2.037 × 0.0235 ) 2.4448 × 1.2256 = 12.73   m 2 · K / W
E f f e c t i v e   R v a l u e = 12.73 ( 7.6   ×   10 7 + 0.192 + 0.694 + 0.694 + 0.192 + 7.6 × 10 7 ) = 10.95   m 2 · K / W
E f f e c t i v e   T h e r m a l   C o n d u c t i v i t y   ( k v a l u e )   o f   V I P = Thickness R value
E f f e c t i v e   T h e r m a l   C o n d u c t i v i t y   ( k v a l u e )   o f   V I P = 0.025   m 10.95   m 2 · k / W = 0.0023   W / m · K

4.3. Data Analysis

Figure 5 illustrates the cumulative water content within the SW walls of the AHW over the course of the five-year simulation period. The data displayed in the figure exhibit a recurring pattern annually, as one-year weather data was used for the simulation. The peaks observed in the graph correspond to instances of rainfall events during each year.
Figure 6 provides a comprehensive overview of the water content within each material constituting the SW walls of the AHW as simulated over a span of five years within the WUFI® model. Several key observations can be made from the data: (1) The outer plywood layer exhibits significant fluctuations in water content, ranging from 25 to 110 Kg/m2. The pronounced variability can be attributed to its direct exposure to rain events throughout the year; (2) The remaining layers, except for the interior plywood layer, demonstrate relatively stable water content levels, particularly during periods without rain events. These layers tend to dry out effectively during dry spells; (3) The inner plywood layer displays a slightly higher water content compared with the other layers. This can be attributed to the absence of water and air resistive barriers on the inner side of the plywood. Consequently, the indoor climate conditions exert an influence on this layer’s moisture content.
Moreover, the positions of temperature and relative humidity (RH%) in the SW walls were monitored at five different locations from position 1 to position 5 in WUFI® model, as shown in Figure 4.
In Figure 7, at position 1 (the exterior layer), significant fluctuations in temperature and relative humidity (RH%) are evident throughout the year due to direct exposure to rain. Moving to position 2, elevated moisture levels are observed due to both rain and temperature. Even with EPS insulation at position 2, the winter season notices temperatures dropping as low as −20 °C, potentially leading to frost accumulation unless frost protection materials are implemented. Furthermore, it is noteworthy that as temperatures rise, RH% decreases at position 3–position 5, suggesting that the Panasonic ADVANC-R VIP effectively prevents water accumulation in the interior layers. These investigations were performed to determine the impact of temperature and RH% on the MGI in the simulated model.
Moreover, isopleth graphs were used in this study to assess potential mold growth. The double curved lines on these graphs represent the lowest thresholds for mold growth (see Figure 8, Figure 9, Figure 10 and Figure 11). When data points, each representing an hour, exceed these two lines, there is a heightened likelihood of mold growth (see Figure 10). This can be verified through WUFI Bio (for European-based building standards) or WUFI VTT (for USA-based building standards). Conversely, if data points consistently remain below these lines, there is no risk of mold on the layer (see Figure 8, Figure 9, and Figure 11).
The color of the data points in Figure 8, Figure 9, Figure 10 and Figure 11 signifies the time of calculation, such that yellow marks the start of the simulation model calculation (year 1) while black indicates the end of the calculation (year 5), as indicated in the color legends. Interestingly, in Figure 8, it appears that during the initial stage of the simulation, there was an hour in the interior surface graph (colored in yellow and circled in red) that bordered on the risk of mold growth, but this situation resolved itself over time. Figure 8, Figure 9, and Figure 11 also show that there is no potential risk of mold growth in the interior surface and the exterior plywood layers of the AHWs. However, the double curved lines representing the lowest thresholds on the exterior EPS layer indicate a potential risk of mold growth in the adaptable walls. Therefore, WUFI VTT was used to verify the mold growth potential of occurrence following the ASHRAE 160 requirements for mold growth detection.
Figure 12 shows the mean climate profile including temperature, water content, and relative humidity for each layer in the simulated SW side of the AHW of the house over a five-year period using the WUFI® model. In the figure, the left side corresponds to the exterior surface of the wall, while the right side corresponds to the interior side. Notably, the temperature (colored in red) within the first three layers of the AHW—comprising 26-gauge sheet metal outer (0.0455 cm), plywood outer (1.27 cm), and EPS outer (2.5 cm)—experiences substantial temperature fluctuations ranging between −20 °C and 30 °C over the entire five-year simulation period. This suggests that these layers alone are insufficient in shielding the AHW from the varying climate conditions, including temperature shifts, wind, and rain. However, the temperature remains consistently stable within the last three layers of the AHW—comprising EPS inner (2.5 cm), plywood inner (1.27 cm), and 26-gauge sheet metal inner (0.0455 cm)—signaling the effective insulation provided by the exterior layers and the Panasonic ADVANC-R VIP layer (2.5 cm). This insulation shields the inner layers from substantial fluctuations in indoor climate conditions. Moreover, the relative humidity percent (colored in green) is consistently high (>60%) over time, and it significantly fluctuates within the three insulation layers of EPS outer (2.5 cm), an ADVANC-R VIP layer (2.5 cm), and EPS inner (2.5 cm), indicating suboptimal hygrothermal performance, which could pose a potential risk of mold growth within the inner layers of the AHWs. As shown in Figure 12, the water content (colored in blue) within the AHW remains notably low, aligning with expectations due to the consistently low exposure to rainfall throughout the year. Accordingly, WUFI® VTT was used to verify the mold growth potential of occurrence. As a result, it is essential to consider the incorporation of frost protection materials into the AHW to address these hygrothermal challenges.
Material surface assessment based on measurements or hygrothermal simulation data can be performed with minimal setup. The WUFI® Mold Index VTT postprocessor includes mold growth criteria that are compliant with the ASHRAE 160 standard. It utilizes a user-friendly traffic light system to categorize results from acceptable (green) to unacceptable (red) according to user exposure levels [43]. When results fall within the yellow range, users must decide if the specific component’s risk of mold growth remains acceptable or has reached an unacceptably high-level threshold [44].
In this study, Figure 13 and Figure 14 present the MGI potential for both the inner and outer plywood layers of the SW side walls of the adaptable house over a five-year period using the WUFI® Mold Index VTT postprocessor.
In Figure 13, the MGI for the inner plywood layer recorded a value of approximately 1.25, placing it within the medium risk range (marked yellow in the traffic light system, located in the upper left corner of Figure 13) according to ASHRAE 160 standards. It is important to note that because the MGI falls below three, the risk of mold growth is not considered high [25]. However, with an MGI value ranging from one to two, microscopic examination may reveal localized or small colonies of mold growth on the inner plywood surface. This mold growth is not visible to the naked eye. Addressing this mold growth concern in the adaptable house will necessitate improved design and alternative construction materials in the future.
Conversely, Figure 14 shows that the MGI in the outer plywood layer is zero, marked as acceptable (marked green in the traffic light system, located in the upper left corner of Figure 14), indicating the absence of any potential mold growth risk in the outer plywood layer.

5. Conclusions

Dealing with moisture-related problems and subsequent mold growth in buildings represents a multifaceted challenge leading to significant repercussions, including: (1) compromising occupants’ comfort; (2) diminishing the effectiveness of insulation, resulting in increased energy consumption; and (3) jeopardizing the structural integrity of the building. While achieving effective thermal performance through high thermal resistance is a fundamental requirement for building envelopes, encompassing moisture prevention dynamics in building design also plays a pivotal role for the long-term durability and functionality of the structure.
Therefore, this study fills a crucial gap by highlighting that solely improving the thermal resistance of building walls is not enough for their long-lasting effectiveness. Instead, it is crucial for decisionmakers to conduct thorough assessments of hygrothermal performance—evaluating both thermal and moisture aspects together—during the design phase.
In this study, the hygrothermal performance of a unique wall panel called “Adaptable House Wall (AHW)”, designed as composite infill panels paired with VIPs, was assessed. This panel was engineered by the Cold Climate Housing Research Center (CCHRC) at the National Renewable Energy Laboratory (NREL). The purpose of this comprehensive analysis was to understand how it performs under hygrothermal conditions, particularly in the extreme cold climate of Fairbanks, Alaska. Thus, the thermal and material properties of the AHW were simulated in WUFI® software based on Fairbank’s weather data over a five-year period (required by ASHRAE 160). In line with the simulation findings, the assessment of rainfall exposure pinpointed the SW orientation as the area of greatest vulnerability for the AHWs. Consequently, the subsequent analysis focused exclusively on this SW side to examine the hygrothermal performance.
The primary findings from this study reveal that the MGI for the inner plywood layer of the AHW signifies a moderate level of mold growth risk. In contrast, the MGI for the outer plywood layer registers at zero, signifying it as meeting acceptable standards. This study’s approach will enable decisionmakers to:
  • Customize hygrothermal assessments to specific climate zones or micro-climates, offer more advanced and context-specific advice for decisionmakers, and potentially save significant construction costs during the design phase.
  • Analyze the long-term performance of various wall designs or materials; and consider numerous factors like maintenance, durability, and energy efficiency, which play a crucial role in predicting the construction’s lifecycle. This insight can lead to substantial cost savings throughout the building’s operational lifespan.

Author Contributions

Conceptualization, H.P., H.K., P.S. and A.K.; methodology, H.P. and A.K.; software, H.P.; validation, H.P., H.K., P.S. and A.K.; formal analysis, H.P. and A.K.; investigation, H.K., P.S. and A.K.; data curation; H.P., H.K., P.S. and A.K.; writing, H.P., H.K., P.S. and A.K.; writing—review and editing, A.K.; visualization, H.P., H.K., P.S. and A.K.; supervision, A.K. All authors have read and agreed to the published version of the manuscript.

Funding

This research received no external funding.

Data Availability Statement

The data presented in this study are available on request from the corresponding author.

Acknowledgments

The authors of this study would like to express their sincere gratitude to Stacey Fritz from Alaska Adaptable Housing LLC for her invaluable support and assistance.

Conflicts of Interest

The authors declare no conflict of interest.

Abbreviations

AHWAdaptable house wall
ASHRAEAmerican Society of Heating, Refrigerating and Air-Conditioning Engineers
CCHRCCold Climate Housing Research Center
EPSExpanded polystyrene insulation
HVACHeating, ventilation, and air conditioning
IECCInternational Energy Conservation Code
ISOInternational Organization for Standardization
kThermal conductivity
KKelvin
mMeter
MGIMold growth index
NRELNational Renewable Energy Laboratory
RThermal resistance
RHRelative humidity
SWSouthwestern
VIPVacuum-insulated panels
WWatts
WUFI®Wärme-und Feuchtetransport instationär (transient heat and moisture transport)
XPSExtruded polystyrene insulation

References

  1. IEA Buildings. A Source of Enormous Untapped Efficiency Potential; International Energy Agency (IEA): Paris, France, 2021. [Google Scholar]
  2. Palani, H.; Acosta-Sequeda, J.; Derrible, S.; Karatas, A. Predicting energy use intensity of us hotel buildings using Cbecs microdata. Proc. Int. Struct. Eng. Constr. 2023, 10, 1–6. [Google Scholar] [CrossRef]
  3. Ozel, M. Thermal, Economical and Environmental Analysis of Insulated Building Walls in a Cold Climate. Energy Convers. Manag. 2013, 76, 674–684. [Google Scholar] [CrossRef]
  4. Aslani, A.; Bakhtiar, A.; Akbarzadeh, M.H. Energy-Efficiency Technologies in the Building Envelope: Life Cycle and Adaptation Assessment. J. Build. Eng. 2019, 21, 55–63. [Google Scholar] [CrossRef]
  5. Lucchi, E.; Roberti, F.; Alexandra, T. Definition of an Experimental Procedure with the Hot Box Method for the Thermal Performance Evaluation of Inhomogeneous Walls. Energy Build. 2018, 179, 99–111. [Google Scholar] [CrossRef]
  6. Palani, H.; Karatas, A. Investigating the Disparities between Experimental and Computational Analyses of Thermal Performance in Prefabricated Wall Panels. Appl. Therm. Eng. 2024, 236, 121568. [Google Scholar] [CrossRef]
  7. Chowdhury, D.; Neogi, S. Thermal Performance Evaluation of Traditional Walls and Roof Used in Tropical Climate Using Guarded Hot Box. Constr. Build. Mater. 2019, 218, 73–89. [Google Scholar] [CrossRef]
  8. Seitz, S.; Beaudry, K.; MacDougall, C. Thermal performance of panels with high density, randomly oriented straw bales. J. Green Build. 2018, 13, 31–55. [Google Scholar] [CrossRef]
  9. Palani, H.; Karatas, A. Innovative Environmental Chamber Construction for Accurate Thermal Performance Evaluation of Building Envelopes in Varied Climates. Buildings 2023, 13, 1259. [Google Scholar] [CrossRef]
  10. Hou, J.; Zhang, T.; Liu, Z.; Hou, C.; Fukuda, H. A study on influencing factors of optimum insulation thickness of exterior walls for rural traditional dwellings in northeast of Sichuan hills, China. Case Stud. Constr. Mater. 2022, 16, e01033. [Google Scholar] [CrossRef]
  11. Li, T.; Liu, Q.; Mao, Q.; Chen, M.; Ma, C.; Wang, D.; Liu, Y. Optimization design research of insulation thickness of exterior wall based on the orientation difference of solar radiation intensity. Appl. Therm. Eng. 2023, 223, 119977. [Google Scholar] [CrossRef]
  12. Bartko, M.; Jonkman, R.; Lacasse, M.; Moore, T.; Parekh, A.; Plescia, S. An Overview of Studies to Assess the Thermal and Hygrothermal Performance of Highly Insulated and Zero Energy Ready Wall Assemblies. In Proceedings of the 15th Canadian Conference on Building Science and Technology, Vancouver, BC, Canada, 6–8 November 2017. [Google Scholar]
  13. Boudreaux, P.; Pallin, S.; Accawi, G.; Desjarlais, A.; Jackson, R.; Senecal, D. A rule-based expert system applied to moisture durability of building envelopes. J. Build. Phys. 2018, 42, 416–437. [Google Scholar] [CrossRef]
  14. Pallin, S.; Boudreaux, P.; Jo, S.J.; Perez, M.; Albaugh, A. Simulations of Indoor Moisture Generation in U.S. Homes. In Advances in Hygrothermal Performance of Building Envelopes: Materials, Systems and Simulations; ASTM: West Conshohocken, PA, USA, 2017; pp. 261–290. [Google Scholar] [CrossRef]
  15. Kim, S.; Zirkelbach, D.; Künzel, H.M. Review of Methods to Create Meteorological Data Suitable for Moisture Control Design by Hygrothermal Building Envelope Simulation. Energies 2023, 16, 3271. [Google Scholar] [CrossRef]
  16. Recart, C.; Dossick, C.S. Hygrothermal behavior of post-retrofit housing: A review of the impacts of the energy efficiency upgrade strategies. Energy Build. 2022, 262, 112001. [Google Scholar] [CrossRef]
  17. Fedorik, F.; Heiskanen, R.; Laukkarinen, A.; Vinha, J. Impacts of multiple refurbishment strategies on hygrothermal behaviour of basement walls. J. Build. Eng. 2019, 26, 100902. [Google Scholar] [CrossRef]
  18. Mendell, M.J.; Mirer, A.G.; Cheung, K.; Tong, M.; Douwes, J. Respiratory and Allergic Health Effects of Dampness, Mold, and Dampness-Related Agents: A Review of the Epidemiologic Evidence. Environ. Health Perspect. 2011, 119, 748–756. [Google Scholar] [CrossRef] [PubMed]
  19. Quansah, R.; Jaakkola, M.S.; Hugg, T.T.; Heikkinen, S.A.M.; Jaakkola, J.J.K. Residential Dampness and Molds and the Risk of Developing Asthma: A Systematic Review and Meta-Analysis. PLoS ONE 2012, 7, e47526. [Google Scholar] [CrossRef] [PubMed]
  20. Kanchongkittiphon, W.; Mendell, M.J.; Gaffin, J.M.; Wang, G.; Phipatanakul, W. Indoor Environmental Exposures and Exacerbation of Asthma: An Update to the 2000 Review by the Institute of Medicine. Environ. Health Perspect. 2015, 123, 6–20. [Google Scholar] [CrossRef]
  21. Zhuge, Y.; Qian, H.; Zheng, X.; Huang, C.; Zhang, Y.; Zhang, M.; Li, B.; Zhao, Z.; Deng, Q.; Yang, X.; et al. Residential risk factors for childhood pneumonia: A cross-sectional study in eight cities of China. Environ. Int. 2018, 116, 83–91. [Google Scholar] [CrossRef]
  22. Morelli, M.; Møller, E.B. Energy savings and risk of mold growth in apartments renovated with internal insulation. Sci. Technol. Built Environ. 2019, 25, 1199–1211. [Google Scholar] [CrossRef]
  23. Du, C.; Wang, Y.; Li, B.; Xu, M.; Sadrizadeh, S. Grey image recognition-based mold growth assessment on the surface of typical building materials responding to dynamic thermal conditions. Build. Environ. 2023, 243, 110682. [Google Scholar] [CrossRef]
  24. ANSI/ASHRAE/IES Standard 90.1-2022; Energy Standard for Sites and Buildings Except Low Rise Residential Buildings. ASHRAE (American Society of Heating, Refrigerating and Air-Conditioning Engineers): Atlanta, GA, USA, 2022.
  25. ASHRAE Standard 160-2016; Criteria for Moisture Control Design Analysis in Buildings. American Society of Heating, Refrigerating and Air Conditioning Engineers: Atlanta, GA, USA, 2016.
  26. DOE (U.S. Department of Energy). Adaptable—Sustainable Housing Solutions for Every Climate. 2023. Available online: https://www.energy.gov/sites/default/files/2023-05/bto-peer-2023-adaptable.pdf (accessed on 13 October 2023).
  27. Cold Climate Housing Research Center, Inc. & National Renewable Energy Lab. 2023. Available online: https://acrobat.adobe.com/link/review?uri=urn:aaid:scds:US:68d4c2b4-82c6-33ef-878a-dc15948a6dde (accessed on 17 October 2023).
  28. Almeida, R.M.S.F.; Barreira, E. Monte Carlo Simulation to Evaluate Mould Growth in Walls: The Effect of Insulation, Orientation, and Finishing Coating. Adv. Civ. Eng. 2018, 2018, e8532167. [Google Scholar] [CrossRef]
  29. Bastien, D.; Winther-Gaasvig, M. Influence of driving rain and vapour diffusion on the hygrothermal performance of a hygroscopic and permeable building envelope. Energy 2018, 164, 288–297. [Google Scholar] [CrossRef]
  30. D’Orazio, M.; Cursio, G.; Graziani, L.; Aquilanti, L.; Osimani, A.; Clementi, F.; Yéprémian, C.; Lariccia, V.; Amoroso, S. Effects of water absorption and surface roughness on the bioreceptivity of ETICS compared to clay bricks. Build. Environ. 2014, 77, 20–28. [Google Scholar] [CrossRef]
  31. Gradeci, K.; Labonnote, N.; Time, B.; Köhler, J. Mould growth criteria and design avoidance approaches in wood-based materials—A systematic review. Constr. Build. Mater. 2017, 150, 77–88. [Google Scholar] [CrossRef]
  32. Klõšeiko, P.; Arumägi, E.; Kalamees, T. Hygrothermal performance of internally insulated brick wall in cold climate: A case study in a historical school building. J. Build. Phys. 2015, 38, 444–464. [Google Scholar] [CrossRef]
  33. Silveira, V.D.C.; Pinto, M.M.; Westphal, F.S. Influence of environmental factors favorable to the development and proliferation of mold in residential buildings in tropical climates. Build. Environ. 2019, 166, 106421. [Google Scholar] [CrossRef]
  34. WUFI. WUFI Pro. 2021. Available online: https://wufi.de/en/software/wufi-pro/ (accessed on 28 November 2023).
  35. DIN EN 15026:2007; Hygrothermal Performance of Building Components and Building Elements—Assessment of Moisture Transfer by Numerical Simulation. Deutsches Institut für Normung: Berlin, Germany, 2007.
  36. Kunzel, H.M. Simultaneous Heat and Moisture Transport in Building Components, One-And Two-Dimensional Calculation Using Simple Parameters; IRB-Verlag: Stuttgart, Germany, 1995; p. 65. [Google Scholar]
  37. Ozolins, A.; Jacovics, A.; Ratnieks, A. Moisture Risk in Multi-layered Walls—Comparison of COMSOL Multiphysics and WUFI Plus Models with Experimental Results. In Proceedings of the COMSOL 2013 Conference, Rotterdam, The Netherlands, 23–25 October 2013. [Google Scholar]
  38. Holzhueter, K.; Itonaga, K. An Evaluation of WUFI-Bio to Predict Mold Growth in Straw Bale Walls in Japan. J. Asian Arch. Build. Eng. 2017, 16, 357–362. [Google Scholar] [CrossRef]
  39. Yoo, J.; Chang, S.J.; Yang, S.; Wi, S.; Kim, Y.U.; Kim, S. Performance of the hygrothermal behavior of the CLT wall using different types of insulation; XPS, PF board and glass wool. Case Stud. Therm. Eng. 2021, 24, 100846. [Google Scholar] [CrossRef]
  40. Busser, T.; Berger, J.; Piot, A.; Pailha, M.; Woloszyn, M. Comparison of model numerical predictions of heat and moisture transfer in porous media with experimental observations at material and wall scales: An analysis of recent trends. Dry. Technol. 2019, 37, 1363–1395. [Google Scholar] [CrossRef]
  41. WUFI®. Creating Weather Files. 2023. Available online: https://wufi.de/en/service/downloads/creating-weather-files/ (accessed on 27 November 2023).
  42. ASHRAE 1365-RP; Thermal Performance of Building Envelope Details for Mid- and High-Rise Buildings. ASHRAE (American Society of Heating, Refrigerating and Air-Conditioning Engineers): Atlanta, GA, USA, 2011.
  43. Kempton, L.; Kokogiannakis, G.; Green, A.; Cooper, P. Evaluation of thermal bridging mitigation techniques and impact of calculation methods for lightweight steel frame external wall systems. J. Build. Eng. 2021, 43, 102893. [Google Scholar] [CrossRef]
  44. Viitanen, H.; Krus, M.; Ojanen, T.; Eitner, V.; Zirkelbach, D. Mold Risk Classification Based on Comparative Evaluation of Two Established Growth Models. Energy Procedia 2015, 78, 1425–1430. [Google Scholar] [CrossRef]
Figure 1. Methodology to evaluate the hygrothermal performance of the adaptable house wall in the extreme cold climate conditions of Alaska.
Sustainability 15 16597 g001
Figure 2. Schematic and actual adaptable house wall layout [26].
Sustainability 15 16597 g002
Figure 3. Fairbanks, AK, climate analysis for solar radiation sum and driving rain sum, generated by the WUFI® climate file.
Sustainability 15 16597 g003
Figure 4. Monitoring positions for temperature and RH% using various locations and materials in the adaptable house walls, simulated by WUFI®.
Sustainability 15 16597 g004
Figure 5. Accumulated moisture content in the SW wall of the adaptable house over a five-year simulation period.
Sustainability 15 16597 g005
Figure 6. Water content of each material used in the adaptable house SW side wall over the five-year simulation period.
Sustainability 15 16597 g006aSustainability 15 16597 g006b
Figure 7. Monitoring temperature and RH% in intersection points between SW wall layers.
Sustainability 15 16597 g007
Figure 8. Isopleth graph at different intersection elements in the SW side of the AHW—interior surface.
Sustainability 15 16597 g008
Figure 9. Isopleth graph at different intersection elements in the SW side of the AHW—plywood inner.
Sustainability 15 16597 g009
Figure 10. Isopleth graph at different intersection elements in the SW side of the AHW—expanded polystyrene insulation (EPS).
Sustainability 15 16597 g010
Figure 11. Isopleth graph at different intersections elements in the SW side of the AHW—Panasonic ADVANC-R vacuum insulation panel (VIP).
Sustainability 15 16597 g011
Figure 12. Mean climate profile of AHWs simulated on WUFI® over a five-year period—SW wall.
Sustainability 15 16597 g012
Figure 13. Mold growth index (MGI) for the inner plywood layer of the AHWs generated by WUFI® VTT—SW side.
Sustainability 15 16597 g013
Figure 14. Mold growth index (MGI) for the outer plywood layer of the AHWs generated by WUFI® VTT—SW side.
Sustainability 15 16597 g014
Table 1. Material and thermal characteristics of the adaptable house walls [24].
Layers (Outside to Inside)Thickness (Meter, m)Thermal Conductivity, k (Watt per Meter Kelvin, W/m·K)Thermal Resistance, R (Square Meters Kelvin per Watt, m2·K/W)
26-gauge sheet metal (1/40)” = 4.55 × 10−4607.6 × 10−7
Plywood0.01250.0650.192
EPS foam0.0250.0360.694
VIP0.0250.002211.364
EPS foam0.0250.0360.694
Plywood0.01250.0650.192
26-gauge sheet metal 4.55 × 10−4607.6 × 10−7
Air gap0.0250.0940.265
Disclaimer/Publisher’s Note: The statements, opinions and data contained in all publications are solely those of the individual author(s) and contributor(s) and not of MDPI and/or the editor(s). MDPI and/or the editor(s) disclaim responsibility for any injury to people or property resulting from any ideas, methods, instructions or products referred to in the content.

