1. Introduction
On 11 March 2020, the World Health Organization (WHO) declared COVID-19 a pandemic, with critical global impacts since its outbreak [
1]. As of 1 April 2022, WHO reported 486,761,597 confirmed cases (cumulative) and 6,142,735 deaths [
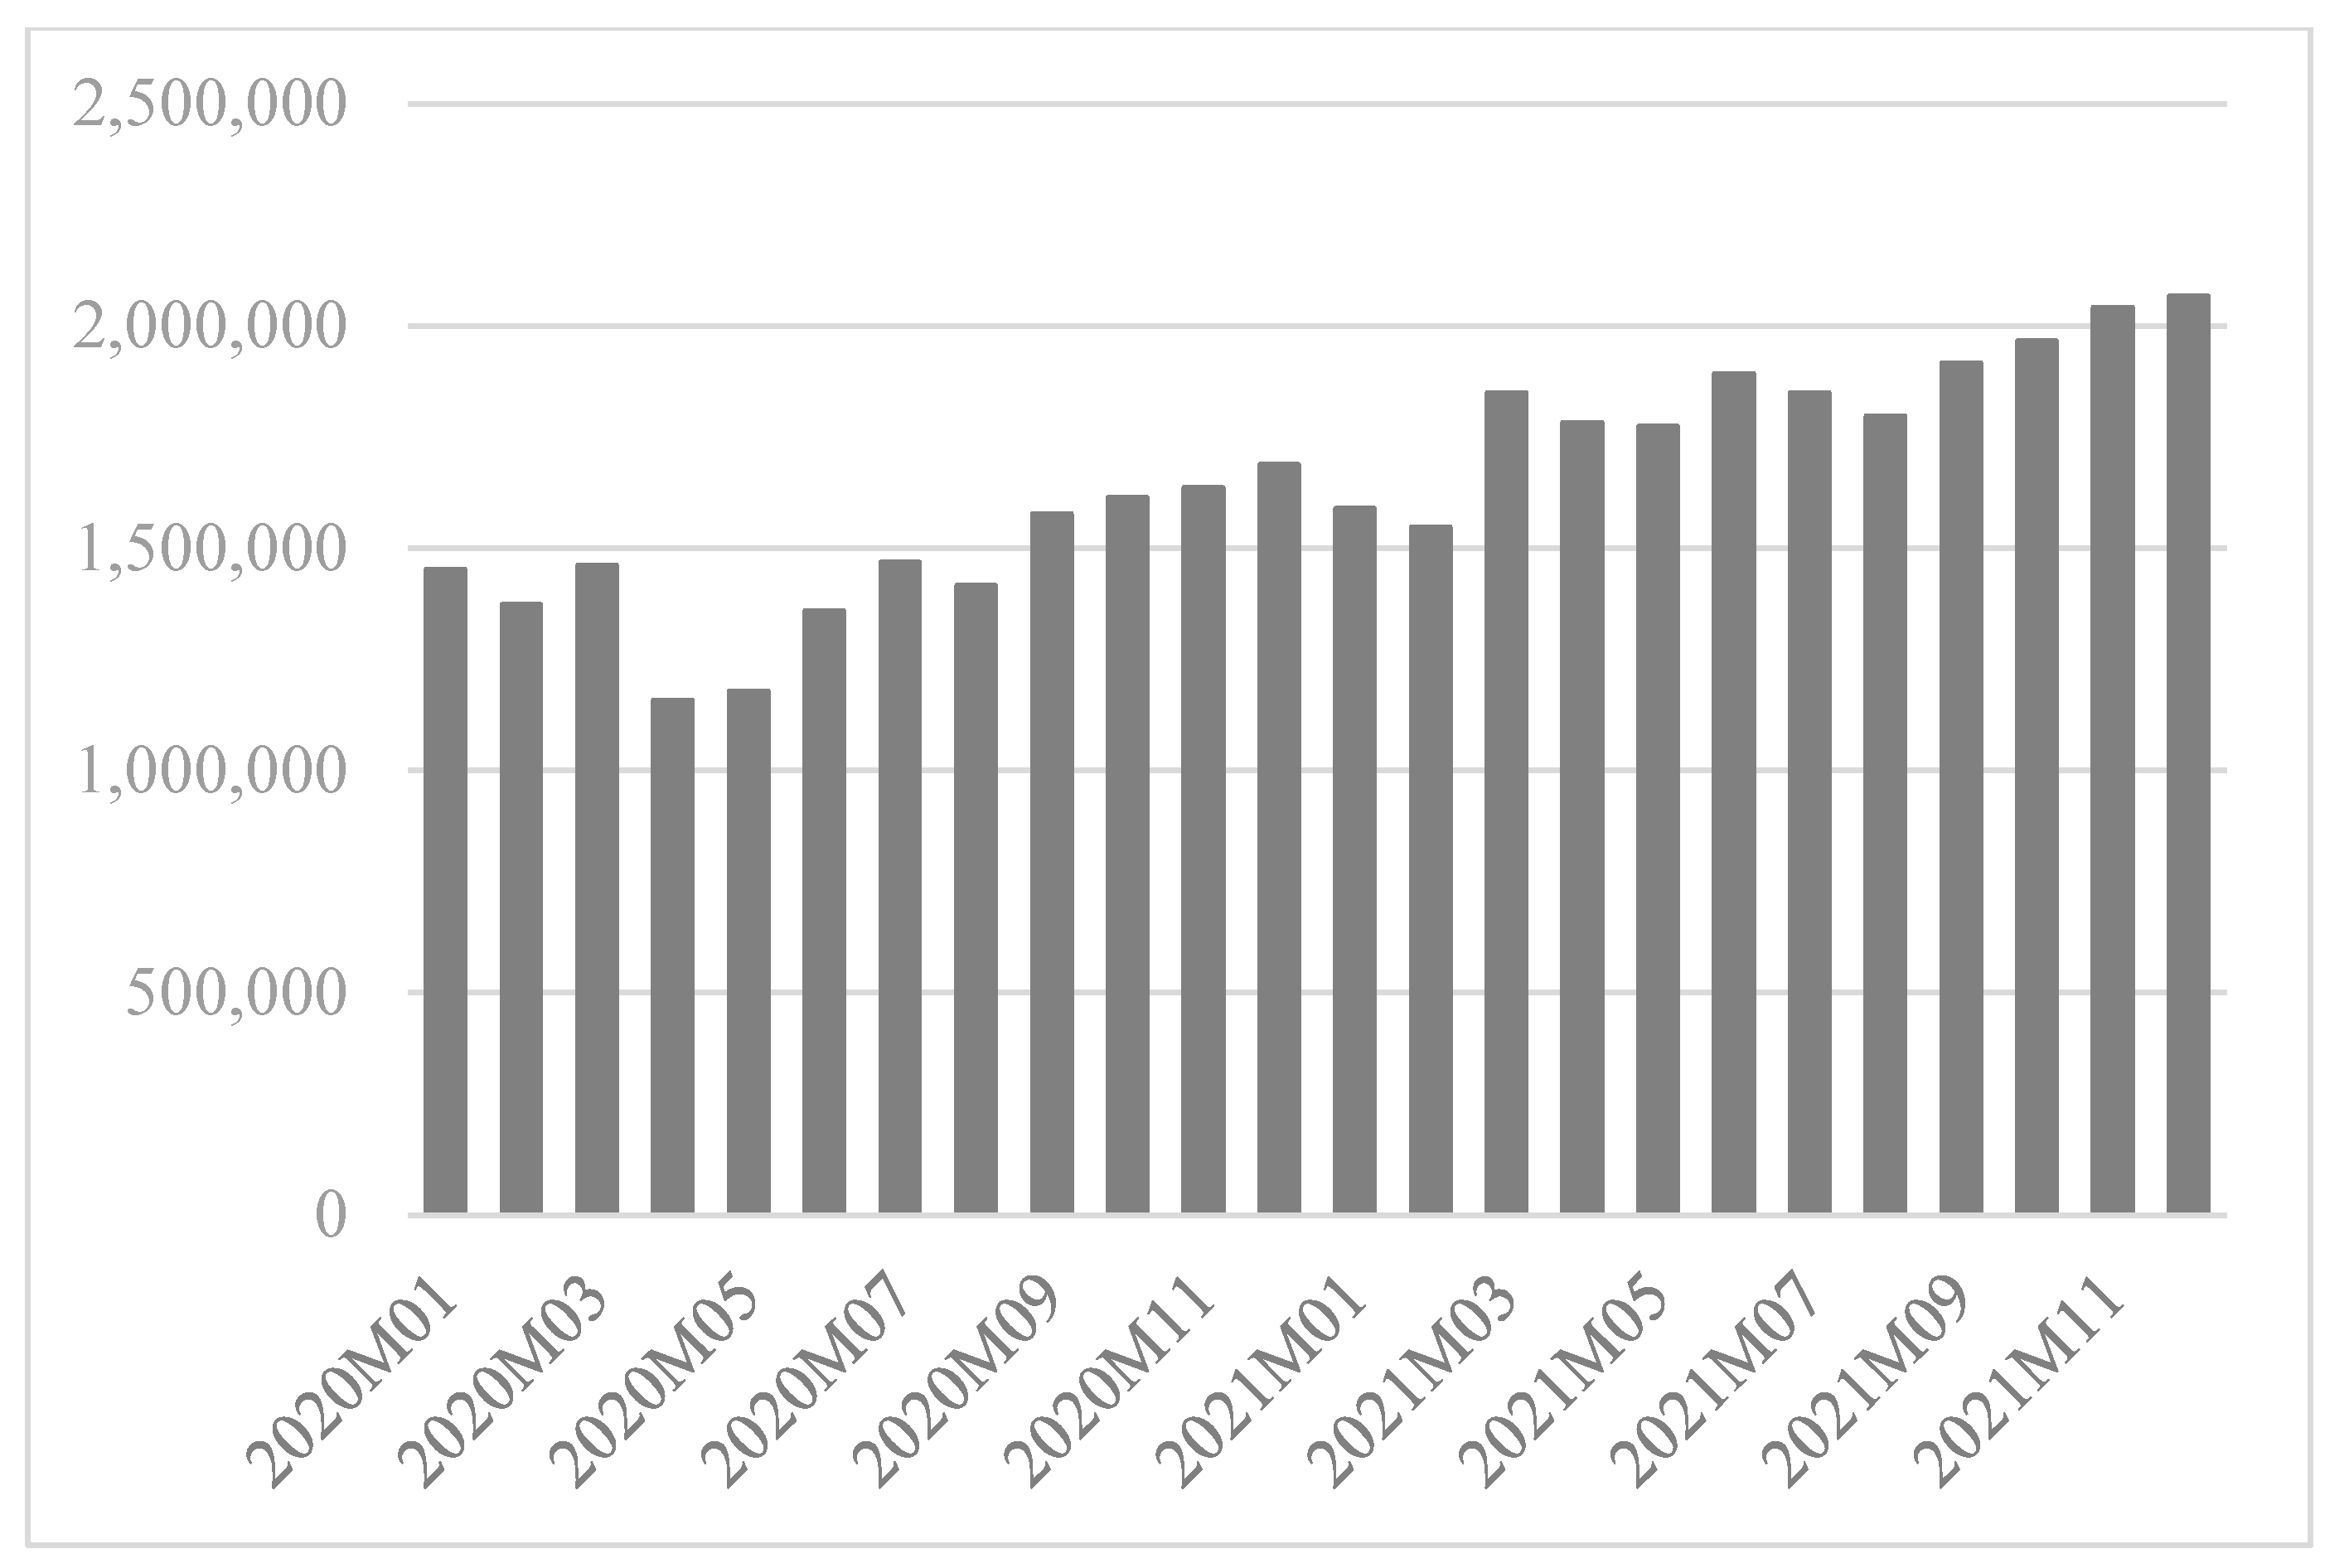
2]. This pandemic significantly affected international trade, leading to a decline since WHO declared a national emergency due to COVID-19, causing fluctuations in gradual growth (
Figure 1).
The COVID-19 pandemic has impacted both exporting and importing countries. The spread of COVID-19 prompted various levels of social distancing and lockdown orders. From an exporting country’s standpoint, these measures affected industrial production, leading to a sharp decrease in the labor force and a subsequent reduction in the production of goods, thereby hampering exports. Additionally, disruptions in marine and land transportation cycles increased logistics costs and potentially caused delays in exports. In essence, exporting countries encountered challenges of reduced production and supply chain disruptions.
For importing countries, the spread of COVID-19 was anticipated to decrease demand. However, there might be an offsetting effect due to an increase in overseas direct purchases resulting from the expansion of telecommuting, among other factors.
Furthermore, these effects may vary based on the severity of COVID-19 cases among countries and governments’ crisis response measures. This can act as a factor affecting international trade, shipping, and air logistics. Notably, ocean freight rates surged due to the spread of COVID-19, and operational efficiency at ports significantly declined [
3]. Government measures are also expected to impact the operation of maritime transport and port authorities.
This study aimed to examine the complexity that emerged in international trade due to COVID-19. We analyzed the Special Administrative Region of Hong Kong and major international trading entities such as Korea, China, Japan, and the US. Specifically, we examined how the number of confirmed cases and government responses in each country affected international trade (exports and imports). Korea was selected as the central country, and the results could be applied to the analysis of other nations.
This study contributes to existing research in several ways. Firstly, the analysis period spans from early 2020 to the end of 2021, constituting a relatively long term compared to existing literature that primarily focused on the early stages of the COVID-19 pandemic. Secondly, the construction of panel data and an appropriate model allows for dynamic analysis. Thirdly, we analyzed the impact of the spread of COVID-19 using country comparisons and evaluated the correlation between confirmed cases among trading countries and government measures. Fourthly, we examined how the influence of variables on trade changes over time.
Analyzing how the spread of COVID-19 differs by import and export trade and by country is critical. This has implications for intergovernmental cooperation among countries to promote trade, such as cooperation in quarantine systems or collaboration in trade, transportation, and logistics systems. Cooperation becomes crucial when unloading at ports and airports is not possible. Additionally, cooperative discussions on the effort required to build a supply chain and improve the logistics system under the impact of international trade between private companies will be possible.
2. Literature Review
Numerous papers have recently been published examining the impact of COVID-19 on trade. Friedt and Zhang [
4], utilizing monthly export data from Chinese provinces, reported that the primary factor contributing to the decline in Chinese imports during the pandemic was the production disruption in countries supplying intermediate goods. Barbero et al. [
5] employed a gravitational trade model, analyzing monthly trade data from 68 countries between January 2019 and October 2020. They revealed that COVID-19 had a more substantial negative impact on bilateral trade in countries that were members of regional trade agreements before the pandemic. Additionally, the negative impact of COVID-19 was significant in relation to indicators of government actions, with exports between high-income countries being the most negatively affected. Büchel et al. [
6] investigated the impact of COVID-19 on international trade in goods using trade data from the Swiss Federal Customs Service for the period between January and July 2020. They observed an 11% decline in Swiss trade compared to 2019 during this period, attributing it to the federal lockdown in mid-March negatively impacting both the supply and demand side of foreign trade. Demir and Javorcik [
7] focused on export transactions backed by letters of credit and documentary collection, finding them to be more resilient to the COVID-19 crisis compared to transactions using open accounts or cash in advance. Vidya and Prabheesh [
8] measured trade interconnection between countries before and after the COVID-19 outbreak, predicting a sharp decline in trade for most economies by December 2020. Li and Lin [
9] established a global general equilibrium for 26 countries using 2018 data as a benchmark and simulated the trade effect of COVID-19. The simulation results indicated a significant impact on trade and exports for all countries. Hayakawa and Mukunoki [
10] estimated the gravitational equation using various variables for COVID-19 damage. Their findings showed a significant negative impact on international trade in both exporting and importing countries. They identified heterogeneous effects across industries, with negative effects on non-essential and durable goods persisting for a long time, while positive effects were observed in the industry providing medical products. Xu et al.’s [
11] study, similar to the present one, investigated the gap in shipping trade between China and three regions (ASEAN, the European Union, and the United States) from February to October 2020. They found that the government’s preventive and control measures against COVID-19 negatively affected export trade while import trade increased. Various studies have also conducted impact analyses on economic aspects [
12,
13,
14], global supply chain disruption, demand decline [
15,
16], stock market returns, and volatility [
17,
18] in the context of the COVID-19 pandemic.
Moreover, studies have delved into the impact of COVID-19 on maritime transport, the primary mode of international trade [
19,
20,
21,
22,
23,
24,
25]. Michail and Melas [
26] specifically linked the outbreak of COVID-19 to dry bulk and dirty tankers in the shipping industry, a derivative of international trade, highlighting the negative effects on the shipping market.
While previous studies have examined the impact of the COVID-19 pandemic on financial markets and supply chains, and some have analyzed trade during the pandemic, this study distinguishes itself by adopting a relatively long-term perspective (2020–2021) and incorporating changes in major trading partners in Asia over time. The focus is on analyzing shifts in trade with Korea’s five largest trading partners: China, the United States, Japan, Vietnam, and Hong Kong. The study aims to unveil the impact of government preventive and control measures on trade, providing insights not only for trading companies but also for logistics and shipping companies in making strategic decisions.
3. Materials and Methods
3.1. Data
In this study, trade statistics relied on import/export data from Korea.
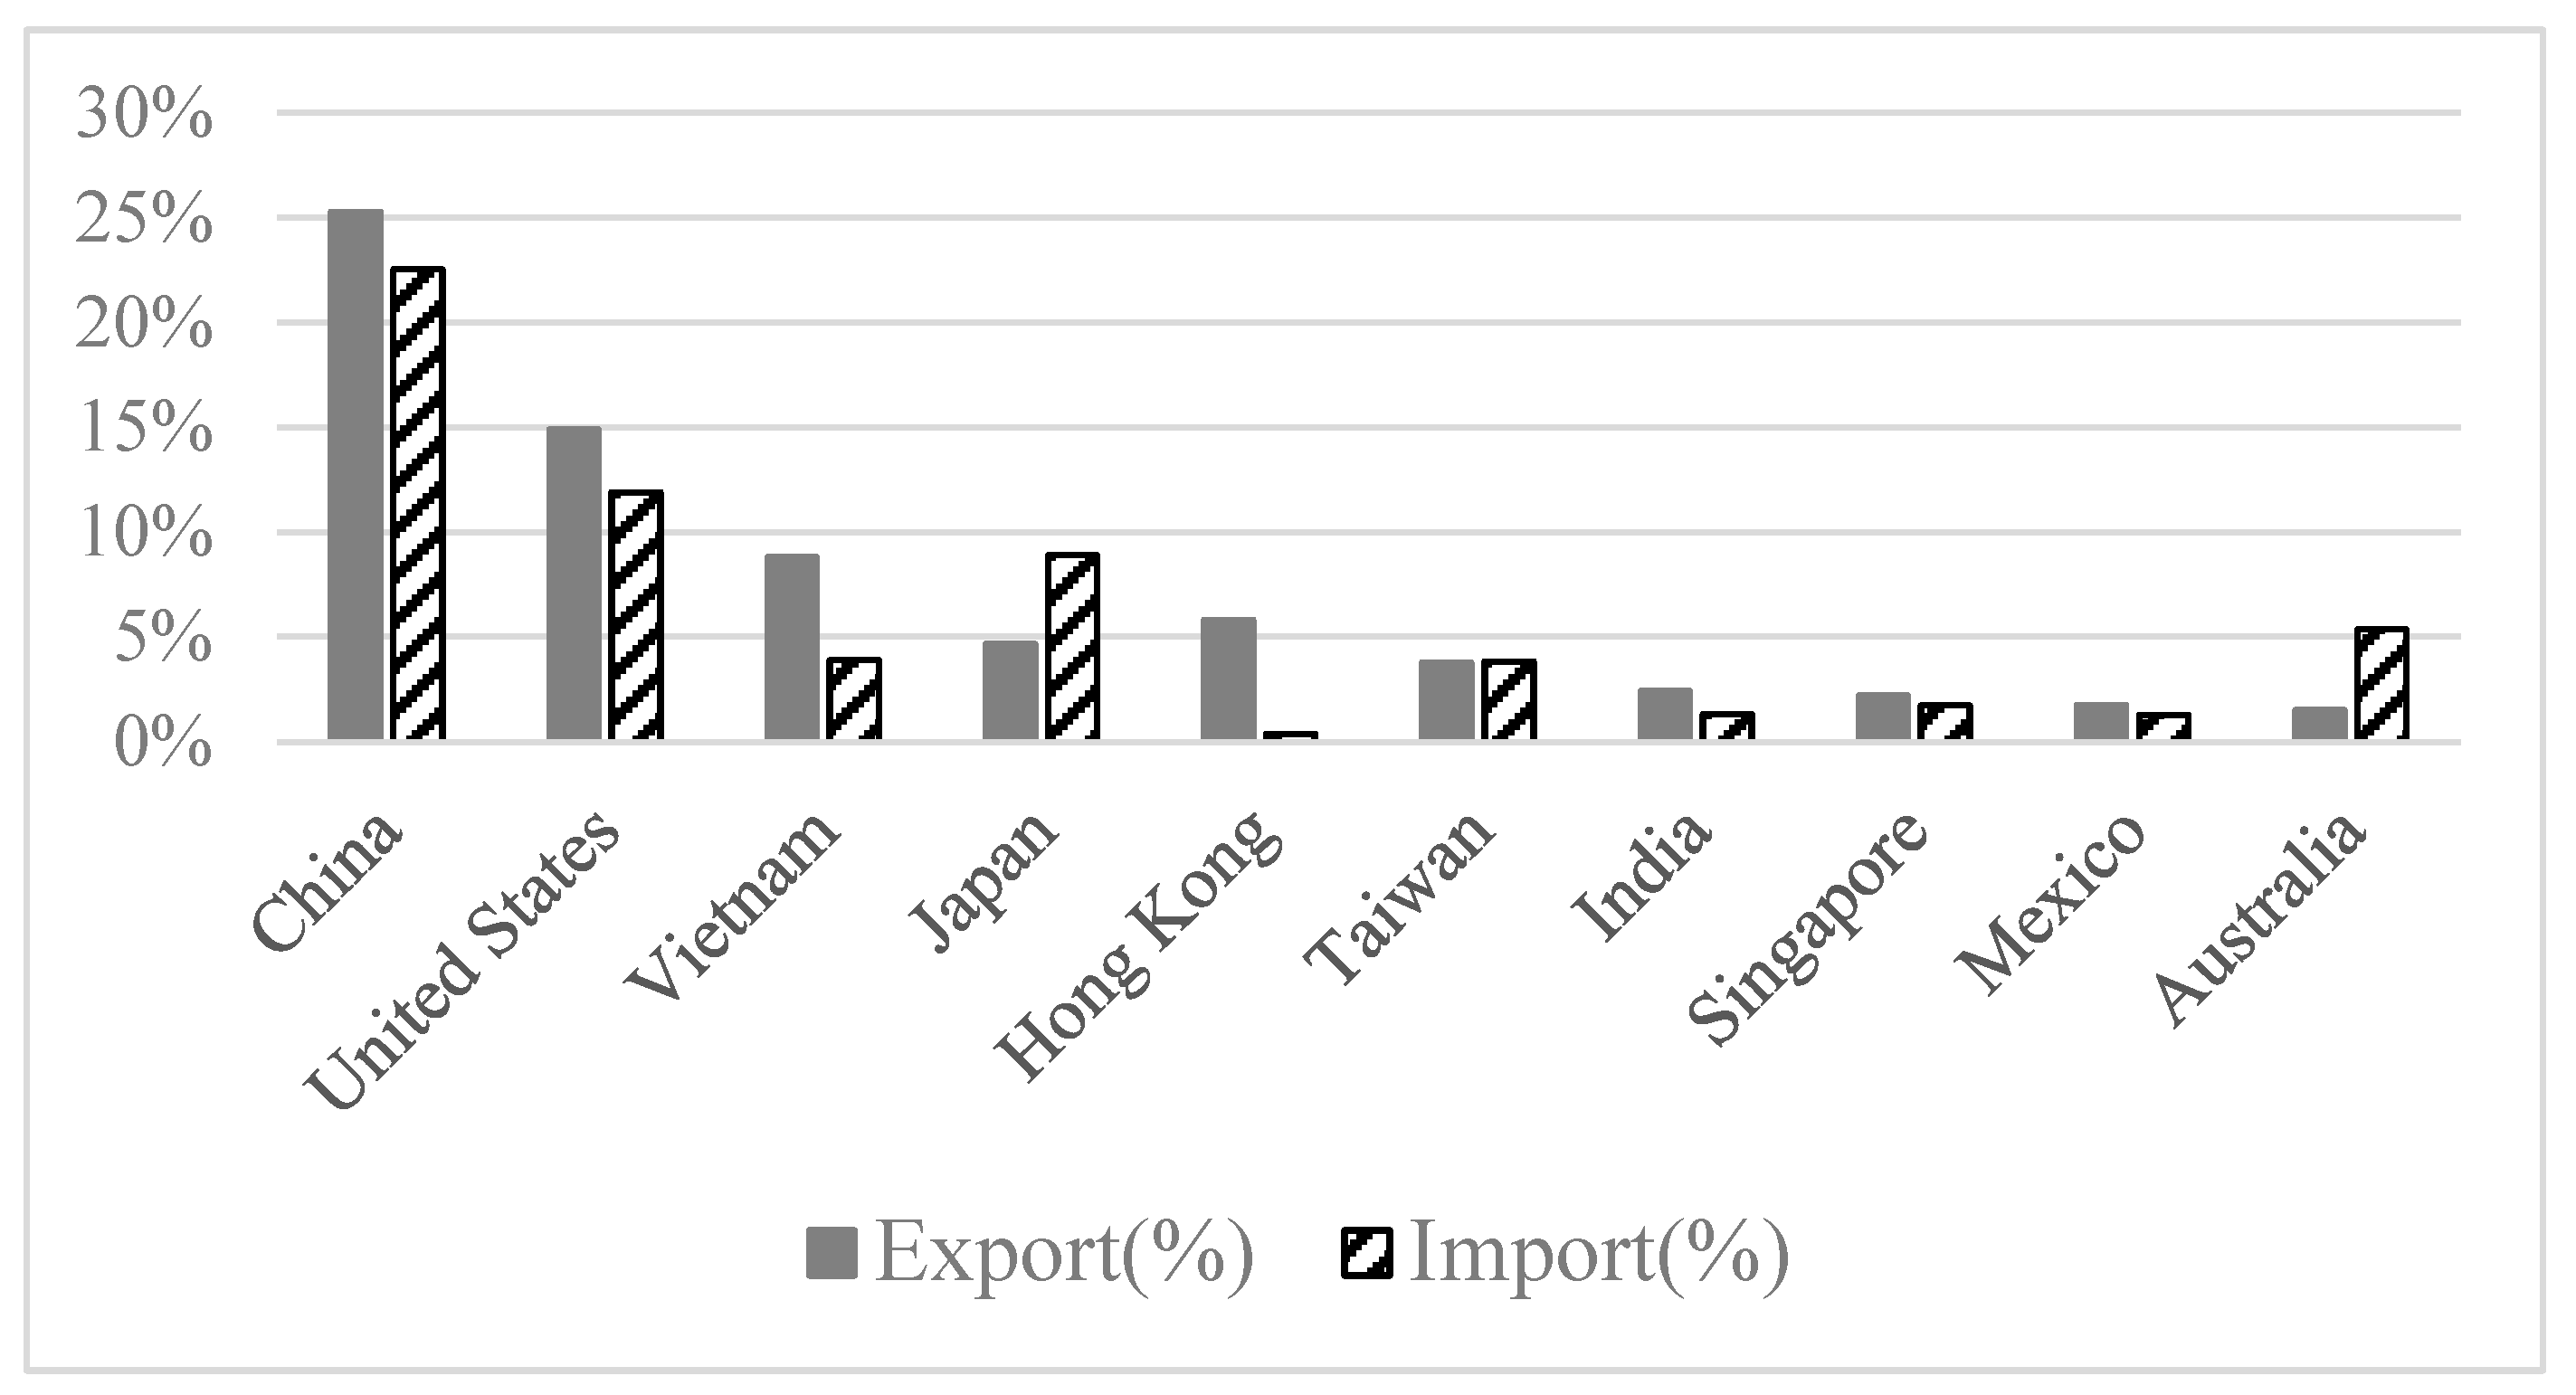
Figure 2 shows share of Korea’s major import and export countries as of the end of 2021 [
27]. As shown in
Figure 2, Korea’s five major exporting countries are China, the U.S., Vietnam, Japan, and Hong Kong, while the major importing countries are China, the U.S., Japan, Australia, and Saudi Arabia. Given Korea’s profile as a nation predominantly importing raw materials and exporting industrial products, exports take precedence in its trade dynamics [
27]. Among the importing nations, Australia primarily imports coal, and Saudi Arabia predominantly imports crude oil, resulting in a trade structure centered around a single cargo [
27]. To comprehensively examine the effects of COVID-19, with a focus on various industrial products, this study centers on exporting countries.
Confirmed COVID-19 cases are anticipated to negatively impact both imports and exports. However, government measures to combat COVID-19 are expected to mitigate this negative impact. The analysis period spans from January 2020 to December 2021. The dependent variables in this study are Korea’s exports (ex) and imports (im) by country. Independent variables include the monthly number of confirmed cases by country (Confirmed Cases; CC), the monthly number of confirmed cases in Korea (Confirmed Cases; koCC), the government response index (GRI), and government response measures in Korea (KoGRI). Cumulative confirmed cases were chosen as an independent variable under the assumption that concerns about the cumulative number of confirmed cases would exert a greater impact on imports and exports than new cases [
28].
To scrutinize how the number of confirmed cases influences imports and exports, the number of confirmed cases in each country was adopted as an independent variable, as seen in previous studies [
4,
11]. The GRI was selected from the COVID-19 Government Response Tracker [
28] database, as it incorporates various indices, such as the containment and health index, stringency index, and economic support index, among others. The GRI provides a comprehensive evaluation of these indices, offering an estimation of the effect on imports and exports that reflects the policy efforts of each country. In essence, this index encompasses the severity of sub-concepts, economic support (income support and debt relief), and other relevant factors [
28].
Descriptive statistics of the variables employed in this study are outlined in
Table 1. Standard errors and means for the sample categories are presented to gauge the variability of the variables. The variables encompass Korea’s import and export data by country, the number of confirmed cases, and government countermeasures (GRI) for each country.
3.2. Methodology
This study utilized Zellner’s [
29] seemingly unrelated regression (SUR) model to assess the heterogeneous characteristics of various import and export countries. The application of the SUR model is an efficient estimator compared to independently estimating the formula for each public transportation method [
30]. For instance, when the SUR model is applied, each model is simultaneously estimated by considering the correlation of error terms for demand models for several products or test performance for various subjects.
If
G represents multiple variables of the
i-th object among N samples set as dependent variables,
G regression models can be developed, and the regression coefficients of each model can be calculated using the ordinary least squares (OLS) method. Alternatively, they can be estimated independently (equation-by-equation OLS). However, if the error terms of the
G regression models are correlated, the SUR model estimator, based on the generalized least squares (GLS) method, is more efficient than the OLS estimator. The application of the SUR model to the
G models also has the advantage of testing cross-equation parameter restrictions on the regression coefficients of the same independent variable included [
29,
31,
32,
33].
In essence, the SUR model extends the application of the GLS estimation method to an equation system with
G-dependent variables. The equation system of the
i-th entity with
G-dependent variables can be expressed as Equation (1) [
31,
33].
where
is the value of the dependent variable of the
g-th model for the
i-th individual,
is the exogenous variables vector of the
g-th model for the
i-th individual, and
is a vector of
1 regression coefficients for
exogenous variables included in the
g-th model.
is the error term for
. In Equation (1), if the error terms included in the
G equations for the
i-th entity are correlated, then
] =
and
j ≠
j’ at the time
. At this time, if the
N × 1 error term vector for each model is defined as
(
j = 1,2, …,
G), then
Therefore, the conditional covariance matrix
Ω of the error term for all exogenous variables
X is expressed using Equation (3).
where Σ denotes a
G ×
G matrix with covariance
as an element,
denotes an
N ×
N identity matrix, and ⊗ denotes the Kronecker product between the two matrices.
Applying the OLS method to the equation system with the stated correlation in the error terms ensures the consistency of the regression coefficients values. However, due to the existence of a correlation between error terms, the SUR estimator based on the GLS method is more efficient. The SUR estimator of the regression coefficient is expressed in Equation (4).
In Equation (3), , , are the same as described previously, and means a dependent variable vector (GN × 1) with N individuals for each G model. The SUR estimator is estimated sequentially after initially estimating the covariance matrix Ω using the residuals obtained through OLS estimation that does not assume a correlation between error terms.
The generalization of the matrix and system of equations models in this study is as follows:
where
represents the import/export(
ei) with country
i in period
t. The countries are China, the United States, Japan, Hong Kong, and Vietnam.
is the number of confirmed cases in country
i in period
t.
is the government response measure in country
i in period
t − 2.
is the number of confirmed cases in Korea in the
t period, and
is the government’s countermeasures in the
t − 2 period. The time lag between the
t − 2 periods is due to countermeasures being implemented immediately after the occurrence of a confirmed case, while the effect on import and export becomes statistically significant after at least two months.
3.3. Unit Root Test and Multicollinearity Test
Unit root tests were conducted on all variables to assess the stability of the data before analysis. The analysis revealed a unit root in the original time series (level data). Consequently, all variables were log-differenced to test for unit roots, resulting in stationary time series for all variables, as presented in
Table 2. The table displays the results of the Augmented Dickey-Fuller (ADF) test, applying a lag of 5 to log-differential variables.
Multicollinearity exists when two or more of the predictors in a regression model are moderately or highly correlated with one another. However, when it exists, it can negatively impact our analysis, thereby limiting our research conclusions. Some of the common methods used for detecting multicollinearity are as follows:
- ▪
The analysis exhibits the signs of multicollinearity—such as estimates of the coefficients vary excessively from model to model.
- ▪
The t-tests for each of the individual slopes are nonsignificant (p > 0.05), but the overall F-test for testing all of the slopes is significant (p < 0.05).
- ▪
The correlations among pairs of predictor variables are large.
However, relying solely on pairwise correlations is limiting, as linear dependence can exist among three or more variables. Many regression analysts use variance inflation factors (VIF) to detect multicollinearity [
34]. The results of the multicollinearity test are presented in
Table 3, where some variables exhibited multicollinearity. Rather than removing these variables, we opted to assess their statistical significance by examining the significance level of the SUR model.
4. Results
4.1. Seemingly Unrelated Regression
In general, the model of this study cannot be estimated using Ordinary Least Squares (OLS) when a relationship exists between error terms. In such cases, the model can be effectively estimated using seemingly unrelated regression (SUR), as advocated by Zellner [
29], as previously mentioned. SUR yields superior results compared to OLS, providing a basis for comparison of the analysis outcomes. The individual equations input into the SUR model are as follows:
,
Here, the initial “ex” in the formula denotes export, and “im” signifies import. “Ch” represents China, “HK” represents Hong Kong, “Jp” represents Japan, “US” represents the United States, “VN” represents Vietnam, “CC” represents Confirmed Cases, and “GRI” represents Government Response Index. For instance, in Equation 6, the dependent variable signifies Korea’s exports to China, where “ChCC” is the confirmed case in China, “ChGRI” is the government action in China, “KoCC” is the confirmed case in Korea, and “KoGRI” is the government action in Korea. represents an error term in the t period.
Estimation using the SUR model demonstrates higher efficiency compared to the OLS model, as noted by Zellner [
29]. The SUR model comprises seemingly unrelated regression equations that are interrelated. It encompasses multiple regression equations, analyzing them while considering the correlation of error terms between these equations. In the realm of world trade, where intricate factors often influence one another, the information in the error term is frequently correlated. The SUR model proves to be a suitable tool for considering such complex factors. The analysis results of the SUR model are presented in
Table 4 and
Table 5.
4.2. Description of Analysis Results
The results revealed that the negative coefficient (β) indicated that the variable primarily affecting exports was the government’s action (GRI). Consequently, Korea’s exports were predominantly influenced by the COVID-19-related measures implemented by the Korean government. Similarly, the negative coefficient (β) indicated that the variable mainly impacting imports was the counterpart government action (Partner_GRI). In essence, trade was primarily shaped by governmental measures in response to the COVID-19 pandemic. Other government measures had a predominant effect on Korea’s exports, while Korea’s government measures primarily influenced Korea’s imports. Additionally, a small coefficient size suggests a minor impact on imports and exports. However, caution is necessary when interpreting variables with non-significant p-values. For instance, Korea’s exports to China (Chex) have a p-value of 0.5750 for China’s government measures (ChGRI-2), indicating no significant effect. Similarly, Korea’s exports to Hong Kong (HKex) show non-significant p-values of 0.4500 for Hong Kong’s government measures (HKGRI-2) and 0.1790 for confirmed cases in Korea (KoCC). On the contrary, Hong Kong’s confirmed cases (HKCC) and Korea’s government measures (KoGRI-2), with p-values of 0.0173 and 0.0581, respectively, are interpreted as having a more substantial impact. Additionally, R-squared, indicating the model’s goodness of fit, varies but generally falls within appropriate values ranging from 0.35 to 0.89.
As shown in
Table 6, a significant characteristic finding is the varied direction of coefficients and levels of statistical significance for each country, with crucial implications for cross-border trade. These results suggest the importance of tailored policies in each country’s trade strategy.
Firstly, Korea’s exports to China were heavily dependent on the number of confirmed cases in Korea and China’s government measures. Exports were also influenced by other countries’ government measures, underscoring the significant impact of these measures on trade with China, Korea’s largest trading partner. Imports from China were affected by the number of confirmed cases in Korea, reflecting the dependence on imports of raw materials, parts, or finished products from Korea.
Secondly, imports from China, Japan, the United States, Vietnam, and Hong Kong were significantly affected by confirmed cases in Korea, likely due to the demand situation in Korea. Particularly, a positive relationship existed between confirmed cases and Korea’s income, reflecting increased purchases of home appliances and overseas goods due to telecommuting.
Thirdly, Korea’s exports were influenced by the government measures of other countries, such as the United States and Vietnam. However, Korea’s government measures had a negative impact on exports, influenced by factors like social distancing leading to business closures and subsequent production setbacks.
Fourthly, among the five major countries (China, Hong Kong, Japan, the United States, and Vietnam), the United States, being non-Asian, was relatively strongly affected compared to others. South Korea’s government measures negatively impacted exports to the United States, while imports from the United States had a positive impact. As previously noted, exports can be considered a situation where the supply chain in Korea faces disruptions, while imports are attributed to the creation of internal demand through government support, leading to increased purchasing power.
4.3. Analysis of Time-Varying Impact: Rolling Regression
Each country exhibited varying effects on imports and exports due to COVID-19. Furthermore, the impact of confirmed cases and government measures related to COVID-19 on import and export trade was expected to differ depending on the evolving time situation. While rolling regression analysis has been utilized in various studies to demonstrate the importance of time change, its application has been lacking in studies related to COVID-19. General regression analysis, assuming long-term average values, lacks the ability to determine changes in estimated coefficients due to structural changes. In contrast, rolling regression analysis allows the examination of long-term statistical changes in estimated coefficients [
35,
36]. A common assumption in time series analysis is that model parameters are time-invariant. However, given the dynamic nature of the economic environment, assessing whether model parameters remain constant over time is a reasonable consideration. Rolling regression, a time series modeling technique frequently employed in finance and economics [
37,
38,
39,
40], was, therefore, applied in this study, combining it with Seemingly Unrelated Regression (SUR) estimation for exports and imports to five countries over time.
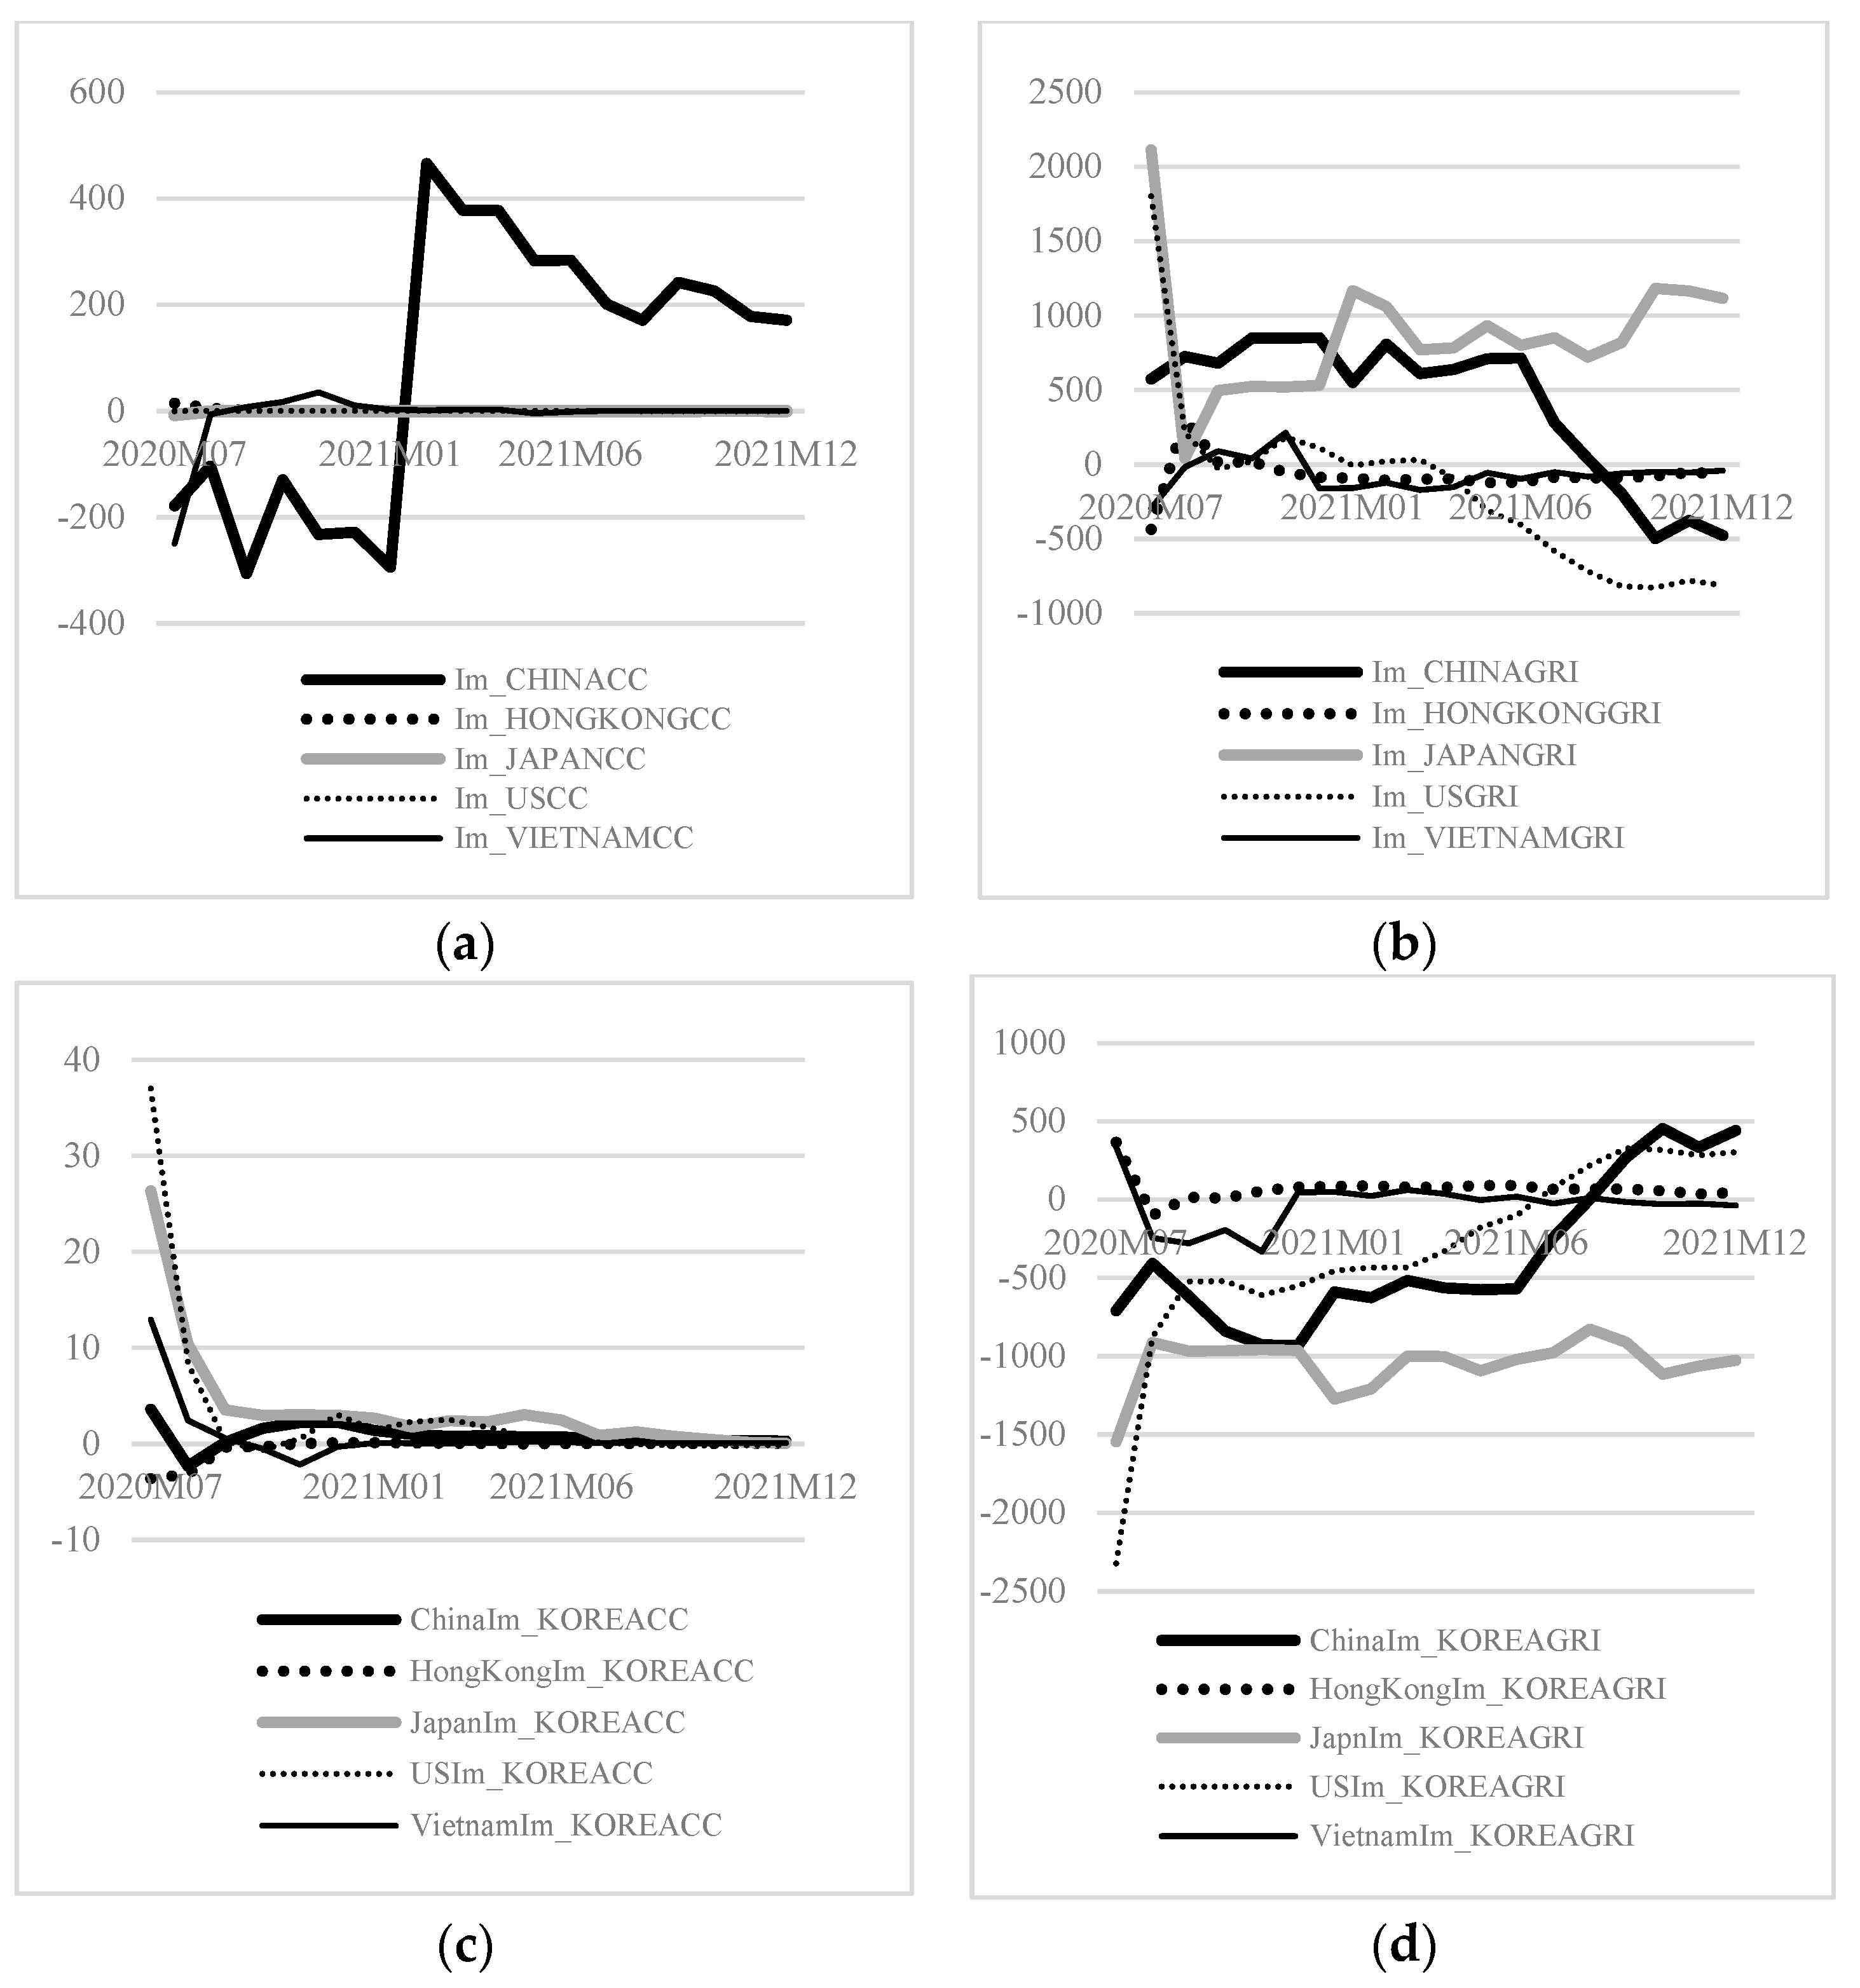
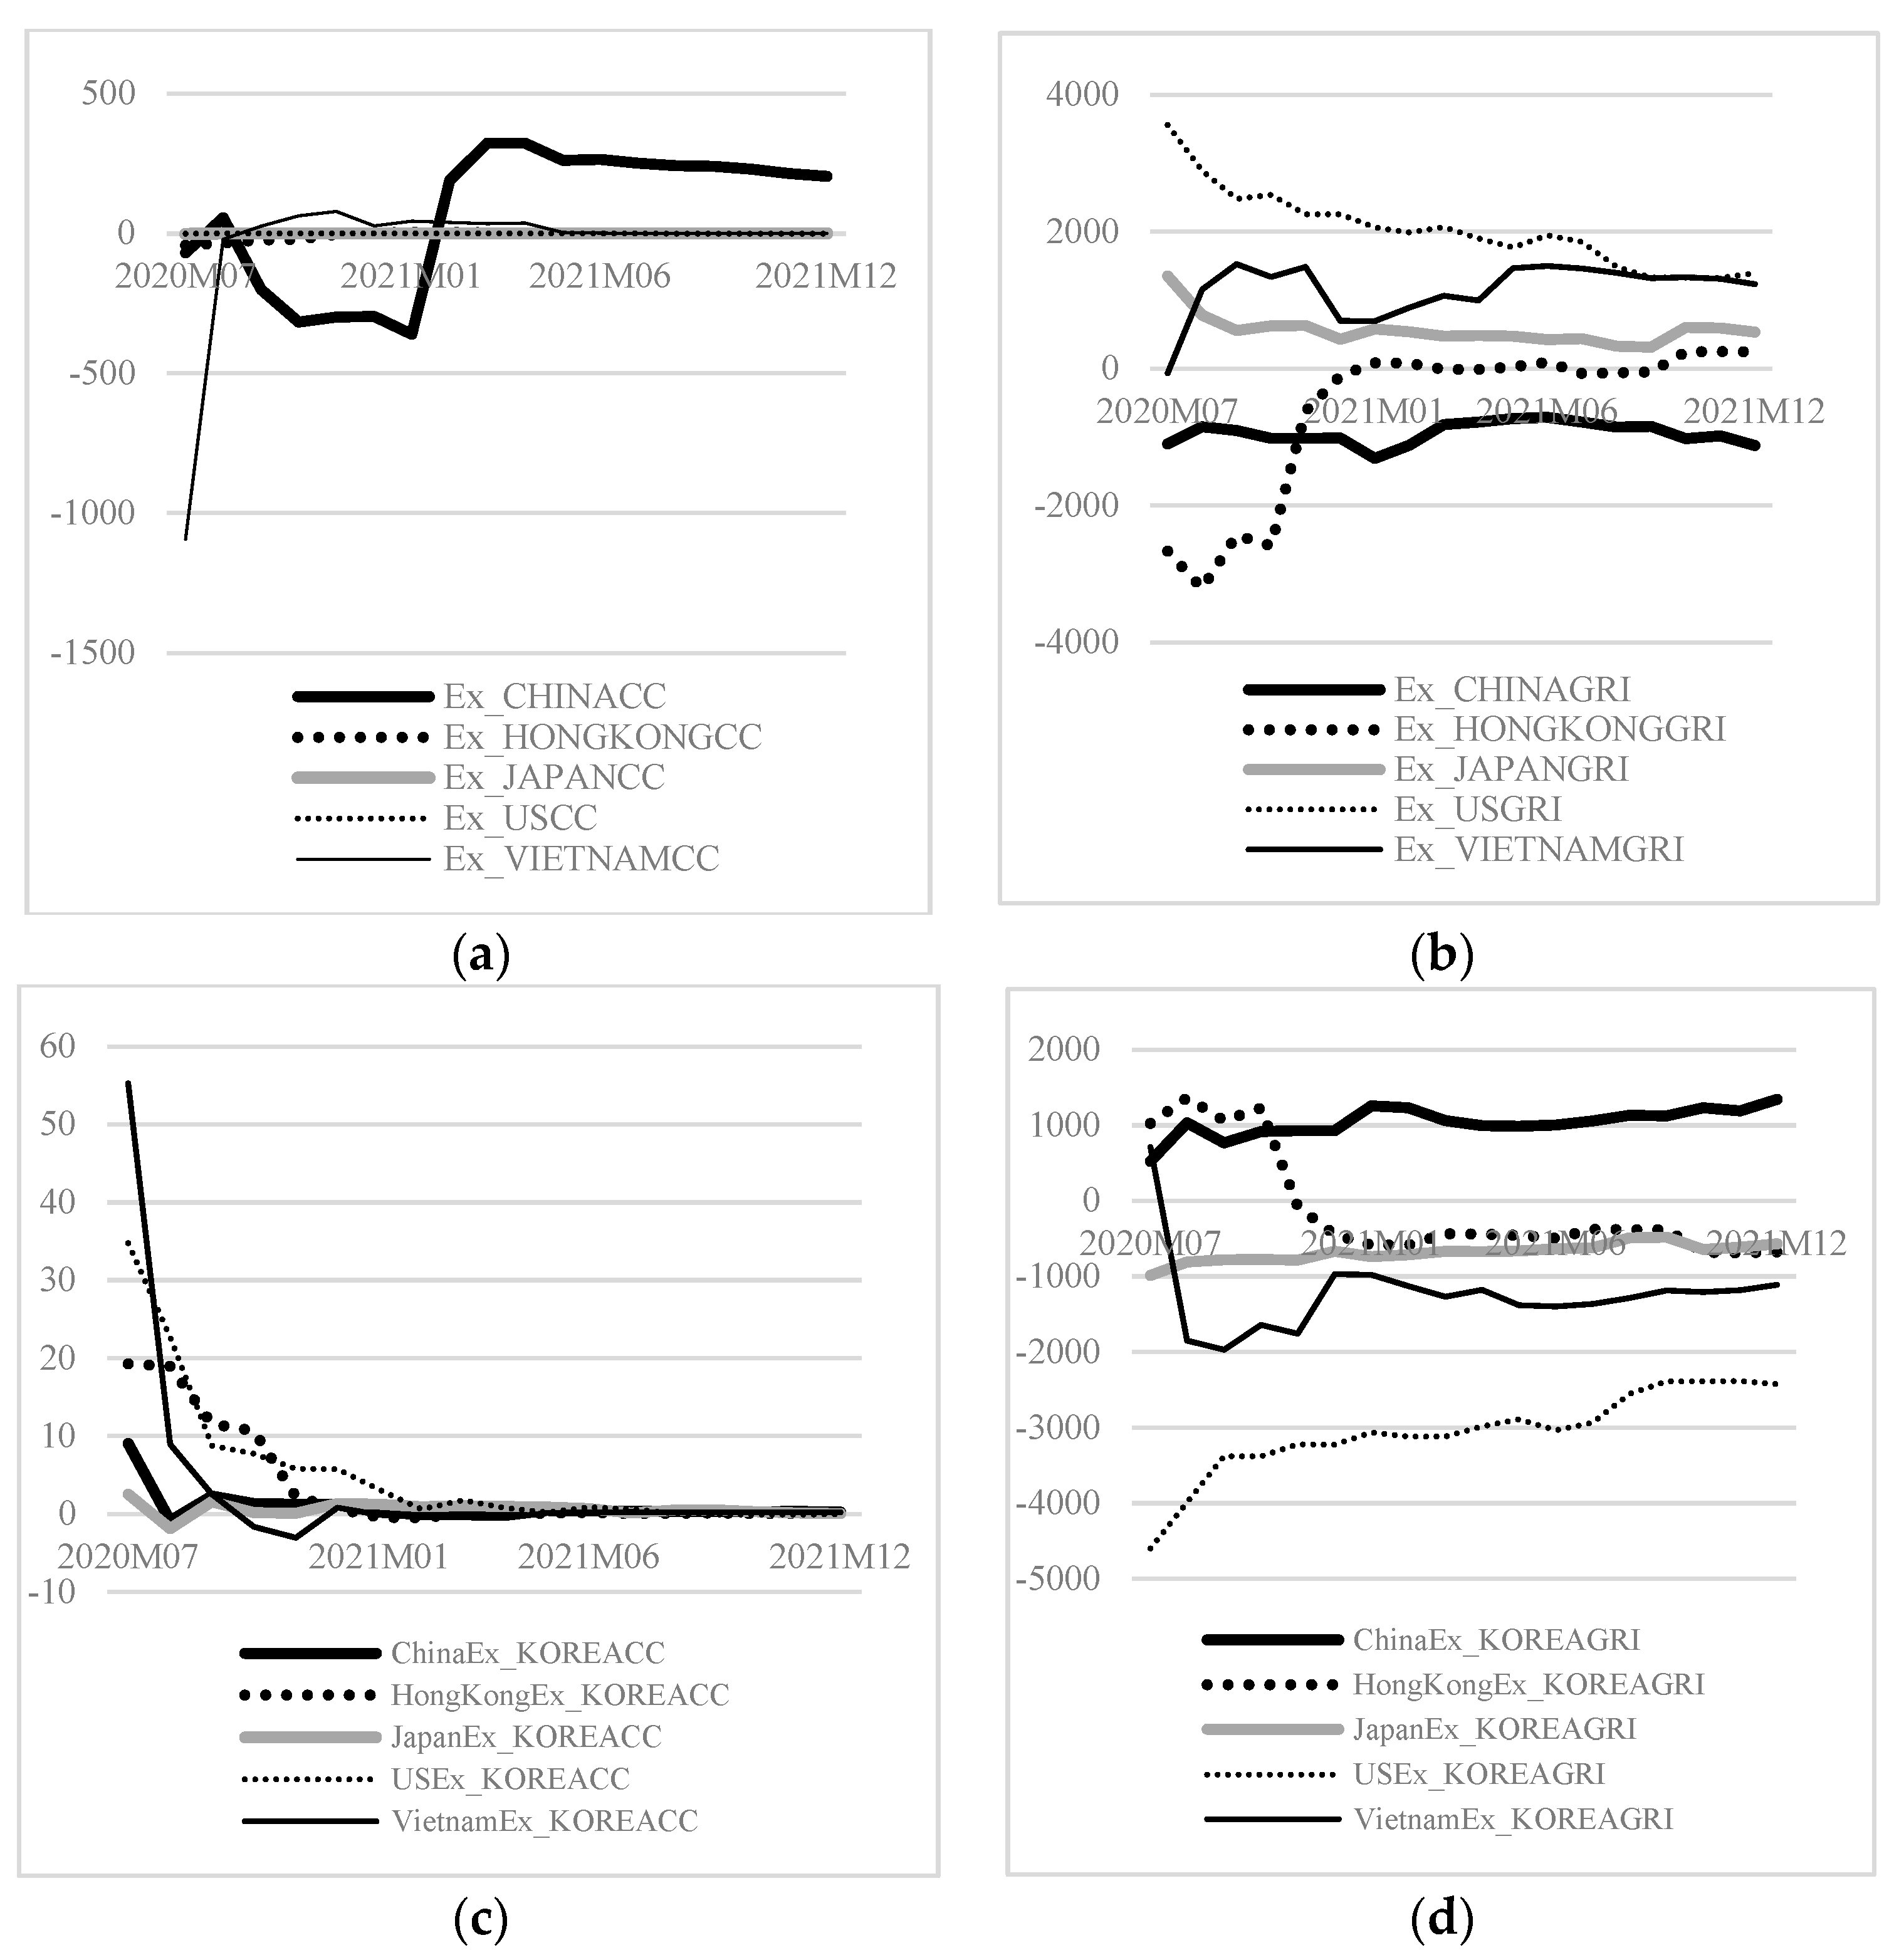
Figure 3 and
Figure 4 illustrate the derived coefficients, with cyclic regression spanning from July 2020 to December 2021. The circular regression coefficient is divided into exports and imports, further stratified into eight cases, each considering the number of confirmed cases and government measures by country, along with the number of confirmed cases and government measures in Korea. The analysis revealed distinct temporal movements in these coefficients across countries.
The rolling regression coefficient for each country’s variable concerning exports demonstrated that most countries did not experience a significant change. However, China exhibited a negative (−) and then a positive (+) coefficient after a certain period, suggesting that while the variable of confirmed cases did not significantly impact Korea’s exports in most countries, China and Vietnam, experiencing an initial shock, displayed country-specific characteristics. The rolling regression coefficient for each country’s government action variable on exports revealed mostly positive (+) coefficients for most countries, with Hong Kong and China showing negative (−) coefficients. Although Hong Kong’s coefficient turned positive over time, most countries displayed a declining trend. The rolling regression coefficient for the Korean confirmed case variable in exports indicated mostly positive (+) coefficients, with a decreasing trend over time for most countries. Finally, the rolling regression coefficient for the Korean government action variable on exports displayed an upward trend, except for Hong Kong, signifying a gradual increase in the positive effect of the Korean government’s actions on Korean exports over time.
Similar results were obtained for imports, where the influence of each variable manifested differently over time for each country. The rolling regression coefficient for each country’s variable regarding imports revealed rapid fluctuations for China, while most countries displayed a certain shape without significant changes over time. The rolling regression coefficient for each country’s government action variable on imports indicated a downward trend for the U.S. and China, whereas other countries exhibited an upward or fine fluctuation. This suggested that over time, Korea’s imports from the United States and China were negatively affected by the respective government actions. The rolling regression coefficients of Korean confirmed cases on imports showed that most countries adopted a mode of easing the impact, with the influence of Korea’s imports on Korean confirmed cases decreasing over time. The rolling regression coefficient for the Korean government action variable on imports indicated an upward trend, signifying that the negative impact of the Korean government’s measures on Korea’s imports from each country decreased over time.
4.4. Examples of Measures Taken by Major Countries and Their Main Impact Related to COVID-19
As depicted in online
Appendix A Table A1, various government measures were implemented in response to COVID-19, affecting trade and supply chains. In Vietnam, stringent quarantine measures in 2021 led to challenges such as workplace and factory operation restrictions, time movement constraints, delays in customs clearance, disruptions in production for global companies entering Vietnam, and damage to the global supply chain, impacting trade [
41]. In Japan, the government’s heightened awareness of a crisis in the global supply chain due to the COVID-19 outbreak led to increased demand for countervailing duties as a countermeasure [
42]. The U.S. manufacturing industry, heavily reliant on Asian imports, faced direct hits. The U.S. government emphasized building a stable supply chain through the “White House 100-Day Supply Chain Report”, strengthening economic interventions to overcome COVID-19 [
43]. China, being the first to recover from COVID-19, continued to expand its trade surplus; however, the analysis revealed that its stringent quarantine policy significantly impacted initial import and export trade [
44].
This study conducted an in-depth analysis of the COVID-19 pandemic’s impact on trade in various countries using the SUR model. From a trade policy perspective, the statistically significant negative effect of exports from Korea to China and the United States due to the government measures of other countries suggests a need for policy cooperation with these two trading partners. Additionally, cooperation with other major trading countries such as Vietnam, Japan, and Hong Kong is deemed crucial for normalizing trade.
5. Conclusions
This study investigated the impact of the COVID-19 pandemic on international trade between 2020 and 2021, utilizing the monthly trade data of five major trading countries and examining the influence of each country’s confirmed COVID-19 cases and government countermeasures.
Initially, while the overall impact of COVID-19 on trade was negative across all countries, variations in trade patterns emerged over the past two years, reflecting differences in confirmed cases trends and government countermeasures. This diverges from prior studies that primarily focused on estimating demand decreases as a consequence.
Furthermore, there is a crucial need for cooperation in quarantine systems and trade policies, especially at ports and airports, border facilities where trade activities occur. Thirdly, understanding the evolving dynamics in major countries over time is essential for effective policy cooperation, as trade collaboration significantly impacts the economies of nations with substantial trade scales. For instance, the strategic initiatives announced by Vietnam and South Korea, such as the “New Southern Policy Plus” and “post-COVID-19 comprehensive healthcare cooperation”, highlight the importance of strengthening cooperation in response to the pandemic. In the case of Japan and the United States, the study suggests potential areas for investment cooperation, considering the increased job demand in certain sectors and disruptions in the semiconductor supply chain. Finally, with China being a crucial market for Korean companies, collaborative negotiations between the two countries are essential to address trade and investment obstacles, especially considering mega Free Trade Agreements.
However, there remains a need for further research. First, a detailed and systematic analysis of the quarantine and trade policies that led to changes in multilateral trade is required. Additionally, a comprehensive evaluation of the effects of bilateral trade is essential. As the COVID-19 pandemic may become endemic [
45], continuous assessment of its impact on trade is necessary. Management implications for various entities, including governments, shipping, ports, airports, and logistics-related companies, should be identified. Second, future research should explore the impact of each country’s trade policies on exports and imports from the perspective of traditional trade theory based on macroeconomics. Finally, considering time series models such as the panel vector error correction model could provide valuable insights in future analyses.
Author Contributions
Conceptualization, T.K. and S.P.; data curation, T.K., H.K. and J.K.; formal analysis, T.K. and S.P.; funding acquisition, S.P.; investigation, T.K. and H.K.; methodology, T.K. and S.P.; project administration, H.K.; software, T.K. and S.P.; supervision, S.P.; validation, T.K.; writing—original draft, T.K. and S.P.; writing—review & editing, T.K., S.P., H.K. and J.K. All authors have read and agreed to the published version of the manuscript.
Funding
This work was supported by a research grant from the Gyeongsang National University in 2023.
Institutional Review Board Statement
Not applicable.
Informed Consent Statement
Not applicable.
Data Availability Statement
Statistical data are provided upon request to the corresponding author.
Conflicts of Interest
The authors declare no conflict of interest.
Appendix A. Estimating the Impact of COVID-19 on International Trade: Cases of Major Countries Using the SUR Model
Table A1.
Cases of government measures and major impacts related to COVID-19.
Table A1.
Cases of government measures and major impacts related to COVID-19.
| Major Countries | Government Measures and Their Main Impacts Related to COVID-19 |
|---|
| Vietnam | Strict quarantine measures created difficulties, such as restrictions on the operation of workplaces and factories, control of gender and time movement, and customs clearance
- (Electrical/Electronics) Temporary business disruption occurred in April 2021 owing to an outbreak of community transmission in the Bac Ninh and Bac Giang industrial complexes in northern Vietnam
- (Automobile parts) In 2021, the global supply of semiconductor chips and quarantine measures related to COVID-19 significantly contracted automobile assembly and production and the domestic market
- (Textiles and Sewing) As a labor-intensive industry, it was severely hit by COVID-19. According to the Vietnam Textile and Apparel Association, as of August 2021, the proportion of companies that completely suspended operations reached 30–35%. Companies also had a utilization rate of less than 20% |
| Japan | In 2021, the Japanese government raised awareness of a crisis in the global supply chain owing to COVID-19, and demand for countervailing duties increased as a countermeasure.
* Countervailing duty: A system recognized by the World Trade Organization (WTO) that imposes tariffs on an amount equivalent to the subsidy on imports subsidized by other governments if it is recognized that they cause harm to the domestic industry
Online shopping use increased to a record high owing to refraining from going out and shortening sales after the declaration of emergency
- The proportion of internet shopping usage per household was more than 50% during the COVID-19 pandemic
The Japanese government has provided subsidy support for Japanese companies moving production bases, such as China to Japan (return) and Southeast Asia, since May 2020. |
| The U.S. | As Asian countries disrupted US exports owing to COVID-19, US manufacturing, which is highly dependent on Asian imports, was directly hit.
* US imports from Asia are 50% semiconductors and 20% automobiles
The US emphasizes building a stable supply chain for four industries: semiconductors, batteries, pharmaceuticals, and rare minerals through the “White House 100-Day Supply Chain Report”
- The report mentions key allies, such as Korea (74 times), Taiwan (84 times), and Japan (85 times)
The proportion of government spending in U.S. GDP was on the decline but rose in 2020, and the government’s economic intervention to overcome COVID-19 was confirmed numerically (12.3%⟶12.8%)
- The US steel industry was hit hard by the COVID-19 pandemic, with both demand and production plummeting in 2020 (as of the second quarter of 2020, the utilization rate is 56%). |
| China | Early stabilization of the COVID-19 pandemic through strict quarantine measures by the government
- Owing to the government's full publicity and encouragement, China expected to achieve 85–90% vaccination coverage by the end of 2021.
- The first to recover from COVID-19 and continue to expand the trade surplus
The main factors were (1) recovery of overseas demand from major countries centered on the United States, (2) supply lines that recovered first from COVID-19, (3) increases in the unit price of export products, etc. |
References
- World Health Organization (2020), Listings of WHO’s Response to COVID-19. Available online: https://www.who.int/news/item/29-06-2020-covidtimeline (accessed on 4 April 2022).
- World Health Organization (n.d.), WHO Coronavirus (COVID-19) Dashboard. Available online: https://covid19.who.int/ (accessed on 4 April 2022).
- Cullinane, K.; Haralambides, H. Global trends in maritime and port economics: The COVID-19 pandemic and beyond. Marit. Econ. Logist. 2021, 23, 369–380. [Google Scholar] [CrossRef]
- Friedt, F.L.; Zhang, K. The triple effect of COVID-19 on Chinese exports: First evidence of the export supply, import demand and GVC contagion effects. Covid Econ. 2020, 53, 72–109. [Google Scholar]
- Barbero, J.; de Lucio, J.J.; Rodríguez-Crespo, E. Effects of COVID-19 on trade flows: Measuring their impact through government policy responses. PLoS ONE 2021, 16, e0258356. [Google Scholar] [CrossRef] [PubMed]
- Büchel, K.; Legge, S.; Pochon, V.; Wegmüller, P. Swiss trade during the COVID-19 pandemic: An early appraisal. Swiss J. Econ. Stat. 2020, 156, 22. [Google Scholar] [CrossRef] [PubMed]
- Demir, B.; Javorcik, B. Trade finance matters: Evidence from the COVID-19 crisis. Oxf. Rev. Econ. Policy 2020, 36 (Suppl. S1), 397–408. [Google Scholar] [CrossRef]
- Vidya, C.T.; Prabheesh, K.P. Implications of COVID-19 pandemic on the global trade networks. Emerg. Mark. Financ. Trade 2020, 56, 2408–2421. [Google Scholar] [CrossRef]
- Li, C.; Lin, X. COVID-19, and trade: Simulated asymmetric loss. J. Asian Econ. 2021, 75, 101327. [Google Scholar] [CrossRef]
- Hayakawa, K.; Mukunoki, H. The impact of COVID-19 on international trade: Evidence from the first shock. J. Jpn. Int. Econ. 2021, 60, 101135. [Google Scholar] [CrossRef]
- Xu, L.; Shi, J.; Chen, J.; Li, L. Estimating the effect of COVID-19 epidemic on shipping trade: An empirical analysis using panel data. Mar. Policy 2021, 133, 104768. [Google Scholar] [CrossRef]
- Daly, J.; Chuenpagdee, R. Community responses to international trade policy: A Newfoundland case study. Ocean Coast. Manag. 2021, 206, 105578. [Google Scholar] [CrossRef]
- Padhan, R.; Prabheesh, K.P. The economics of COVID-19 epidemic: A survey. Econ. Anal. Policy 2021, 70, 220–237. [Google Scholar] [CrossRef] [PubMed]
- Susskind, D.; Vines, D. The economics of the COVID-19 pandemic: An assessment. Oxf. Rev. Econ. Policy 2020, 36 (Suppl. S1), S1–S13. [Google Scholar] [CrossRef]
- Ivanov, D. Predicting the impacts of epidemic outbreaks on global supply chains: A simulation based analysis on the Coronavirus outbreak (COVID-19/SARS-CoV-2) case. Transp. Res. E Logist. Transp. Rev. 2020, 136, 101922. [Google Scholar] [CrossRef] [PubMed]
- McKibbin, W.; Fernando, R. The global macroeconomic impacts of COVID-19: Seven scenarios. Asian Econ. Pap. 2021, 20, 1–30. [Google Scholar] [CrossRef]
- Ashraf, B.N. Stock markets’ reaction to COVID-19: Cases or fatalities? Res. Int. Bus. Finance 2020, 54, 101249. [Google Scholar] [CrossRef]
- Baker, S.R.; Bloom, N.; Davis, S.J.; Kost, K.; Sammon, M.; Viratyosin, T. The unprecedented stock market reaction to COVID-19. Rev. Asset Pricing Stud. 2020, 10, 742–758. [Google Scholar] [CrossRef]
- Fei, Y.; Chen, J.; Wan, Z.; Shu, Y.; Xu, L.; Li, H.; Bai, Y.; Zheng, T. Crude oil maritime transportation: Market fluctuation characteristics and the impact of critical events. Energy Rep. 2020, 6, 518–529. [Google Scholar] [CrossRef]
- De Oliveira, D.D.; Rojas, E.G.; dos Santos Fernandez, M.A. Should TBT continue to be considered an issue in dredging port areas? A brief review of the global evidence. Ocean Coast. Manag. 2020, 197, 105303. [Google Scholar] [CrossRef]
- Jindřichovská, I.; Uğurlu, E. EU and China Trends in Trade in Challenging Times. J. Risk Financ. Manag. 2021, 14, 71. [Google Scholar] [CrossRef]
- Ugurlu, E.; Jindřichovská, I. Effect of COVID-19 on International Trade among the Visegrad Countries. J. Risk Financ. Manag. 2022, 15, 41. [Google Scholar] [CrossRef]
- Abrhám, J.; Vošta, M. Impact of the COVID-19 Pandemic on EU Convergence. J. Risk Financ. Manag. 2022, 15, 384. [Google Scholar] [CrossRef]
- Tudorache, A.T.; Nicolescu, L. Insights about the Effects of COVID-19 on International Trade during the Main Pandemic Years in Romania and Poland. Sustainability 2023, 15, 8726. [Google Scholar] [CrossRef]
- Erokhin, V.; Gao, T. Impacts of COVID-19 on trade and economic aspects of food security: Evidence from 45 developing countries. Int. J. Environ. Res. Public Health 2020, 17, 5775. [Google Scholar] [CrossRef] [PubMed]
- Michail, N.A.; Melas, K.D. Shipping markets in turmoil: An analysis of the COVID-19 outbreak and its implication. Transp. Res. Interdiscip. Perspect. 2020, 7, 100178. [Google Scholar] [CrossRef]
- Korea International Trade Association (2022), 5 Major Trading Countries. Available online: https://stat.kita.net/stat/kts/ctr/CtrTotalImpExpList.screen (accessed on 6 April 2022).
- Blavatnik School of Government and University of Oxford (n.d.), COVID-19 Government Response Tracker. Available online: https://covidtracker.bsg.ox.ac.uk/ (accessed on 6 April 2022).
- Zellner, A. An efficient method of estimating seemingly unrelated regressions and tests for aggregation bias. J. Am. Stat. Assoc. 1962, 57, 348–368. [Google Scholar] [CrossRef]
- Baum, C.F. An Introduction to Modern Econometrics Using Stata; Stata Press: College Station, TX, USA, 2006. [Google Scholar]
- Cameron, A.C.; Trivedi, P.K. Microeconometrics: Methods and Applications; Cambridge University Press: New York, NY, USA, 2005. [Google Scholar]
- Greene, W.H. Econometric Analysis, 5th ed.; Prentice Hall: Saddle River, NJ, USA, 2001. [Google Scholar]
- Shin, K.; Choi, K. Analyzing the relationship between precipitation and transit ridership through a seemingly unrelated regression model. J. Korean Soc. Transp. 2014, 32, 83–92. [Google Scholar]
- PennState Eberly College of Science, Detecting Multicollinearity Using Variance Inflation Factors. Available online: https://online.stat.psu.edu/stat462/node/180/ (accessed on 28 October 2023).
- Śmiech, S.; Papież, M. In search of hedges and safe havens: Revisiting the relations between gold and oil in the rolling regression framework. Finance Res. Lett. 2017, 20, 238–244. [Google Scholar] [CrossRef]
- Zanin, L.; Marra, G. Rolling regression versus time-varying coefficient modelling: An empirical investigation of the Okun’s law in some Euro area countries. Bull. Econ. Res. 2012, 64, 91–108. [Google Scholar] [CrossRef]
- Chen, L.; Da, Z.; Priestley, R. Dividend smoothing and predictability. Management science. 2012, 58, 1834–1853. [Google Scholar] [CrossRef]
- Dunis, C.L.; Laws, J.; Na, P. (Eds.) Applied Quantitative Methods for Trading and Investment; John Wiley & Sons.: Hoboken, NJ, USA, 2004. [Google Scholar]
- Fabozzi, F.J.; Markowitz, H.M. Equity Valuation and Portfolio Management; John Wiley & Sons: Hoboken, NJ, USA, 2011; Volume 199. [Google Scholar]
- Laws, J.; Thompson, J. Hedging effectiveness of stock index futures. European J. Oper. Res. 2005, 163, 177–191. [Google Scholar] [CrossRef]
- Korea Trade-Investment Promotion Agency (2022). 2022 Vietnam Entry Strategy, KOTRA Data 21-225. Available online: https://dream.kotra.or.kr/kotranews/cms/news/actionKotraBoardDetail.do?SITE_NO=3&MENU_ID=250&CONTENTS_NO=1&bbsGbn=252&bbsSn=252&pNttSn=192943 (accessed on 30 July 2023).
- Korea Trade-Investment Promotion Agency (2022). 2022 Japanese Entry Strategy, KOTRA Data 21-209. Available online: http://openknowledge.kotra.or.kr/handle/2014.oak/28353 (accessed on 30 July 2023).
- Korea Trade-Investment Promotion Agency (2022). 2022 U.S. Entry Strategy, KOTRA Data 21-234. Available online: http://openknowledge.kotra.or.kr/handle/2014.oak/28380 (accessed on 30 July 2023).
- Korea Trade-Investment Promotion Agency (2022). 2022 Chinese Entry Strategy, KOTRA Data 21-207. Available online: http://openknowledge.kotra.or.kr/handle/2014.oak/29204 (accessed on 30 July 2023).
- Murray, C.J.L. COVID-19 will continue but the end of the pandemic is near. Lancet 2022, 399, 417–419. [Google Scholar] [CrossRef] [PubMed]
| Disclaimer/Publisher’s Note: The statements, opinions and data contained in all publications are solely those of the individual author(s) and contributor(s) and not of MDPI and/or the editor(s). MDPI and/or the editor(s) disclaim responsibility for any injury to people or property resulting from any ideas, methods, instructions or products referred to in the content. |
© 2023 by the authors. Licensee MDPI, Basel, Switzerland. This article is an open access article distributed under the terms and conditions of the Creative Commons Attribution (CC BY) license (https://creativecommons.org/licenses/by/4.0/).


