Article

Evaluation of a Combined Approach for Sulfate and Ammonia Recovery from Treated Brine Using a Simultaneous Chemical Precipitation and Electrocoagulation Processes

by
Ameera F. Mohammad
1,*,
Sabeera Haris
1,2,
Aya A-H. Mourad
3,
Ali H. Al-Marzouqi
1,*,
Muftah H. El-Naas
4,
Bart Van der Bruggen
2 and
Mohamed H. Al-Marzouqi
1
1
College of Engineering, UAE University, Al Ain P.O. Box 15551, United Arab Emirates
2
Department of Chemical Engineering, KU Leuven, 3001 Leuven, Belgium
3
Academic Support Department, Abu Dhabi Polytechnic, Institute of Applied Technology, Abu Dhabi 111499, United Arab Emirates
4
Gas Processing Center, College of Engineering, Qatar University, Doha 2713, Qatar
*
Authors to whom correspondence should be addressed.
Sustainability 2023, 15(23), 16534; https://doi.org/10.3390/su152316534
Submission received: 20 September 2023 / Revised: 14 November 2023 / Accepted: 29 November 2023 / Published: 4 December 2023

Abstract

:
Soda ash (Na2CO3) is produced using the traditional Solvay process. It entails the reaction of CO2 with high-salinity water in the presence of ammonia (NH3), which produces insoluble sodium bicarbonate (NaHCO3) and soluble ammonium chloride (NH4Cl). In the current work, a newly combined approach has been developed to effectively manage the removal of ammonia and sulfate from the effluent of the Solvay process. The devised technique centers on an electrochemical coagulation process, complemented with the utilization of calcium oxide (CaO) as a buffering reagent. This innovative approach excels at achieving high recovery rates for both ammonia and sulfate. The recovered ammonia holds the potential for recycling, thereby contributing to the sustainability of the Solvay process by reusing ammonia in its initial stages. Furthermore, sulfate ions are recuperated in the form of calcium sulfate, a value-added product boasting various industrial applications. The results gleaned from this study underscore the efficacy of the ammonia recovery process, particularly when operating at elevated current densities and with higher calcium oxide concentrations. On the other hand, sulfate recovery demonstrates superior performance when exposed to moderate current densities and limited calcium oxide concentrations. Consequently, the integration of both stages within a single, cohesive process necessitates the development of an optimization methodology to cater to varying operational conditions. To address this need, second-order polynomial equations were formulated and employed to anticipate ammonia and sulfate removal rates in the integrated approach. Four independent variables come into play: calcium oxide concentration, current density, temperature, and mixing rate. The findings reveal that most of these variables exert substantial influences on both ammonia and sulfate removal rates, underscoring the need for careful consideration and fine-tuning to optimize the overall process. The maximum ammonia and sulfate removal were found to reach 99.50% and 96.03%, respectively, at a calcium oxide concentration of 3.5 g/100 mL, a current density of 19.95 mA/cm2, a temperature of 35 °C, and a mixing rate of 0.76 R/s. The results are promising, and the developed process is also suitable for recovering high concentrations of sulfate and ammonia from various wastewater sources.

1. Introduction

In the Solvay method, sodium bicarbonate (NaHCO3) is generated by passing carbon dioxide (CO2) through a high-salinity water and ammonia solution [1,2,3,4]. Ammonia (NH3) is used as a buffering agent in the solution and is not consumed as a reactant. Equation (1) illustrates the overall reaction of the ammonia-based Solvay process. The presence of ammonia is considered a principal disadvantage of the Solvay process. It has a major environmental and health threat impact. Furthermore, the recovery process of the NH3 adds to the overall cost of the process.
NaCl + NH3 + CO2 + H2O ↔ NaHCO3 + NH4Cl
Numerous methods have been applied to extract ammonia (NH3) from water sources, each with its own set of limitations, such as suboptimal removal efficiency and high energy demands [1,3]. Techniques such as membrane distillation, breakpoint chlorination, biological aerated filters, ion exchange, stripping, and chemical precipitation are among the commonly employed methods to eliminate various concentrations of ammonia from different types of water [1,5,6,7,8,9]. Membrane distillation (MD) stands out as a prevalent technology for recovering ammonia from seawater desalination and wastewater treatment [10]. An approach involving sweep gas membrane distillation was employed by Li et al. [11] to successfully retrieve high concentrations of ammonia from wastewater, resulting in an impressive 85.00% recovery rate. However, it is noteworthy that the considerable maintenance costs associated with membrane use can impede overall process efficiency [12,13]. Mugwili et al. [5] explored an integrated approach, combining struvite crystallization and breakpoint chlorination, to attain a remarkable 99.96% removal of ammonia from an initial concentration of 6.51 mg/L. It was recommended to substitute breakpoint chlorination with powdered activated carbon in the final treatment stage due to the production of undesirable toxic chlorine by-products. Another study identified that a combination of ion exchange and air stripping methods, utilizing sodium hydroxide (NaOH) for zeolite regeneration, could achieve ammonia removal rates of up to 94.40% [14]. Yet, the regeneration of zeolites remains a challenge, contributing to the overall process cost. Recovering ammonia from Solvay process effluent poses a particularly arduous task due to its high energy demand. Conventionally, NH4Cl was retrieved by heating the solution with calcium hydroxide (Ca(OH)2) at temperatures ranging from 160 °C to 230 °C, as outlined in Equation (2) [1,15]. The liberated ammonia gas is subsequently recycled and reintroduced in the initial stage of the Solvay process following Equation (1).
2NH4Cl + Ca(OH)2 → 2NH3(g) + 2H2O + CaCl2
Recently, Mohammad and colleagues [1] introduced an innovative approach for ammonia recovery, specifically addressing the treatment of high-salinity brine as described in Reaction (1). Notably, their method combines electrocoagulation and chemical dissociation into a single-step process, conducted at moderate temperatures ranging from 23 °C to 43 °C, which represents a significant departure from conventional heating techniques.
In their procedure, the treated brine is blended with calcium oxide (CaO) to elevate the pH to approximately 12. Subsequently, the mixture undergoes a closed electrocoagulation process within a specialized cell, employing a current density in the range of 5–15 mA/cm2 to enhance the dissociation of ammonia from the solution. The outcomes of this novel approach have demonstrated an impressive ammonia recovery rate of 99.00%. This development offers a promising alternative that overcomes the limitations of traditional heating-based methods. This method yields significant economic advantages in the recovery of ammonia and the reduction in energy requirements. This process, conducted at moderate temperatures, exhibits the potential to achieve an 80% reduction in energy consumption, lowering it from 7.8 to 2.3 kWh/kg NH3, as compared to conventional processes that necessitate the heating of Solvay effluents to temperatures within the range of 160–230 °C. In addition to the presence of ammonia (NH3), the occurrence of sulfate in the form of sulfate ions (SO42−) within the reject brine constitutes an additional concern. The sulfate concentration in desalination reject brine typically ranges from 4000 to 7000 mg/L [2,3]. It is critical to recognize that a sulfate concentration exceeding 600 mg/L in discharged water has a detrimental impact on aquatic ecosystems. Consequently, it is imperative to implement treatment processes that effectively remove sulfate from discharge water. Industrial discharges, in particular, should adhere to a sulfate concentration limit of 500 mg/L [16]. Several techniques have been proposed for sulfate removal, encompassing adsorption, ion exchange, nanofiltration, reverse osmosis, electrodialysis, biological treatment, and chemical precipitation [17,18]. However, each of these approaches exhibits certain limitations. For example, chemical precipitation, while cost-effective, operates slowly and generates a significant volume of waste [18,19,20]. Ion exchange raises economic concerns, particularly regarding resin regeneration and associated costs [18,19,20,21]. Reverse osmosis encounters membrane scaling and fouling issues, in addition to being an energy-intensive process [22]. Biological methods offer a more cost-effective and environmentally friendly alternative but suffer from slow kinetics and susceptibility to environmental conditions, limiting their applicability [23,24]. Chibani and colleagues [25] explored sulfate ion removal through the electrocoagulation process in aqueous solutions. Under optimal conditions, including a current density of 10 mA/cm2, a pH value of 5, and an electrolysis time of 60 min, they achieved a remarkable sulfate removal efficiency of 98.76%. Furthermore, these same conditions resulted in a 60.00% reduction in sulfate concentration in seawater. Huang et al. [26] employed a single-chamber bioelectrochemical system to investigate sulfate removal from seawater with an initial concentration of 2200 ± 200 mg/L under a current density of 3.4 ± 0.1 A/m3. The outcomes revealed a reduction in sulfate concentration to 498 ± 25 mg/L. Another study [27] utilized a strong base ion exchange resin, Amberlite IRA-400, to eliminate sulfate ions from flotation process water. The results demonstrated that IRA-400 effectively removed 60.00% of sulfate from synthetic process water containing 1500 mg/L sulfate. Tang et al. [28] examined sulfate recovery from municipal nanofiltration concentrate through a two-step ion exchange membrane electrolysis process, involving anion exchange membrane electrolysis followed by cation exchange membrane electrolysis. This approach led to a reduction in sulfate anion concentration by 43.10%. Nevertheless, the application of this method is constrained by its limited sulfate removal percentage. In yet another study [29], the electrocoagulation technique with iron electrodes was applied to eliminate sulfate ions from mining water. The results indicated the effectiveness of the electrocoagulation process, which removed over 80.00% of sulfate ions and 100.0% of nitrates. Teng et al. [30] investigated the removal of silicon from oilfield wastewater using an eco-friendly electrocoagulation process. The silicon content was found to be reduced from 81.51 mg/L to 21.88 mg/L under optimal conditions of a pH of 6, a reaction time of 20 min, a current density of 27 mA/cm2, and a temperature of 35 °C. The application of lime is a cost-effective technique that has been used to precipitate the sulfates from contaminated water [18]. However, the low removal efficiency is still a major limitation due to the high solubility of precipitation products such as gypsum [18,31]. The associated reactions of the common sulfate recovery process as gypsum (CaSO4) from water using calcium hydroxide are shown with Equations (3) and (4) [18].
CaO + H2O → Ca(OH)2
Ca(OH)2 + Na2SO4 → CaSO4 + 2NaOH
Khorasanipour and colleagues [31] conducted a study on lime treatment applied to contaminated water, characterized by an initial sulfate concentration ranging from 2000 to 3000 mg/L. Through lime treatment, a significant reduction in sulfate concentration was achieved, with values decreasing to 800–900 mg/L as reported. Nariyan and co-researchers [32] explored the combined use of chemical precipitation with lime treatment and electrocoagulation for sulfate removal from Finnish mine water. Their efforts resulted in a substantial decrease in sulfate concentration, dropping from 13,000 mg/L to 250 mg/L, all while operating at a current density of 25 mA/cm2. The findings underscore the high effectiveness of this hybrid approach, although there is room for optimizing electricity consumption to enhance its practicality. Lee et al. [33] examined an electrodialysis approach for the production of demineralized feed and ammonium sulfate from fermentation effluent waste, with a focus on mitigating membrane fouling using pulsed electric fields. Their study demonstrates the promising potential of pulsed electric fields as an effective fouling mitigation technique. Another study [34] investigated the separation of ammonia and sulfate from the remaining organics in the wastewater using two methods, which are ultrafiltration and electrodialysis. Their findings indicated that electrodialysis exhibited greater selectivity and the ability to efficiently regenerate sulfuric acid and ammonium hydroxide solutions while demonstrating minimal sugar or color migration across the ion-exchange membranes.
In light of the existing body of literature, it becomes evident that many conventional methods employed for the removal of ammonia and sulfate exhibit noteworthy limitations, characterized by low removal efficiencies and demanding energy requirements. These constraints may impose significant hindrances when contemplating their application on a larger, industrial scale. Recognizing the strengths of individual technologies and addressing their inherent weaknesses, our study endeavors to synergize and enhance performance. Our approach involves a gradual amalgamation of two distinct processes: sulfate chemical precipitation and ammonia stripping, both conducted within a closed electrocoagulation cell where calcium oxide (CaO) is present and aluminum electrodes are employed. This amalgamation replaces the use of separate or sequential treatment methods [2,3]. What sets our research apart is its novelty, as it marks the inaugural instance of combining the removal of sulfate and ammonia ions within a single integrated process. The primary objectives underpinning this research are twofold. Firstly, we aim to develop a more effective and economically viable technological solution. Secondly, we endeavor to optimize the proposed process. This optimization is pursued by thoroughly investigating the impact of various operational parameters, encompassing calcium oxide concentration, current density, temperature, and mixing rate, on the percentage removal of both sulfate and ammonia from the effluent brine originating from the Solvay process. Our study seeks to bridge the gap between the limitations of conventional methods by crafting a novel, integrated solution for the removal of these two significant ions.

2. Materials and Methods

2.1. Materials

Calcium oxide (CaO) with a purity of >99.00% was purchased from EuroLab Chemicals, Belgium. Air gas cylinders were obtained from the Abu Dhabi Oxygen Company, United Arab Emirates (UAE). The brine effluent from the Solvay process was collected from the UAE University Laboratory. The concentrations of sulfate and ammonia in the Solvay effluent were 6051 ppm and 13,700 mg/L N, respectively. The sulfate analysis was conducted using the SulfaVer 4 Method (10248) using a Hach spectrophotometer (Hach-Lange DR5000). The reduction in the ammonia concentration was measured using a HACH-Intellical™ ISENH3181 ammonia ion-selective electrode, Loveland, Colorado; as for the nitrogen (N) concentration, it could easily be referred to as the NH4OH, NH4Cl, or NH4HCO3 concentration [2,3]. Ammonia ionic strength adjustor (ISA) powder was used as a regent, which was added to the tested sample.

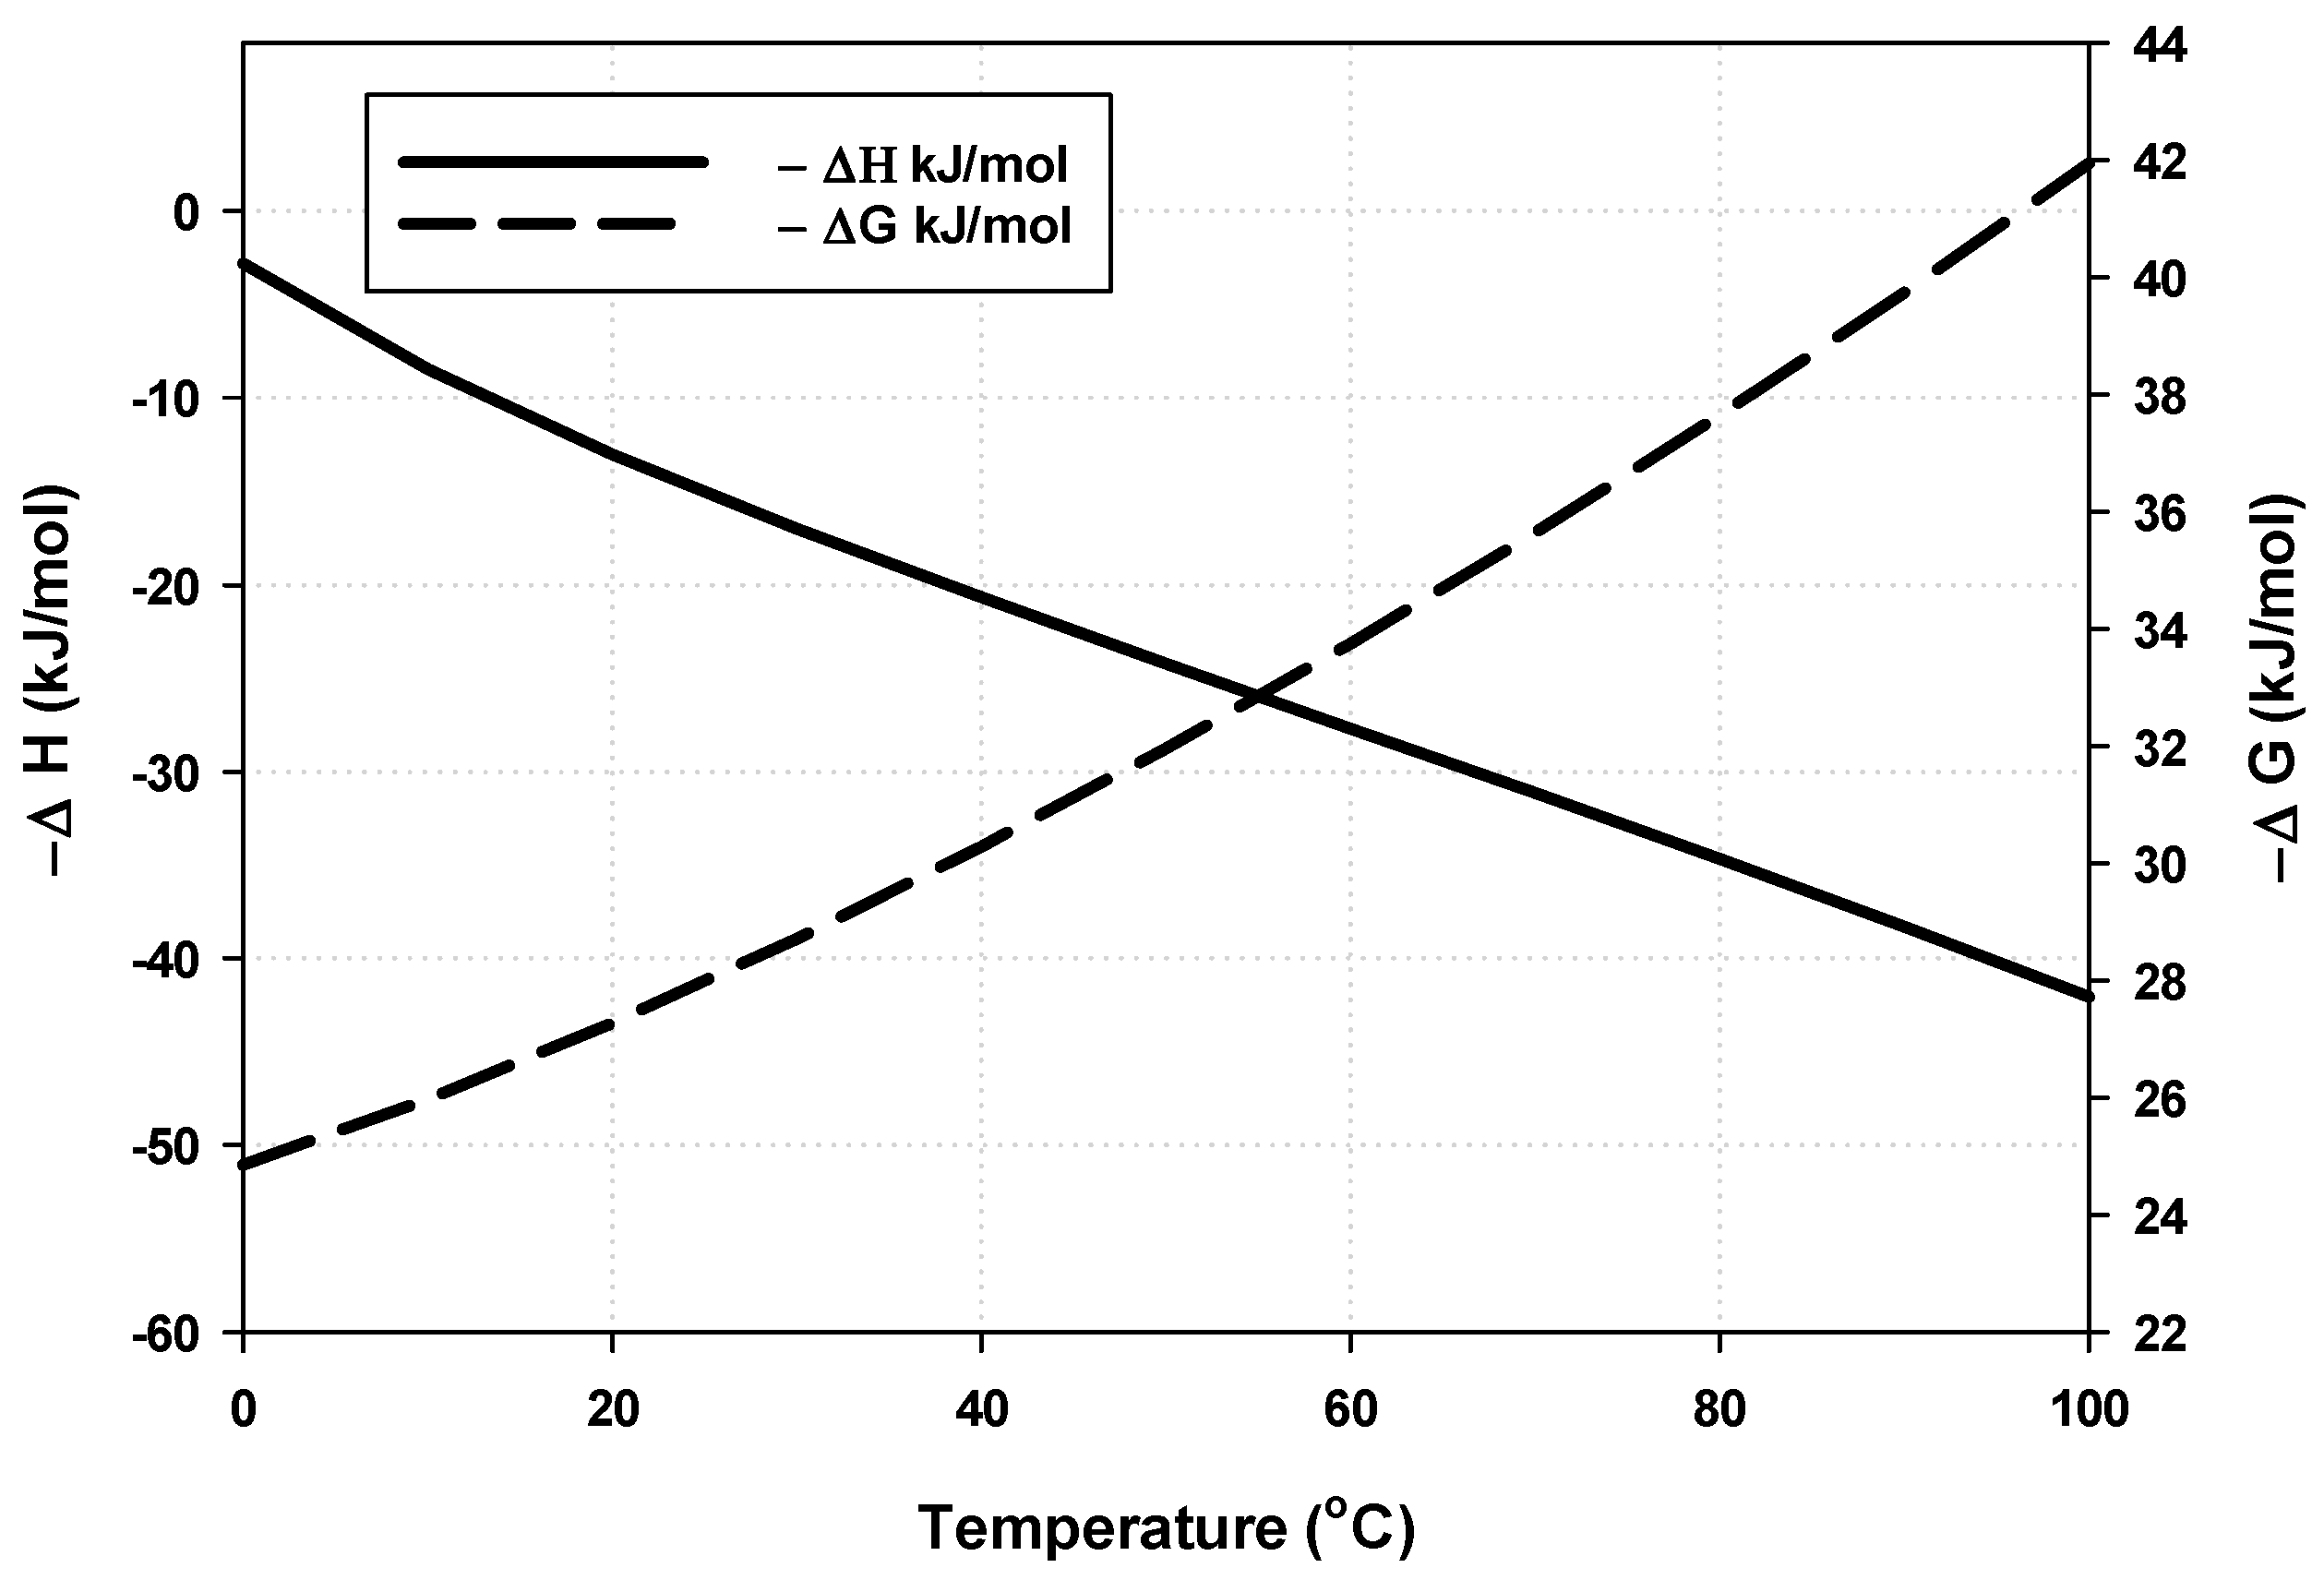
2.2. Thermodynamic Analysis

HSC Chemistry software VER. 3.0 [35] was used to evaluate the Gibbs free energy and heat of reaction at different reaction temperatures for ammonia removal, as reported elsewhere [7], and for sulfate recovery using calcium oxide, as shown in Figure 1. The chemical reaction of calcium cation ions and sulfate ions is described in the following Reaction.
Ca2+ + SO42− → CaSO4
Equation (5) is spontaneous over a wide range of temperatures, as indicated by the negative ΔG and the endothermic reaction (positive ΔH) in the temperature range of 0 to 100 °C.

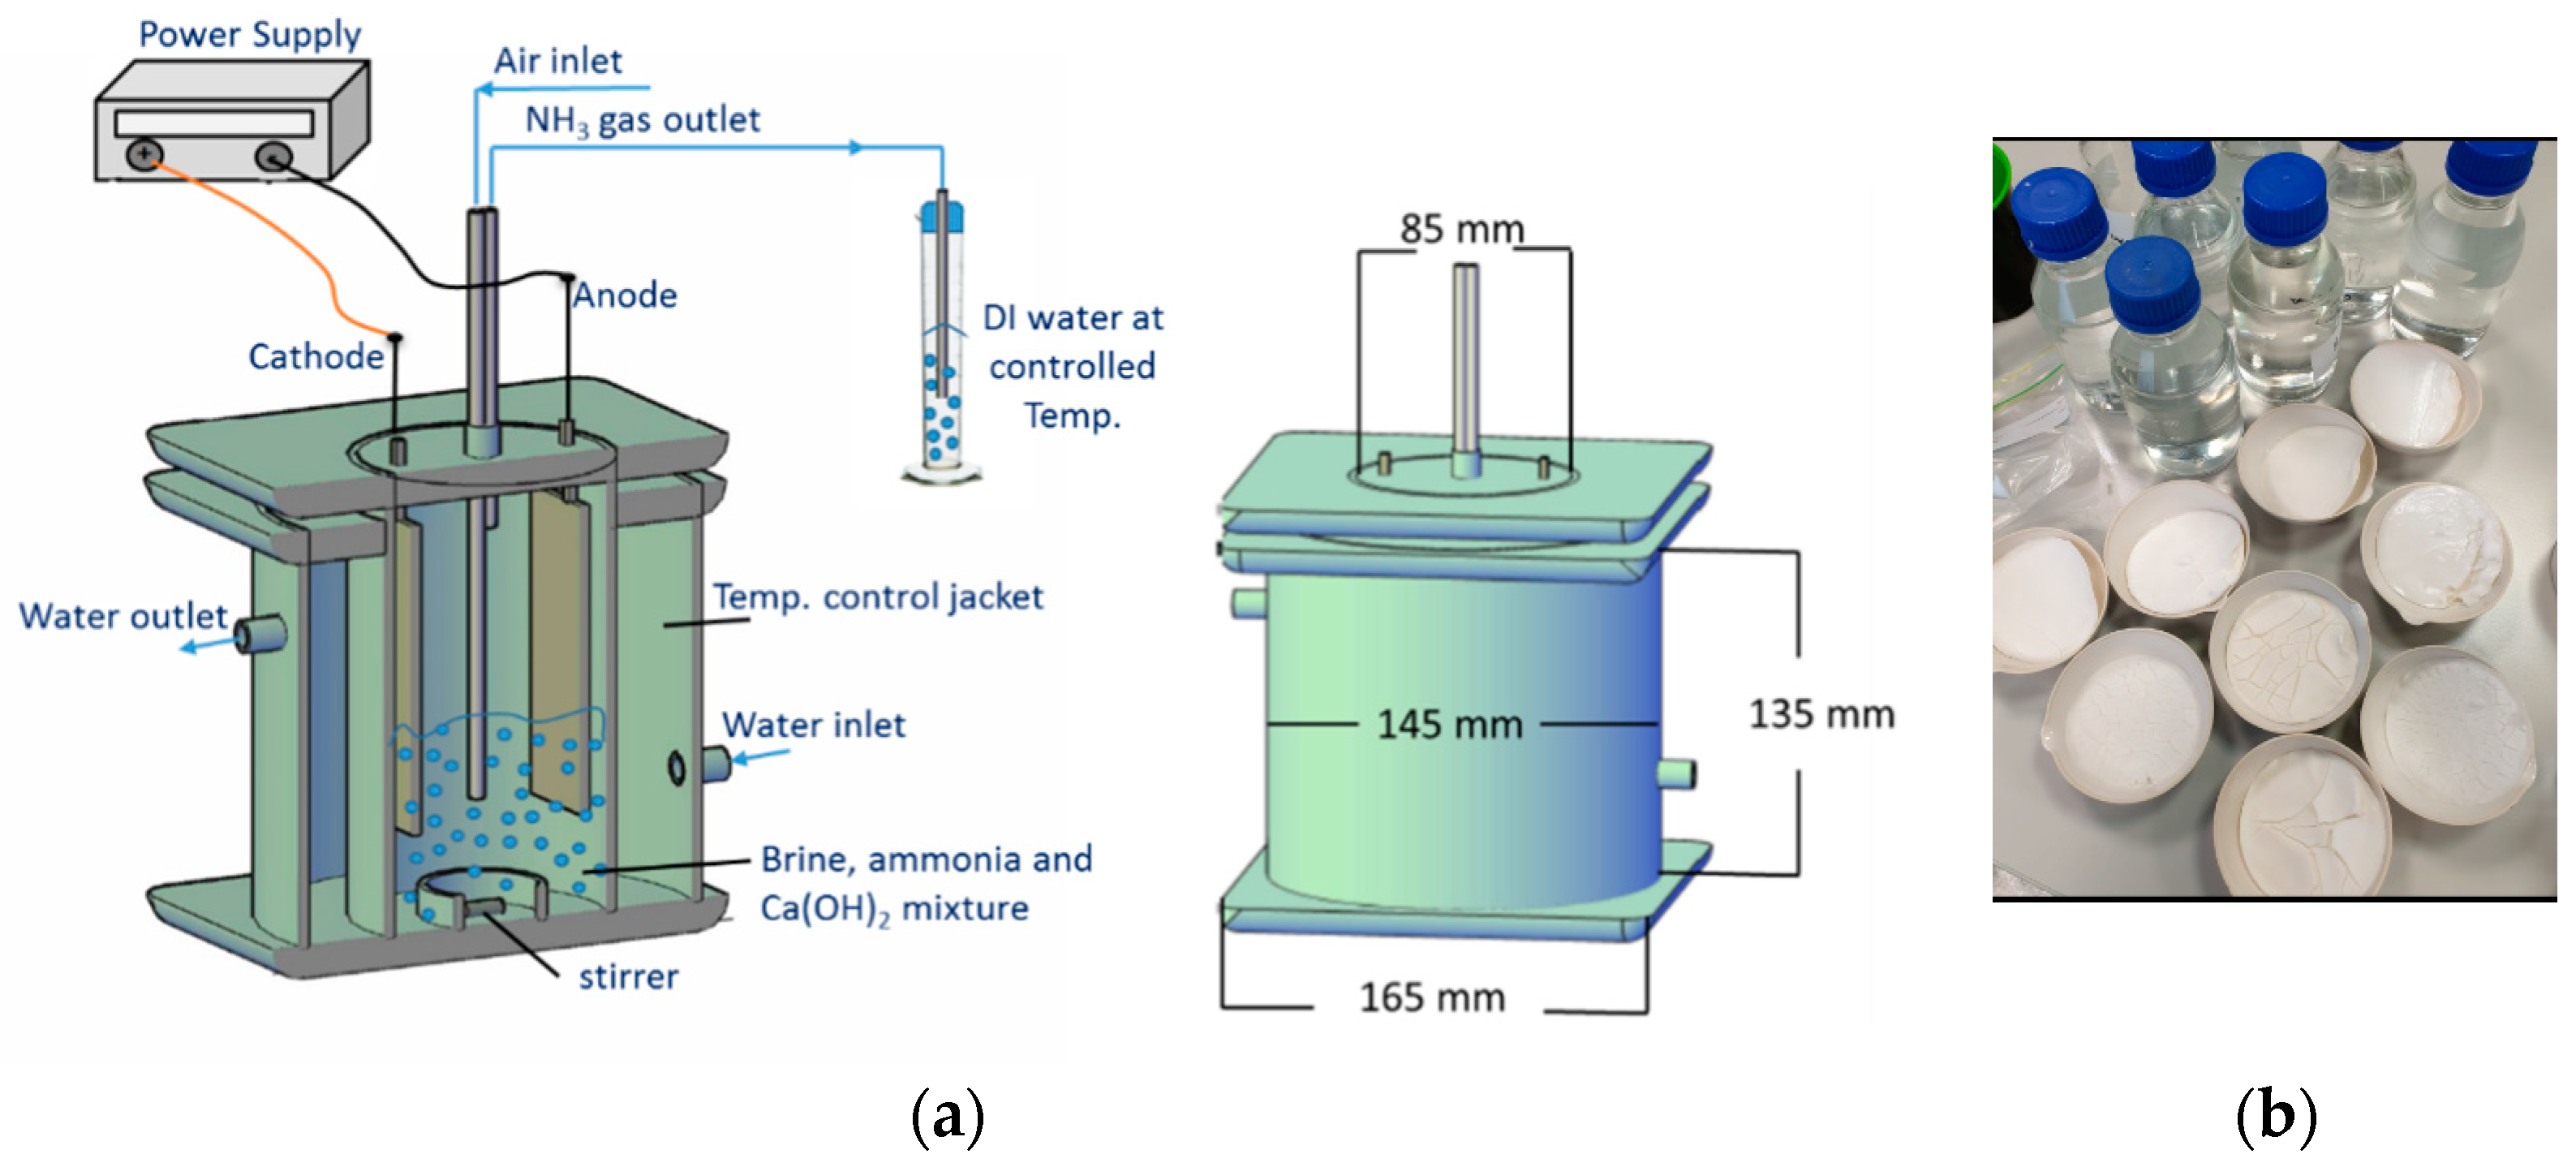
2.3. Experimental Setup

For the execution of the combined approach for ammonia and sulfate recovery, a closed electrocoagulation cell was employed, a method detailed in previous studies [1,2]. This electrocoagulation cell comprised two vertical Plexiglas cylinders, each serving a distinct purpose. The outer cylinder acted as a jacket, encompassing the inner one, which contained the solution undergoing treatment. Water circulates within the jacket, primarily to regulate and maintain the desired reaction temperature throughout the process. To enhance the mixing within the reactor, a magnetic stirrer, configured with a specific rotational velocity, was centrally positioned within the Plexiglas ring. Within the inner cylinder, rectangular aluminum plates were installed as electrodes, strategically located at the center of the top base. To initiate the electrocoagulation process, these electrodes were connected to a power supply, delivering the requisite voltage for the procedure. The control of current density was meticulously managed based on the delivered voltage and the surface area of the electrodes submerged within the treated brine. This setup ensured the precise and effective execution of the combined recovery approach. Within the central region of the inner cylinder cover, two tubes were introduced. One of these extended down to the base of the reactor to deliver the zero-air jet, while the second extended to a point above the treated mixture, facilitating the release of the collected and reclaimed ammonia gas from the reactor. The recovered ammonia gas is directed to a closed deionized water cell to collect the ammonia gas in the form of ammonium hydroxide, which could be recycled again as a source of ammonia solution for any proper application. The time during which the current is applied is the same as adding CaO to the treated brine. At the end of each run, the brine sample subjected to treatment was gathered and allowed to settle for 24 h under ambient conditions, ensuring the full coagulation process. Subsequently, it underwent filtration using a Buchner funnel filtration kit to separate the coagulated solids. Following filtration, all solid by-products were subjected to a 24 h drying period in an oven at 120 °C. Figure 2a,b illustrate both a schematic representation of the electrocoagulation cell and an actual image depicting the collected solids after the combined process. The schematic diagram for the proposed process is illustrated in Figure 3.

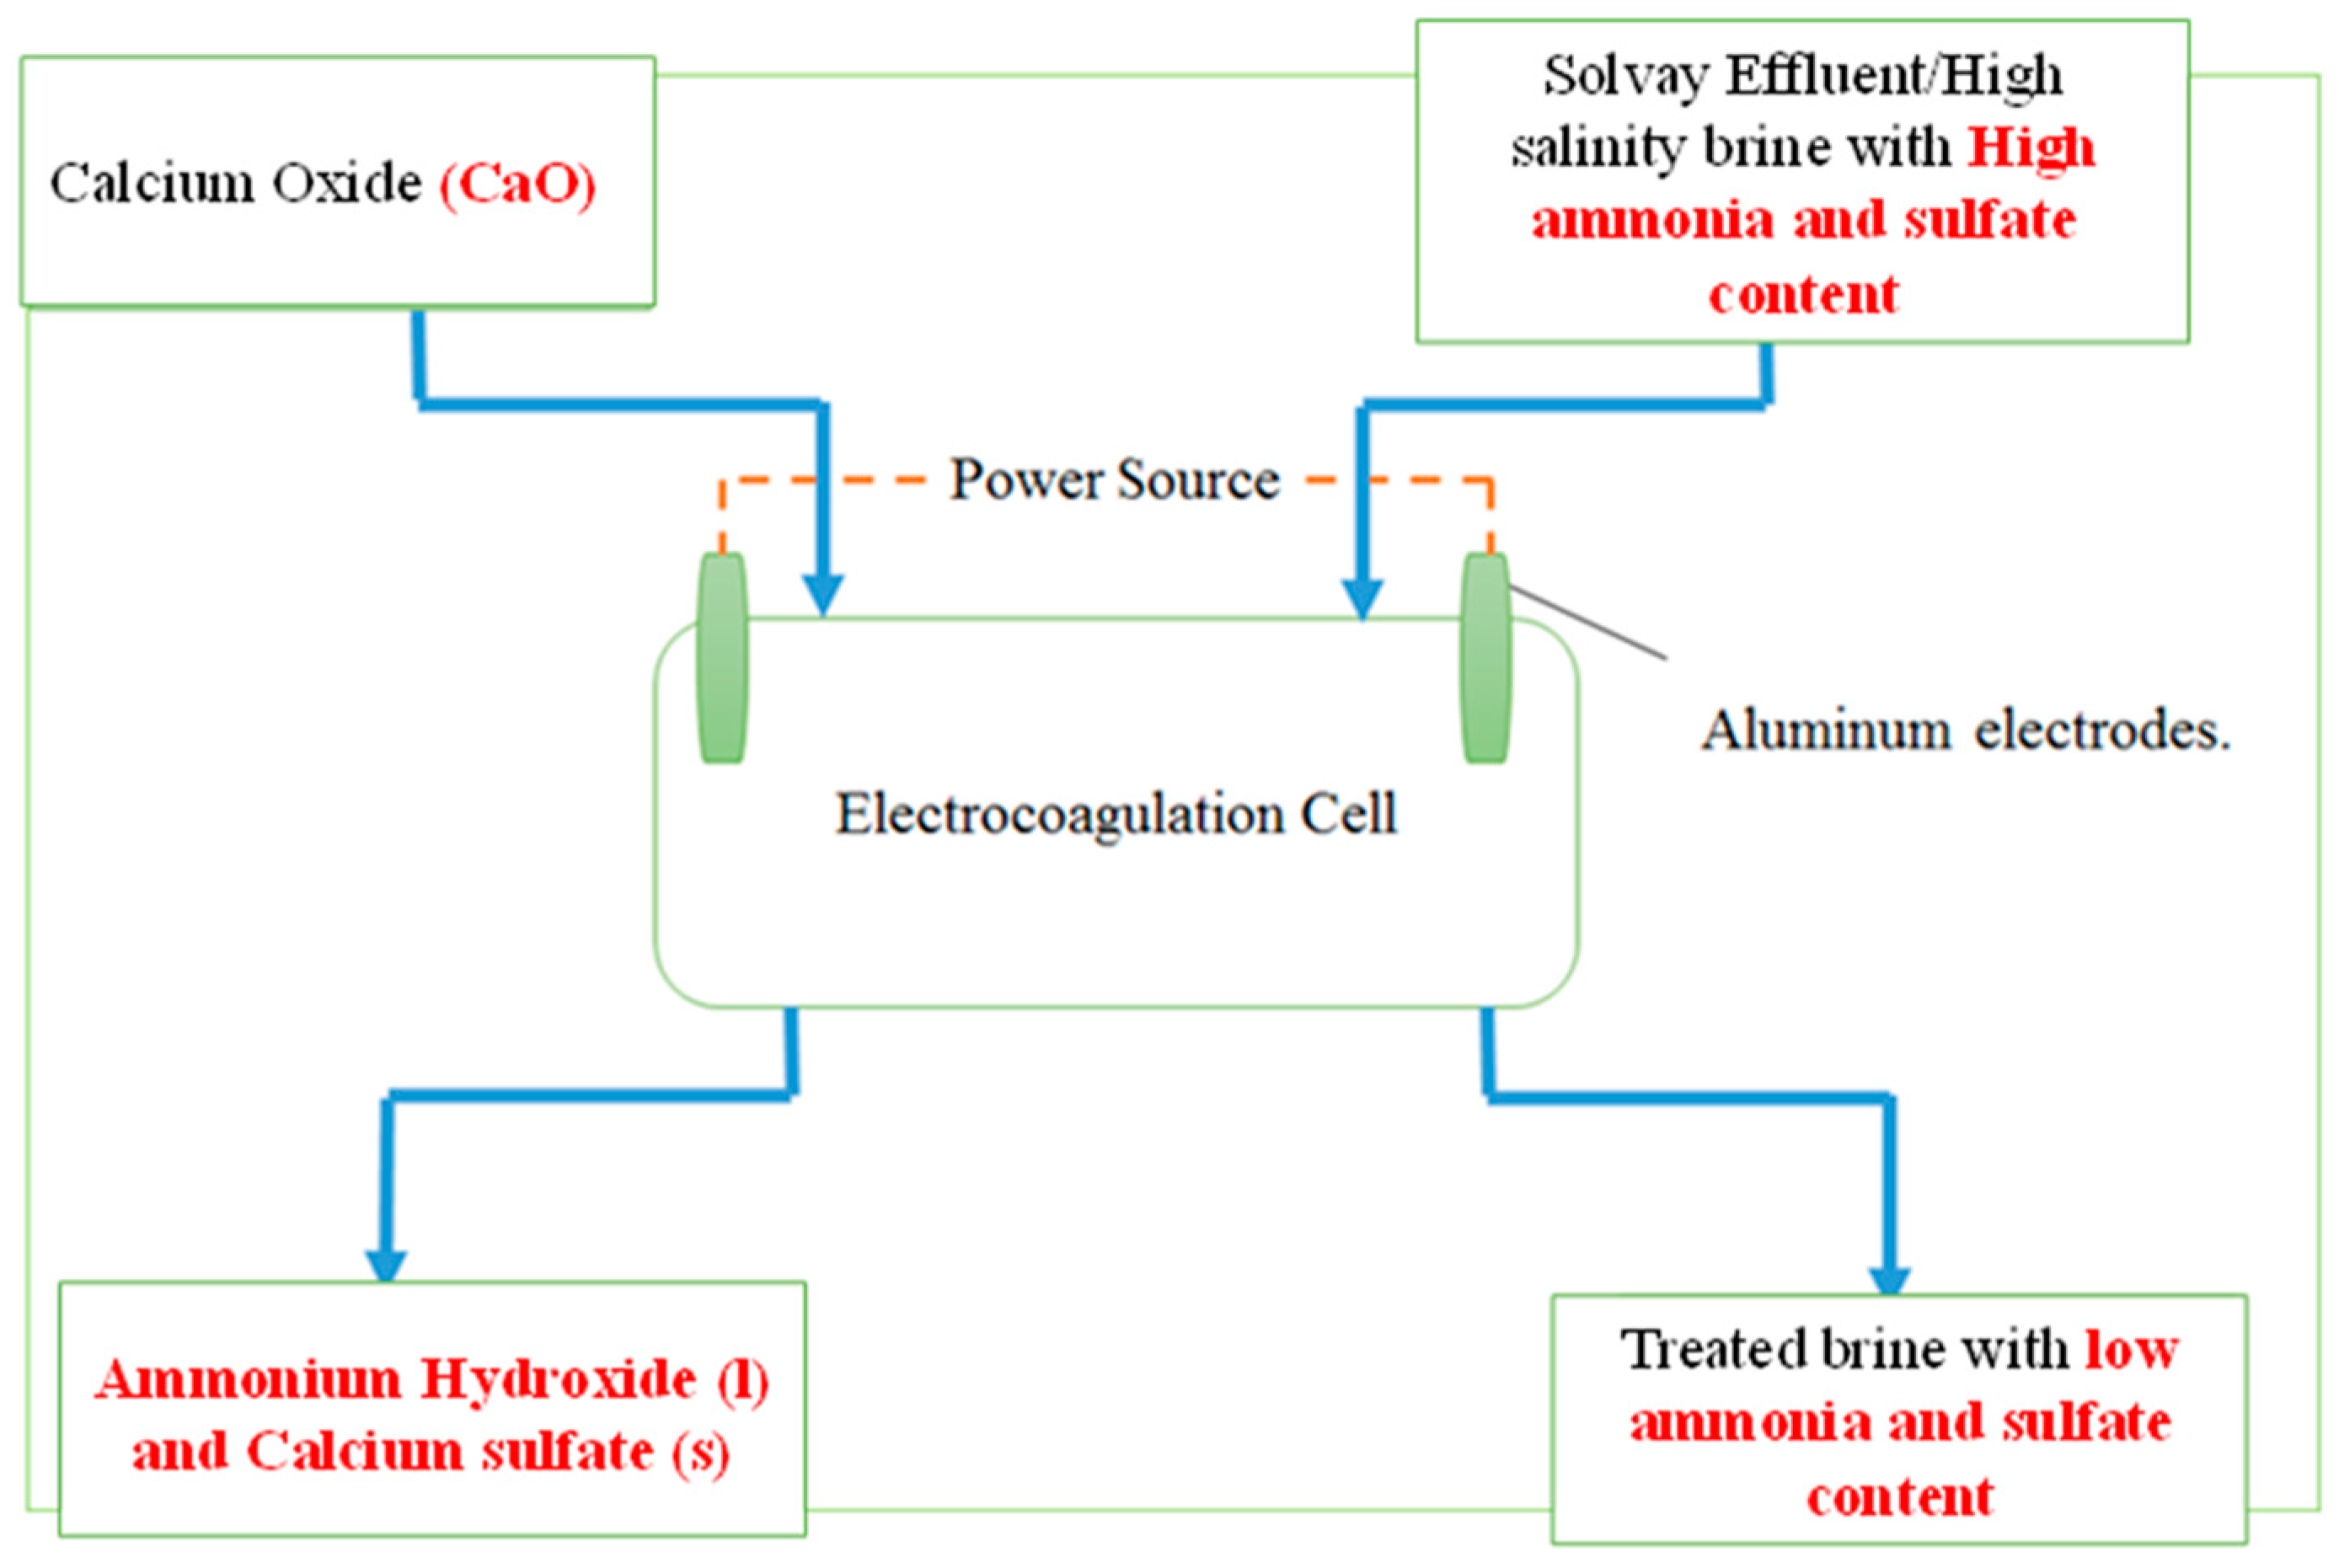
2.4. Process Description and Involved Reactions

The compact S O 4 2 precipitation and NH3 stripping in the presence of CaO inside the electrocoagulation cell involve passing the current through aluminum electrodes and generating the cathodic and anodic chemical reactions according to the chemical reactions given below.
The anode dissolution, which results in electrodes ions Al3+(aq):
Al(s) → Al3+(aq) + 3e
Water electrolysis, which results in hydrogen gas and hydroxide ions:
2H2O(aq) + 2e → H2(g) + 2OH
The first step of the coagulant formation in its initial form:
Al3+(aq) + OH(aq) →Al(OH)3(s)
The cathode electrode reaction during the electrocoagulation results in the formation of ammonia gas, as shown in Equation (9), and that is the main process for the removal of ammonium ions (NH4+).
2 NH4+ + 2e → 2NH3(g) + H2(g)
For the sulfate removal, the ions formed in the anodic dissolution reaction, according to Equation (6) Al+3(aq), are promoting the chemical precipitation and providing more driving force to precipitate the sulfate content as follows:
3Ca(OH)2(s) + 2Al3+(aq) + 3SO42− → 2Al(OH)3(s) + 3CaSO4(s)

2.5. Experimental Design

In the quest to optimize the recovery of both ammonia and sulfate, a systematic approach was adopted. Each response, pertaining to ammonia and sulfate recovery, was meticulously evaluated within defined ranges of independent process parameters. These parameters encompassed reaction temperature, current density, and calcium oxide concentration. To facilitate this extensive process analysis, the software Minitab 17.0 was employed. In pursuit of optimization, central composite design (CCD) was utilized [36], a methodology that permits the effective exploration of four key process variables: calcium oxide concentration (°C), current density (CD), reaction temperature (T), and mixing flow rate (MFR). Each of these variables was assessed across five distinct levels, as detailed in Table A1. To assess the reliability and robustness of the model, a thorough examination was conducted. The lack of fit was scrutinized, and the optimal model was discerned through the application of the analysis of variance methodology (ANOVA). Mathematical relationships were then established, linking the investigated factors to ammonia and sulfate removal. These relationships served as the foundation for describing the selected variables, ultimately culminating in the attainment of optimum recovery conditions. The experimental data were subsequently fitted through the utilization of a second-order regression model, providing a response equation that characterizes the intricate interplay of variables [37]. The response optimizer tool within the Minitab software played a pivotal role in this optimization process. It defined desirability by setting it to a value of 1.0, with the ultimate goal being the maximization of all tested responses. This systematic and data-driven approach underpins the precision and efficiency of the research methodology employed in this study.

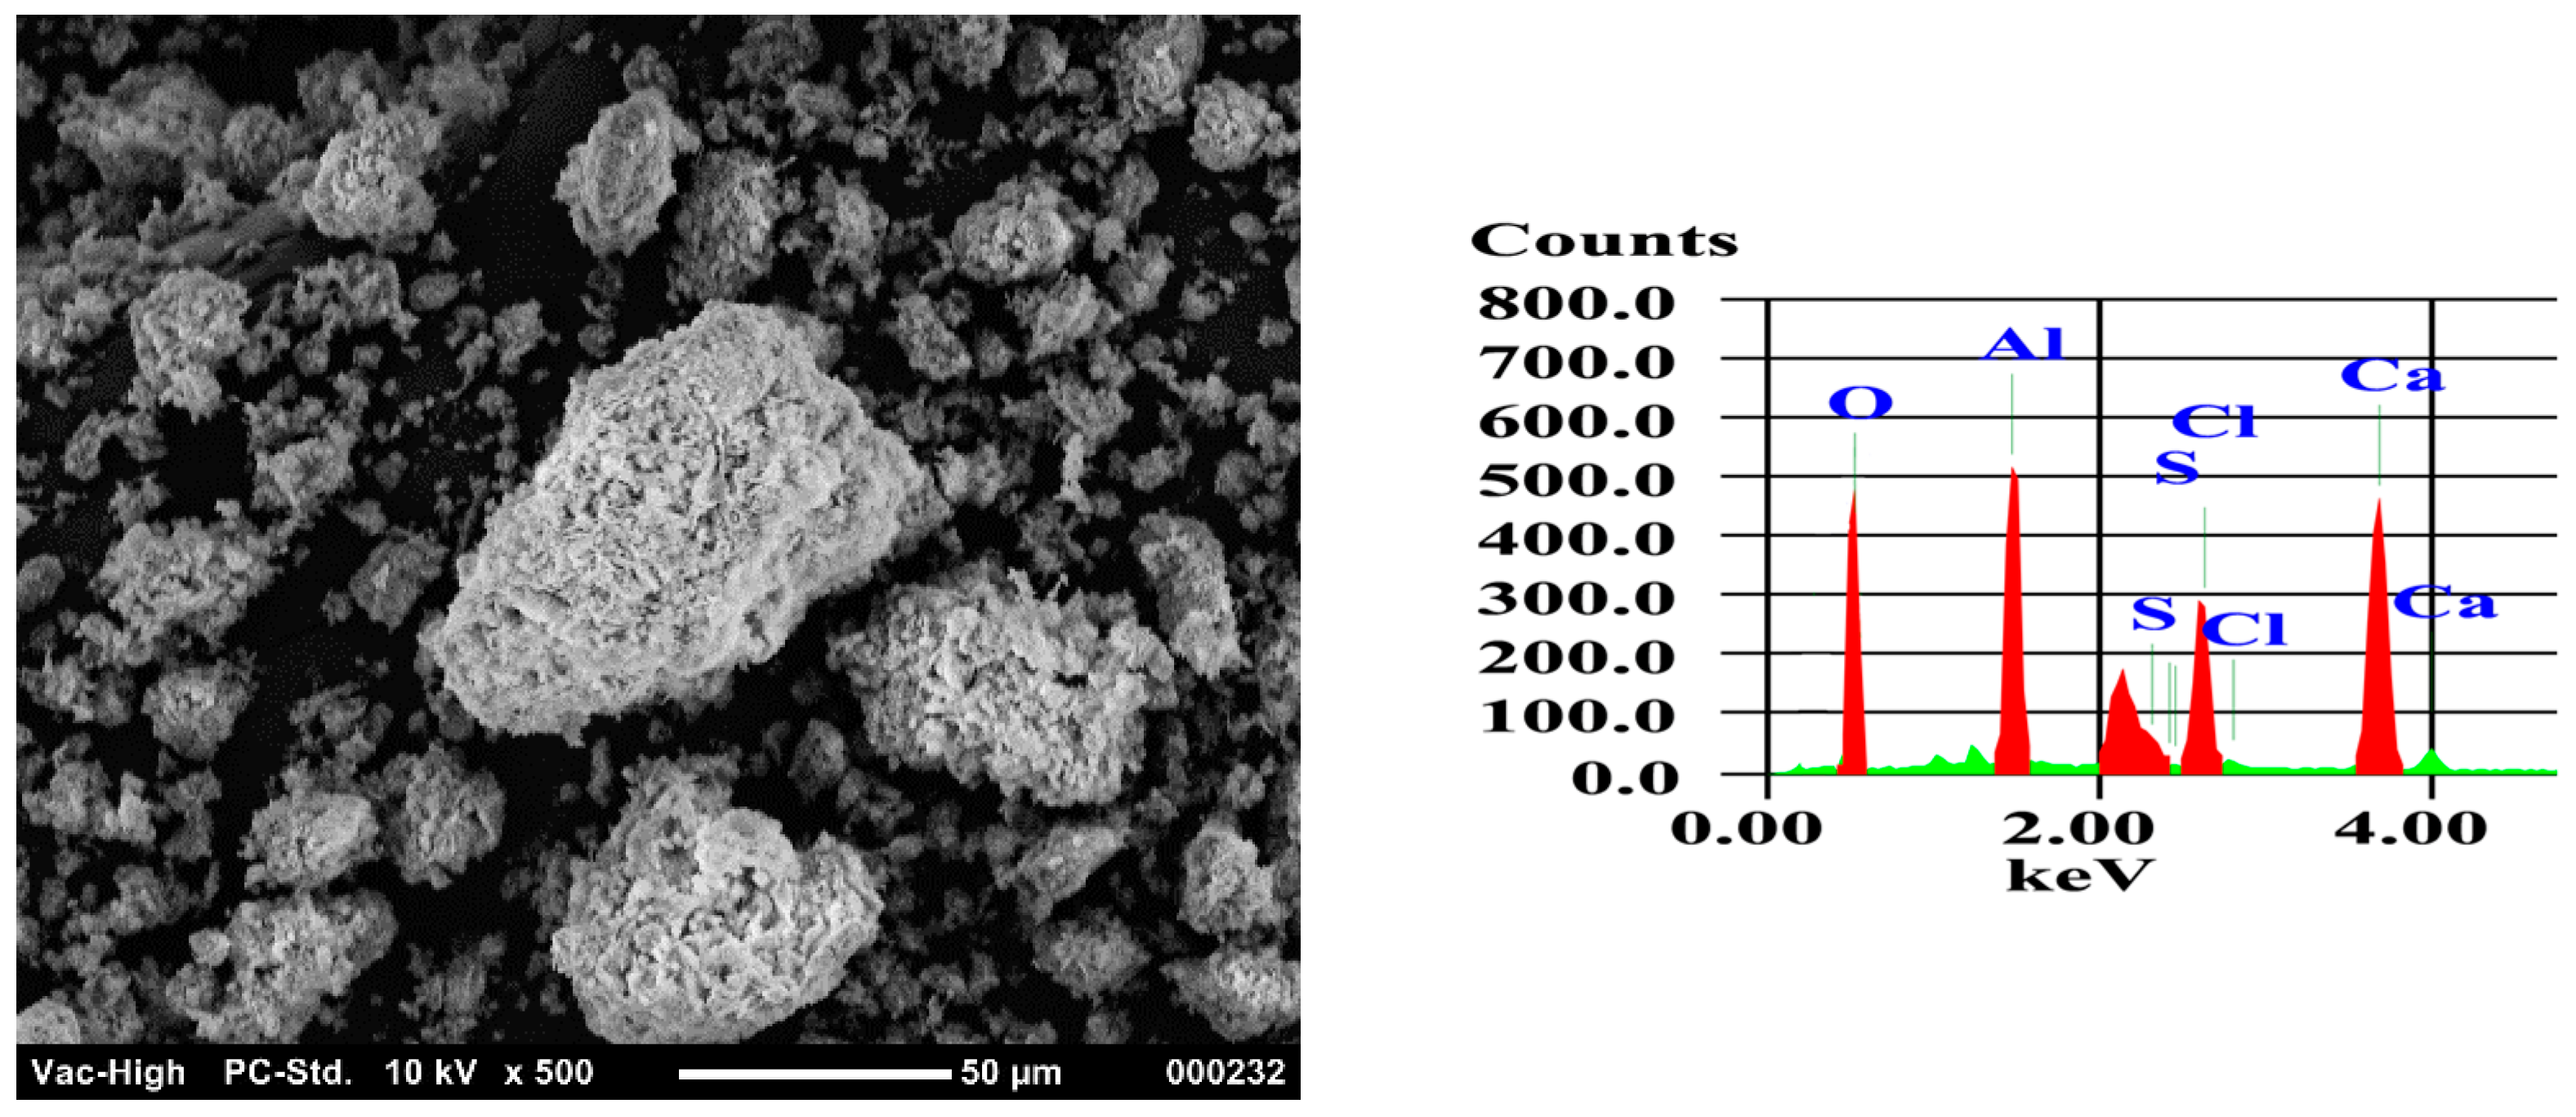
2.6. Solid Precipitate Characteristics

The optimal parameters were determined through practical experimentation, and the resultant solid product underwent filtration and was subsequently subjected to a 120 °C drying process lasting for 24 h. To analyze the dried solid samples, continuous X-ray diffraction (XRD) scans were conducted using a panalytical diffractometer, covering a range from 10° to 100° (2θ) min−1, with a step size of 0.013° and a scanning rate of 2° 2θ min−1. Additionally, scanning electron microscopy (SEM) images of the solid samples were captured.

3. Results

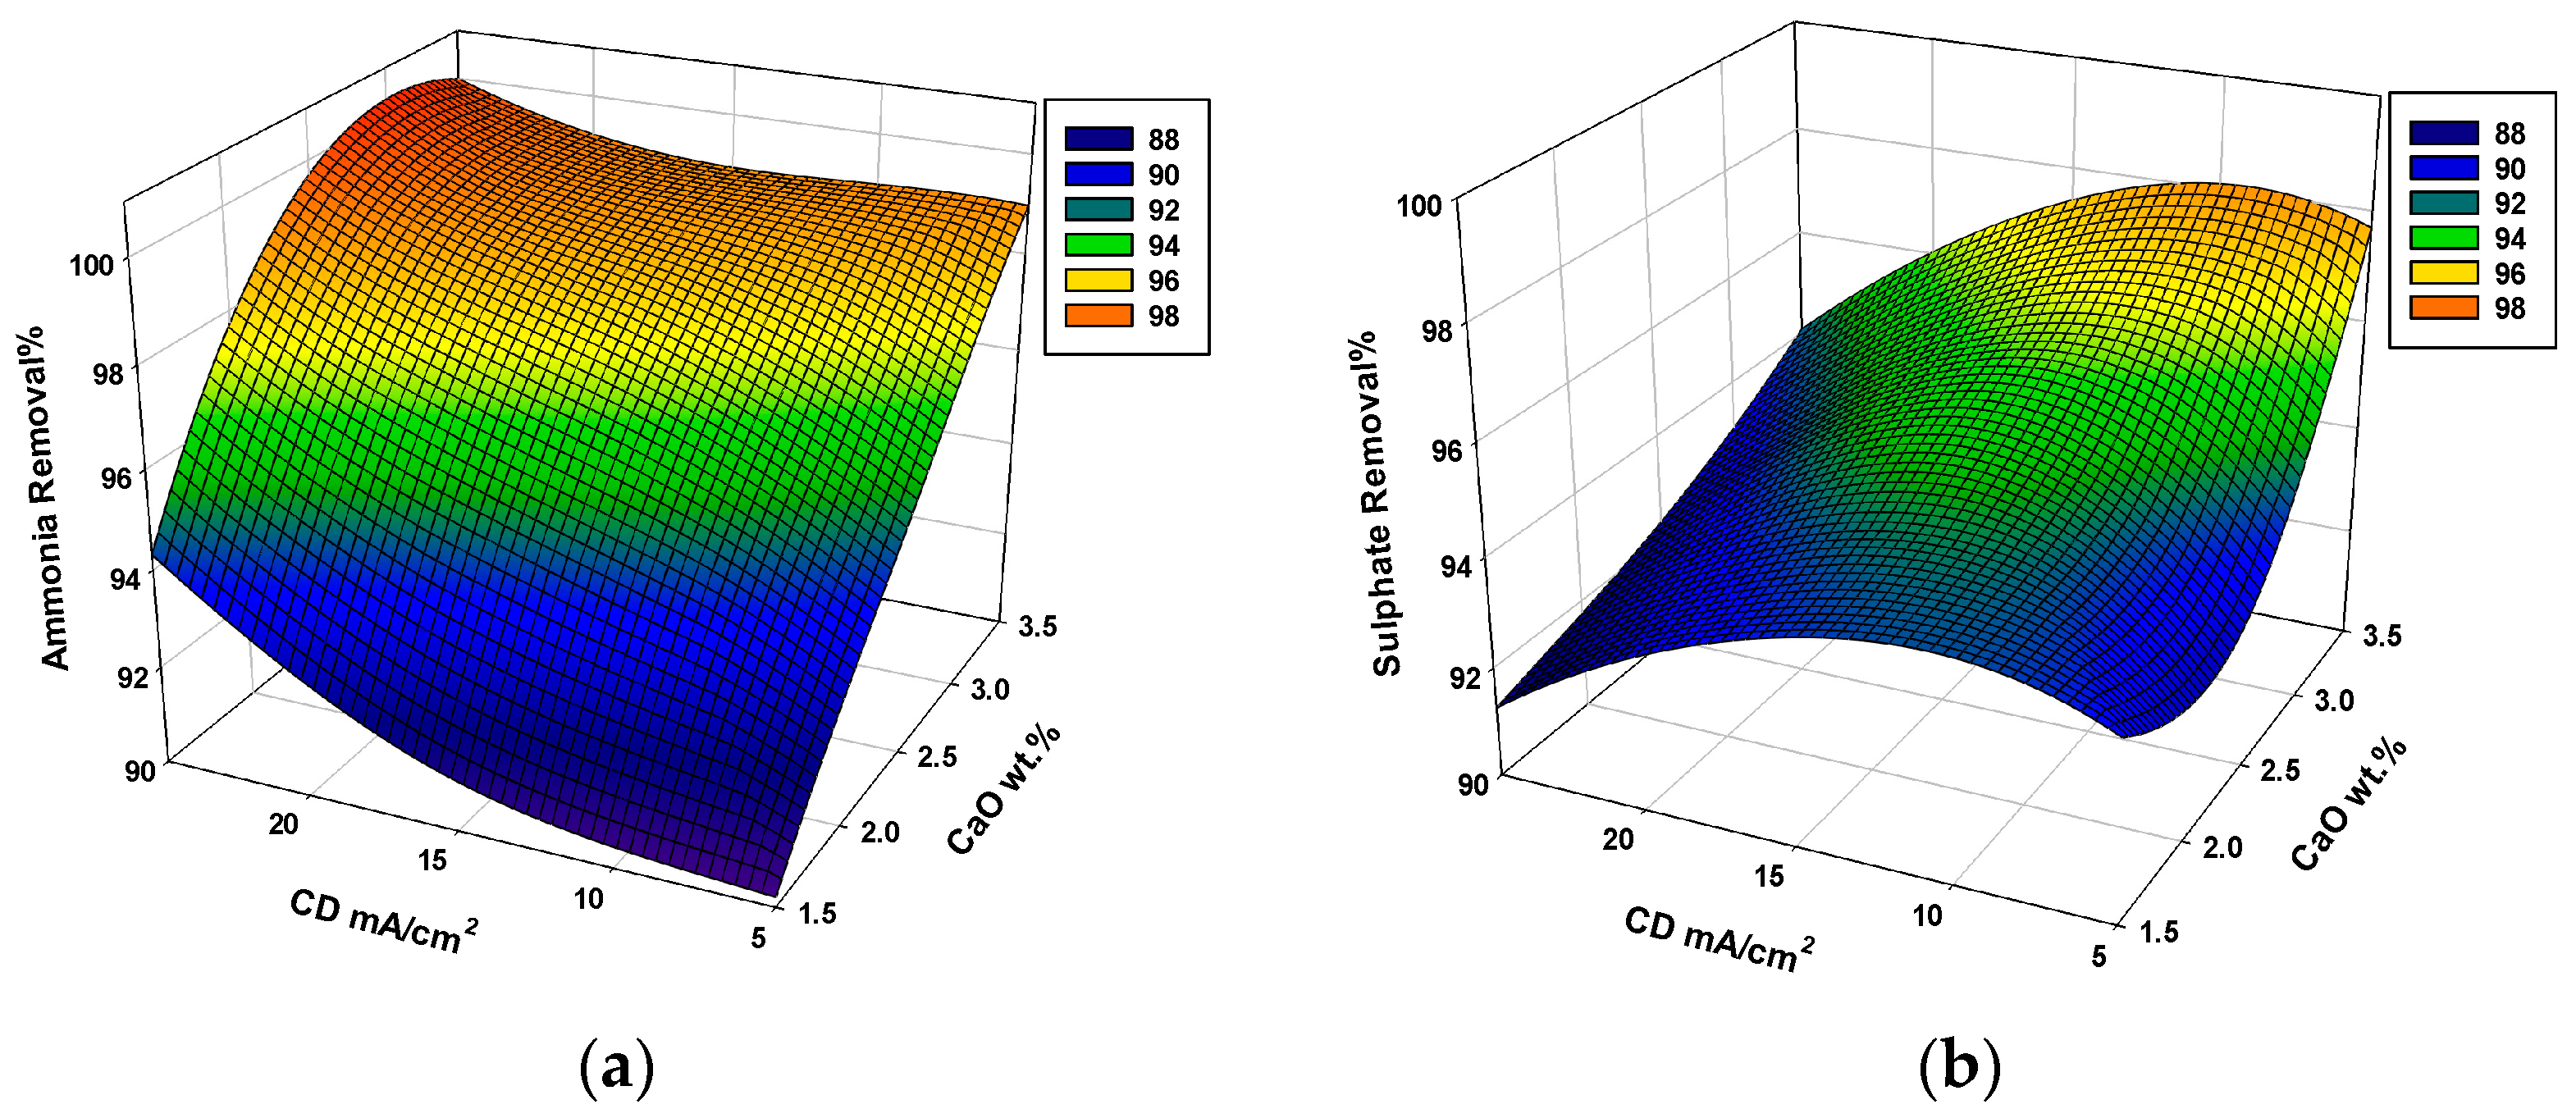
3.1. Process Parameters’ Effect on the Ammonia and Sulfate Removal

An analysis of the interaction impacts of process parameters on the experimental response was carried out through the demonstration of 3-D surface plots. These plots were created by varying two independent parameters while holding the remaining variables at a constant value.

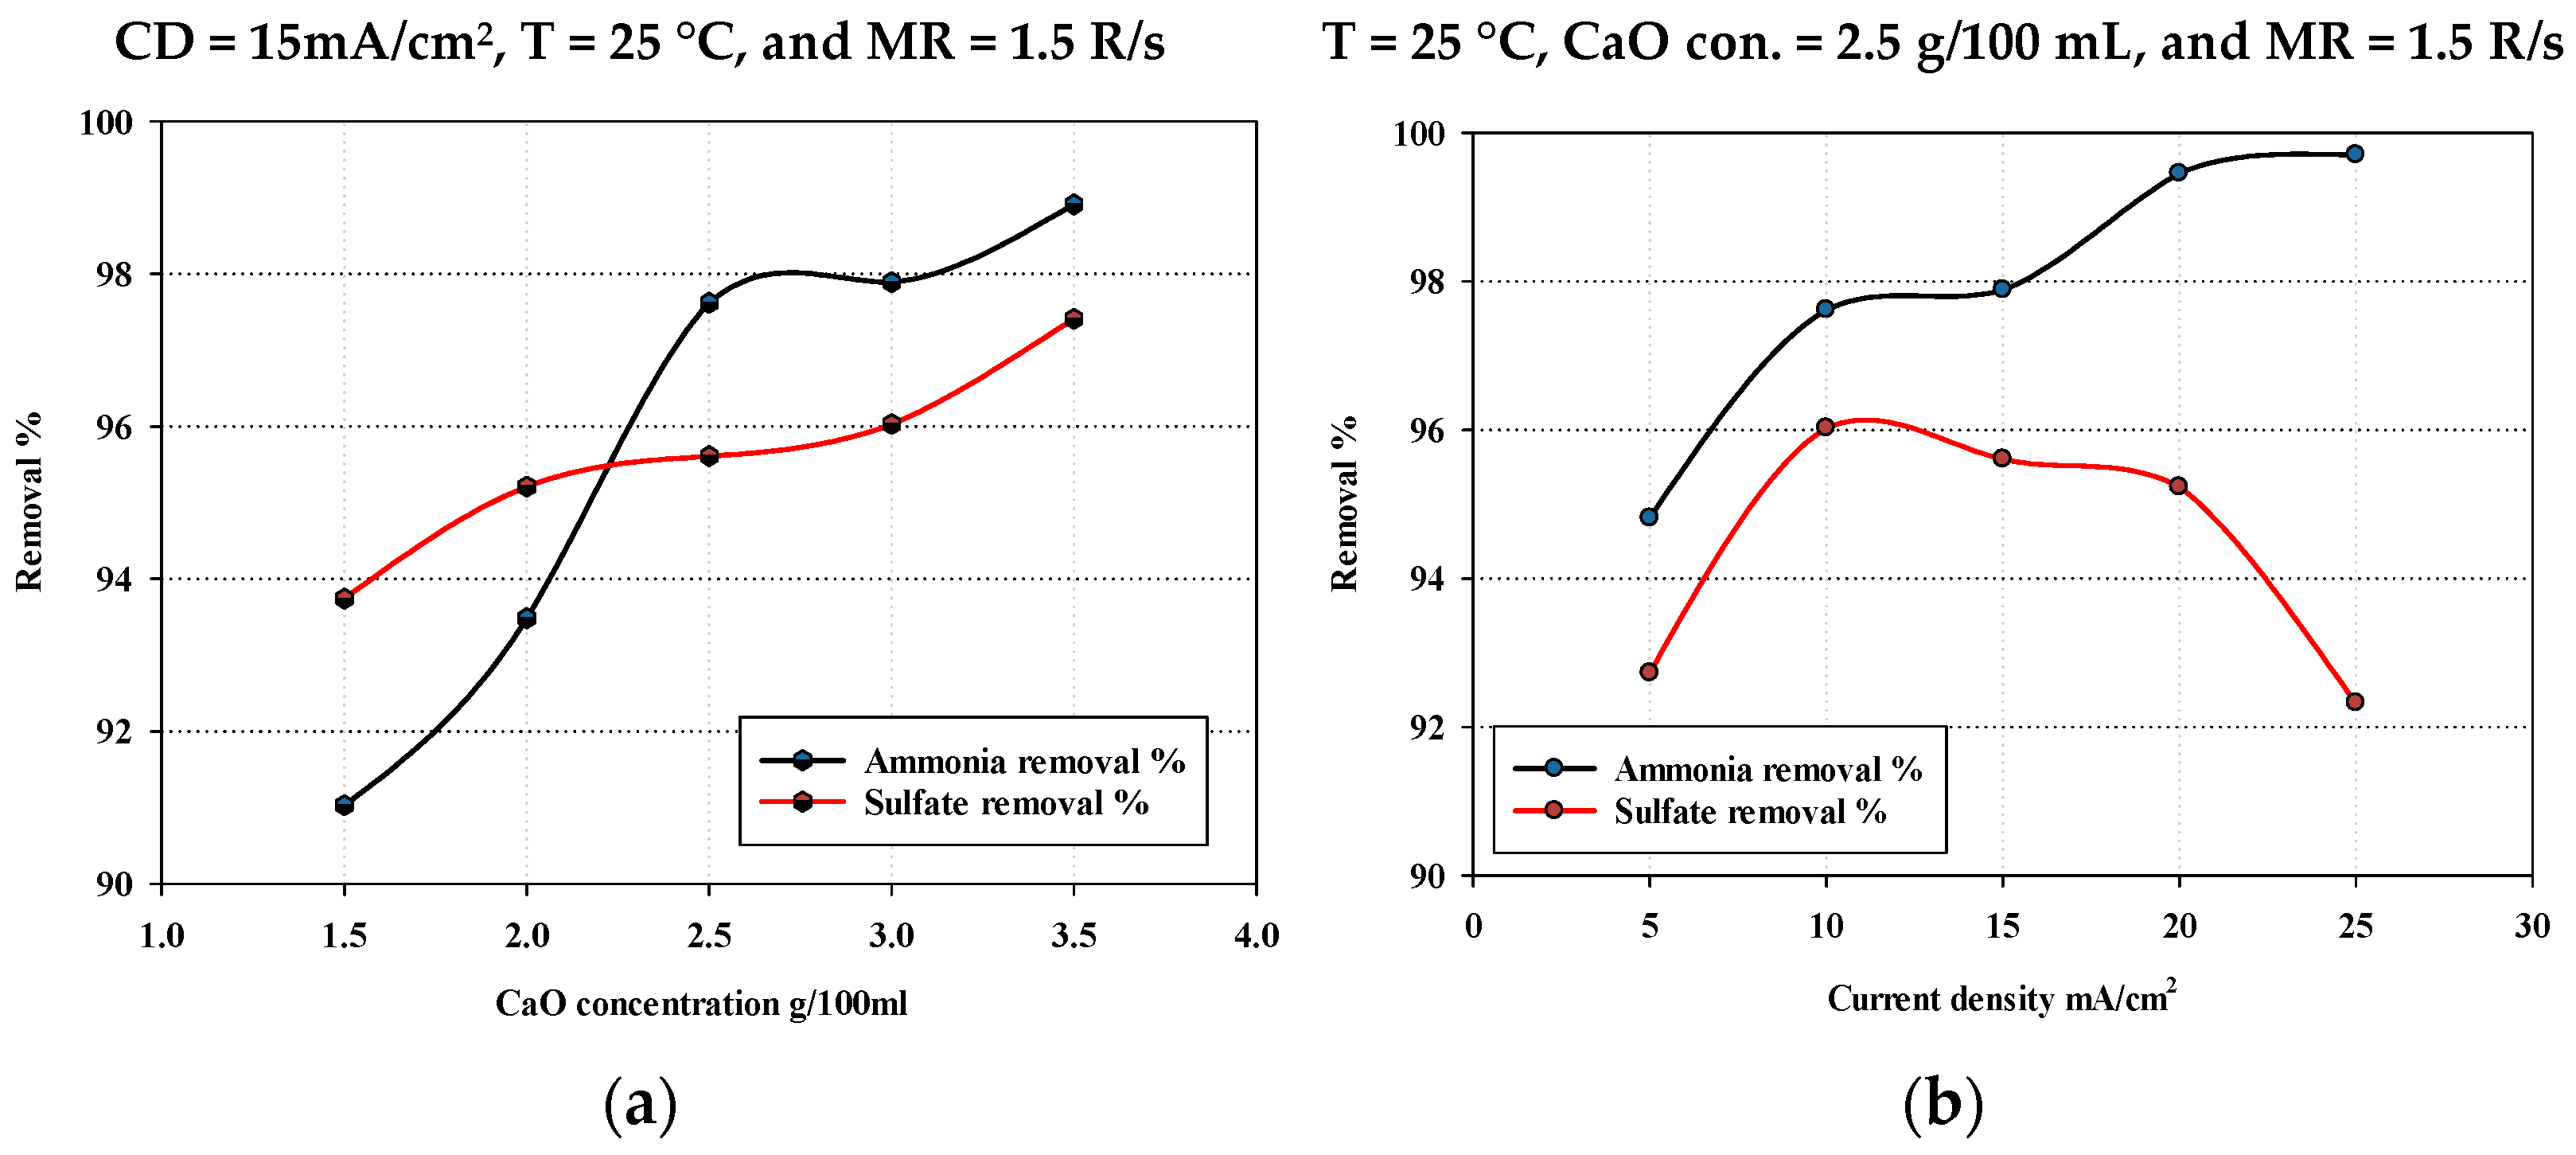
3.1.1. Effect of Calcium Oxide Concentration

The effect of calcium oxide concentration on ammonia and sulfate removal is shown in Figure 4a,b, respectively. Increasing the calcium oxide concentration increases the ammonia and sulfate removal to a certain limit, which is related to the increase in reaction rate to reach its maximum performance. A negative effect has been observed at high calcium oxide concentrations, which is related to the ion transfer limitation because of the increase in mixture density. The maximum ammonia removal percentage was achieved at a calcium oxide concentration of 3–3.5 g/L, which results in high concentrations of hydroxyl ions. This promotes the formation of solid calcium sulfate and ammonia stripping simultaneously [20,38].
The concentration of brine salts, including CaCl2 and NaCl, and their influence on the proposed combined approach are critical parameters that require investigation. This is particularly significant given the approach’s goal of efficiently removing sulfate and ammonia content from brine to enhance the desalination process and facilitate CO2 capture in subsequent treatment stages. By eliminating competitive species like ammonia and sulfate, the combined approach aims to improve its overall performance. To gain a more comprehensive understanding of the impact of the actual concentrations of these salts in brine on the effectiveness of the combined process, further investigation is warranted. This aspect will be a vital focus for future studies.

3.1.2. Effect of Current Density

The effect of current density on ammonia and sulfate removal is illustrated in Figure 5a,b, respectively. It is clear that increasing the current density has a positive effect on ammonia removal. As the current density increases, the ion flux between the electrodes increases, which is combined with increasing the temperature of ammonia stripping [38]. On the other hand, increasing the current density will have a positive impact on the sulfate removal for a certain limit, where increasing the current density to more than 20 mA/cm2 may introduce a negative effect because of the increased calcium sulfate solubility.

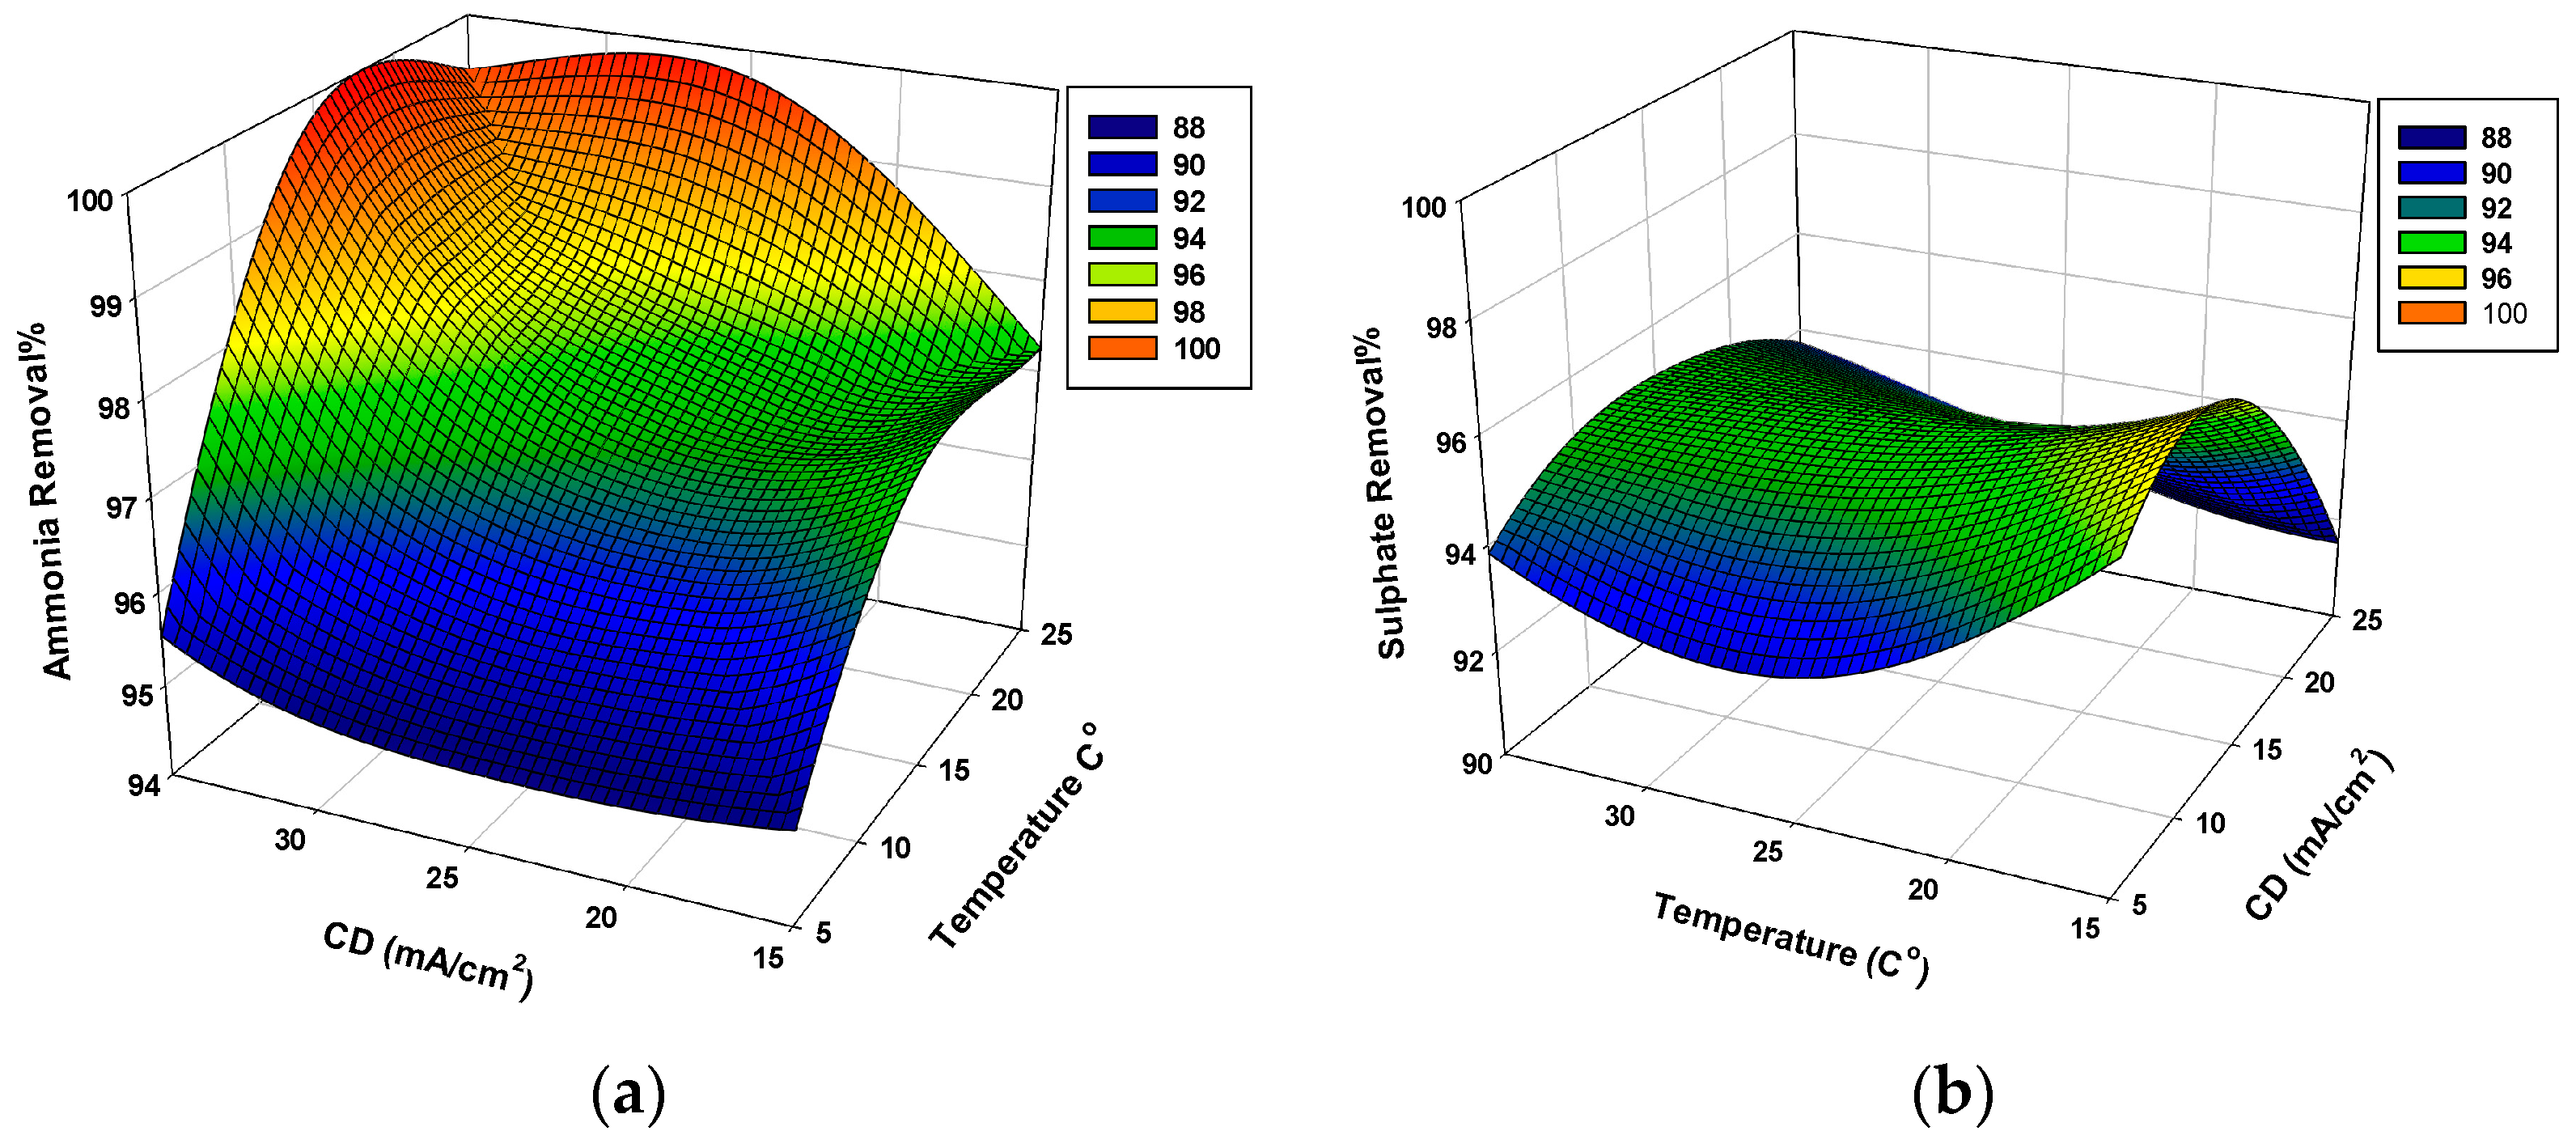
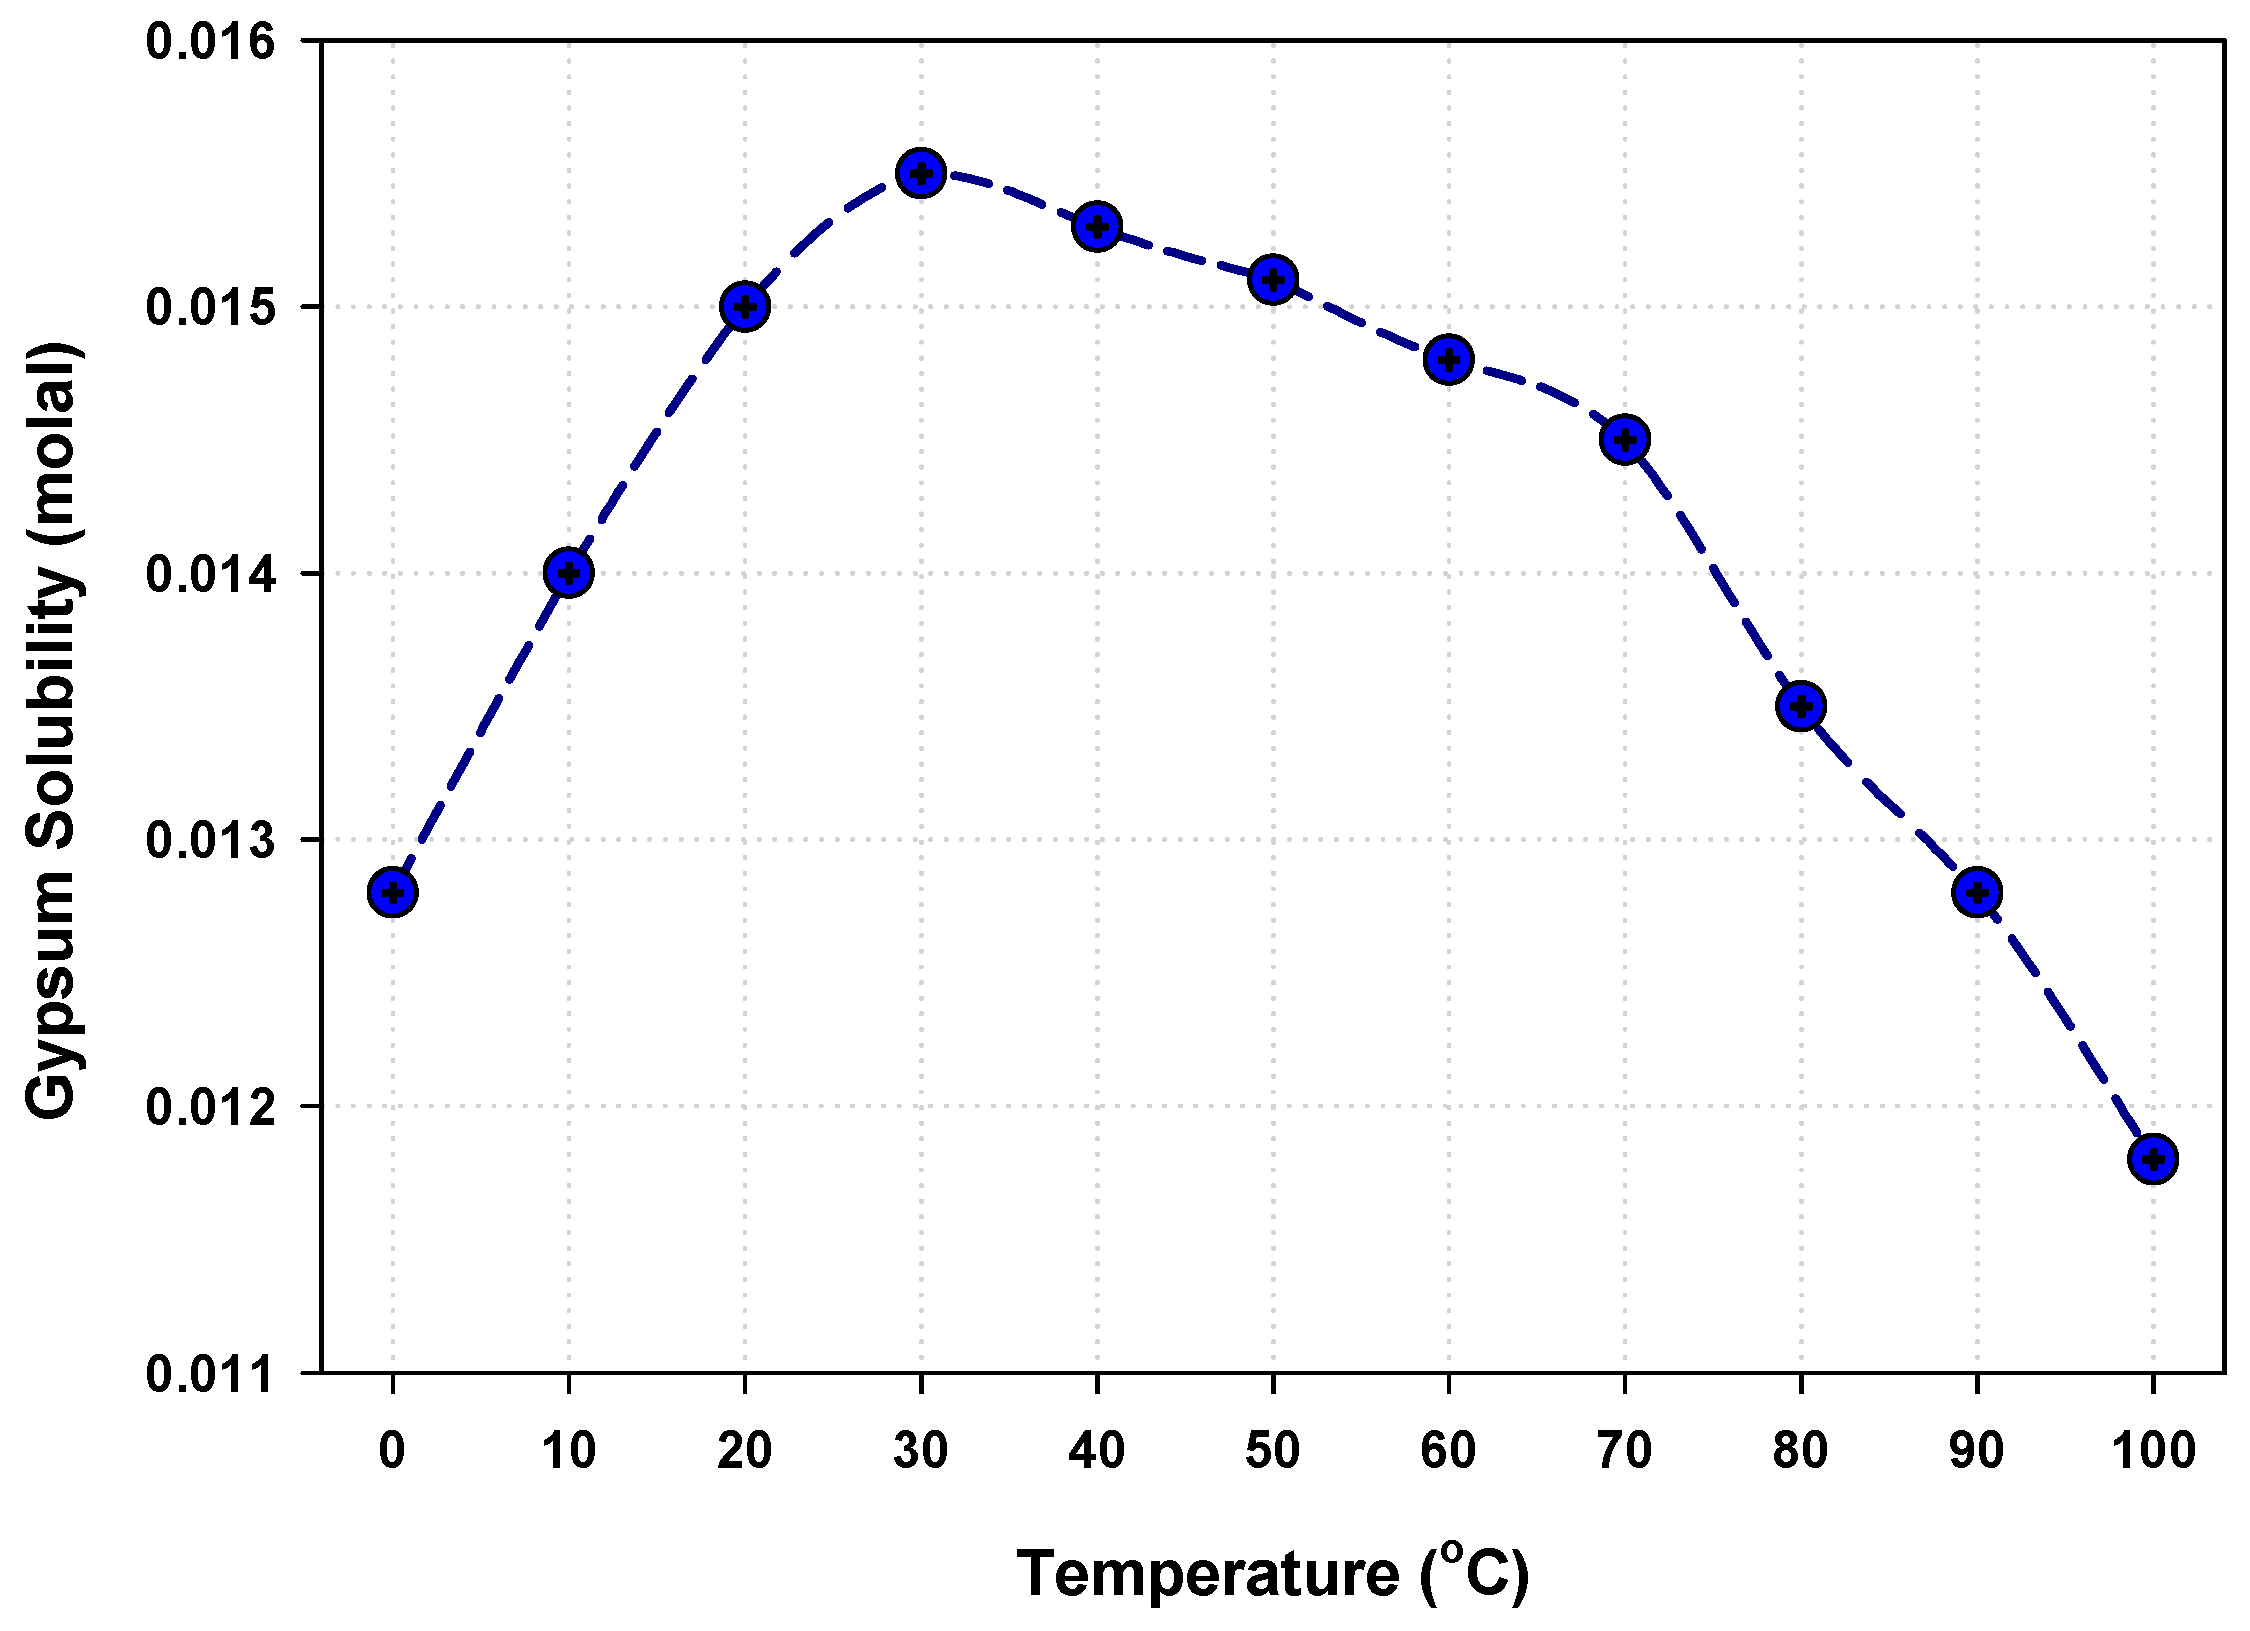
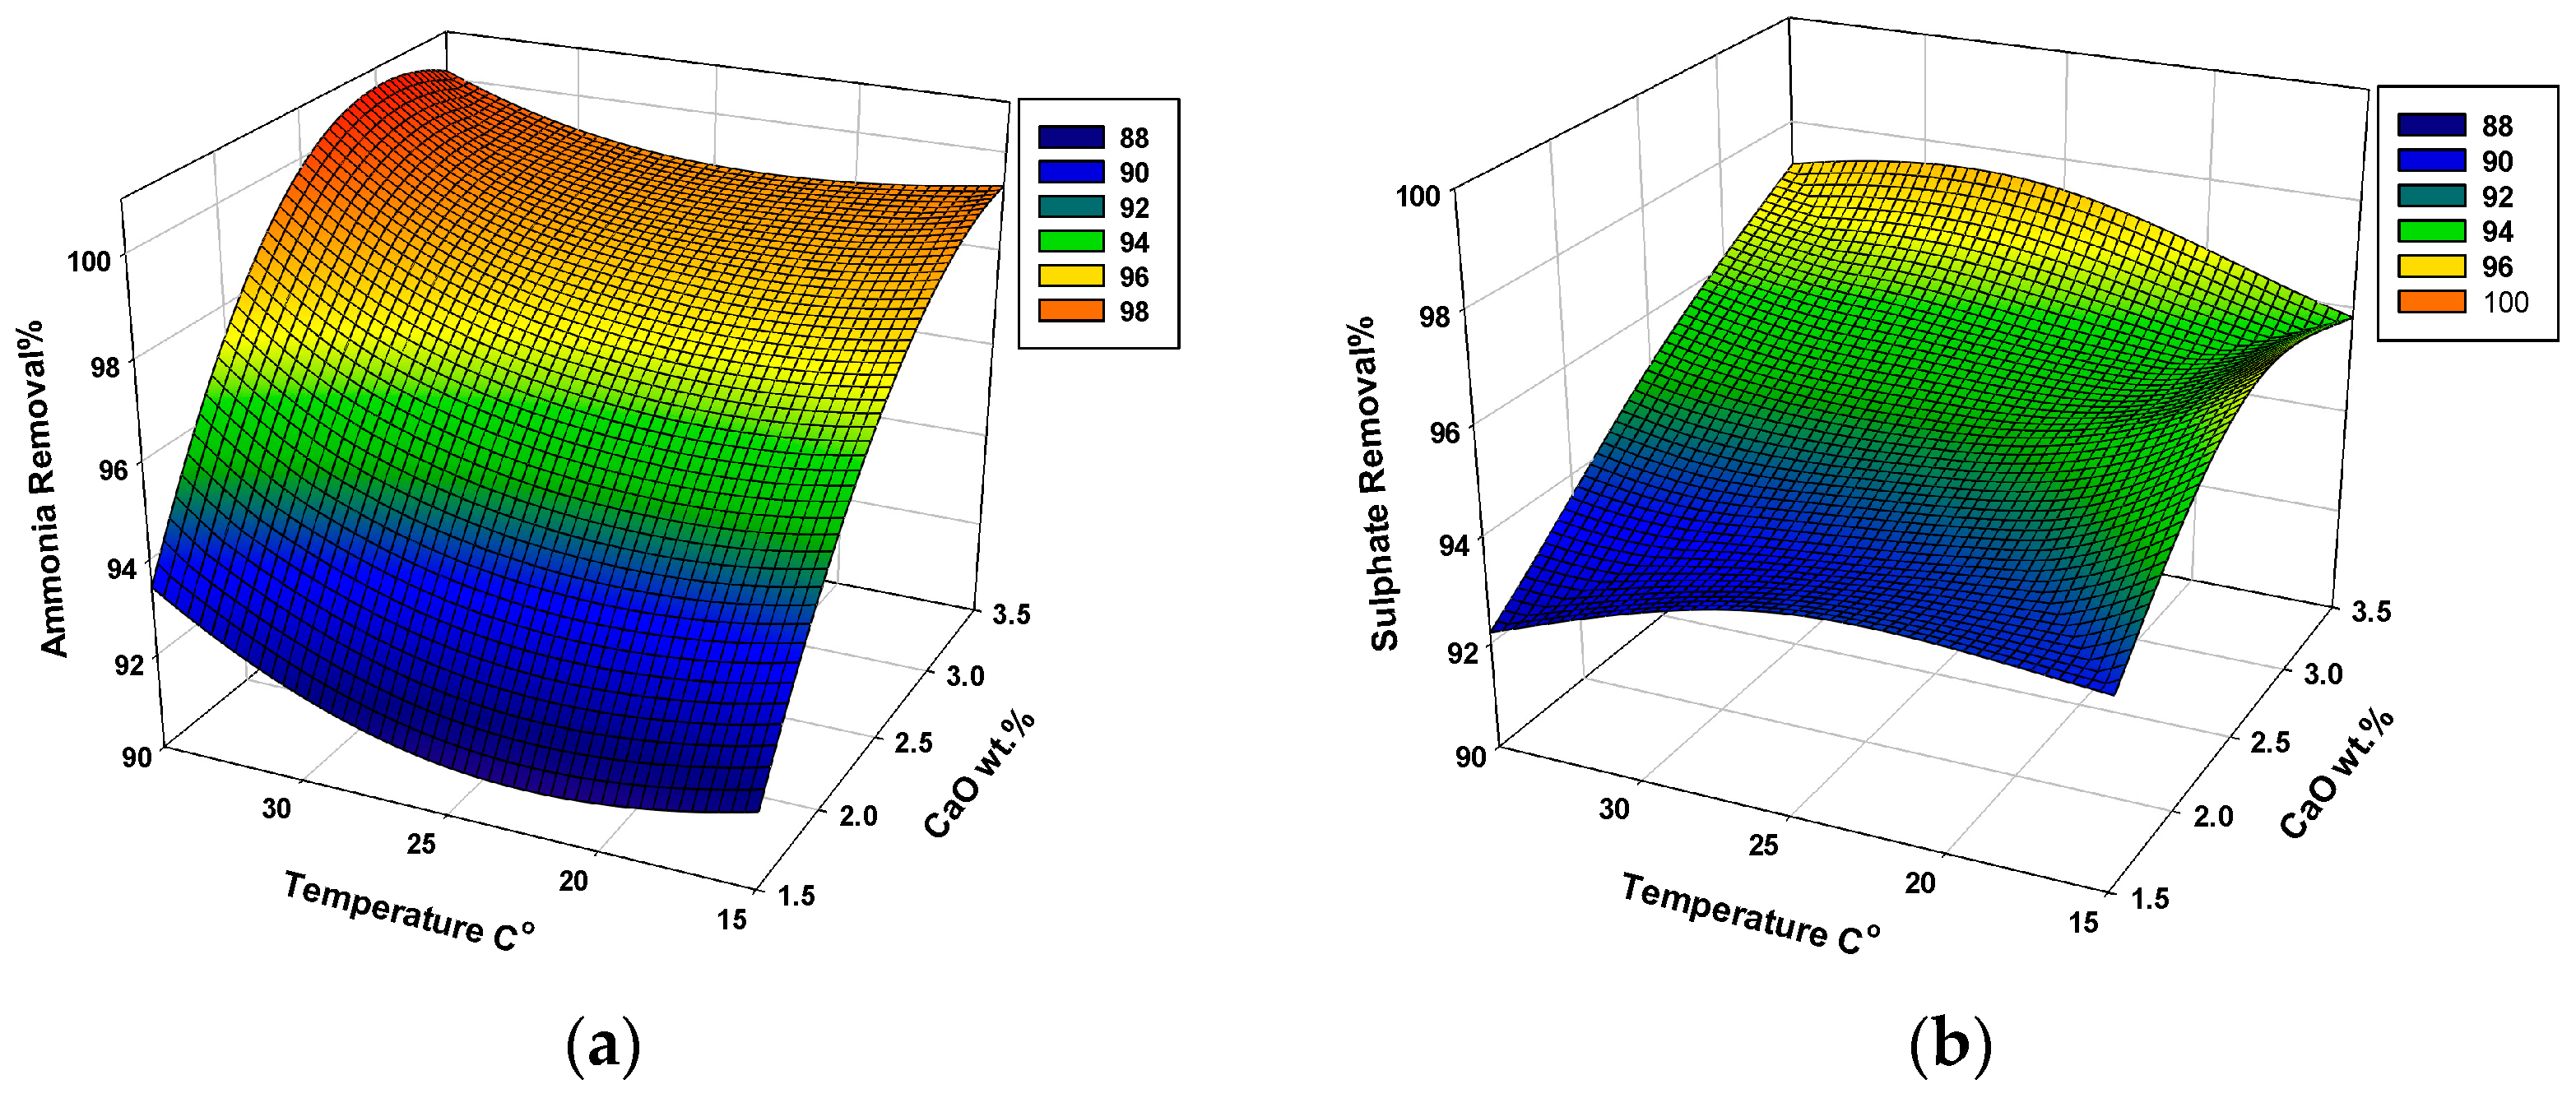
3.1.3. Effect of Temperature

As depicted in Figure 6a,b, increasing the temperature enhances ammonia stripping, but with a specific limit for sulfate removal. The solubility of the formed calcium sulfate solids plays a significant role in the removal efficiency as well as the type of formation reaction (endothermic reaction). From the experimental results, it was clear that at low temperatures (10–25 °C), increasing the temperature will increase the rate of reaction and form more calcium sulfate in the solid state; however, increasing the temperature beyond 25 °C, up to 40 °C, will increase the solubility of the solids, as shown in Figure 7. This figure depicts the change in calcium sulfate solubility in water, which deviates from the experimental results obtained where calcium sulfate solubility differs in brine due to the effect of salt concertation on the solubility of the products. From Figure 7, it is clear that operating the combined approach at a higher temperature (more than 40 °C) will have a positive effect on both responses; however, a high operational cost should be expected, and this decreases the process’s applicability. It was found that increasing the temperature to more than 30 °C has a positive effect on the process efficiency by decreasing the sulfate solubility, and increasing the temperature up to 35 °C increases the sulfate removal to the maximum, as shown in Figure 6b.

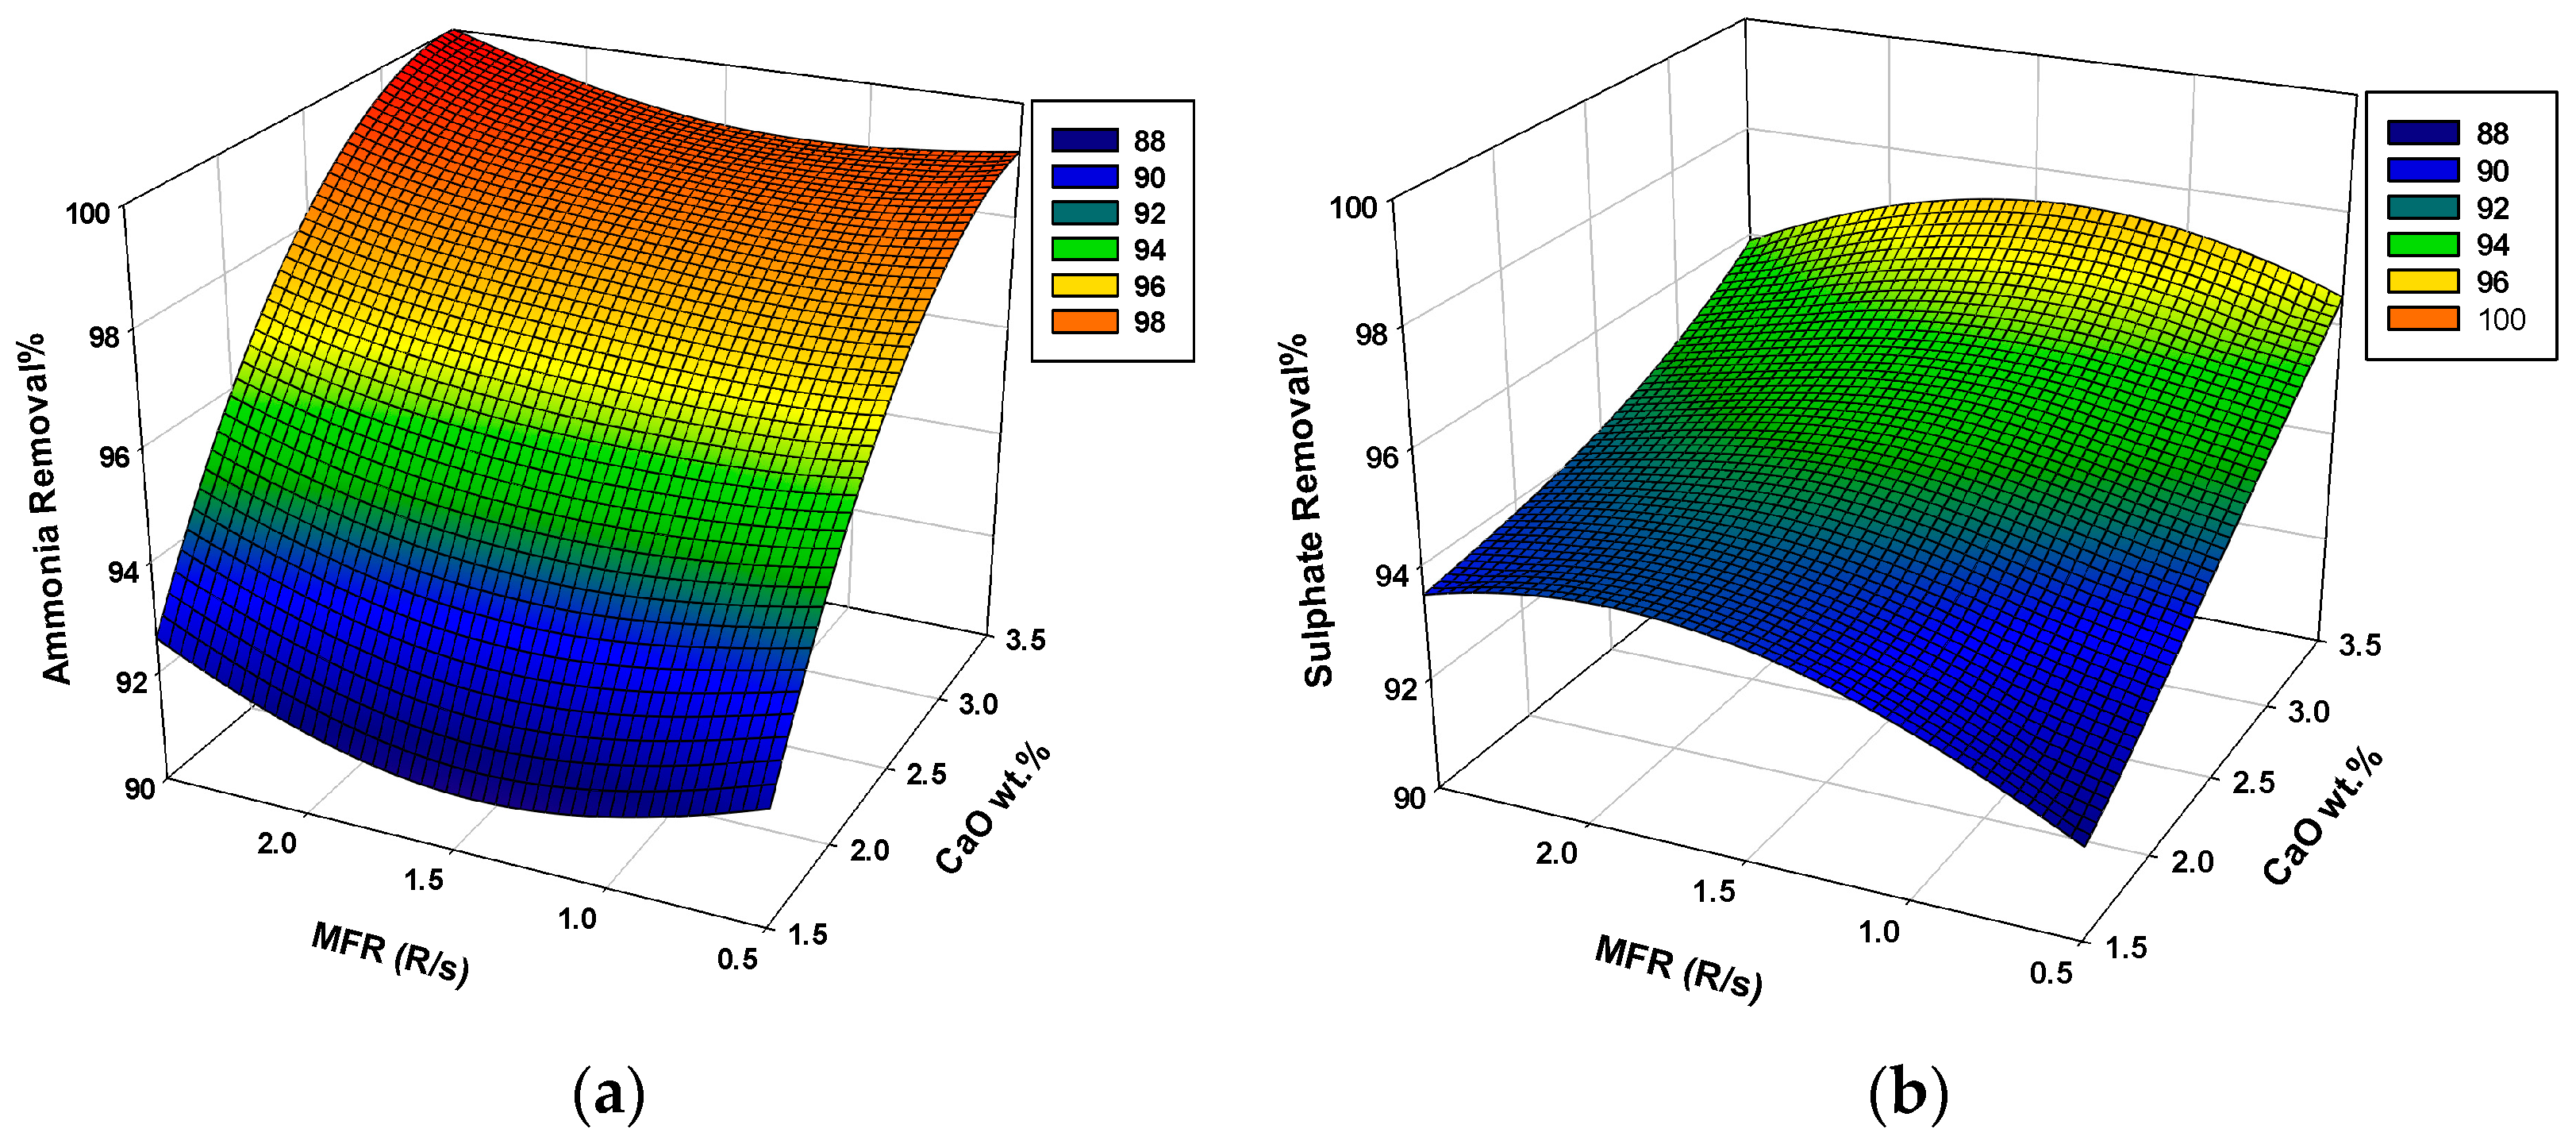
3.1.4. Effect of Mixing Rate

Figure 8a,b demonstrate the 3-D plots of ammonia and sulfate removal as a function of mixing flow rate, respectively. In general, ammonia removal was enhanced by increasing the mixing rate. This can be related to the decrease in gas transfer resistance (limitations) inside the mixture bulk. For sulfate removal, a double effect for mixing rate was observed; this can be related to the interaction effect between other factors, where in one case, increasing the mixing rate up to 2 R/s increases the sulfate removal due to enhancing ion transfer, while further increases in mixing rates show a negative effect due to increasing the solubility of the formed solid product (calcium sulfate).

3.2. RSM Methodology

Four variables were studied at the maximum and minimum levels of +1 and −1, respectively [37]: calcium oxide concentration (2–3 g/100 mL), current density (10–20 mA/cm2), reaction temperature (20–30 °C), and mixing rate (1–2 R/S). Ammonia and sulfate removal were calculated as the target responses. The maximum ammonia and sulfate removal were 99.80% and 97.40%, respectively, while the minimum ammonia and sulfate removal were 91.00% and 92.30%, respectively. Experimental conditions, experimental results, and predicted results according to the CCD design are shown in Table A2.
The second-order regression equation provided the levels of ammonia and sulfate removal as a function of CaO concentration, current density, temperature, and mixing ratio, which can be expressed with the following equations:
Ammonia Removal% = 68.84 + 18.56 X1 + 0.440 X2 − 0.450 X3 + 0.28 X4 − 2.469 X12 − 0.00174 X22 + 0.01176 X32 + 0.396 X42 − 0.1178 X1X2 − 0.0377 X1X3 + 0.133 X1X4 + 0.00613 X2X3 − 0.0447 X2X4 − 0.0307 X3X4
Sulfate Removal% = 42.57 + 22.27 X1 + 1.826 X2 + 0.322 X3 + 9.98 X4 − 3.892 X12 − 0.06051 X22 − 0.00863 X32 − 2.583 X42 + 0.0260 X1X2+ 0.0285 X1X3 − 0.430 X1X4 − 0.00550 X2X3 + 0.0185 X2X4- 0.0450 X3X4

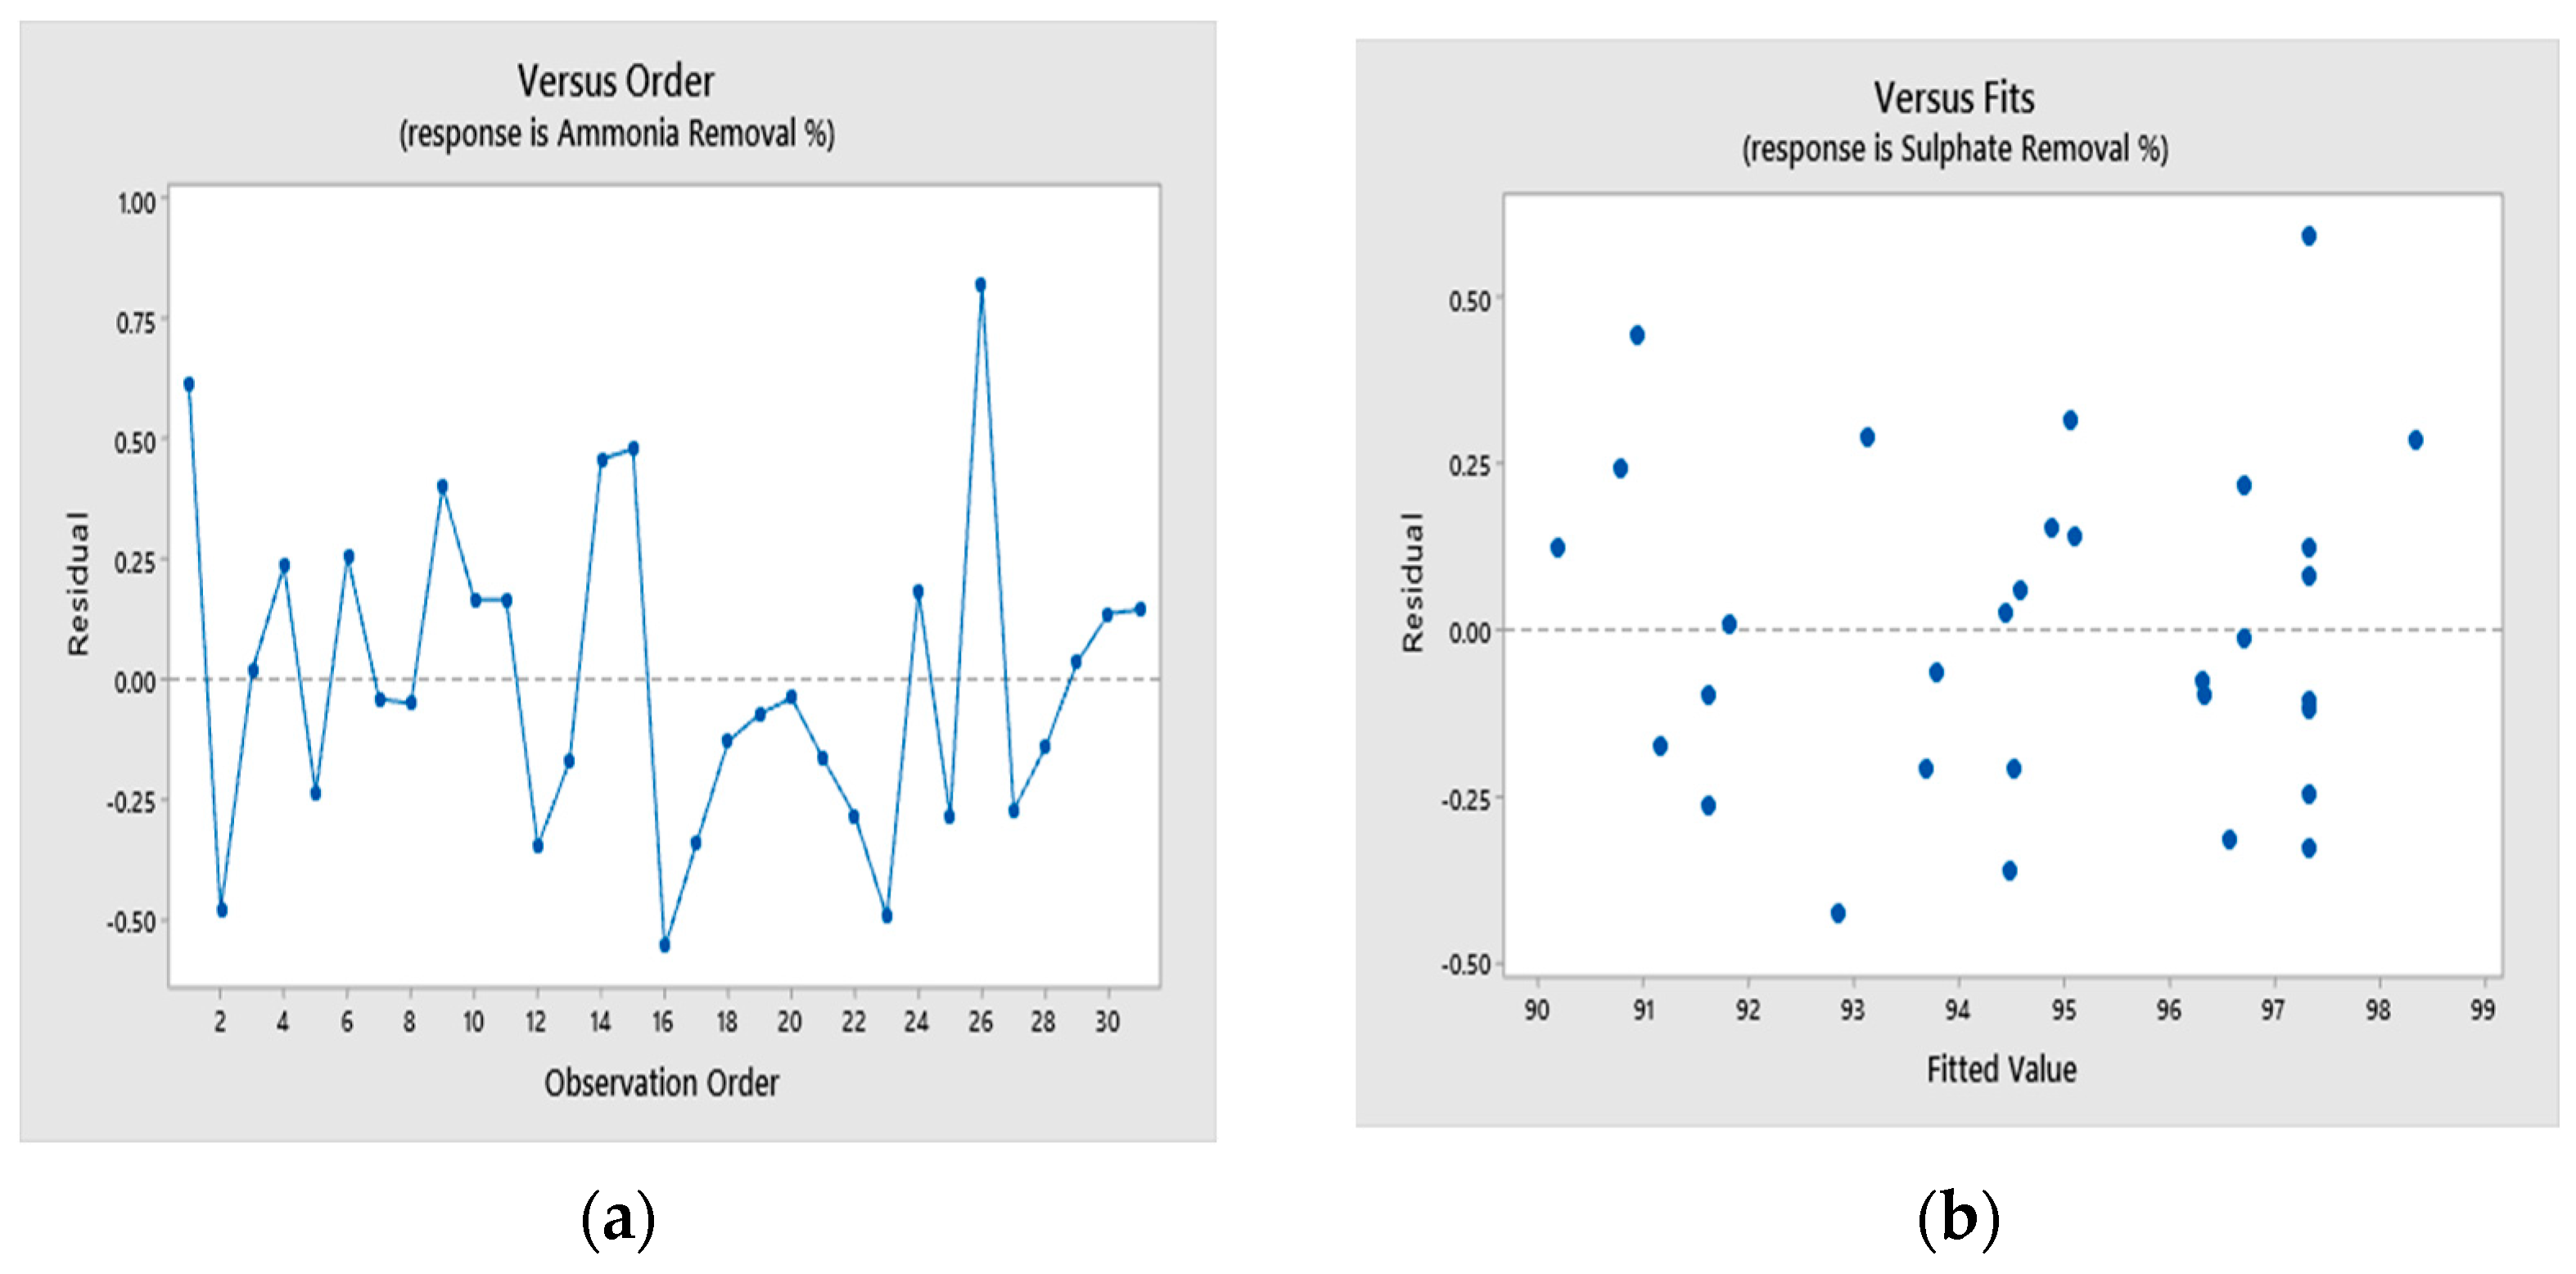
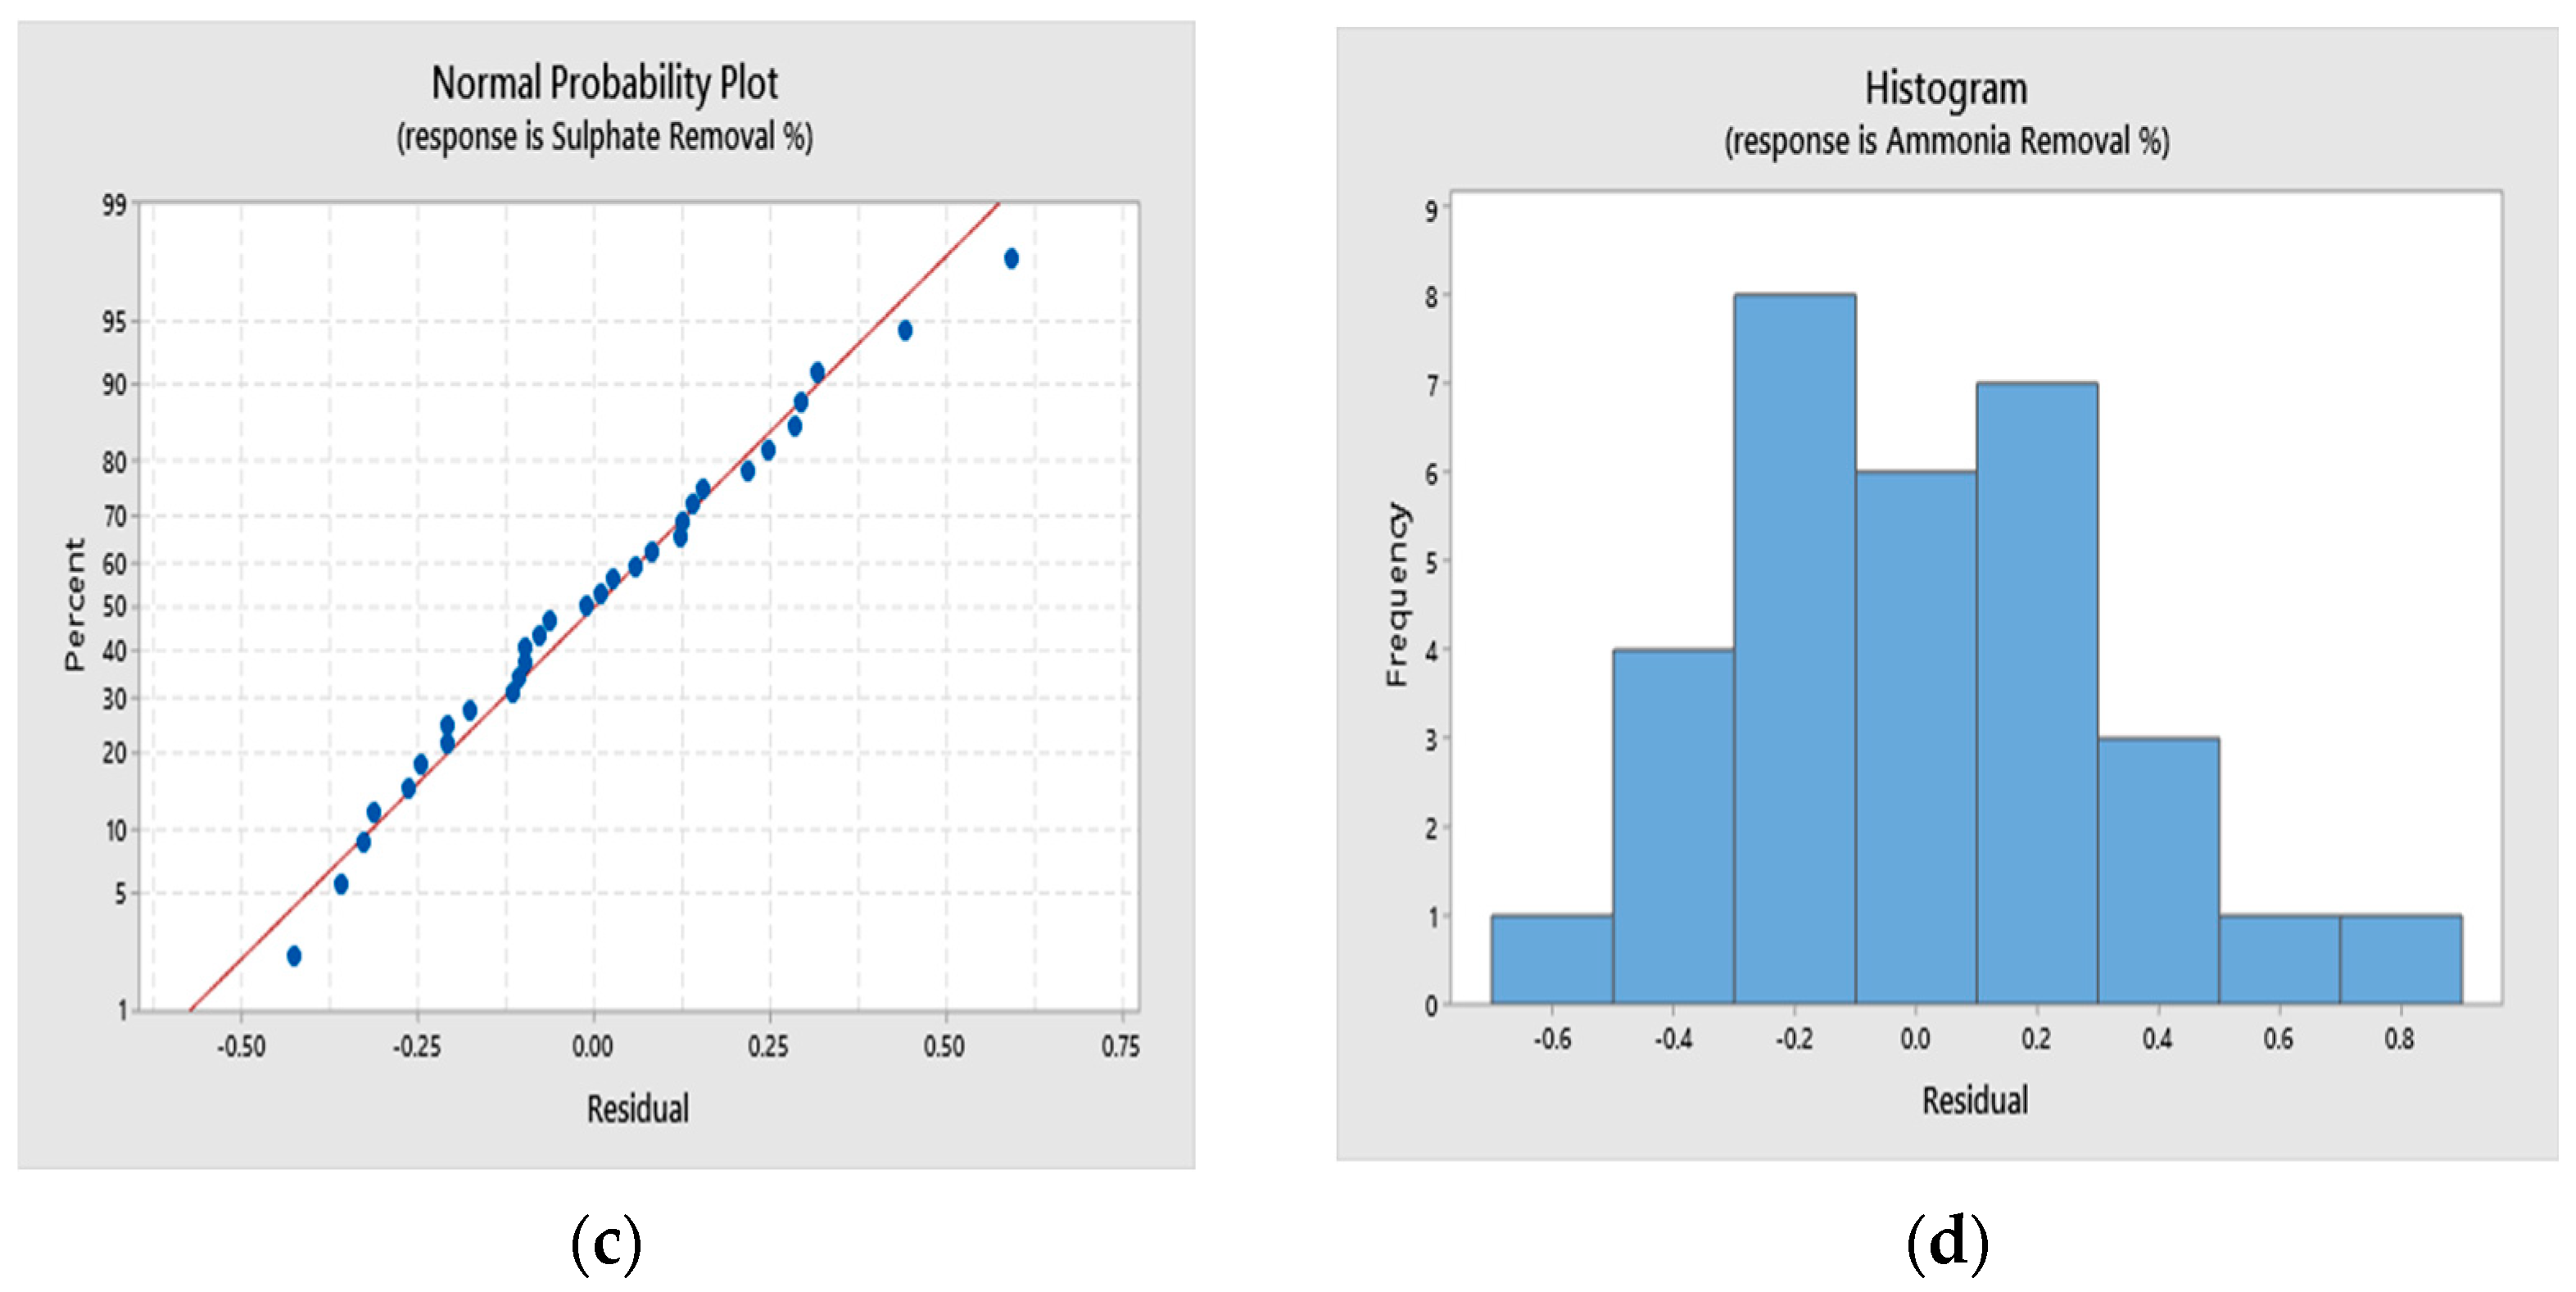
3.3. Analysis of Variance and Model Fitting

ANOVA for the response surface second-order polynomial model of ammonia and sulfate removal is listed in Table A3 and Table A4, respectively. A statistically valid model was established, indicated by a p-value less than 0.05 and a lack of fit that proved to be statistically insignificant, possessing a p-value exceeding 0.05. Among the notable factors, CaO concentration, current density, and temperature demonstrated statistical significance with p-values below 0.05. Strong consistency was observed in the ammonia and sulfate removal models, with the predicted R-squared values (0.974 and 0.9897) closely aligning with the adjusted R-squared values (0.9514 and 0.9808) for each, respectively.
The model equations in terms of significant factors can be shown as the following:
Ammonia Removal% = 68.84 + 18.56 X1 + 0.440 X2 − 0.450 X3 − 2.469 X12 + 0.01176 X32 − 0.1178 X1X2
Sulfate Removal% = 42.57 + 22.27 X1 + 1.826 X2 + 0.322 X3 − 3.892 X12
− 0.06051 X22 − 0.00863 X32 − 2.583 X42
The residual analysis plots shown in Figure 9a–d confirm the model’s adequacy. Figure 4a,b show that there were no outliers for either response, as all residuals fell within the range of −1 to + 1 and were randomly distributed around zero. The fluctuation also indicates that the residuals are independent of one another and have a constant variance. The data are normally distributed, as shown in Figure 9c,d. This indicates a high degree of correlation between the observed values and predicted values.

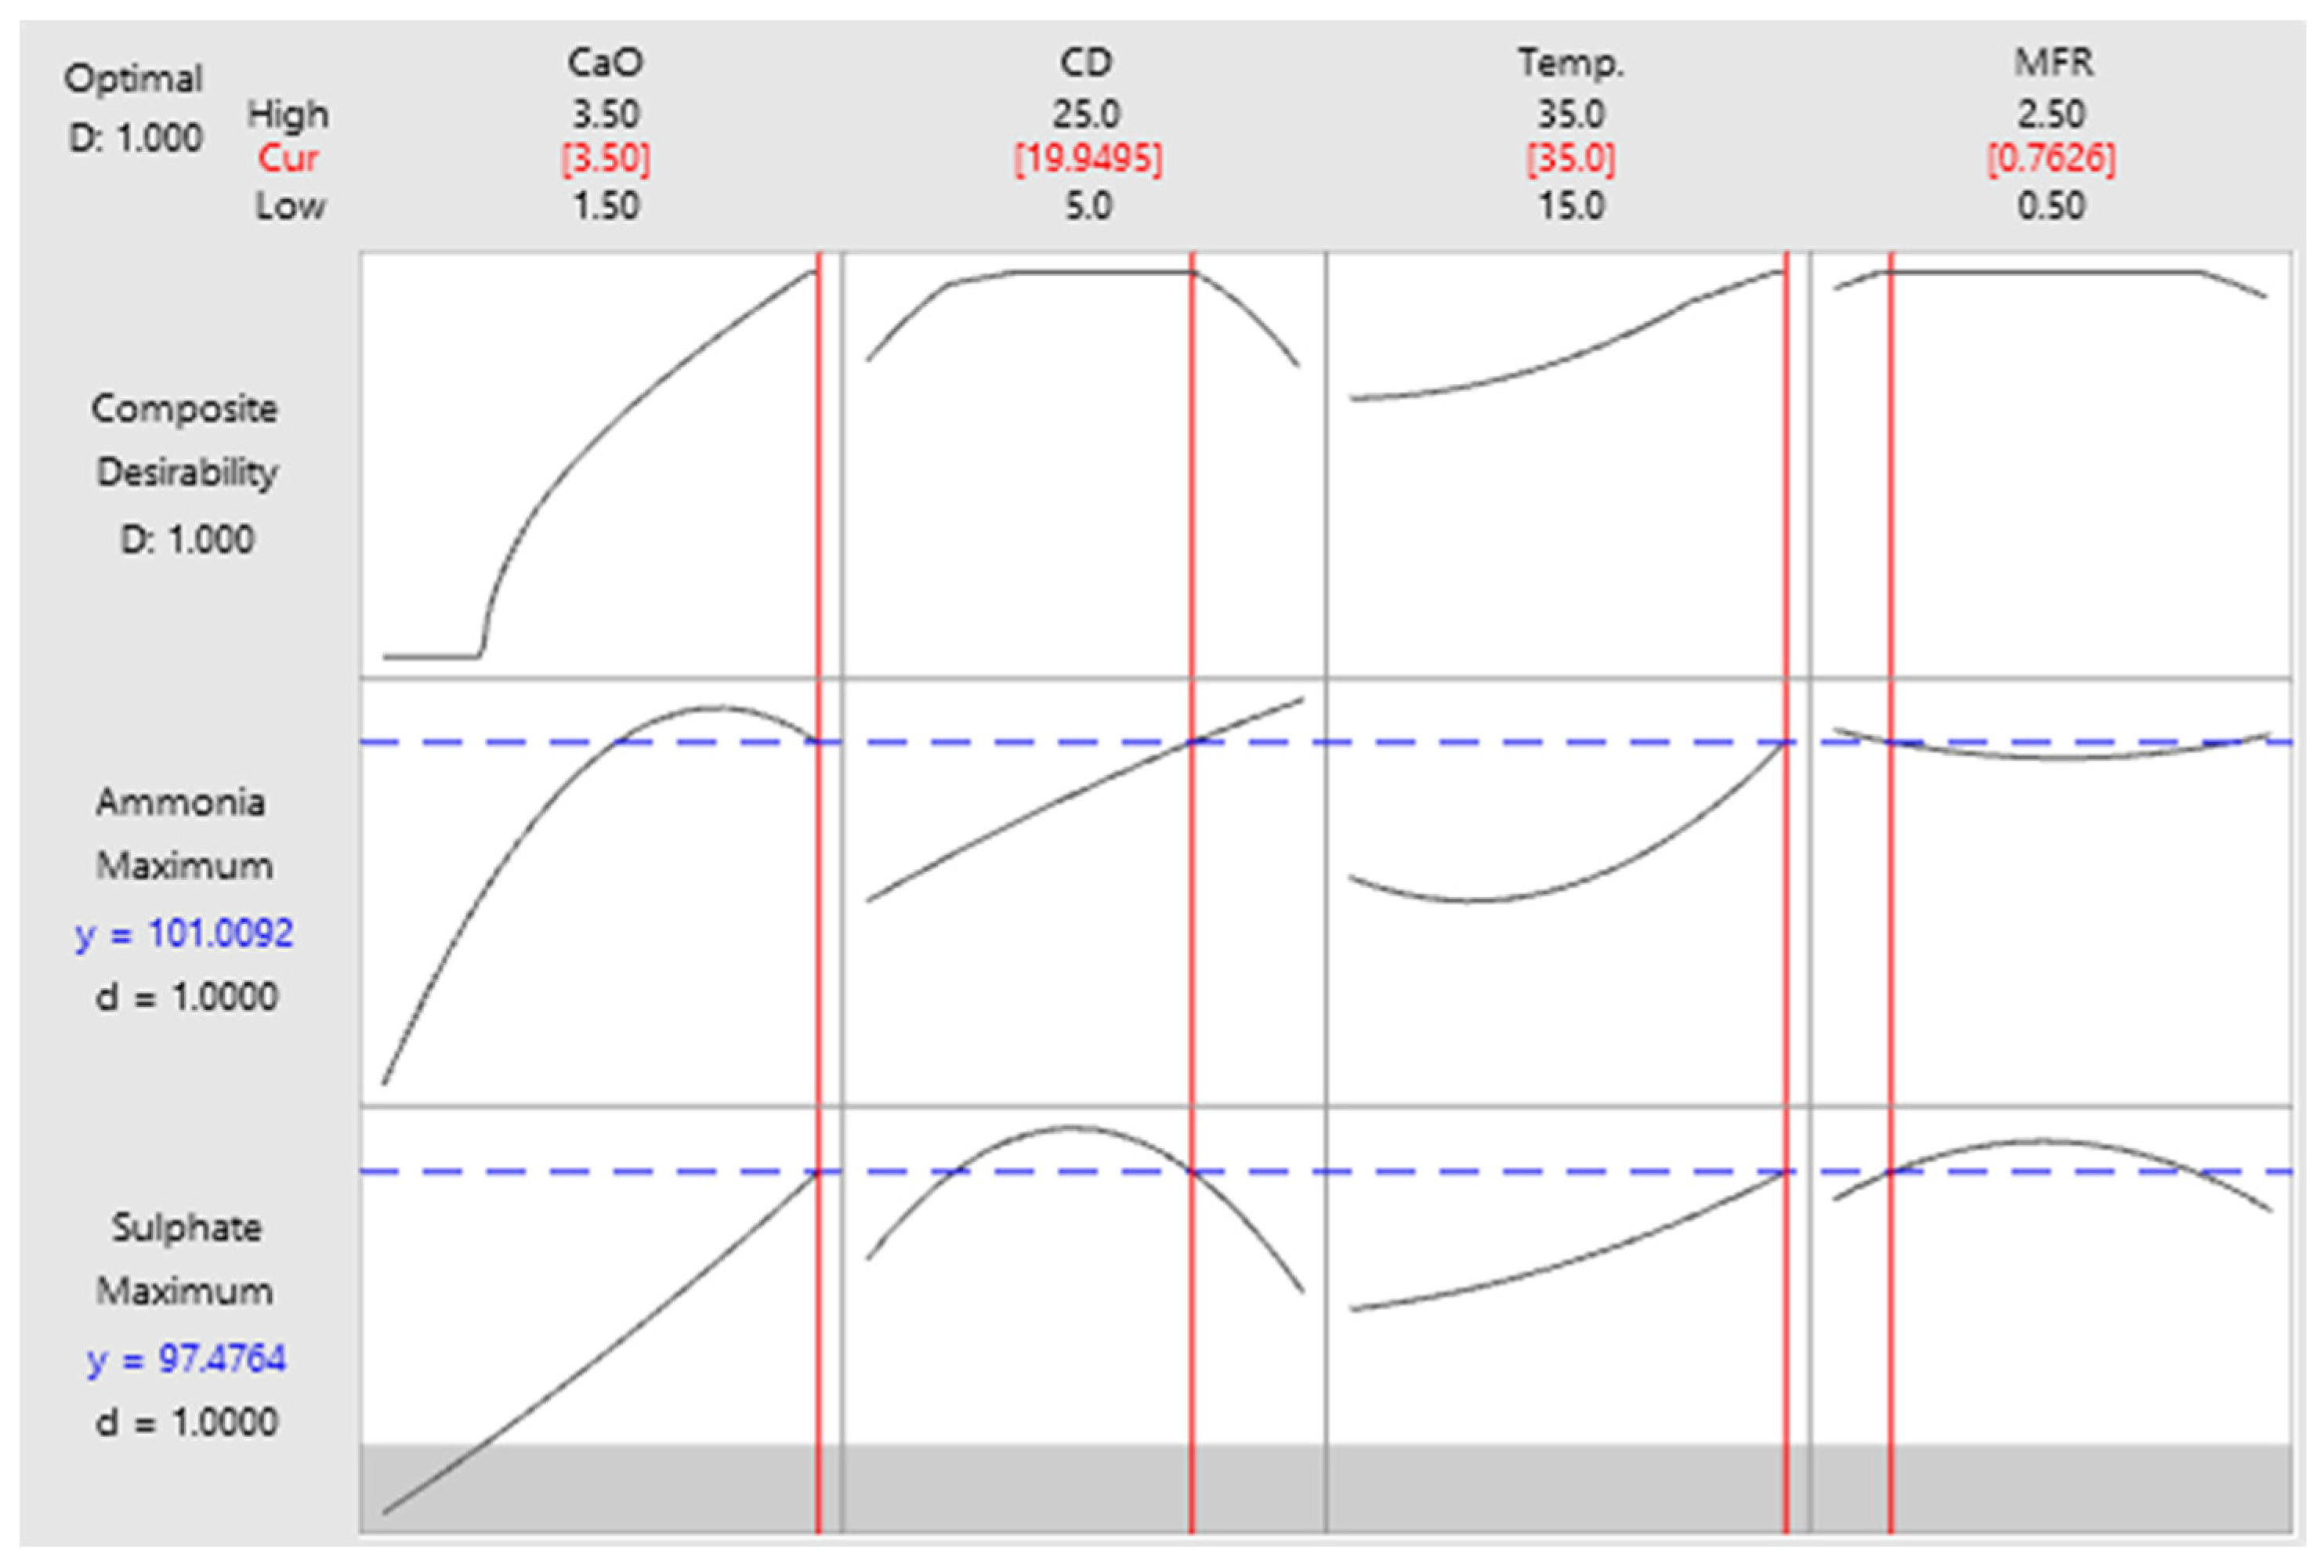
3.4. Process Optimization

The optimization of reaction parameters to achieve a target ammonia and sulfate removal of 100.0% was executed using a response surface optimizer, following the specific criteria outlined in Table A5 [1]. The optimum responses of 99.80% and 97.40% for ammonia and sulfate removal, respectively, were observed at a calcium oxide concentration of 3.5 g/100 mL, a current density of 19.95 mA/cm2, a temperature of 35 °C, and a mixing rate of 0.76 R/s, as shown in Figure 10. A composite desirability score of (1) was documented, indicating that the response closely aligns with the desired target. [4].

3.5. Optimum Conditions Validation

The experimental and forecasted outcomes exhibit remarkable proximity and fall well within the 95.00% confidence interval, underscoring the model’s exceptional predictive capacity regarding process performance across varying conditions. [4]. The experimental and predicted ammonia and sulfate removals at the optimum conditions are listed in Table A6. Figure 11 demonstrates the experimental results, which are in good agreement with the predicted data from the CCD-RSM responses. These data were used before to generate the 3-D plots, as shown in Section 3.1.

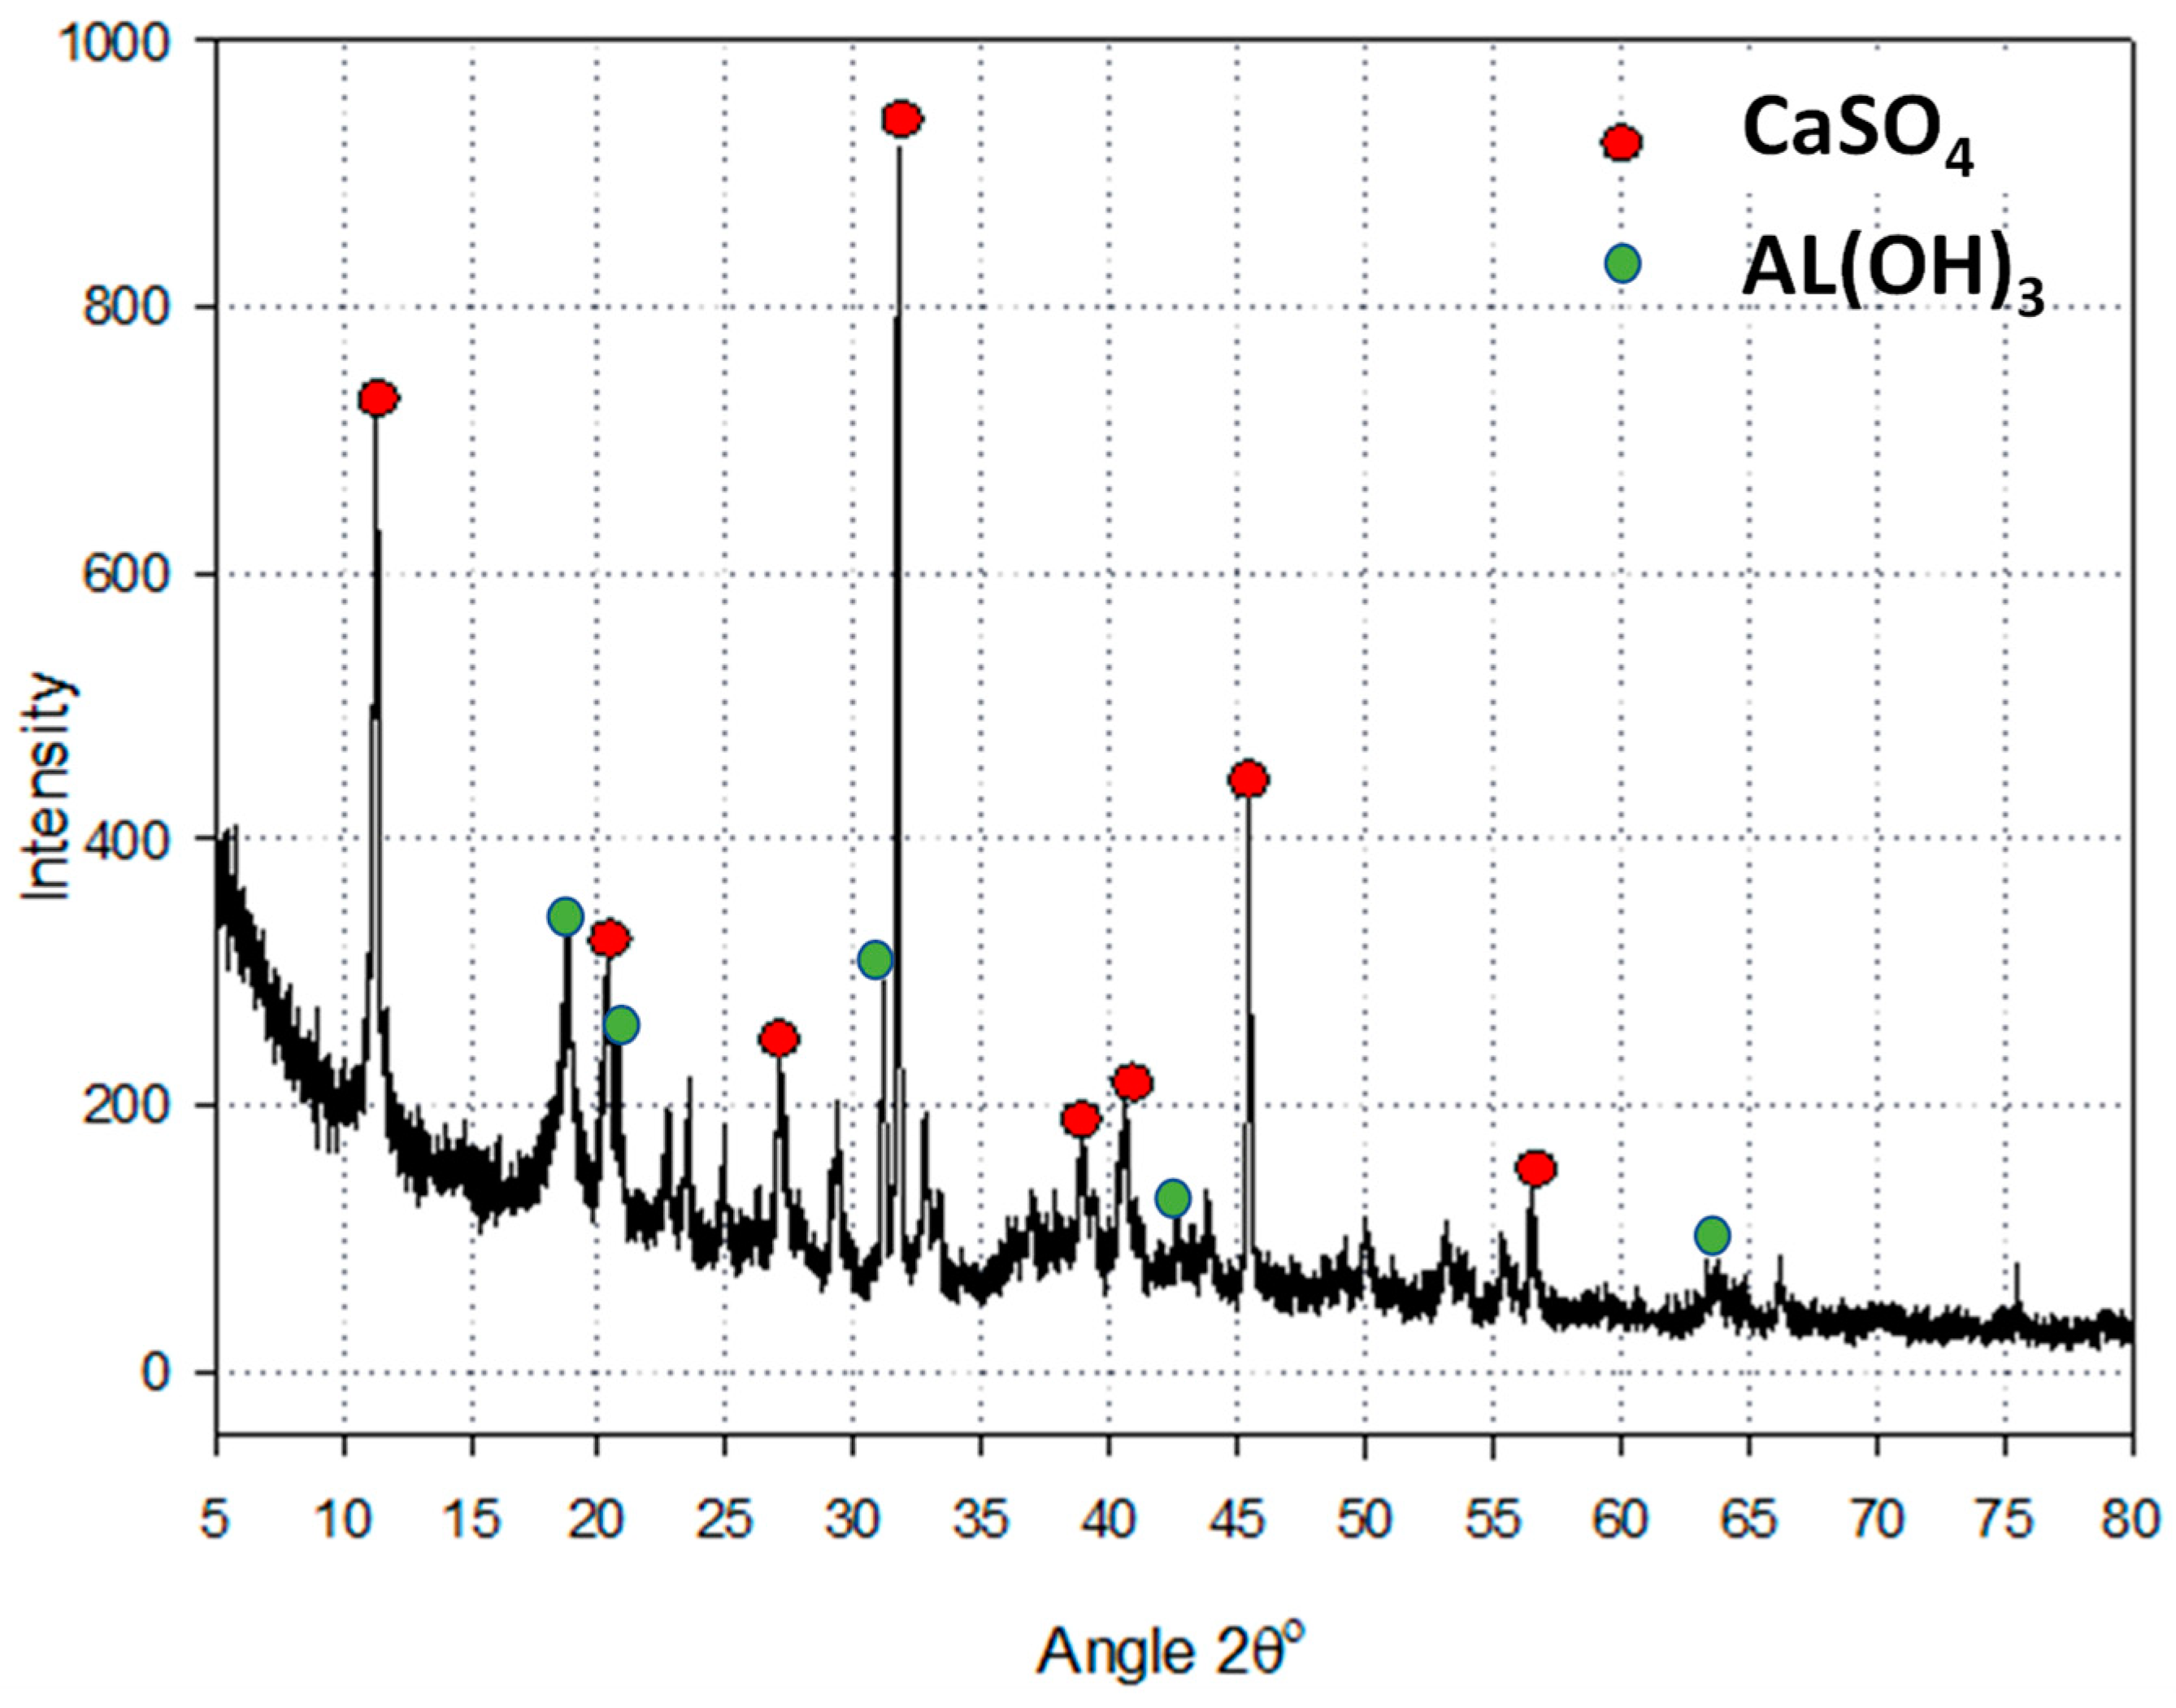
3.6. Solid Characteristics at Optimum Conditions

The optimal conditions, characterized by a calcium oxide concentration of 3.5 g/100 mL, a current density of 19.95 mA/cm2, a temperature of 35 °C, and a mixing rate of 0.76 R/s, were subjected to experimental testing. The resultant solid product was subsequently filtered and subjected to a 24 h drying process at a temperature of 120 °C. An X-ray diffraction (XRD) analysis was conducted on the retrieved product, spanning from 10° to 100° (2θ). Figure 12 displays the XRD analysis for the solid products. The spectra reveal the presence of calcium sulfate in the sample, as indicated by the intensity of the most prominent peak for sulfate minerals in their pure state [40].
The SEM analysis confirms the formation of calcium sulfate, as it has a rectangular, parallelepiped-shaped crystal resembling a needle-like shape [41], as shown in Figure 13.

3.7. Combined Process Feasibility

The cost of the combined process, considering the consumption of the aluminum electrode, includes many factors such as electrode replacement frequency, energy consumption, and the type of alkaline selected. To provide an accurate cost estimation, an economic analysis that considers these factors will be required. In comparison with traditional methods, the cost advantage of the combined process is presented by reducing energy consumption and enhancing the efficiency of ammonia and sulfate removal. The compact process utilizes alkaline materials to minimize energy input, which reduces the operational costs. The exact cost evaluation needs to define the optimum operating conditions, pricing of materials, and energy costs.

4. Conclusions

Most of the technologies used to manage the recovery of sulfate and ammonia face major challenges, including high energy consumption and limited removal efficiency. Combining the recovery of sulfate and ammonia in a single process, namely the electrochemical coagulation process, is considered an innovative idea. Instead of employing a series of separate treatment steps, this was achieved through the gradual integration of two technologies: a sulfate chemical precipitation process and ammonia stripping taking place within a sealed electrocoagulation cell in the presence of CaO. The current research utilized the effluent stream from the Solvay process due to its significant content of sulfate and ammonia. CCD was used in conjunction with RSM to develop statistical models and optimize the combined process for maximum sulfate and ammonia removal. The effects of four process variables on the responses were investigated: calcium oxide concentration, current density, temperature, and mixing rate. The developed quadratic model was adequate and provided a good fit for percentage removal for both sulfate and ammonia. The maximum ammonia and sulfate removals were 99.50% and 96.03%, respectively, at a calcium oxide concentration of 3.5 g/100 mL, a current density of 19.95 mA/cm2, a temperature of 35 °C, and a mixing rate of 0.76 R/s. The process is considered to be cost- and energy-efficient compared to the traditional method. Furthermore, the recovered ammonia gas can be recycled into the Solvay process. The XRD and SEM analyses confirmed the production of calcium sulfate, which has numerous industrial applications. Furthermore, the developed process could be expanded and applied to any wastewater sources containing high levels of sulfate and ammonia.

Author Contributions

Conceptualization, A.F.M. and A.H.A.-M.; methodology, A.F.M., S.H. and A.A.-H.M.; software, A.F.M.; validation, A.F.M., S.H. and A.A.-H.M.; formal analysis, A.F.M., S.H. and A.A.-H.M.; investigation, A.F.M., S.H. and A.A.-H.M.; resources, A.H.A.-M.; data curation, A.F.M.; writing—original draft preparation, A.F.M., S.H., A.A.-H.M. and A.H.A.-M.; writing—review and editing, A.F.M., S.H. and A.A.-H.M.; visualization, A.F.M., S.H. and A.A.-H.M.; supervision, A.H.A.-M., M.H.E.-N., B.V.d.B. and M.H.A.-M.; project administration, A.H.A.-M. and M.H.A.-M.; funding acquisition, A.H.A.-M. All authors have read and agreed to the published version of the manuscript.

Funding

This research was funded by the United Arab Emirates University, grant number G00002622.

Data Availability Statement

All data are available upon request.

Conflicts of Interest

The authors declare no conflict of interest.

Appendix A

Table A1. Range and level of process variables for CCD runs.
Level
FactorsTagSymbolUnits−α−10+1
CaO concentrationCX1g/100 mL1.522.533.5
Current densityCDX2mA/cm2510152025
TemperatureTX3 °C1520253035
Mixing rateMFRX4R/S0.511.522.5
Table A2. CCD experimental design, the measured and predicted responses.
#X1X2X3X4Ammonia Removal% Exp.Ammonia Removal% Pred.Sulfate Removal% Exp.
12.515251.597.8997.2895.61
232030199.4699.9495.24
331030198.2398.2196.42
421020193.4893.2595.21
52.515251.597.0497.2895.77
62.515251.597.5397.2895.22
731020197.6297.6696.03
831020298.4198.4696.87
93.515251.598.9198.5197.41
102.515251.597.4497.2895.02
1131030298.8798.7096.07
122.515251.596.9397.2895.22
1322020195.3795.5492.42
142.515351.599.899.3495.03
1521020294.3993.9194.91
1632030299.4399.9995.42
1722020295.4295.7693.78
182.515151.597.4397.5696.42
191.515251.591.0391.1093.74
2032020198.7498.7895.034
212.515251.597.1197.2895.89
2221030294.2594.5393.24
232.55251.594.8295.3192.73
242.515252.598.2198.0394.21
252.515251.596.9997.2895.34
262.525251.599.7198.8992.33
2722030196.8197.0892.41
2832020298.9999.1393.58
2922030297.0396.9994.67
3021030194.3194.1793.56
312.515250.597.4697.3294.03
Table A3. ANOVA analysis for ammonia removal%.
SourceDFAdj
SS
Adj
MS
F-Valuep-Value
Model14124.4368.88842.970.000
Linear4107.07126.768129.390.000
X1182.32582.325397.960.000
X2119.20719.20792.840.000
X314.7794.77923.100.000
X410.7600.7603.670.073
Square415.1483.78718.310.000
X12110.89910.89952.690.000
X2210.0540.0540.260.615
X3212.4702.47011.940.003
X4210.2800.2801.350.262
2-Way Interaction62.2170.3701.790.166
X1X211.3871.3876.700.020
X1X310.1430.1430.690.419
X1X410.0180.0180.080.775
X2X310.3750.3751.810.197
X2X410.2000.2000.970.340
X3X410.0950.0950.460.509
Error163.3100.207
Lack-of-Fit102.5570.2562.040.198
Pure Error60.7530.126
Total30127.746
Table A4. ANOVA analysis for sulfate removal%.
SourceDFAdj
SS
Adj
MS
F-Valuep-Value
Model14176.90312.636110.280.000
Linear486.58421.646188.920.000
X1164.06664.066559.160.000
X210.7020.7026.130.025
X3121.24021.240185.380.000
X410.5760.5765.030.039
Square489.44622.361195.170.000
X12127.07227.072236.280.000
X22165.43865.438571.130.000
X3211.3331.33311.630.004
X42111.92911.929104.110.000
2-Way Interaction60.8730.1461.270.325
X1X210.0680.0680.590.454
X1X310.0810.0810.710.412
X1X410.1850.1851.610.222
X2X310.3020.3032.640.124
X2X410.0340.0340.300.592
X3X410.2020.2031.770.202
Error161.8330.115
Lack-of-Fit101.2660.1271.340.374
Pure Error60.5670.095
Total30178.736
Table A5. Optimization criteria for ammonia and sulfate removal approach.
ResponseGoalLowerTargetUpperWeightImportance
Ammonia removal%Maximum91.0399.8099.8011
Sulfate removal%Maximum92.3397.4197.4111
Table A6. Validation test results for CCD design and optimizer outputs.
Optimizer OutputX1X2X3X4Ammonia Removal% Pred.Ammonia Removal% Exp.Ammonia
95% CI
3.519.95350.7699.8099.3098.82–100
3.519.95350.7699.8099.5098.82–100
Optimizer OutputX1X2X3X4Sulfate Removal% Pred.Sulfate Removal% Exp.Sulfate
95% CI
3.519.95350.7697.4197.5694.46–100
3.519.95350.7697.4196.0394.46–100

References

  1. Mohammad, A.F.; Al-Marzouqi, A.H.; El-Naas, M.H.; Van der Bruggen, B.; Al-Marzouqi, M.H. A new process for the recovery of ammonia from ammoniated high-salinity brine. Sustainability 2021, 13, 10014. [Google Scholar] [CrossRef]
  2. Mohammad, A.F.; Al-Marzouqi, A.H.; El-Naas, M.H.; Van der Bruggen, B.; Al-Marzouqi, M.H.; Al Musharfy, M.; Suleiman, M. Enhanced sulfate recovery from high salinity reject brine through simultaneous chemical precipitation and electrocoagulation. J. Clean. Prod. 2023, 422, 138599. [Google Scholar] [CrossRef]
  3. Mohammad, A.F.; Mourad, A.A.-H.; Al-Marzouqi, A.H.; El-Naas, M.H.; Van der Bruggen, B.; Al-Marzouqi, M.H. Multistage modified Solvay process based on calcium oxide for carbon dioxide capture and reject brine desalination. Sep. Purif. Technol. 2023, 328, 125000. [Google Scholar] [CrossRef]
  4. Mohammad, A.F.; El-Naas, M.H.; Al-Marzouqi, A.H.; Suleiman, M.; Al Musharfy, M. Optimization of magnesium recovery from reject brine for reuse in desalination post-treatment. J. Water Process Eng. 2019, 31, 100810. [Google Scholar] [CrossRef]
  5. Mugwili, M.E.; Waanders, F.B.; Masindi, V.; Fosso-Kankeu, E. Effective removal of ammonia from aqueous solution through struvite synthesis and breakpoint chlorination: Insights into the synergistic effects of the hybrid system. J. Environ. Manag. 2023, 334, 117506. [Google Scholar] [CrossRef]
  6. Sharma, N.; Mohapatra, S.; Padhye, L.P.; Mukherji, S. Role of precursors in the formation of trihalomethanes during chlorination of drinking water and wastewater effluents from a metropolitan region in western India. J. Water Process Eng. 2021, 40, 101928. [Google Scholar] [CrossRef]
  7. Ding, Y.; Sartaj, M. Optimization of ammonia removal by ion-exchange resin using response surface methodology. Int. J. Environ. Sci. Technol. 2016, 13, 985–994. [Google Scholar] [CrossRef]
  8. Deng, L.; Ngo, H.H.; Guo, W.; Zhang, H. Pre-coagulation coupled with sponge-membrane filtration for organic matter removal and membrane fouling control during drinking water treatment. Water Res. 2019, 157, 155–166. [Google Scholar] [CrossRef] [PubMed]
  9. Hasan, H.A.; Abdullah, S.R.S.; Kamarudin, S.K.; Kofli, N.T.; Anuar, N. Kinetic evaluation of simultaneous COD, ammonia and manganese removal from drinking water using a biological aerated filter system. Sep. Purif. Technol. 2014, 130, 56–64. [Google Scholar] [CrossRef]
  10. Yan, Z.; Jiang, Y.; Liu, L.; Li, Z.; Chen, X.; Xia, M.; Fan, G.; Ding, A. Membrane distillation for wastewater treatment: A mini Review. Water 2021, 13, 3480. [Google Scholar] [CrossRef]
  11. Li, Z.; Zhang, P.; Guan, K.; Gonzales, R.R.; Ishigami, T.; Xue, M.; Yoshioka, T.; Matsuyama, H. An experimental study on recovering and concentrating ammonia by sweep gas membrane distillation. Process Saf. Environ. Prot. 2023, 171, 555–560. [Google Scholar] [CrossRef]
  12. Ranade, V.V.; Bhandari, V.M. Industrial Wastewater Treatment, Recycling and Reuse; Butterworth-Heinemann: Oxford, UK, 2014. [Google Scholar]
  13. Hasanoğlu, A.; Romero, J.; Pérez, B.; Plaza, A. Ammonia removal from wastewater streams through membrane contactors: Experimental and theoretical analysis of operation parameters and configuration. Chem. Eng. J. 2010, 160, 530–537. [Google Scholar] [CrossRef]
  14. Ellersdorfer, M.; Pesendorfer, S.; Stocker, K. Nitrogen recovery from swine manure using a zeolite-based process. Processes 2020, 8, 1515. [Google Scholar] [CrossRef]
  15. de Carvalho Pinto, P.C.; Da Silva, T.R.; Linhares, F.M.; De Andrade, F.V.; de Oliveira Carvalho, M.M.; De Lima, G.M. A integrated route for CO2 capture in the steel industry and its conversion into CaCO3 using fundamentals of Solvay process. Clean Technol. Environ. Policy 2016, 18, 1123–1139. [Google Scholar] [CrossRef]
  16. Bowell, R.J.; Dill, S.; Cowan, J.; Wood, A. A review of sulfate removal options for mine waters. Proc. Mine Water 2004, 75–88. [Google Scholar]
  17. INAP. Treatment of Sulphate in Mine Effluents; INAP: Atlanta, GA, USA, 2003. [Google Scholar]
  18. Fernando, W.A.M.; Ilankoon, I.M.S.K.; Syed, T.H.; Yellishetty, M. Challenges and opportunities in the removal of sulphate ions in contaminated mine water: A review. Miner. Eng. 2018, 117, 74–90. [Google Scholar] [CrossRef]
  19. Kartic, D.N.; Narayana, B.C.A.; Arivazhagan, M. Removal of high concentration of sulfate from pigment industry effluent by chemical precipitation using barium chloride: RSM and ANN modeling approach. J. Environ. Manag. 2018, 206, 69–76. [Google Scholar] [CrossRef] [PubMed]
  20. Darbi, A.; Viraraghavan, T.; Jin, Y.-C.; Braul, L.; Corkal, D. Sulfate removal from water. Water Qual. Res. J. 2003, 38, 169–182. [Google Scholar] [CrossRef]
  21. Fu, F.; Wang, Q. Removal of heavy metal ions from wastewaters: A review. J. Environ. Manag. 2011, 92, 407–418. [Google Scholar] [CrossRef]
  22. Masindi, V.; Osman, M.S.; Abu-Mahfouz, A.M. Integrated treatment of acid mine drainage using BOF slag, lime/soda ash and reverse osmosis (RO): Implication for the production of drinking water. Desalination 2017, 424, 45–52. [Google Scholar] [CrossRef]
  23. Kiran, M.G.; Pakshirajan, K.; Das, G. Heavy metal removal from multicomponent system by sulfate reducing bacteria: Mechanism and cell surface characterization. J. Hazard. Mater. 2017, 324, 62–70. [Google Scholar] [CrossRef]
  24. Kijjanapanich, P.; Annachhatre, A.P.; Esposito, G.; van Hullebusch, E.D.; Lens, P.N.L. Biological sulfate removal from gypsum contaminated construction and demolition debris. J. Environ. Manag. 2013, 131, 82–91. [Google Scholar] [CrossRef] [PubMed]
  25. Chibani, A.; Ncib, S.; Barhoumi, A.; Bouguerra, W.; Elaloui, E. Box-Behnken design optimization of sulfate reduction from natural water by electrocoagulation process. Phosphorus Sulfur Silicon Relat. Elem. 2023, 198, 164–171. [Google Scholar] [CrossRef]
  26. Huang, J.; Zeng, C.; Luo, H.; Lin, S.; Liu, G.; Zhang, R. Sulfate removal from the seawater using single-chamber bioelectrochemical system. Desalination 2023, 545, 116170. [Google Scholar] [CrossRef]
  27. Öztürk, Y.; Ekmekçi, Z. Removal of sulfate ions from process water by ion exchange resins. Miner. Eng. 2020, 159, 106613. [Google Scholar] [CrossRef]
  28. Tang, X.; Hu, L.; Zhang, Y.; Cheng, N.; Liang, H.; Wang, J.; Li, G. Sulfate and divalent cations recovery from municipal nanofiltration concentrate using two-step ion exchange membrane electrolysis. Desalination 2022, 541, 116055. [Google Scholar] [CrossRef]
  29. Mamelkina, M.A.; Cotillas, S.; Lacasa, E.; Sáez, C.; Tuunila, R.; Sillanpää, M.; Häkkinen, A.; Rodrigo, M.A. Removal of sulfate from mining waters by electrocoagulation. Sep. Purif. Technol. 2017, 182, 87–93. [Google Scholar] [CrossRef]
  30. Teng, W.; Liu, S.; Zhang, X.; Zhang, F.; Yang, X.; Xu, M.; Hou, J. Reliability Treatment of Silicon in Oilfield Wastewater by Electrocoagulation. Water 2023, 15, 206. [Google Scholar] [CrossRef]
  31. Khorasanipour, M.; Moore, F.; Naseh, R. Lime treatment of mine drainage at the sarcheshmeh porphyry copper mine. Iran. Mine Water Environ. 2011, 30, 216–230. [Google Scholar] [CrossRef]
  32. Nariyan, E.; Wolkersdorfer, C.; Sillanpää, M. Sulfate removal from acid mine water from the deepest active European mine by precipitation and various electrocoagulation configurations. J. Environ. Manag. 2018, 227, 162–171. [Google Scholar] [CrossRef]
  33. Lee, H.J.; Oh, S.J.; Moon, S.H. Recovery of ammonium sulfate from fermentation waste by electrodialysis. Water Res. 2003, 37, 1091–1099. [Google Scholar] [CrossRef]
  34. Luiz, A.; Handelsman, T.; Barton, G.; Coster, H.; Kavanagh, J. Membrane treatment options for wastewater from cellulosic ethanol biorefineries. Desalination Water Treat. 2015, 53, 1547–1558. [Google Scholar] [CrossRef]
  35. Roine, A. HSC—Software ver. 3.0 for thermodynamic calculations. In Proceedings of the International Symposium on Computer Software in Chemical and Extractive Metallurgy; Thompson, W.T., Ajersch, F., Eriksson, G., Eds.; Pergamon: Oxford, UK, 1989; pp. 1–529. [Google Scholar]
  36. Antony, J. 6—Full Factorial Designs. In Design of Experiments for Engineers and Scientists, 2nd ed.; Antony, J., Ed.; Elsevier: Oxford, UK, 2014; pp. 63–85. [Google Scholar]
  37. Anderson-Cook, C.M.; Borror, C.M.; Montgomery, D.C. Response surface design evaluation and comparison. J. Stat. Plan. Inference 2009, 139, 629–641. [Google Scholar] [CrossRef]
  38. Jorgensen, T.C.; Weatherley, L.R. Ammonia removal from wastewater by ion exchange in the presence of organic contaminants. Water Res. 2003, 37, 1723–1728. [Google Scholar] [CrossRef] [PubMed]
  39. Azimi, G.; Papangelakis, V.G.; Dutrizac, J.E. Modelling of calcium sulphate solubility in concentrated multi-component sulphate solutions. Fluid Phase Equilibria 2007, 260, 300–315. [Google Scholar] [CrossRef]
  40. Database, M. Available online: http://www.webmineral.com/ (accessed on 2 November 2022).
  41. Shakkthivel, P.; Ramesh, D.; Sathiyamoorthi, R.; Vasudevan, T. Water soluble copolymers for calcium carbonate and calcium sulphate scale control in cooling water systems. J. Appl. Polym. Sci. 2005, 96, 1451–1459. [Google Scholar] [CrossRef]
Figure 1. Enthalpy (—ΔH) and Gibbs free energy (—ΔG) of Equation (5) at the stoichiometric molar ratio.
Sustainability 15 16534 g001
Figure 2. (a) The schematic diagram for the electrocoagulation cell for the recovery of NH3 and SO42− from the treated effluent of the Solvay process [1], and (b) a real picture of the treated brine samples with collected solids after the compact process using CaO “Adapted with permission from Ref. [3]. 2023, Elsevier Science & Technology Journals”.
Sustainability 15 16534 g002
Figure 3. A schematic diagram of the main inputs and outputs of the combined process.
Sustainability 15 16534 g003
Figure 4. The 3-D plots of the effect of current density and calcium oxide concentration on (a) ammonia removal% and (b) sulfate removal%.
Sustainability 15 16534 g004
Figure 5. The 3-D plots of the effect of current density and temperature on (a) ammonia removal% and (b) sulfate removal%.
Sustainability 15 16534 g005
Figure 6. The 3-D plots of the effect of calcium oxide concentration and temperature on (a) ammonia removal% and (b) sulfate removal%.
Sustainability 15 16534 g006
Figure 7. Solubility of calcium sulfate as a function of temperature (°C) “Adapted with permission from Ref. [39]. 2023, Elsevier”.
Sustainability 15 16534 g007
Figure 8. The 3-D plots of the effect of calcium oxide concentration and mixing flow rate on (a) ammonia removal% and (b) sulfate removal%.
Sustainability 15 16534 g008
Figure 9. Residual plots for ammonia and sulfate removal. (a) Versus order, (b) versus fits, (c) normal probability plot, and (d) histogram.
Sustainability 15 16534 g009aSustainability 15 16534 g009b
Figure 10. The optimum calcium oxide concentration, current density, temperature, and mixing rate to have maximum ammonia and sulfate removal.
Sustainability 15 16534 g010
Figure 11. Effects of (a) CaO concentration; (b) current density on ammonia and sulfate removal percentage.
Sustainability 15 16534 g011
Figure 12. XRD analysis for the recovered solid products from the combined approach at the optimum condition for maximum ammonia and sulfate removal for 2θ ranging from 10 to 100°.
Sustainability 15 16534 g012
Figure 13. SEM and EDS analysis of the solid products collected at the optimum condition for the combined approach.
Sustainability 15 16534 g013
Disclaimer/Publisher’s Note: The statements, opinions and data contained in all publications are solely those of the individual author(s) and contributor(s) and not of MDPI and/or the editor(s). MDPI and/or the editor(s) disclaim responsibility for any injury to people or property resulting from any ideas, methods, instructions or products referred to in the content.

