Article

Trends of High and Low Values of Annual and Seasonal Precipitation in Turkey

Department of Civil Engineering, Tokat Gaziosmanpaşa University, 60150 Tokat, Turkey
Sustainability 2023, 15(23), 16523; https://doi.org/10.3390/su152316523
Submission received: 12 October 2023 / Revised: 27 November 2023 / Accepted: 1 December 2023 / Published: 4 December 2023
(This article belongs to the Section Air, Climate Change and Sustainability)

Abstract

:
The exploration of precipitation data trends using innovative analysis methods is anticipated to offer significant contributions to sustainability across various domains, including water resources management, agricultural planning, climate change understanding, environmental protection, risk assessment, and preparedness. This study employs an improved visualization of the innovative trend analysis (IV-ITA) method for detecting annual and seasonal trends in precipitation variables across 194 stations in Turkey over the period 1969–2020. The outcomes derived from the IV-ITA method were further juxtaposed with the results obtained from the classical Mann–Kendall (MK) test. Using the MK test, statistically significant increasing trends were detected in the annual pattern along the northern coasts of Turkey. Based on the results obtained from the IV-ITA, substantial decreasing trends were identified in the basins within the Southeastern Anatolia Region of Turkey. Conversely, an increasing trend was observed in the basins situated in the northwest. It was also established that an increasing trend was observed throughout Turkey, except for some stations in the low-data group. The most significant increasing trend was noted in the basins along the southern coastline, characterized by the prevalence of the Mediterranean climate. In the high-data group, an increase of up to 50% was noted along the southwest coast. Upon comparing the outcomes derived from the IV-ITA method with those obtained using the MK test, it becomes apparent that the IV-ITA yields significantly more detailed results than the MK test. Additionally, applying the IV-ITA method in climate-sensitive regions and basins is envisioned to enhance the accuracy of assessments, foster a sustainable environment, and improve the effective management of water resources.

1. Introduction

The effects of climate change have recently led researchers to trend analysis studies [1]. Researchers have conducted numerous studies to identify the impact of climate change on time series of different variables such as water quality [2,3], wave height [4], air temperature [5,6,7,8,9,10], precipitation [8,11,12], streamflow [13,14], and evaporation [15]. Precipitation is a significant variable for determining the regional climate and designing hydraulic structures [16]. It is also essential in many issues, such as agricultural production, hydroelectric energy production, supply of drinking water for cities, and sizing of hydraulic structures such as dams [17,18]. Determining the change and trend of the precipitation variable over time is necessary for taking precautions against disasters such as drought and flood. The investigation of rainfall data trends contributes to sustainability in several ways. Understanding the trends in rainfall data is crucial for effective water resource management. It aids in assessing water availability, planning for water use, and implementing sustainable water management practices. In addition, having detailed information on rainfall trends can provide vital information for effective and sustainable agricultural planning. Farmers can benefit from these data and contribute to sustainable agriculture in crop selection, the determination of irrigation type, and budget planning. Identifying trends in precipitation patterns can help researchers and policymakers develop strategies to mitigate and adapt to climate change, the impacts of which are now being felt globally. It also contributes to sustainability in environmental protection. By understanding these trends, conservation efforts can be better targeted to protect vulnerable species and maintain ecological balance, contributing to overall environmental sustainability. In recent years, numerous studies have been conducted worldwide to ascertain the temporal trends of precipitation variables, employing diverse methodologies for trend analysis [19,20,21,22,23,24,25,26,27].
In the literature, trend analysis methods are broadly categorized into two main groups: parametric and non-parametric methods. Parametric methods are deemed more robust, albeit with greater statistical power, yet they come with stringent assumptions like serial independence and the necessity for a normal probability distribution function (PDF). Parametric methods are limited in their ability to account for outliers. In contrast, non-parametric methods address this limitation by accommodating non-normal PDFs and proving useful in scenarios involving outliers [28]. The Mann–Kendall (MK) test is the most commonly employed technique for discerning the trend in time series data [29,30]. Nevertheless, it is worth noting that the MK test assumes the absence of serial correlations in time series. In contrast, many hydro-meteorological variables exhibit substantial serial correlations in their time series data. This divergence highlights a potential limitation of the MK test in scenarios in which serial correlations are a prevalent feature of the data [31]. This method is supported by Sen’s [32] slope calculation procedure. Subsequently, Sen [31,33,34,35] introduced the innovative trend analysis (ITA) method, which is recognized for its simplicity and effectiveness in trend detection. The ITA is characterized by its simplicity in application, representing a novel approach to trend analysis when contrasted with the traditional MK trend analysis [36,37]. The ITA method has garnered significant attention from researchers, who have applied it to time series data of diverse hydro-meteorological variables over the past decade [12,37,38,39,40,41,42,43].
In recent years, many improved versions of the ITA method have been developed by various researchers [13,34,35,44,45,46]. Then, Guclu [11] presented the improved visualization version of the ITA (IV-ITA) method. The ITA method demonstrates the capability to identify and visualize not only monotonically but also non-monotonically evolving trends, encompassing five distinct trend types [11,33]. The new IV-ITA method provides a valuable and beneficial contribution to obtaining more detailed information about time series trends. Unlike other ITA applications, the data numbers are visible in this version. In addition, two sub-categories, “low” and “high”, are defined by determining the change point in the difference series with the universal Pettitt test [11]. Until now, only a limited number of studies have applied the IV-ITA method to discern trends in precipitation time series data [11,17]. These studies strongly advocate adopting the novel IV-ITA approach in assessing trends within time series data of environmental variables, encompassing hydrological, hydro-climatological, and water-quality parameters. Thus, it is thought that more delicate and detailed results can be obtained compared to other classical methods [17].
This study aims to compare the IV-ITA and the classical MK test on precipitation time series recorded for 1969–2020 in 194 meteorological stations across Turkey. The research aims to provide a more refined and enhanced visualization of precipitation trends by applying the IV-ITA to time series data from homogeneous meteorological stations across Turkey. For this purpose, homogeneous stations were determined using various homogeneity tests. Then, trends were determined for the high- and low-data groups of 156 stations, which were found to be homogeneous due to the analysis. It is anticipated that this study will serve as a foundational platform for further research into the impacts of climate change. The study’s importance is underscored by its capacity to provide precise and in-depth evaluations of precipitation patterns in Turkey, facilitating a heightened comprehension of climate fluctuations and their potential repercussions on the environment, agriculture, and water resources. By introducing and implementing an enhanced visualization version, the research actively contributes to continuously enhancing methodologies employed in precipitation trend analysis. This, in turn, furnishes valuable insights for climate studies and informs decision-making processes concerning water resource management. Furthermore, the trend values obtained in the context of this study will provide an opportunity for future comparisons of trend analysis methods yet to be developed.

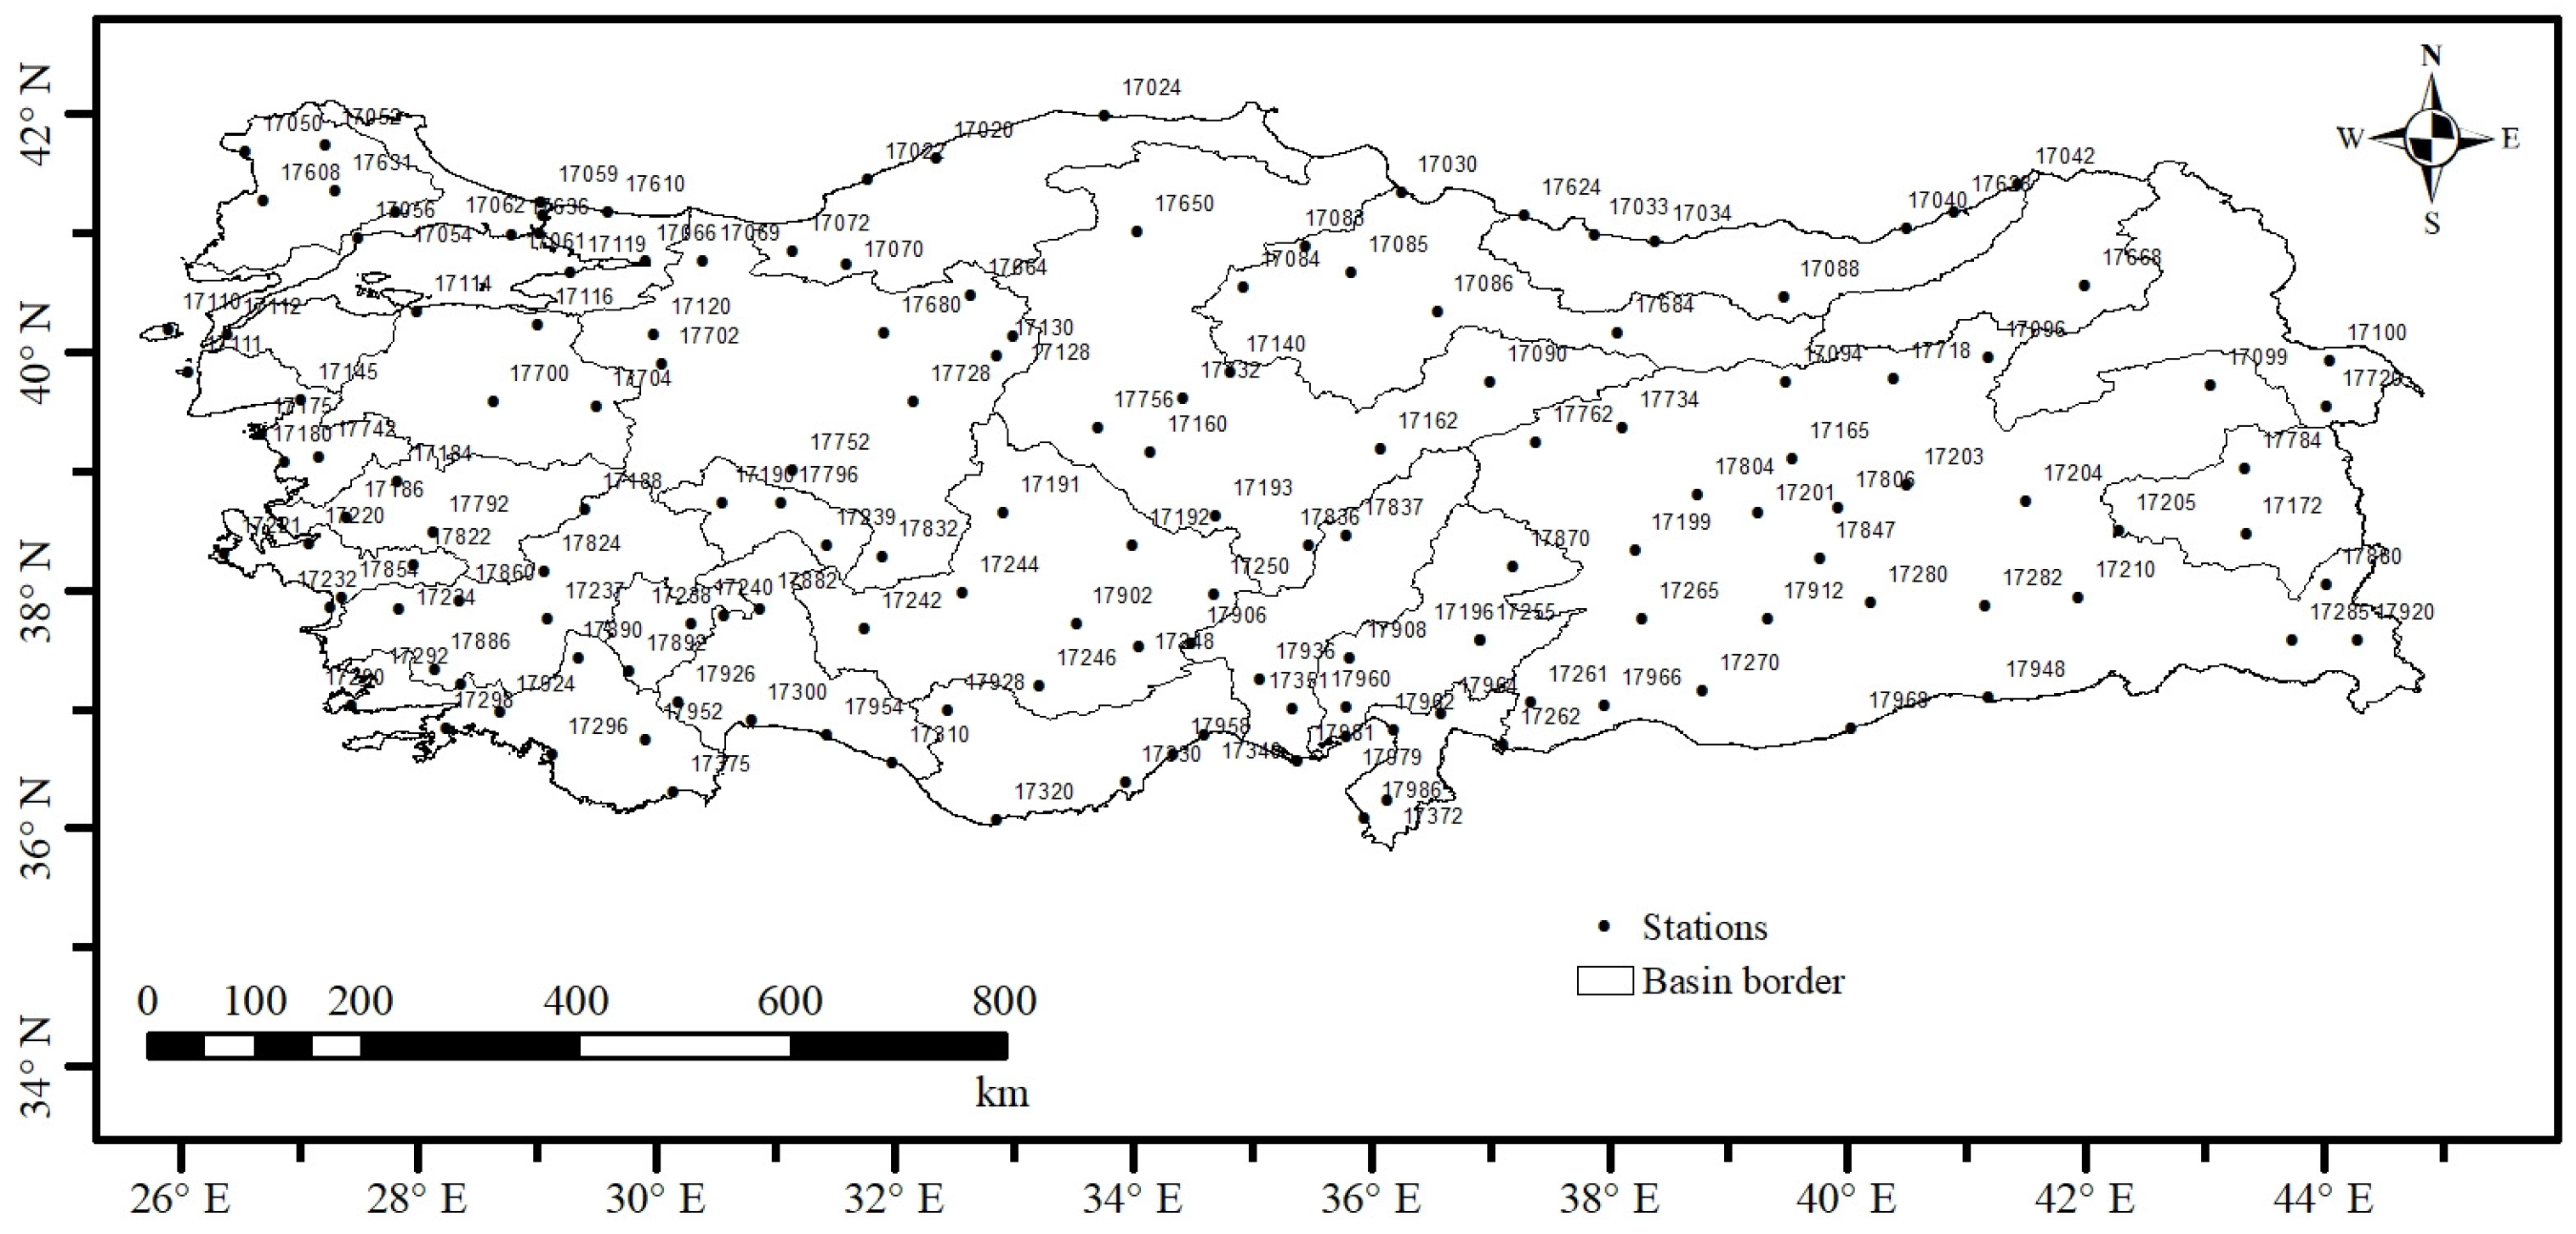
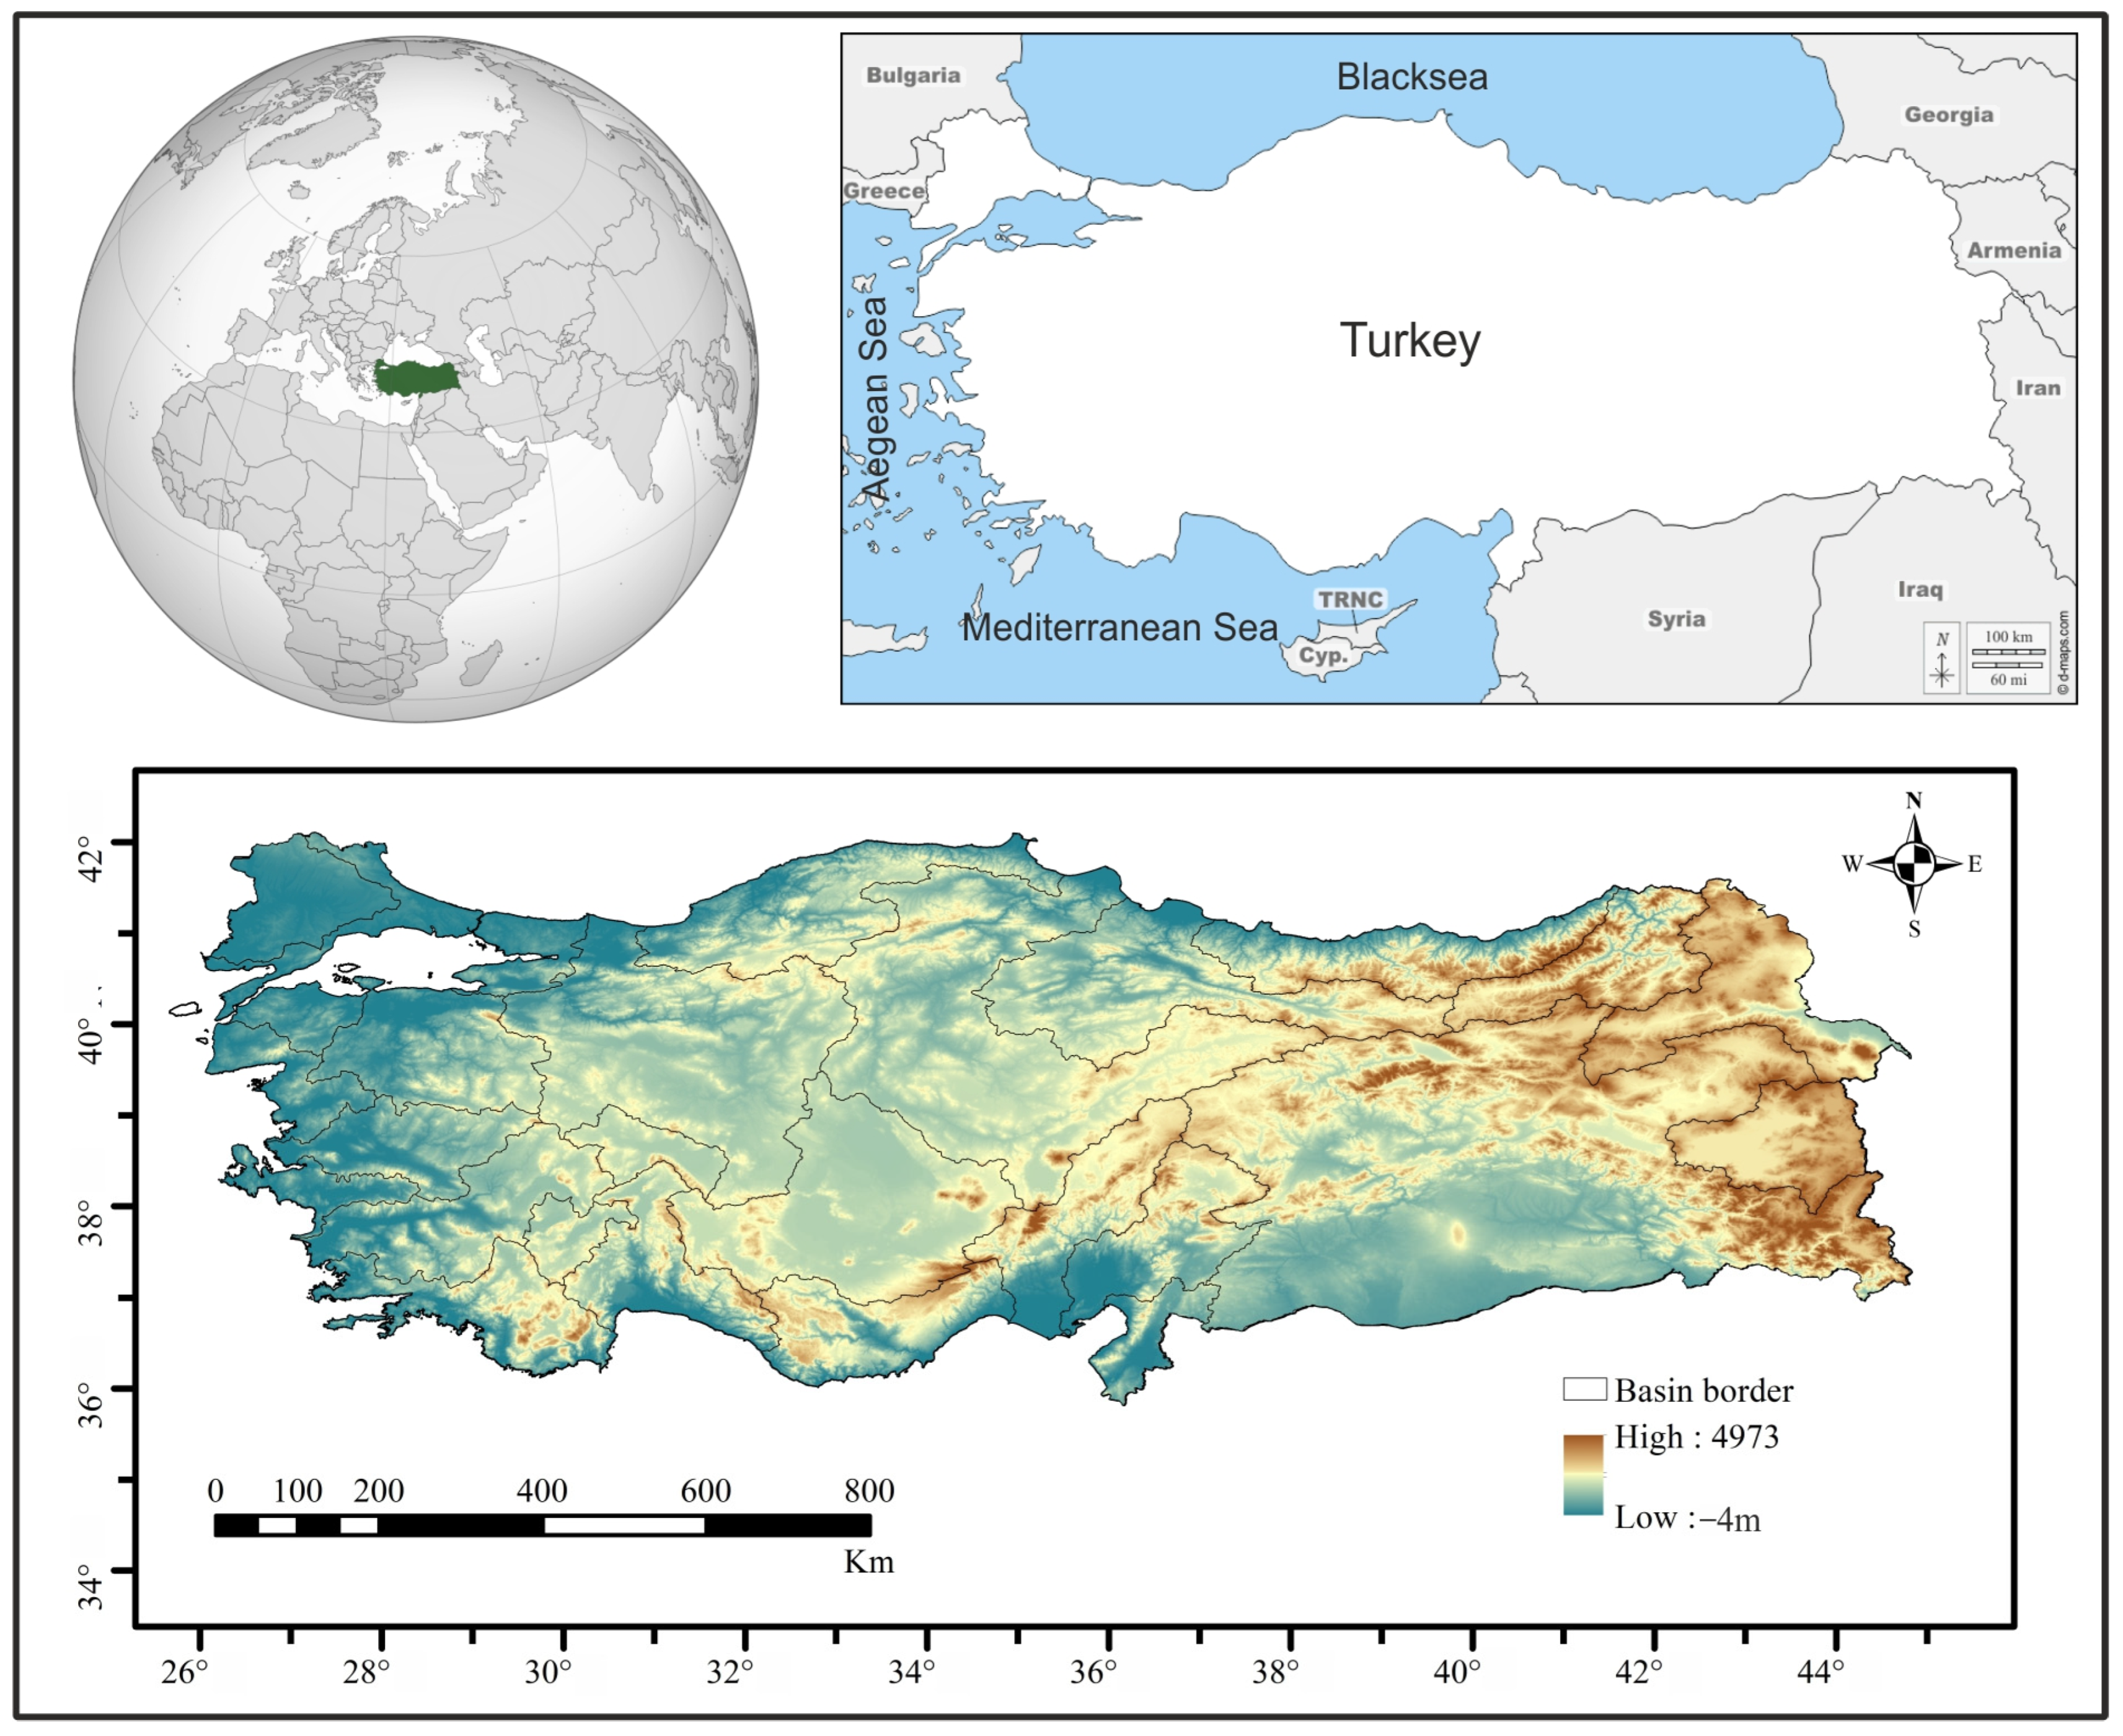
2. Study Area and Data

Turkey (36–42° N; 26–45° E) is located between Europe and Asia in the southeastern part of Europe. With an area of approximately 780,000 km2, 97% of Turkey’s land is in Asia, and the remaining is in Europe. The average altitude, about 1130 m, experiences a gradual increase from central Anatolia towards the east (Figure 1).
The mean annual areal precipitation for 1991–2020 in Turkey is reported as 573 mm, accompanied by an average temperature of 13.9 °C for the same timeframe. Geographically, Turkey is surrounded by the Black Sea to the north, the Aegean Sea to the west, and the Mediterranean Sea to the south. The southern Anatolian mountains and the Kaçkar Mountains, running parallel to the coast, act as natural dividers, separating the Mediterranean and Black Sea regions from the central Anatolia region. The central Anatolia Plateau, positioned between these two mountain ranges, exhibits elevations ranging from 600 to 1200 m [47]. As part of the study, the time series data of monthly mean precipitation values were derived from a comprehensive dataset encompassing 194 meteorological stations selected based on their extensive records spanning over 50 years. Homogeneity tests were conducted on the data from these stations, leading to the identification of 156 stations deemed homogeneous. The subsequent analysis focused on investigating the trends within the time series of each of these 156 stations, with separate trend analyses conducted for each station.

3. Methods

3.1. Homogeneity Tests

The homogeneity of the precipitation time series was initially evaluated by applying four homogeneity tests. These were the von Neumann [48], Pettitt [49], Buishand [50], and the standard normal homogeneity [51] tests. The homogeneity of the time series was checked by testing the null hypothesis (H0). The H0 or H1 showed that the data were homogeneous or non-homogeneous. Then, the obtained trend analysis results were evaluated under three different classes given below [52]:
Classic 1:
Useful (if one or zero tests reject the H0);
Classic 2:
Doubtful (if two tests reject the H0);
Classic 3:
Suspect (if three or four tests reject the H0) [12].
Homogeneity analyses were performed for a confidence level of 95%. In addition, the stations in Class 3 were excluded from the trend analysis.

3.2. Mann–Kendall (MK) Test

The non-parametric MK test, suggested by Mann [29] and Kendall [30], has been widely used for the assessment of the significance of trends in hydrological time series [53]. The MK trend test is a statistical method that assesses the rank correlation between the order of observations and their corresponding time sequence. For a hydro-meteorological variable, the test statistic S is calculated as follows:
S = i = 1 n 1 j = i + 1 n s g n x j x i
where n is the data length, and xi and xj indicate data values at times i and j, respectively.
s g n x j x i =       1 ;             x j > x i         0 ;               x j = x i 1 ;           x j < x i
When n > 10, the variance of S is calculated as:
V a r S = n n 1 2 n + 5 i = 1 p t i ( t i 1 ) ( 2 t i + 5 ) / 18
In Equation (3), p is the number of tied groups. It means there are equal data in the time series. ti indicates how many times data are repeated. Finally, the Z value is obtained from Equation (4):
Z = S 1 V a r S             ,                 S > 0               0                           ,                         0             S + 1 V a r ( S )           ,                     S < 0  
The computed Z value is juxtaposed against the standard normal distribution with specified significance levels (90, 95, and 99%). If the absolute Z value surpasses the critical threshold, the H0 is rejected, indicating a statistically significant trend. Conversely, if the absolute Z value does not exceed the critical threshold, it suggests a statistically significant trend is absent. In instances of a detected trend, its direction, whether increasing or decreasing, is ascertained based on the sign of the S value. A positive S value indicates an increasing trend, whereas a negative S value indicates a decreasing trend [12,54]. In this study, the MK trend analyses were evaluated at three different confidence levels (80, 90, and 95%, respectively).

3.3. Improved Visualization of Innovative Trend Analysis (IV-ITA)

The ITA method, introduced by Sen [33], enables the graphical assessment of trends for low, medium, and high values within a time series, as elucidated by Caloiero et al. [39]. This method can be applied to determine the trend of the time series of any variable without any restrictive assumptions. In this method, even small trends in the time series, monotonic (or non-monotonic) increasing or decreasing trend conditions, and no trend conditions are determined by considering the scattering of the data. These trend conditions are presented graphically by Guclu [11]. The details of the ITA method and the application procedure are given by Sen [33]. The ITA method does not show the number (dimension) of data in the time series of the trend analyzed variable. However, in the newly improved visualization version, both trends and data dimension (number) and sub-categories are shown. The calculation steps of the IV-TA method are presented by Guclu [11]. The trend analysis of a hydro-meteorological time series is presented as an example in Figure 2a,b for the classical ITA and IV-ITA methods.
Guclu [11] stated that the new IV-ITA method has two significant advantages compared to the classical ITA method. The first one is the data dimension (number) in the IV-ITA method. Another one is that the Pettitt change point test can be applied to difference series. This test allows the data to be divided into two different categories. Thus, the graph’s right (left) side can be objectively labeled as high (low) values. The red and green lines at the bottom of Figure 2a show each category’s increasing and decreasing trends. Red and green change point parallel lines can be moved on the classical graph (Figure 2b), where the percentage of each sub-group is calculated with 100 × (left side differences mean)/(left side first half mean) and 100 × (right side differences mean)/(right side first half mean) [11]. The details of the IV-ITA method and the application procedure are given by Guclu [11] and Mallick et al. [18].

4. Results

4.1. Homogeneity Test Results

Before commencing the trend analysis, an assessment was conducted to ascertain the homogeneity of all stations within the study area. Homogeneity tests were performed following the procedure recommended by Wijngaard et al. [52] at a confidence level of 95%. It was established that the time series of 156 out of 194 stations exhibited homogeneity. In other words, 38 stations were excluded from the trend analysis. The findings of studies conducted by Tosunoglu et al. [55] and Arikan and Kahya [56], employing a similar procedure, corroborate the results of this study. The distribution of the stations determined to be homogeneous due to homogeneity tests on the map is given in Figure 3.

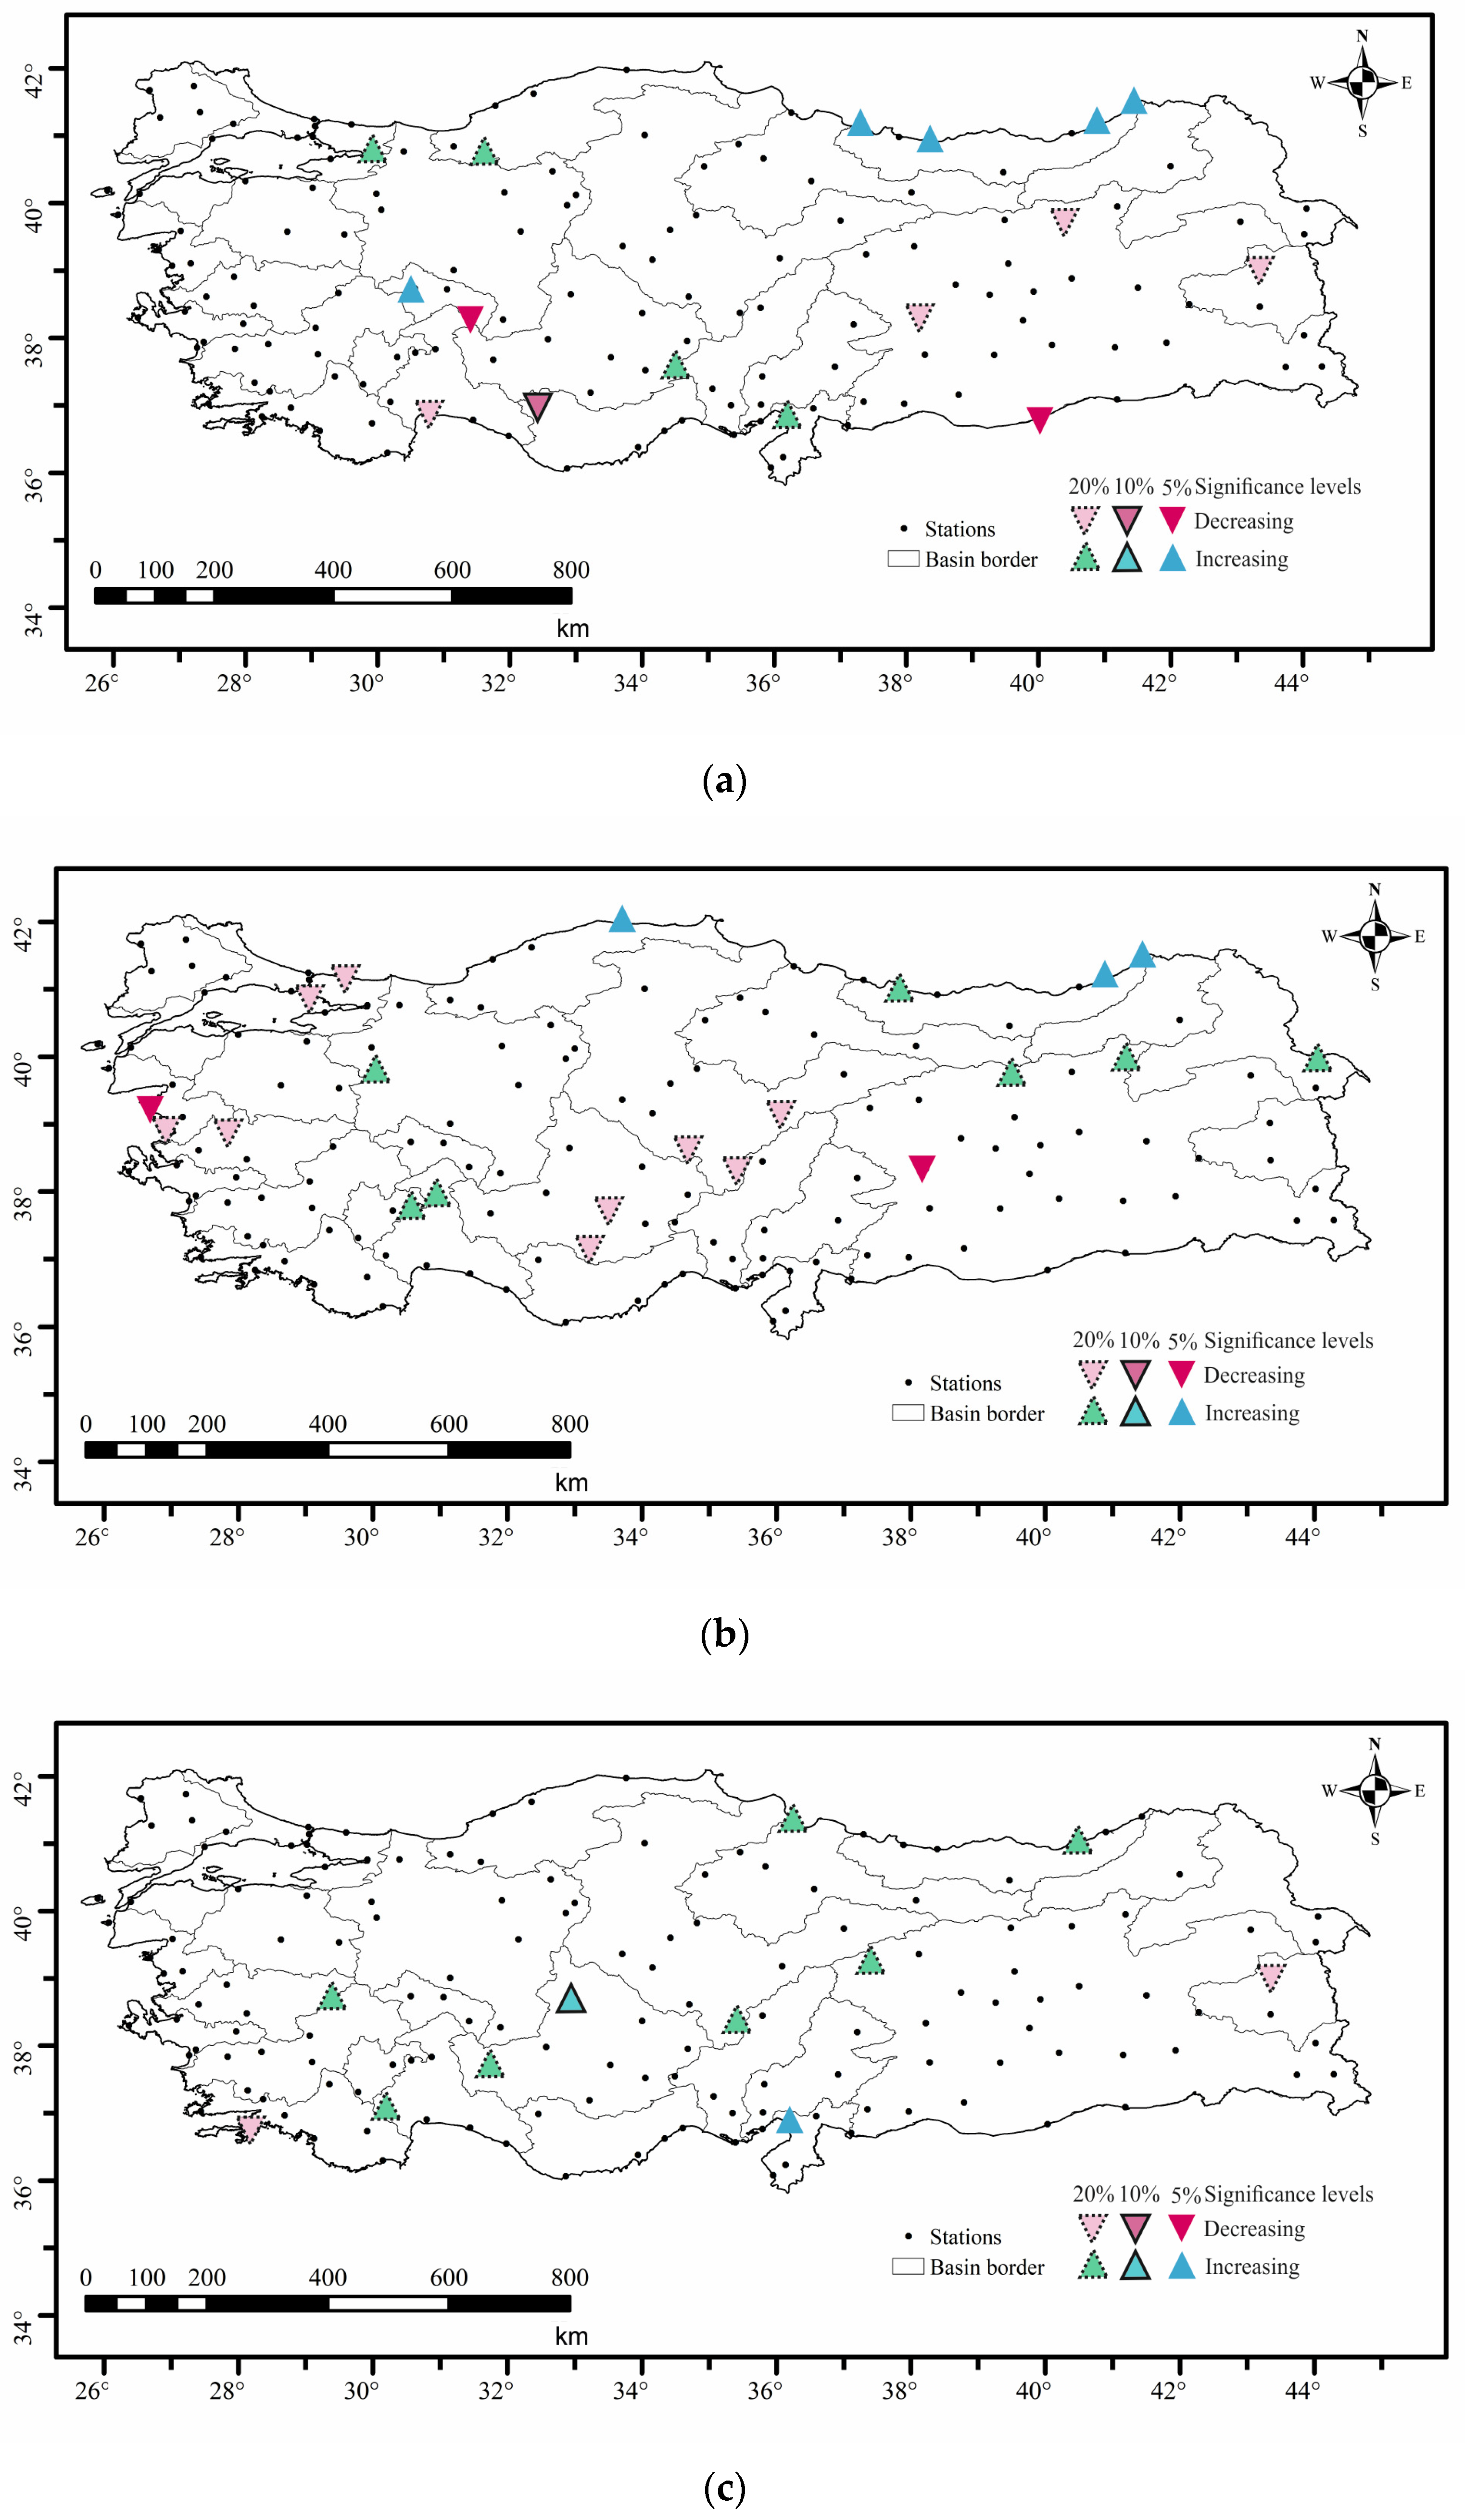
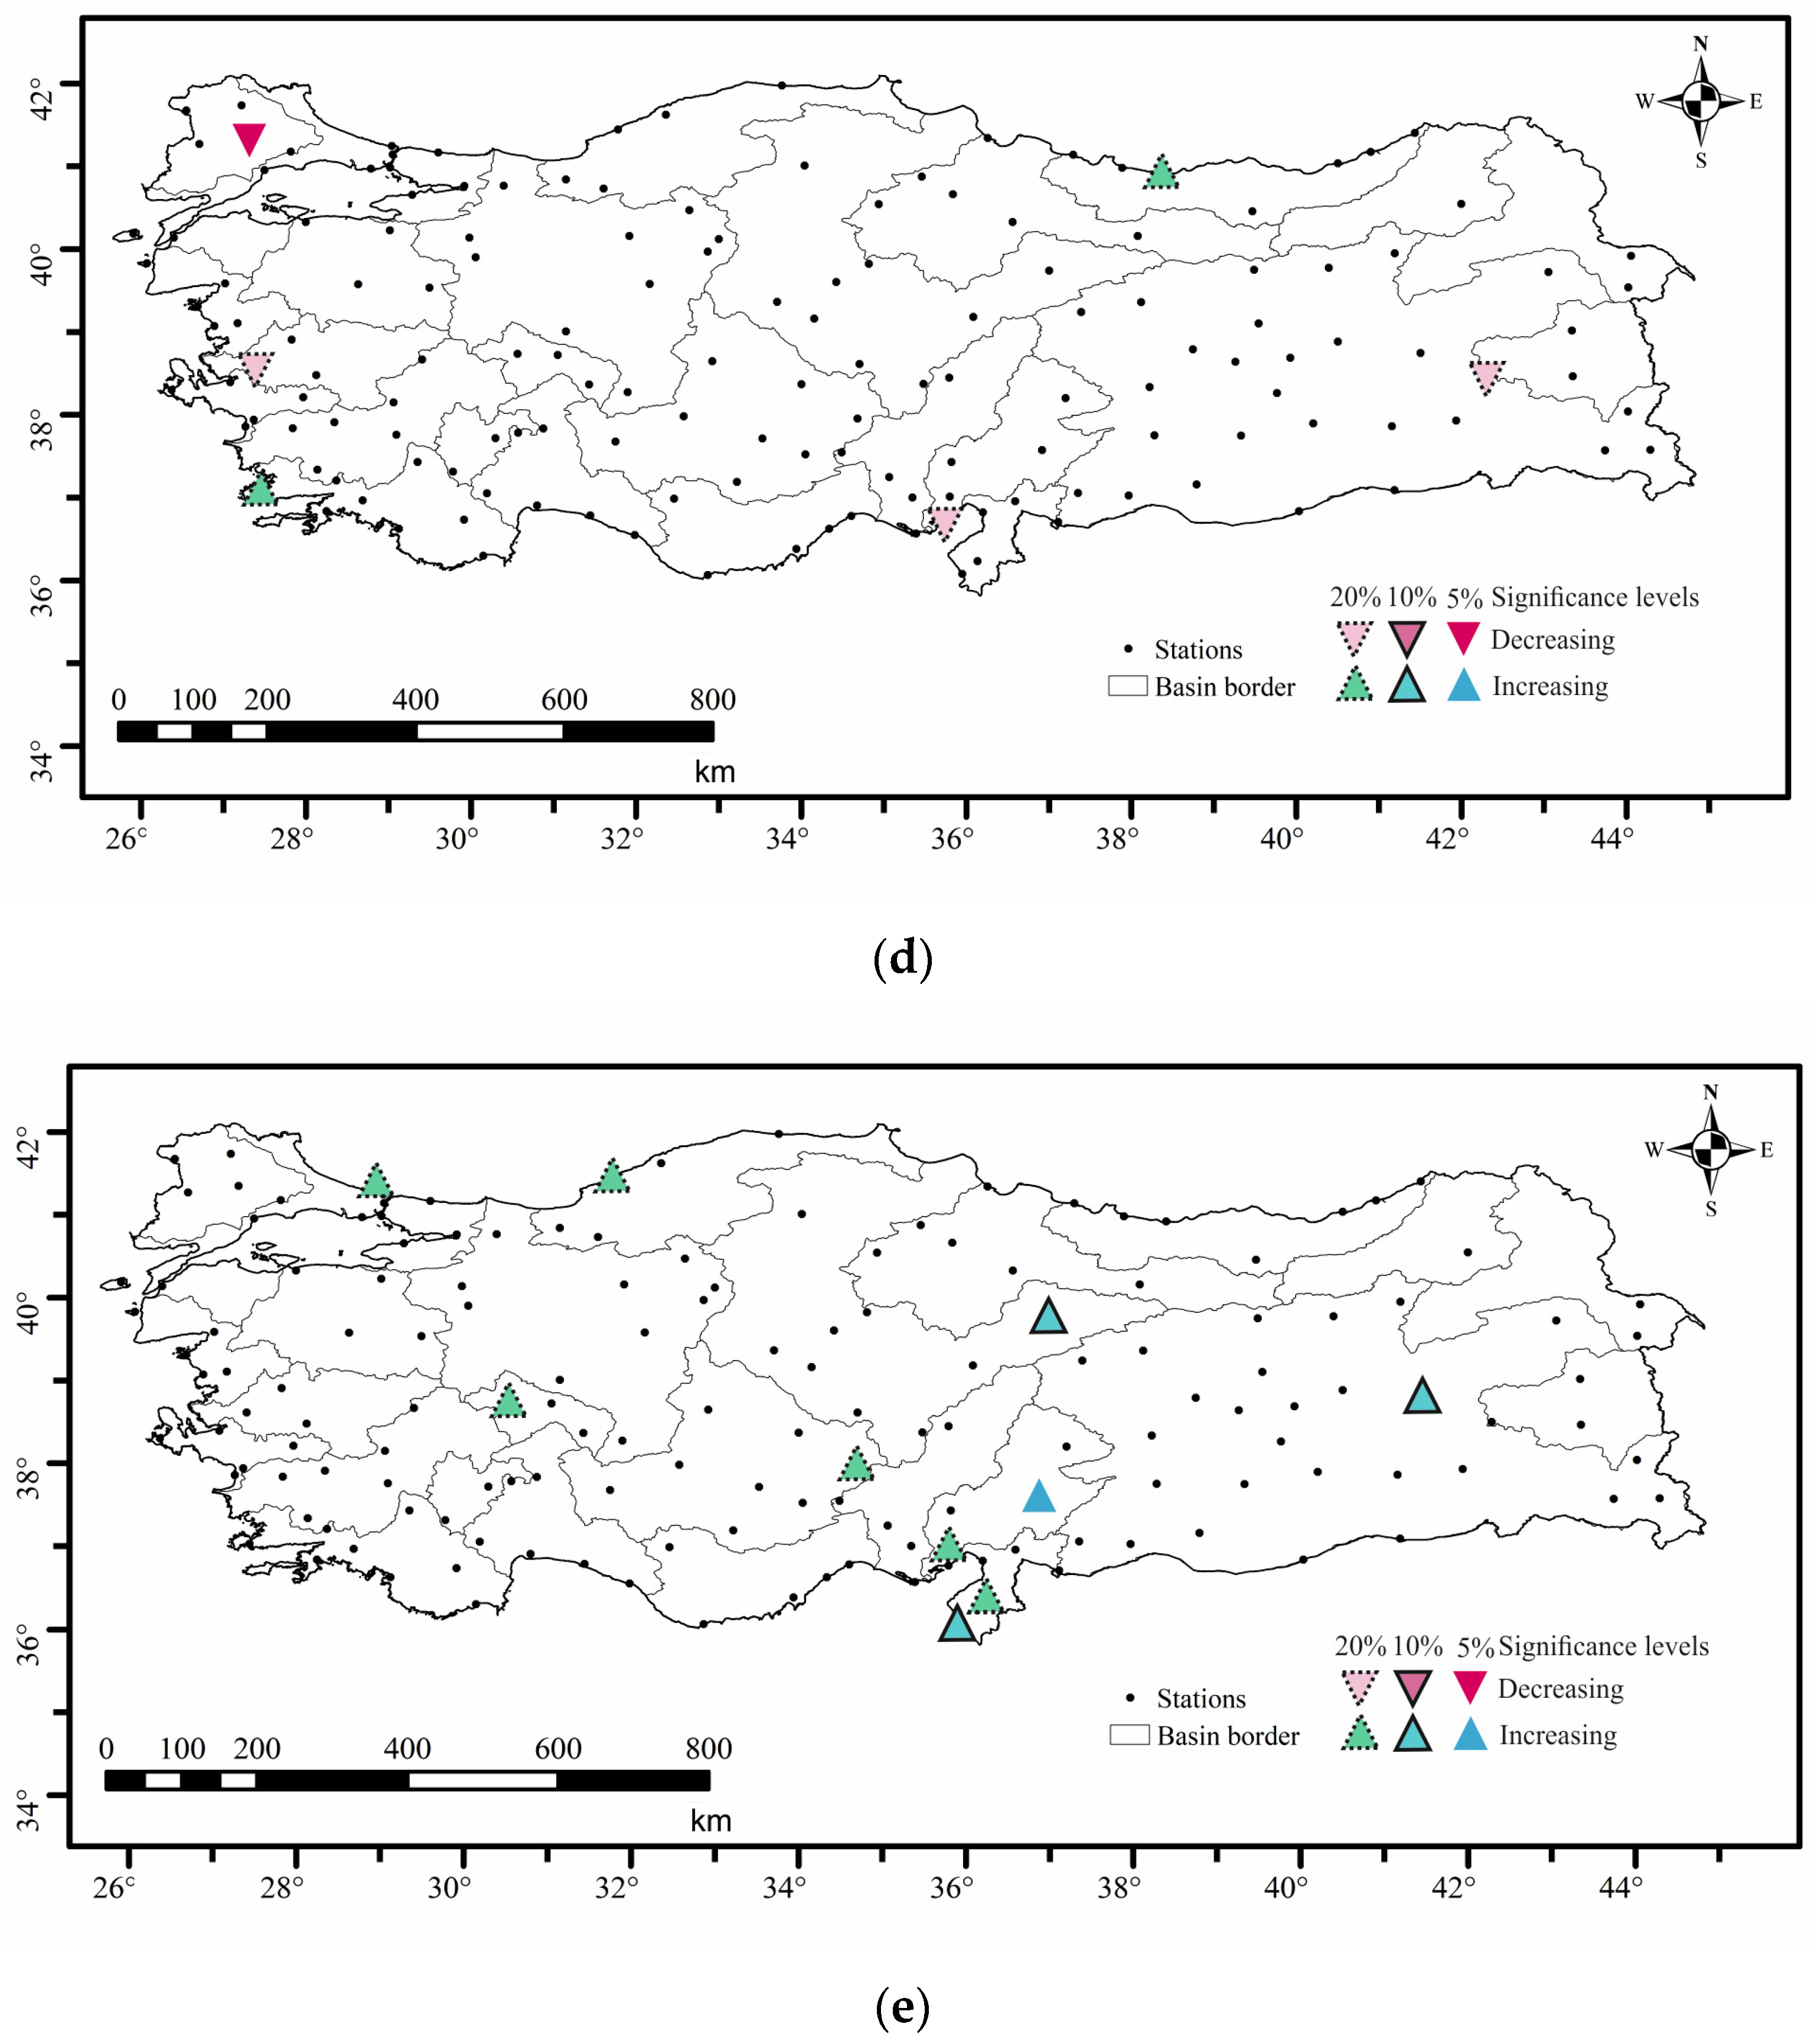
4.2. Mann–Kendall Test Results
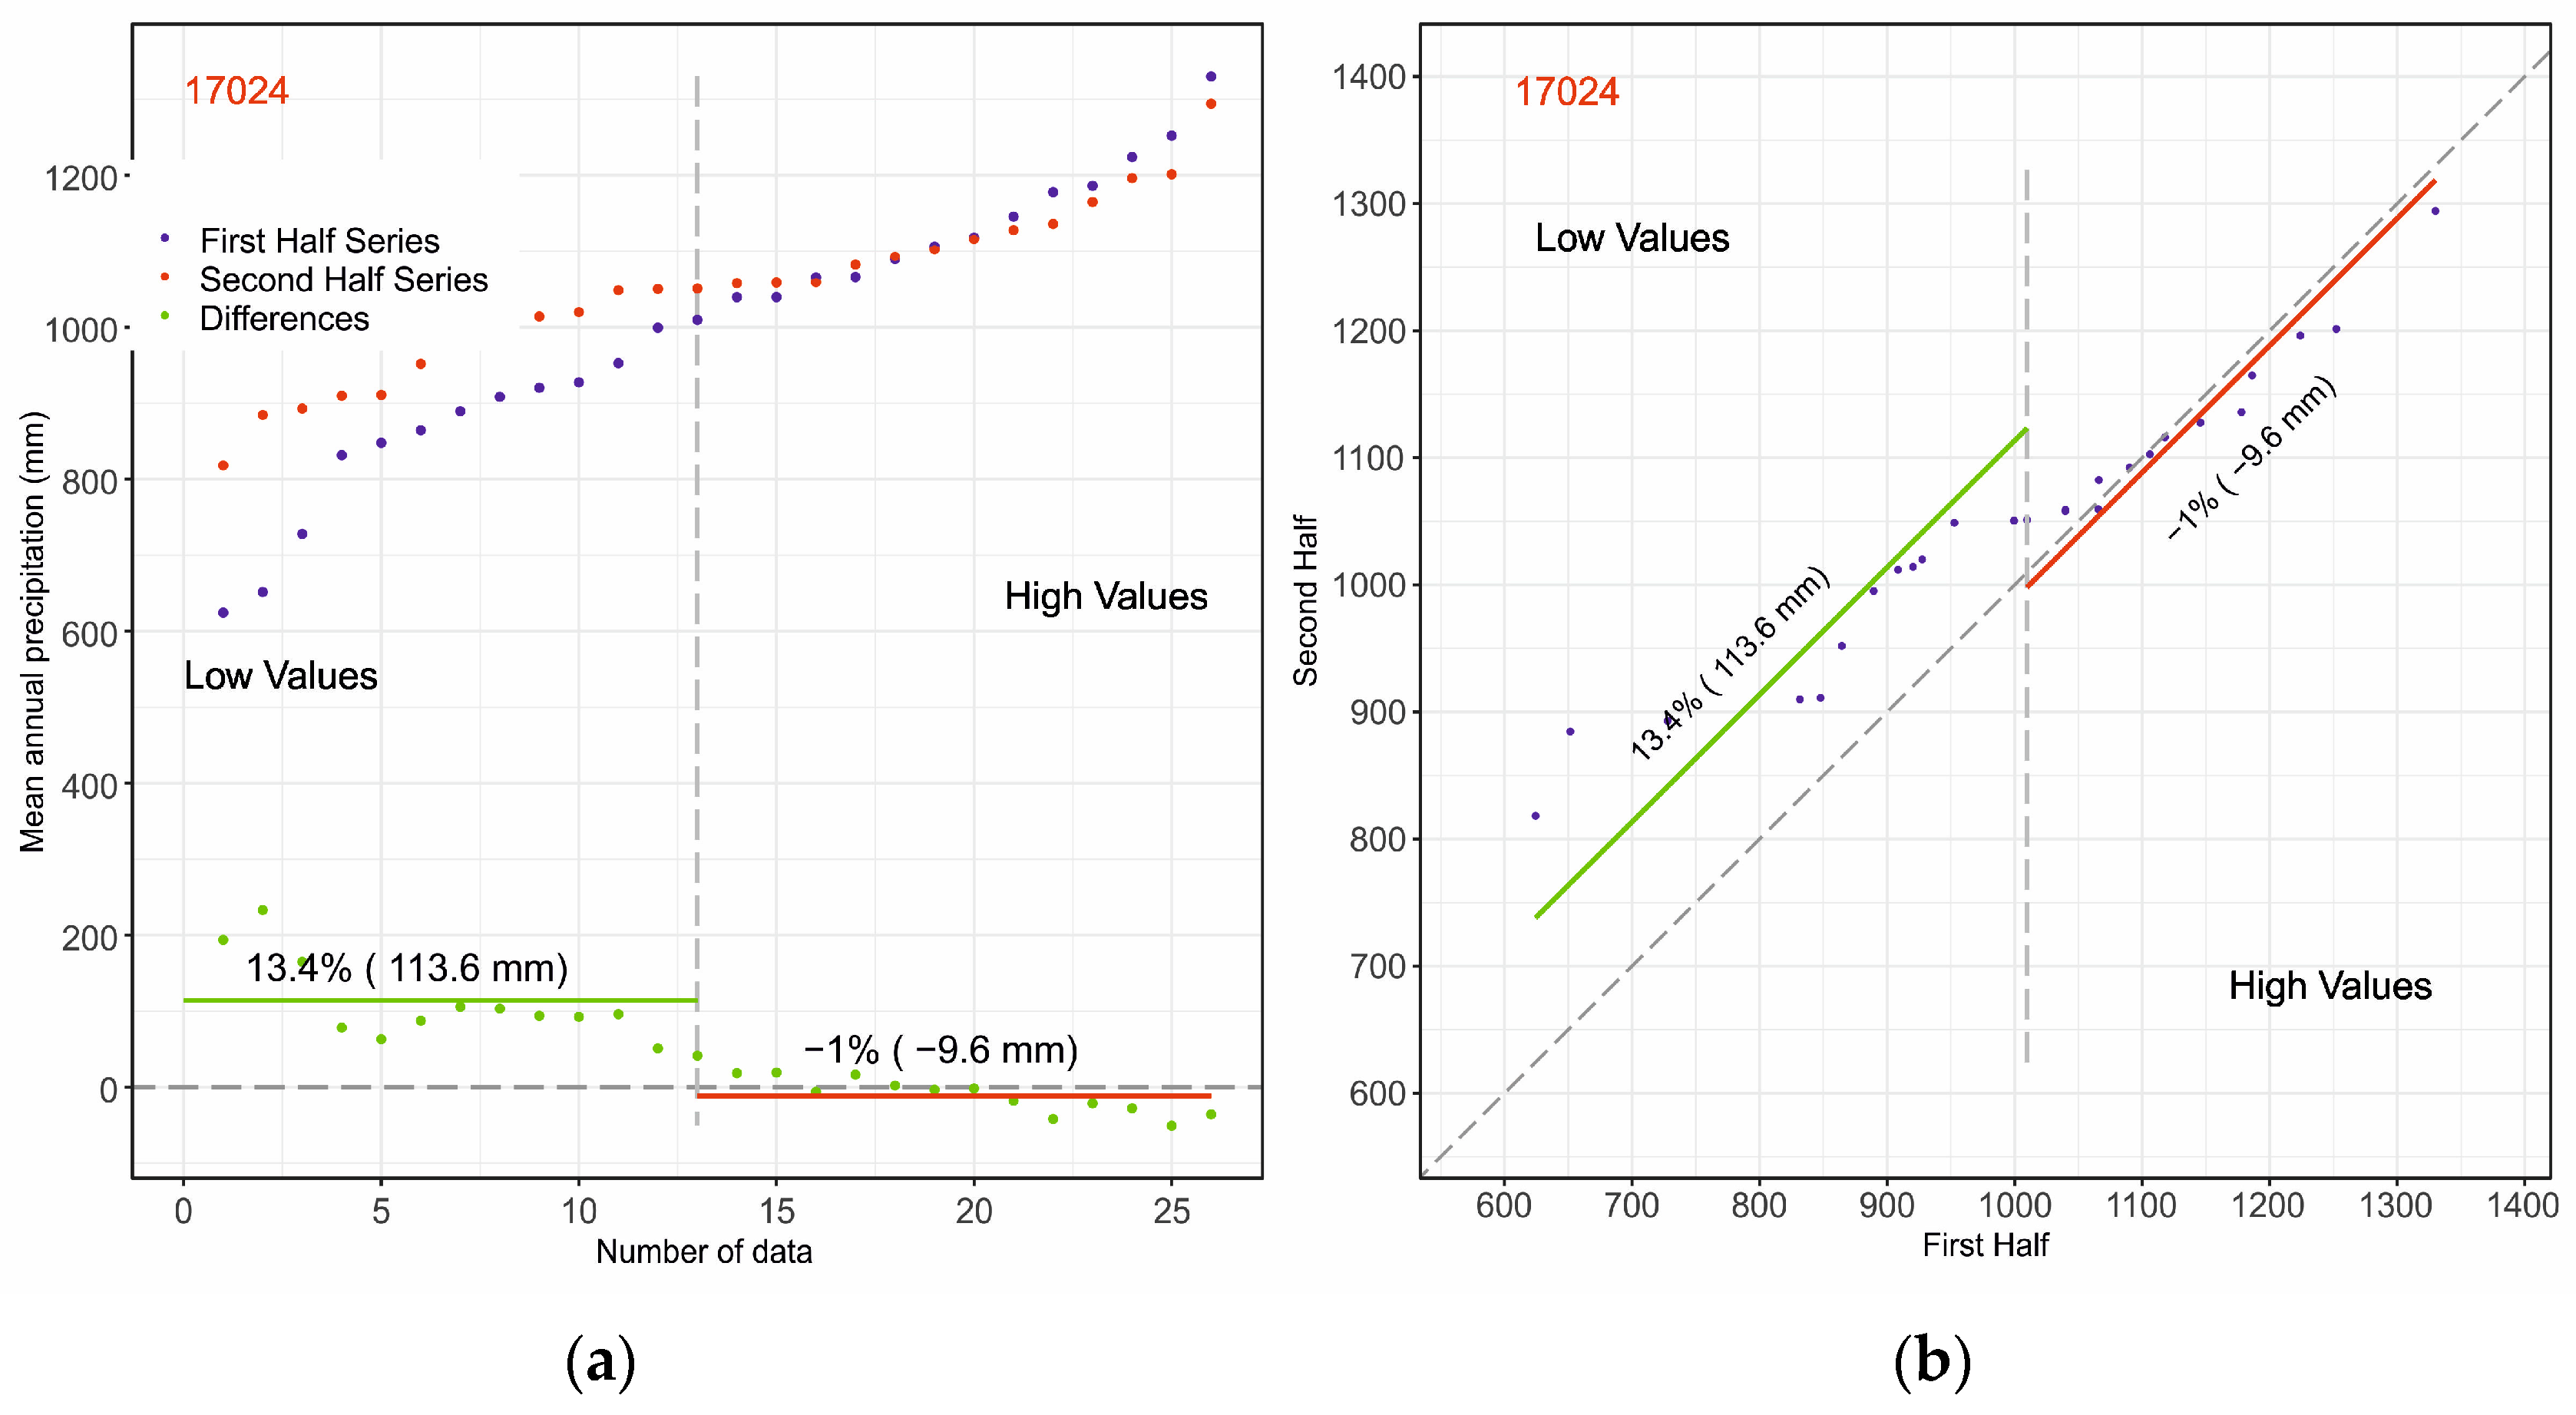
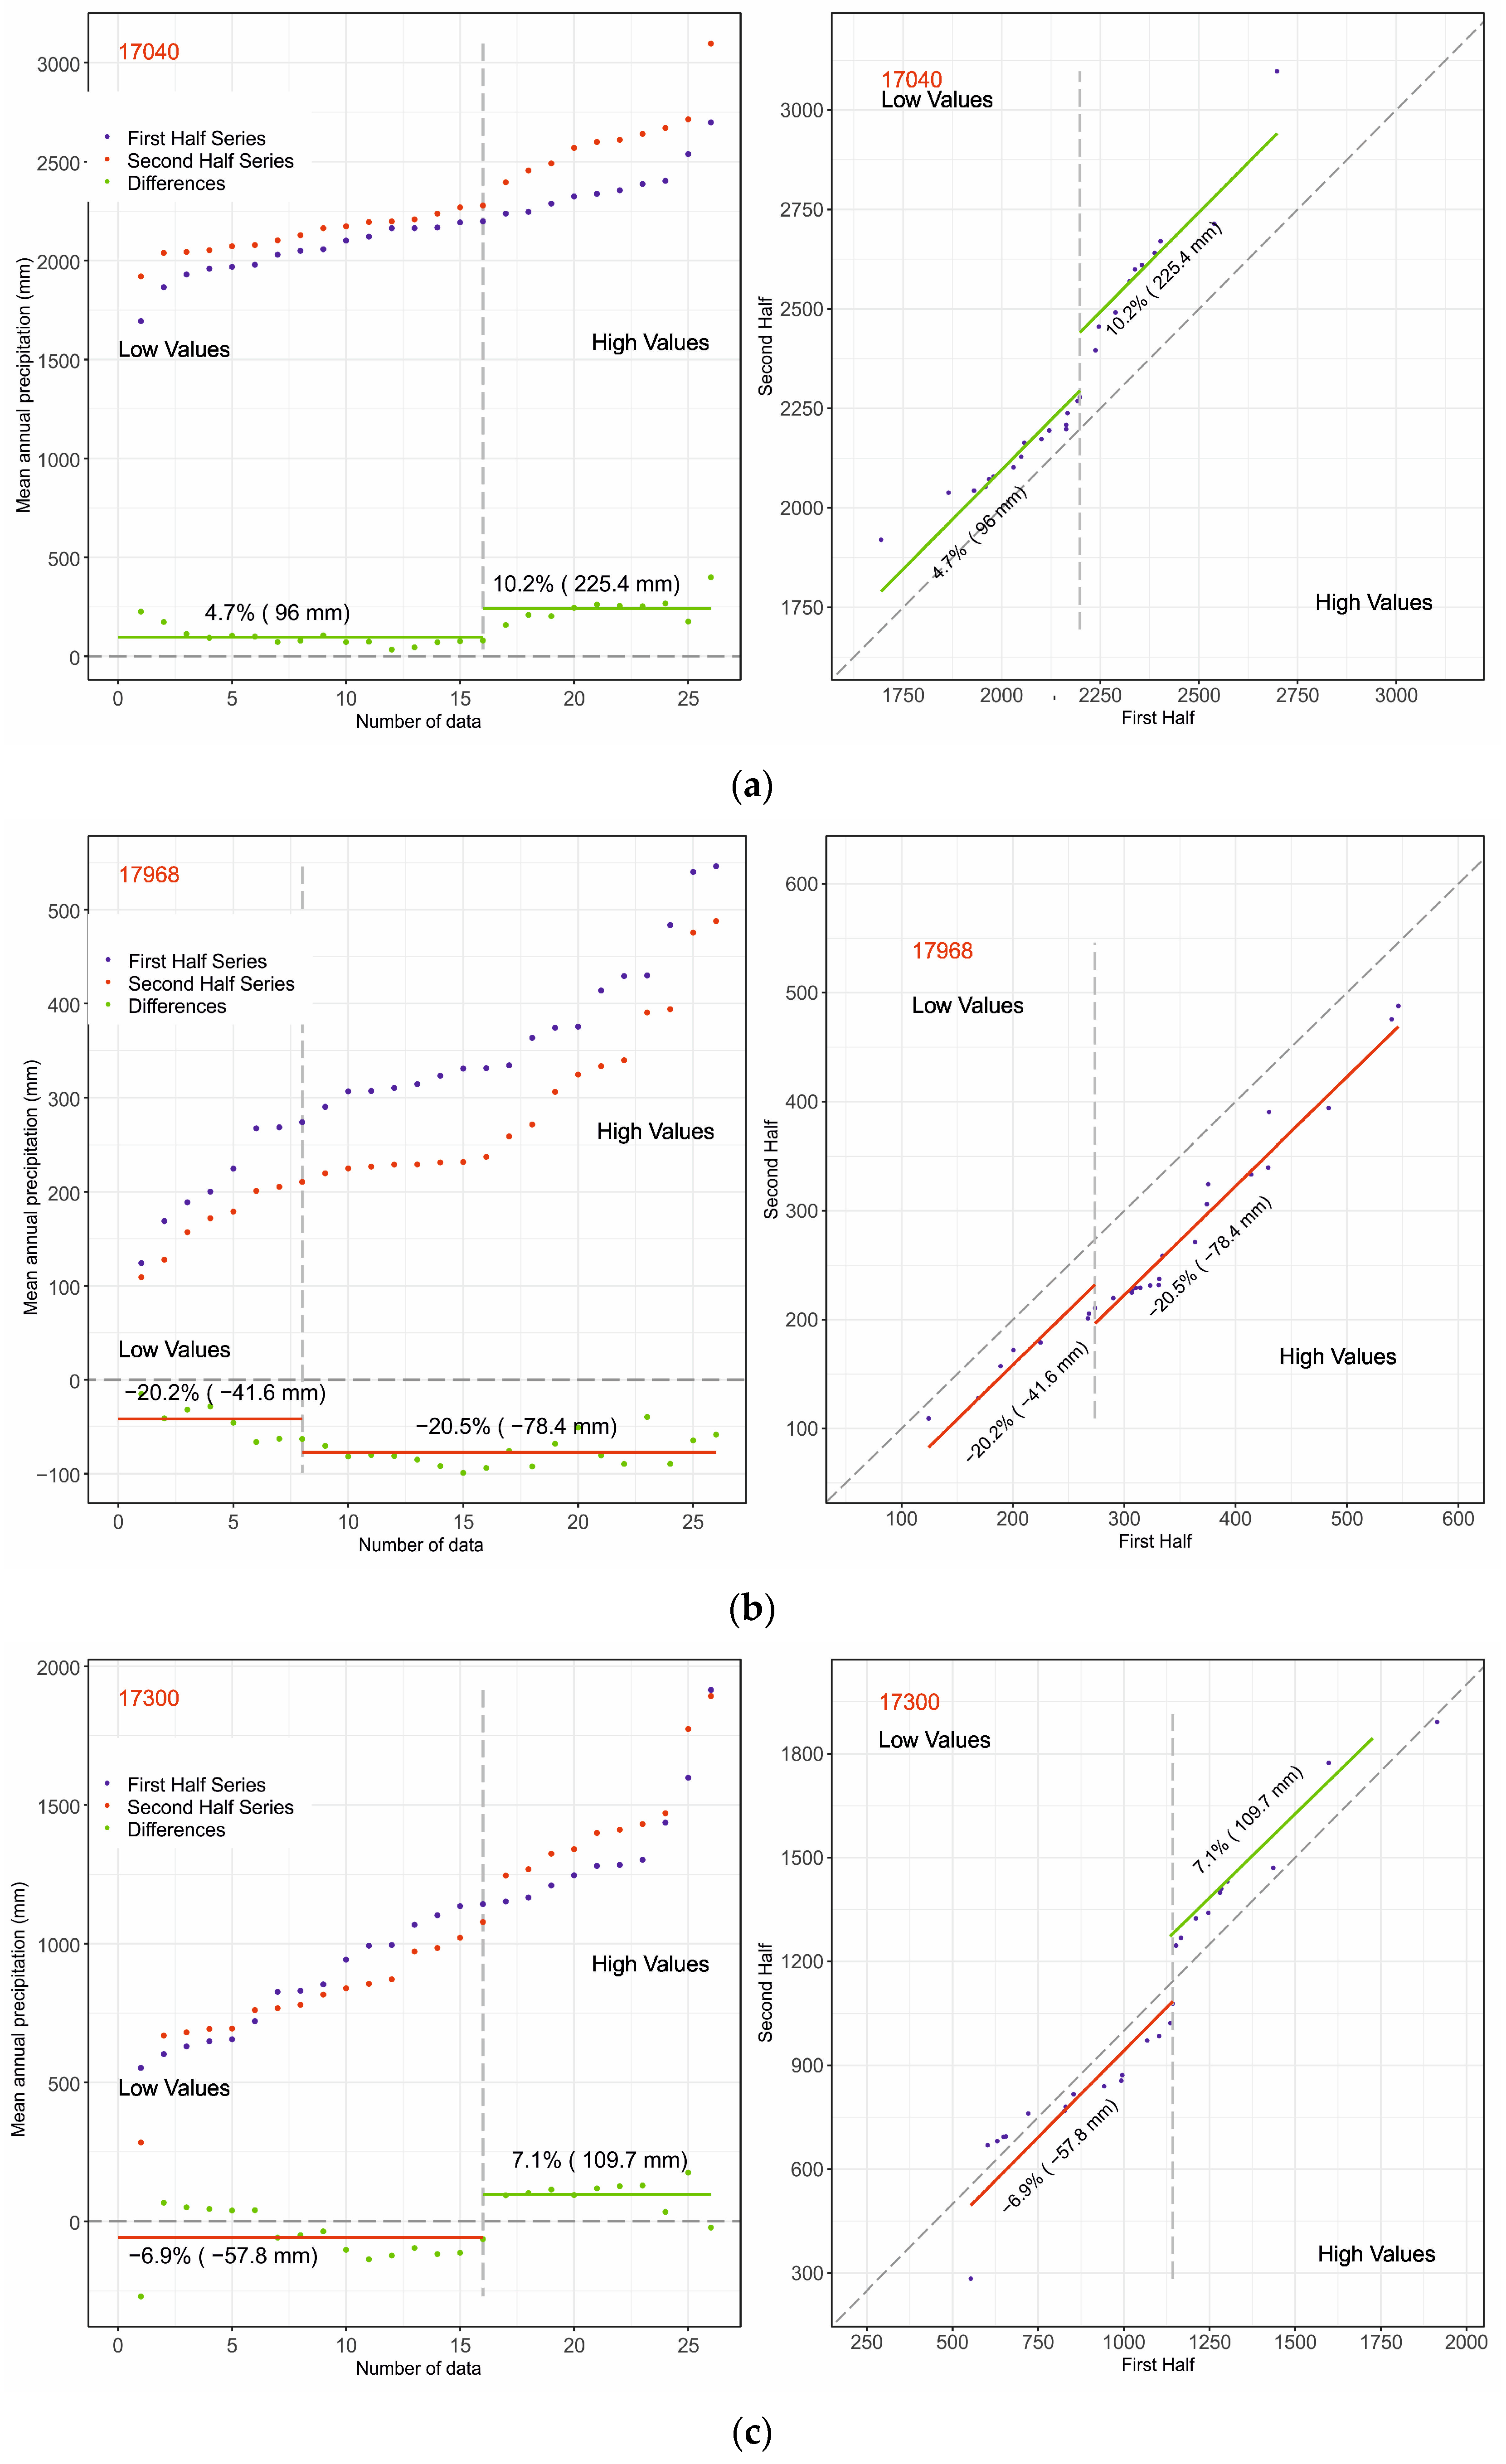
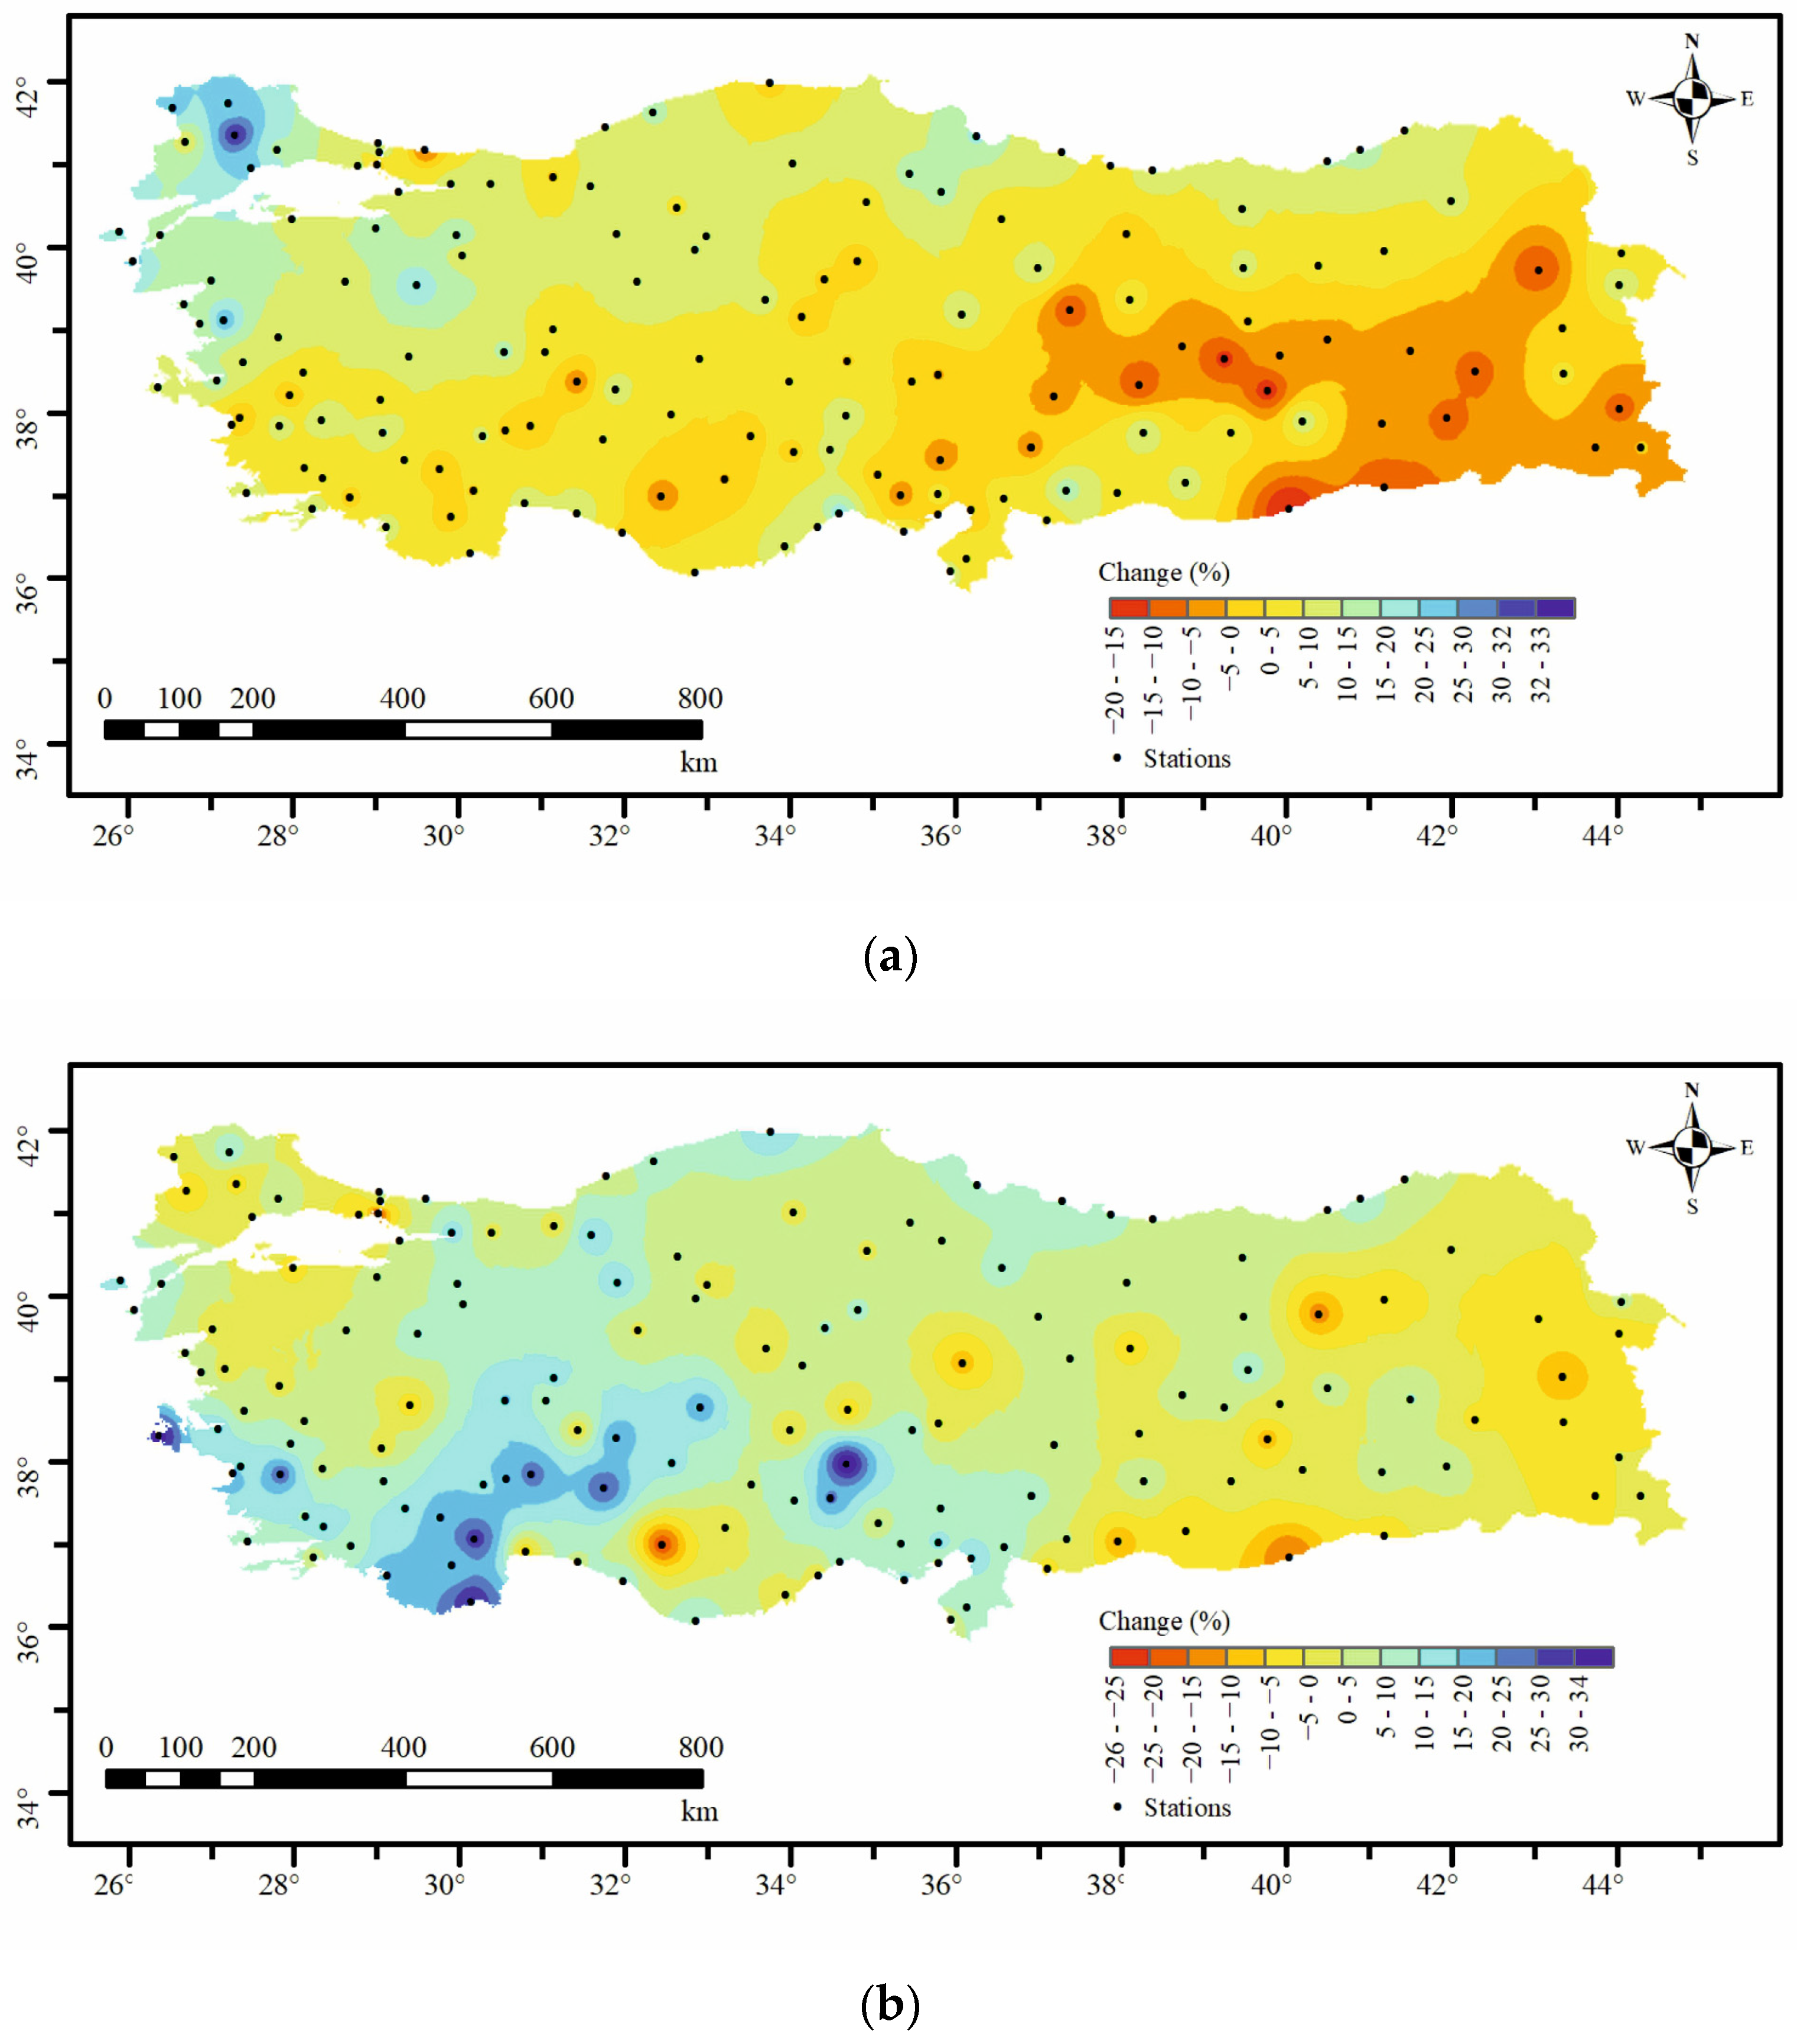
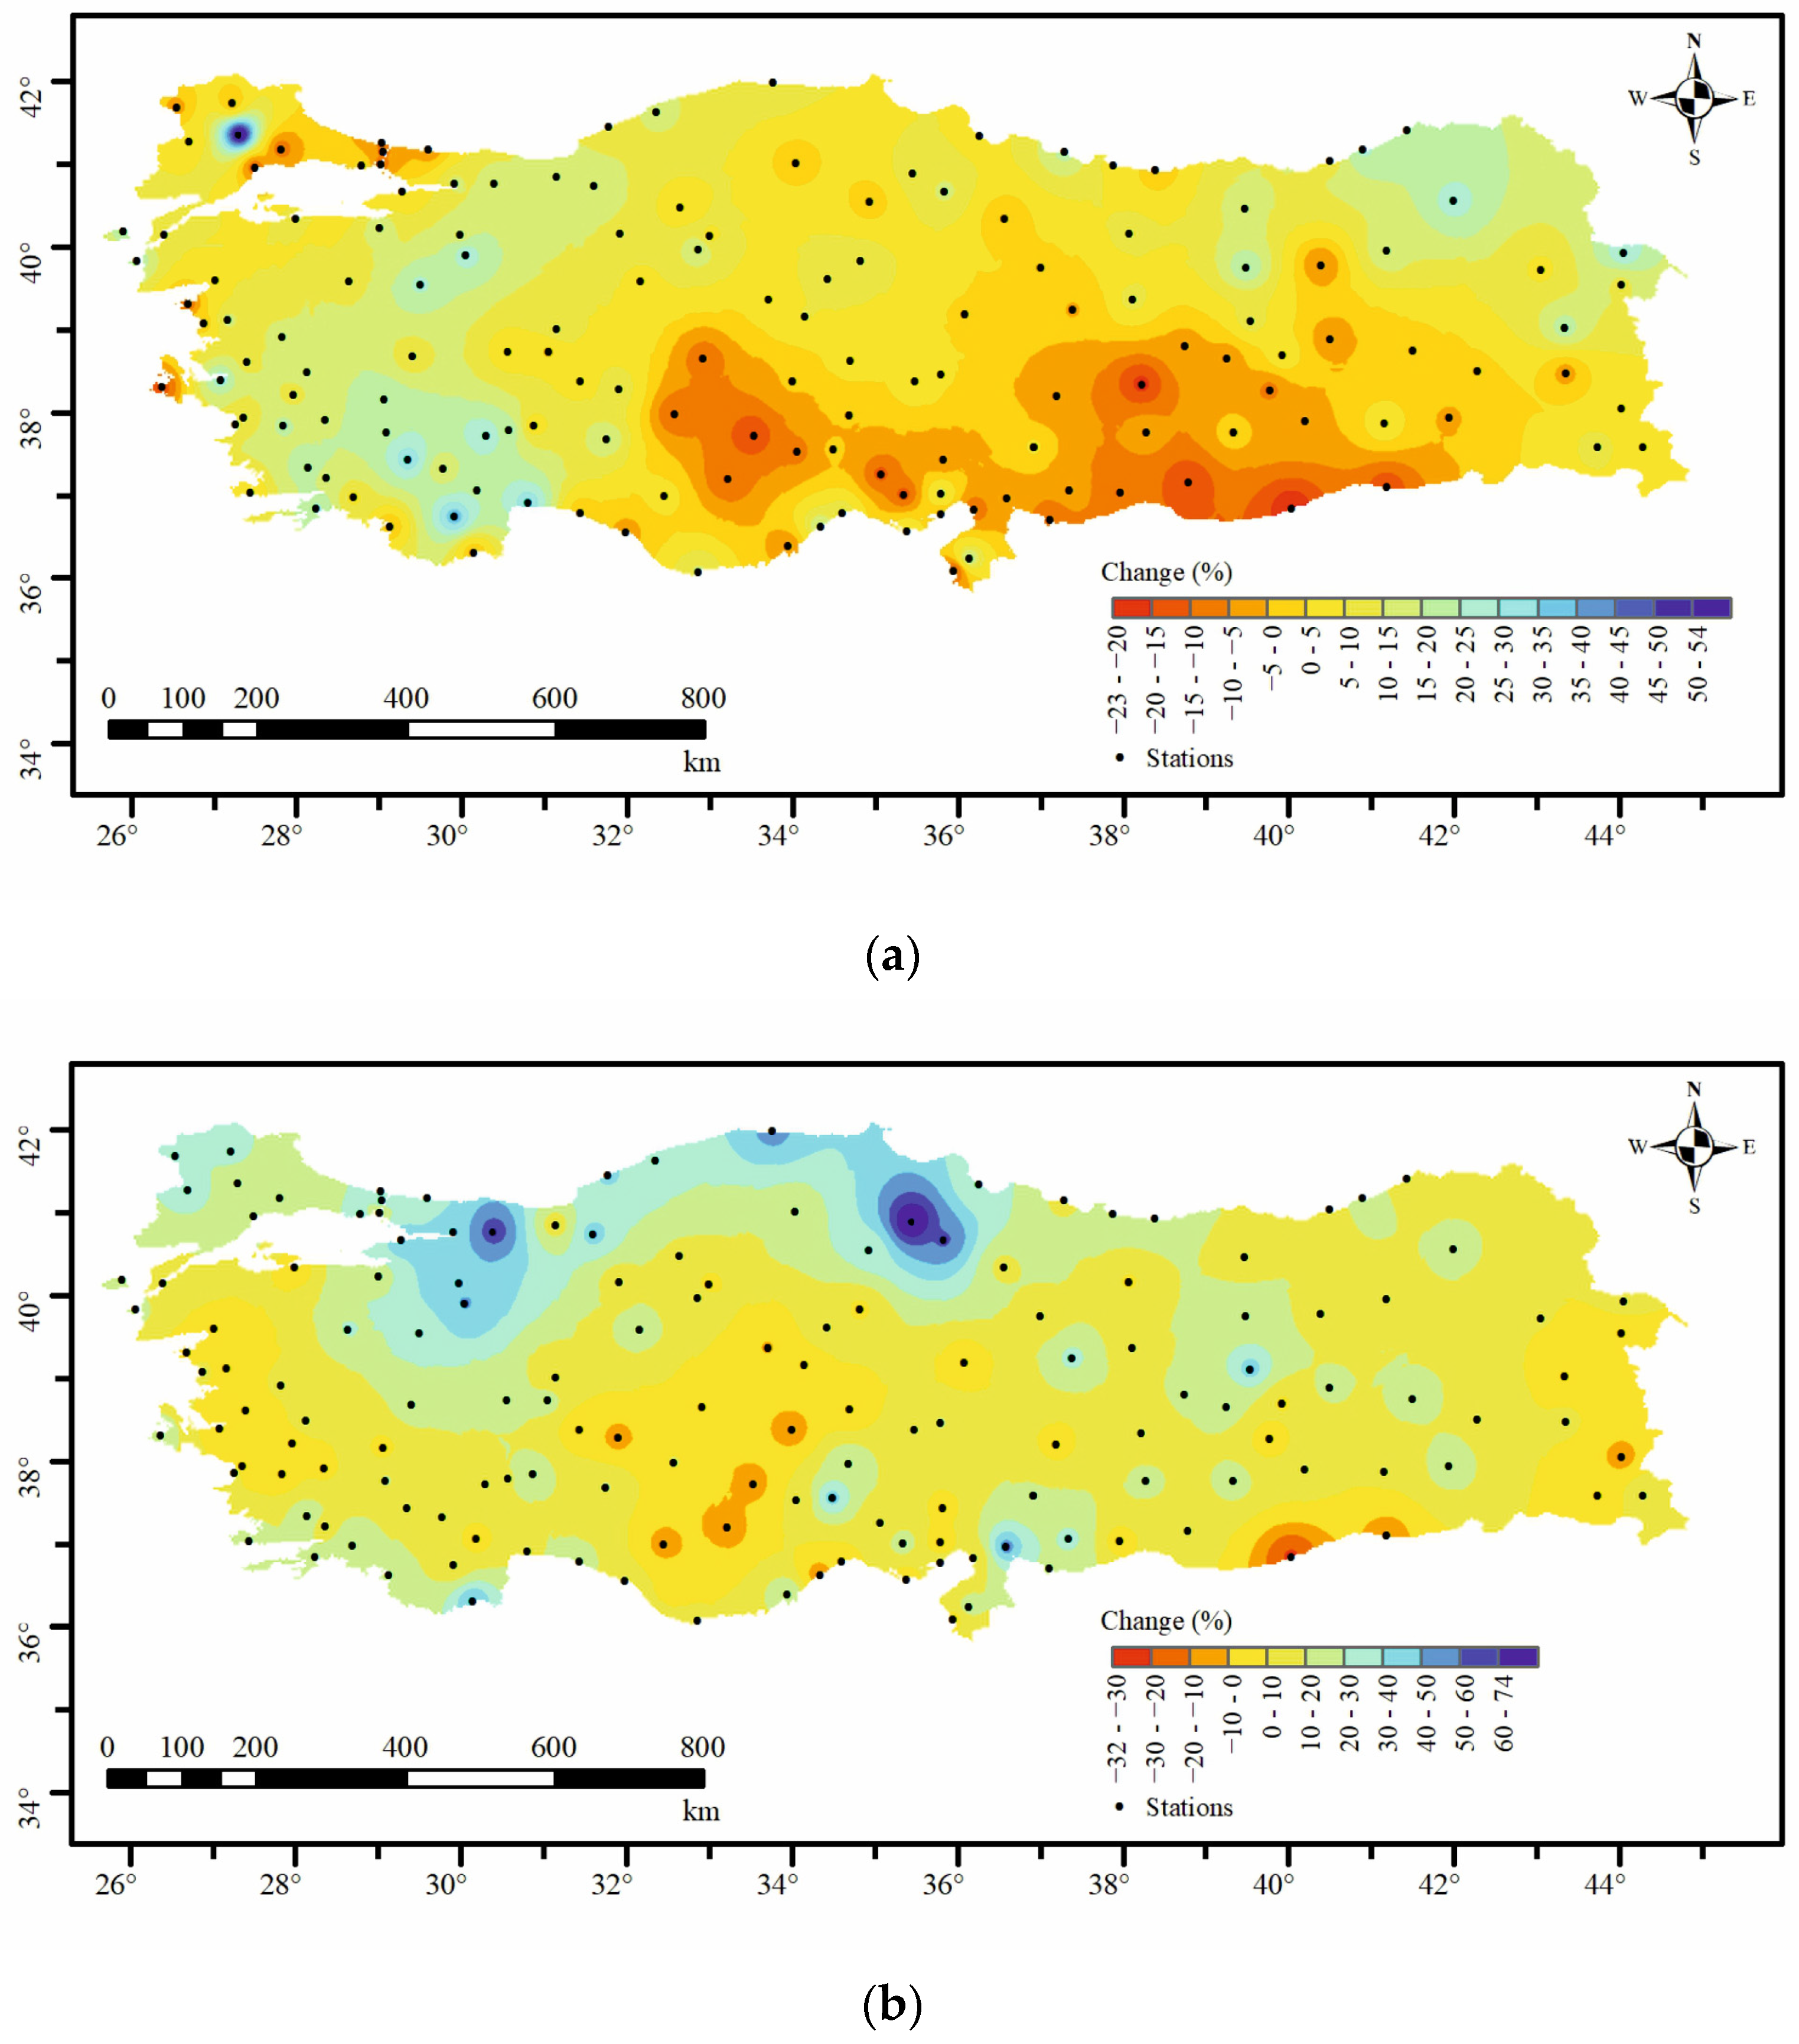
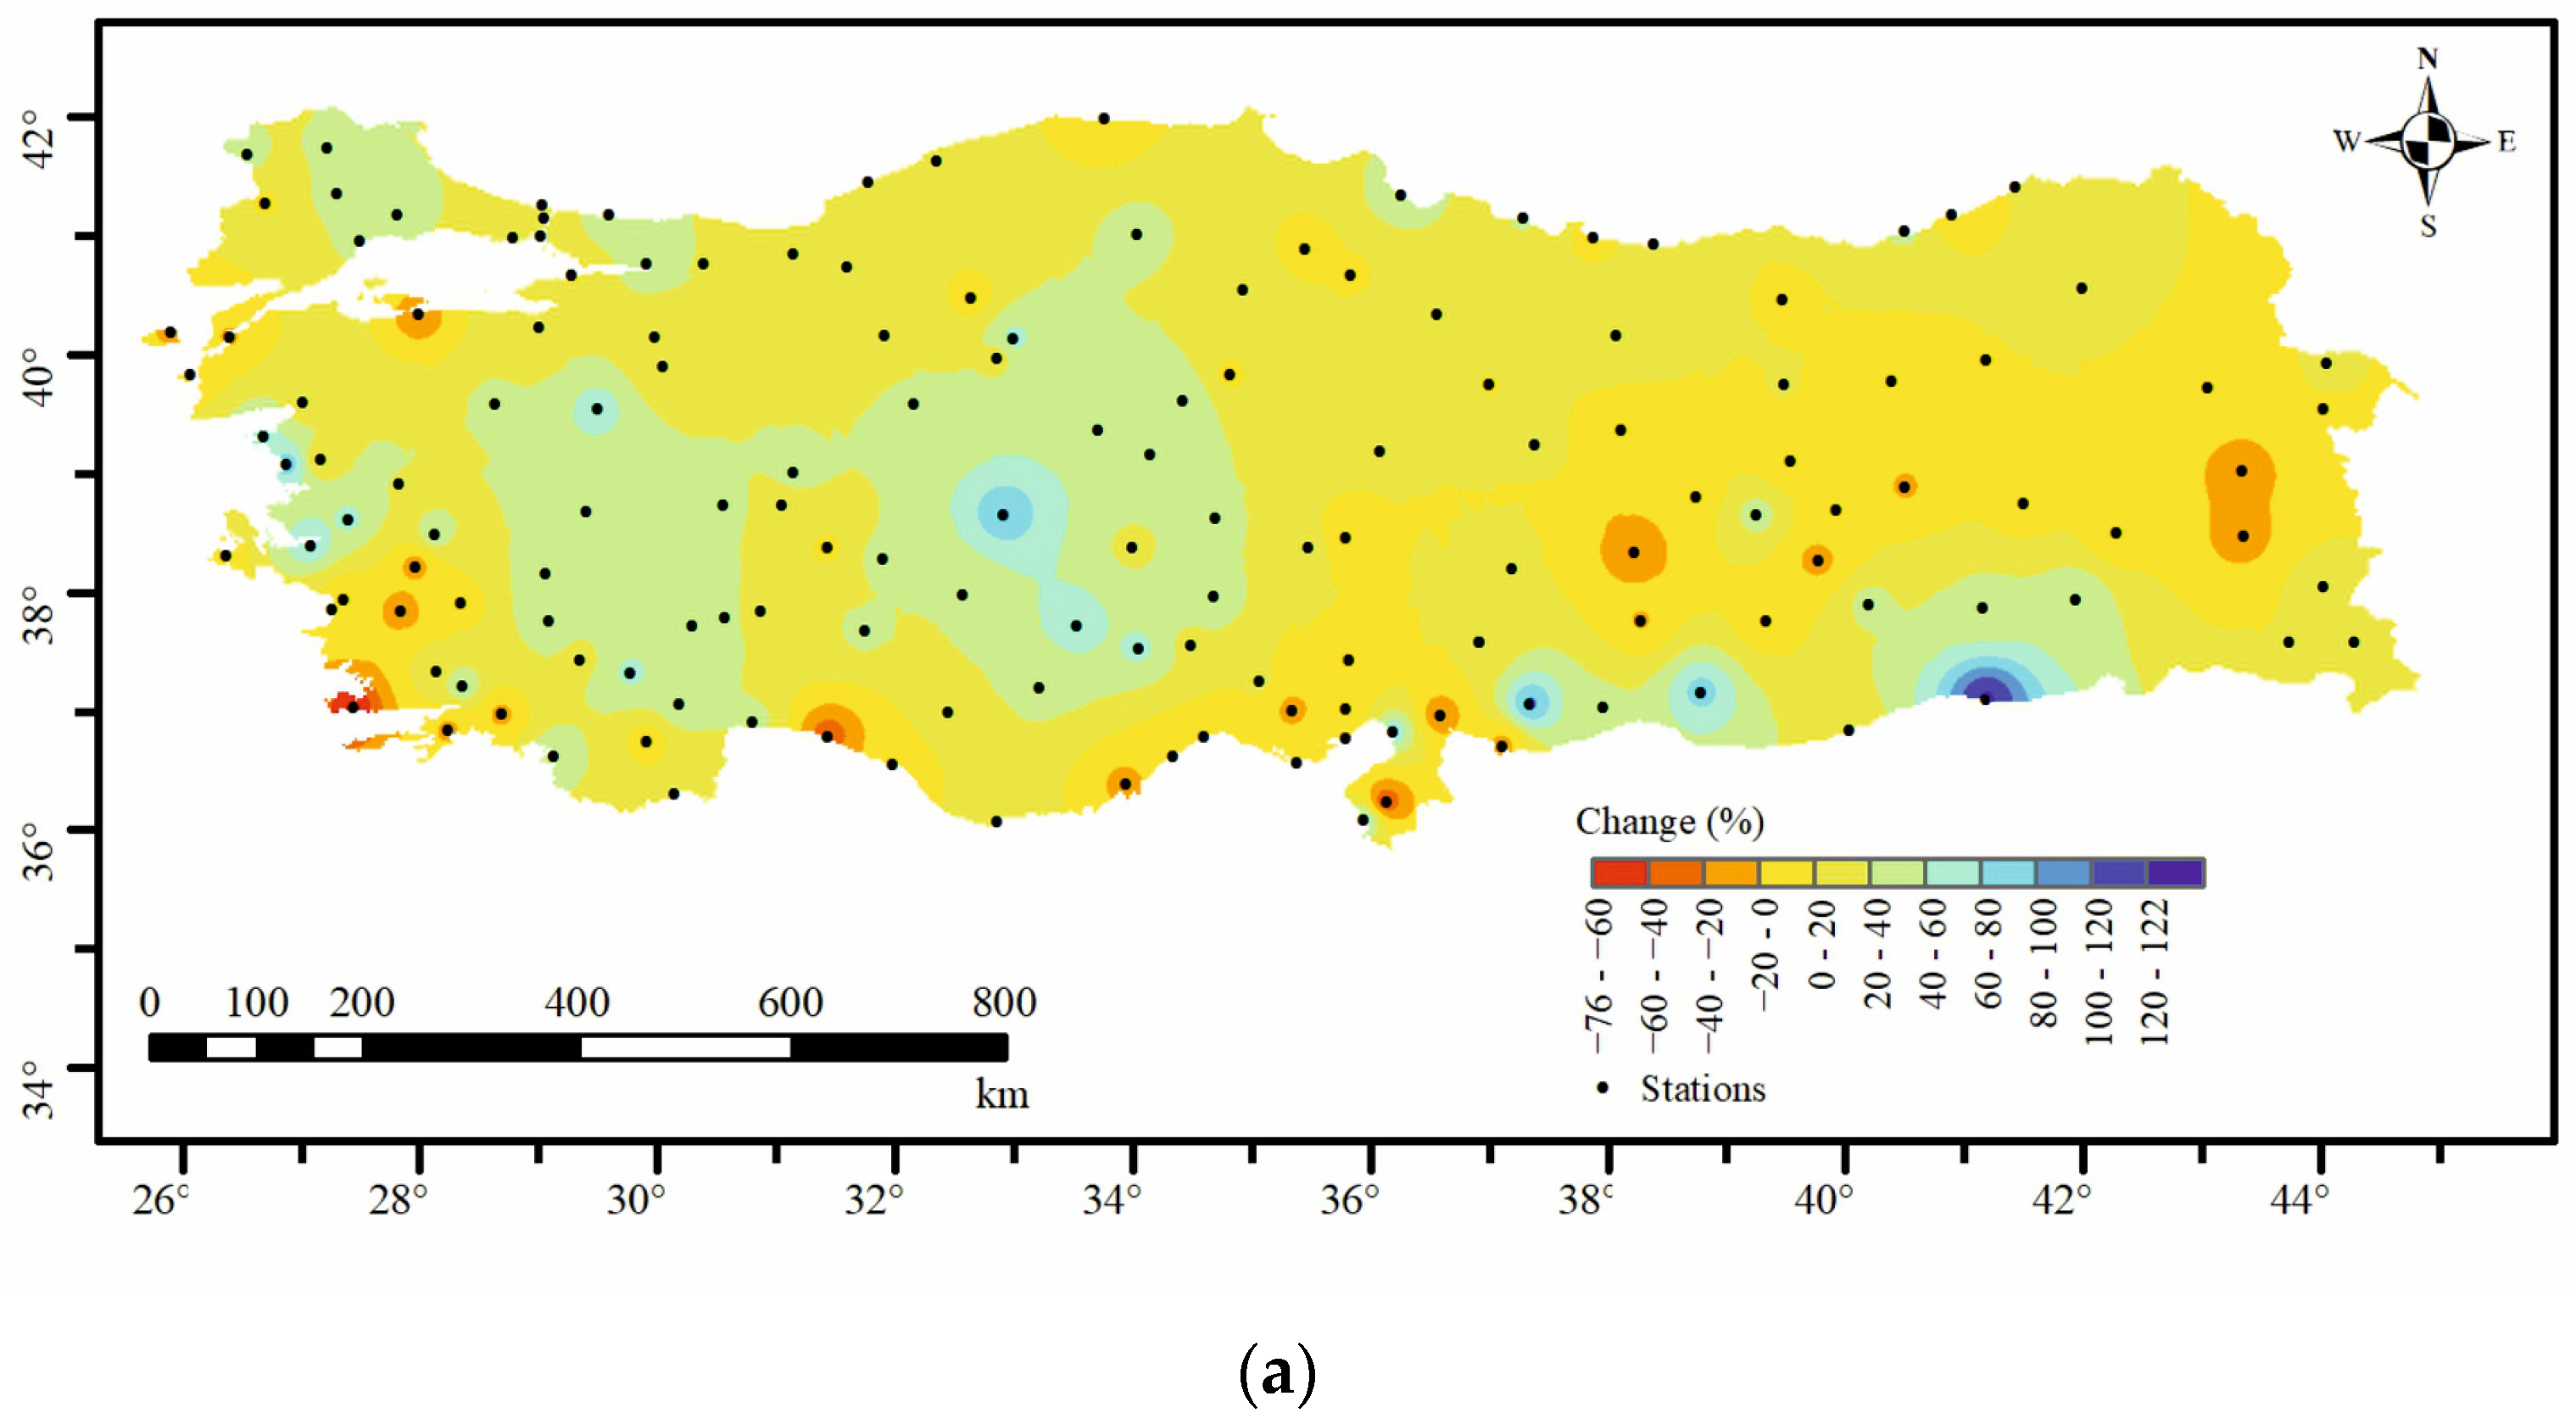
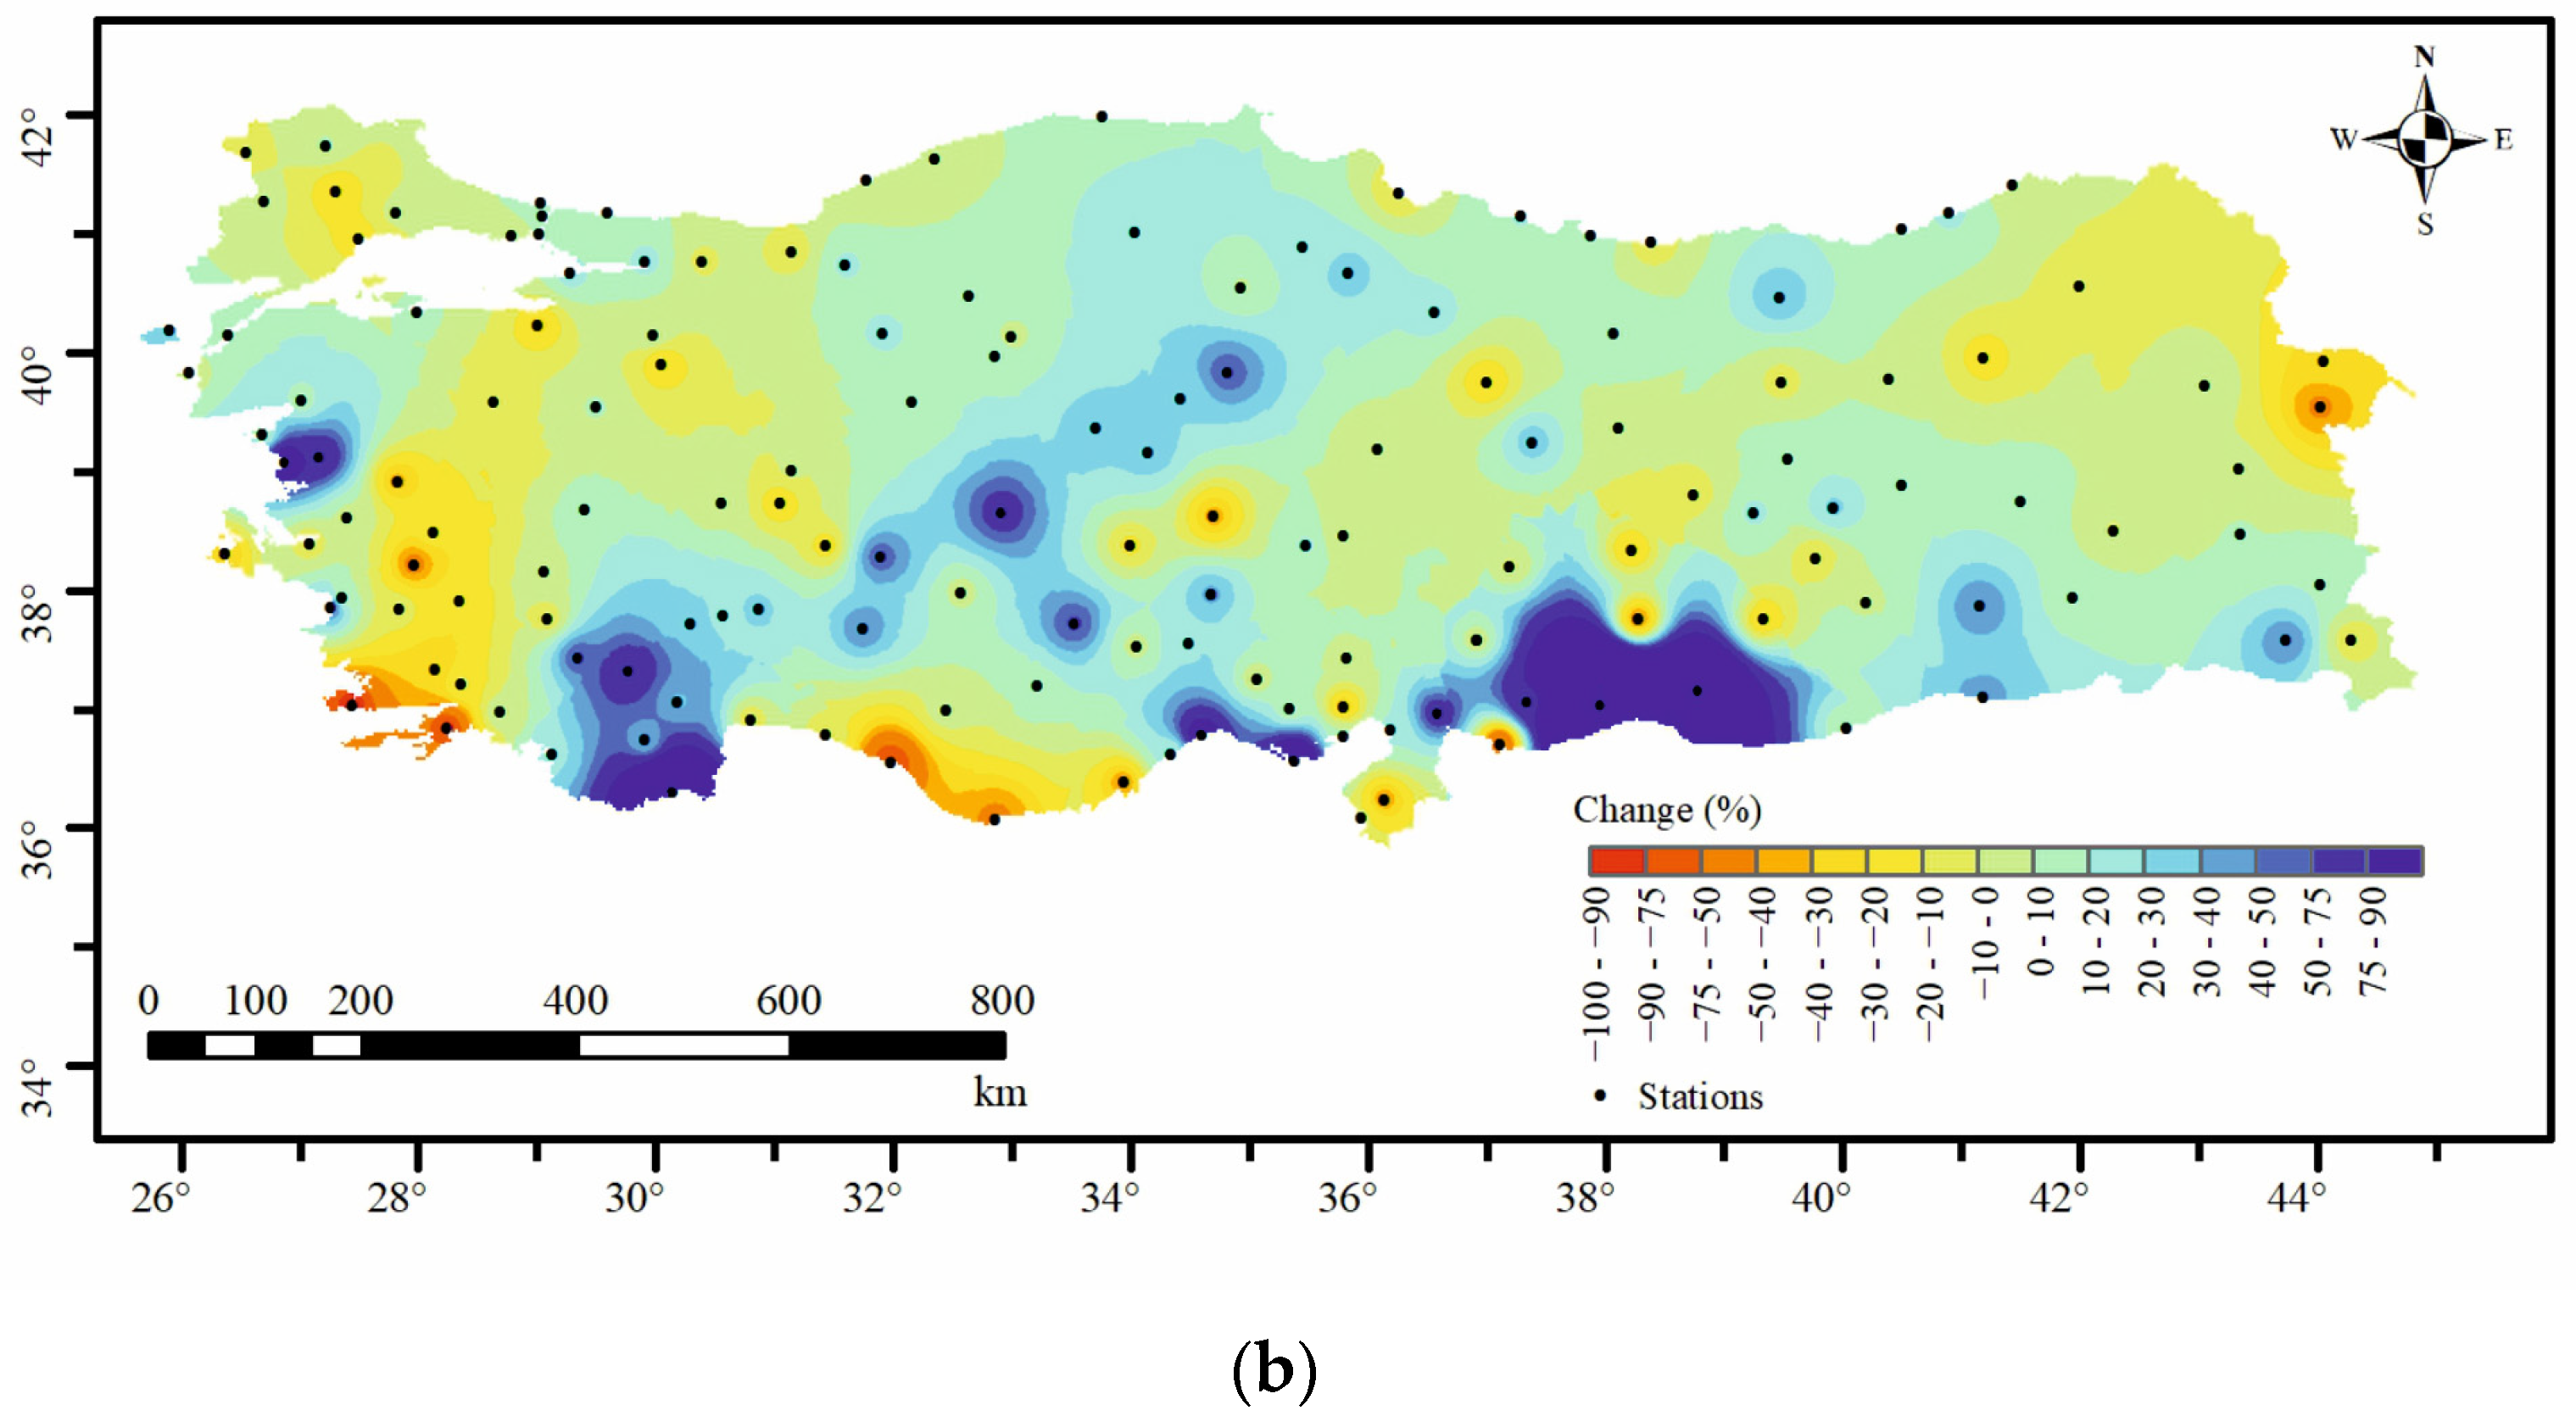
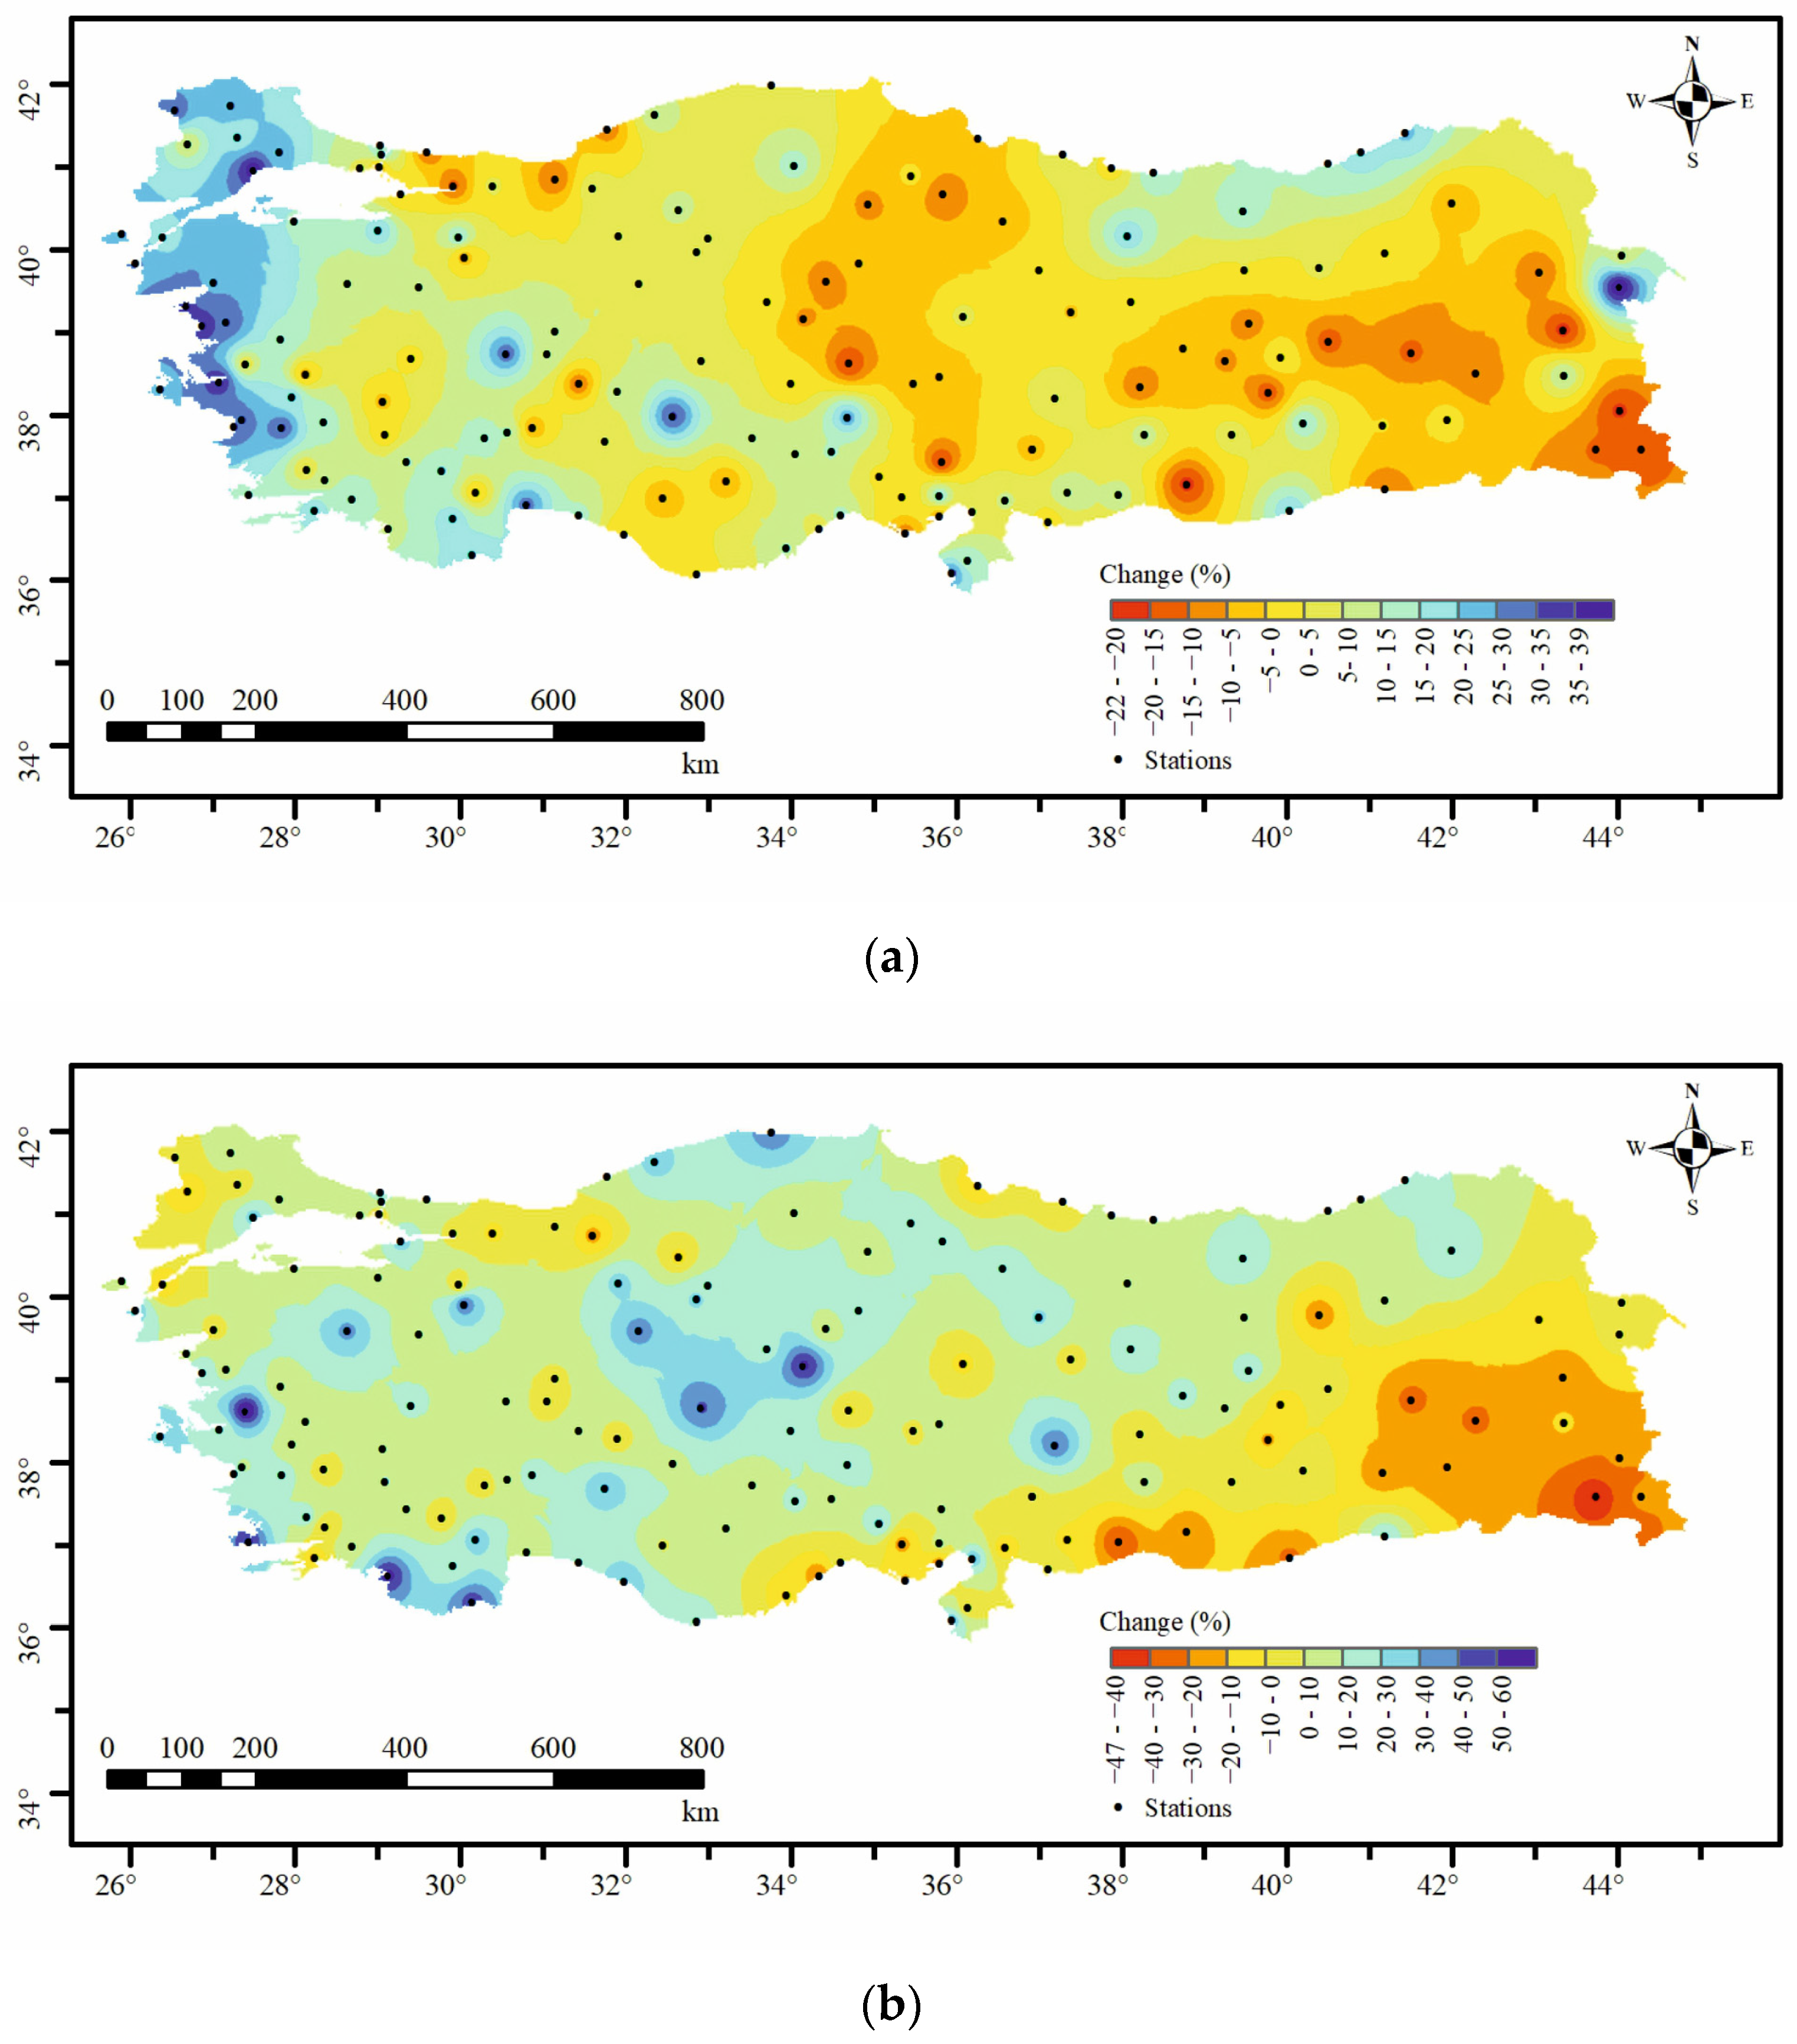
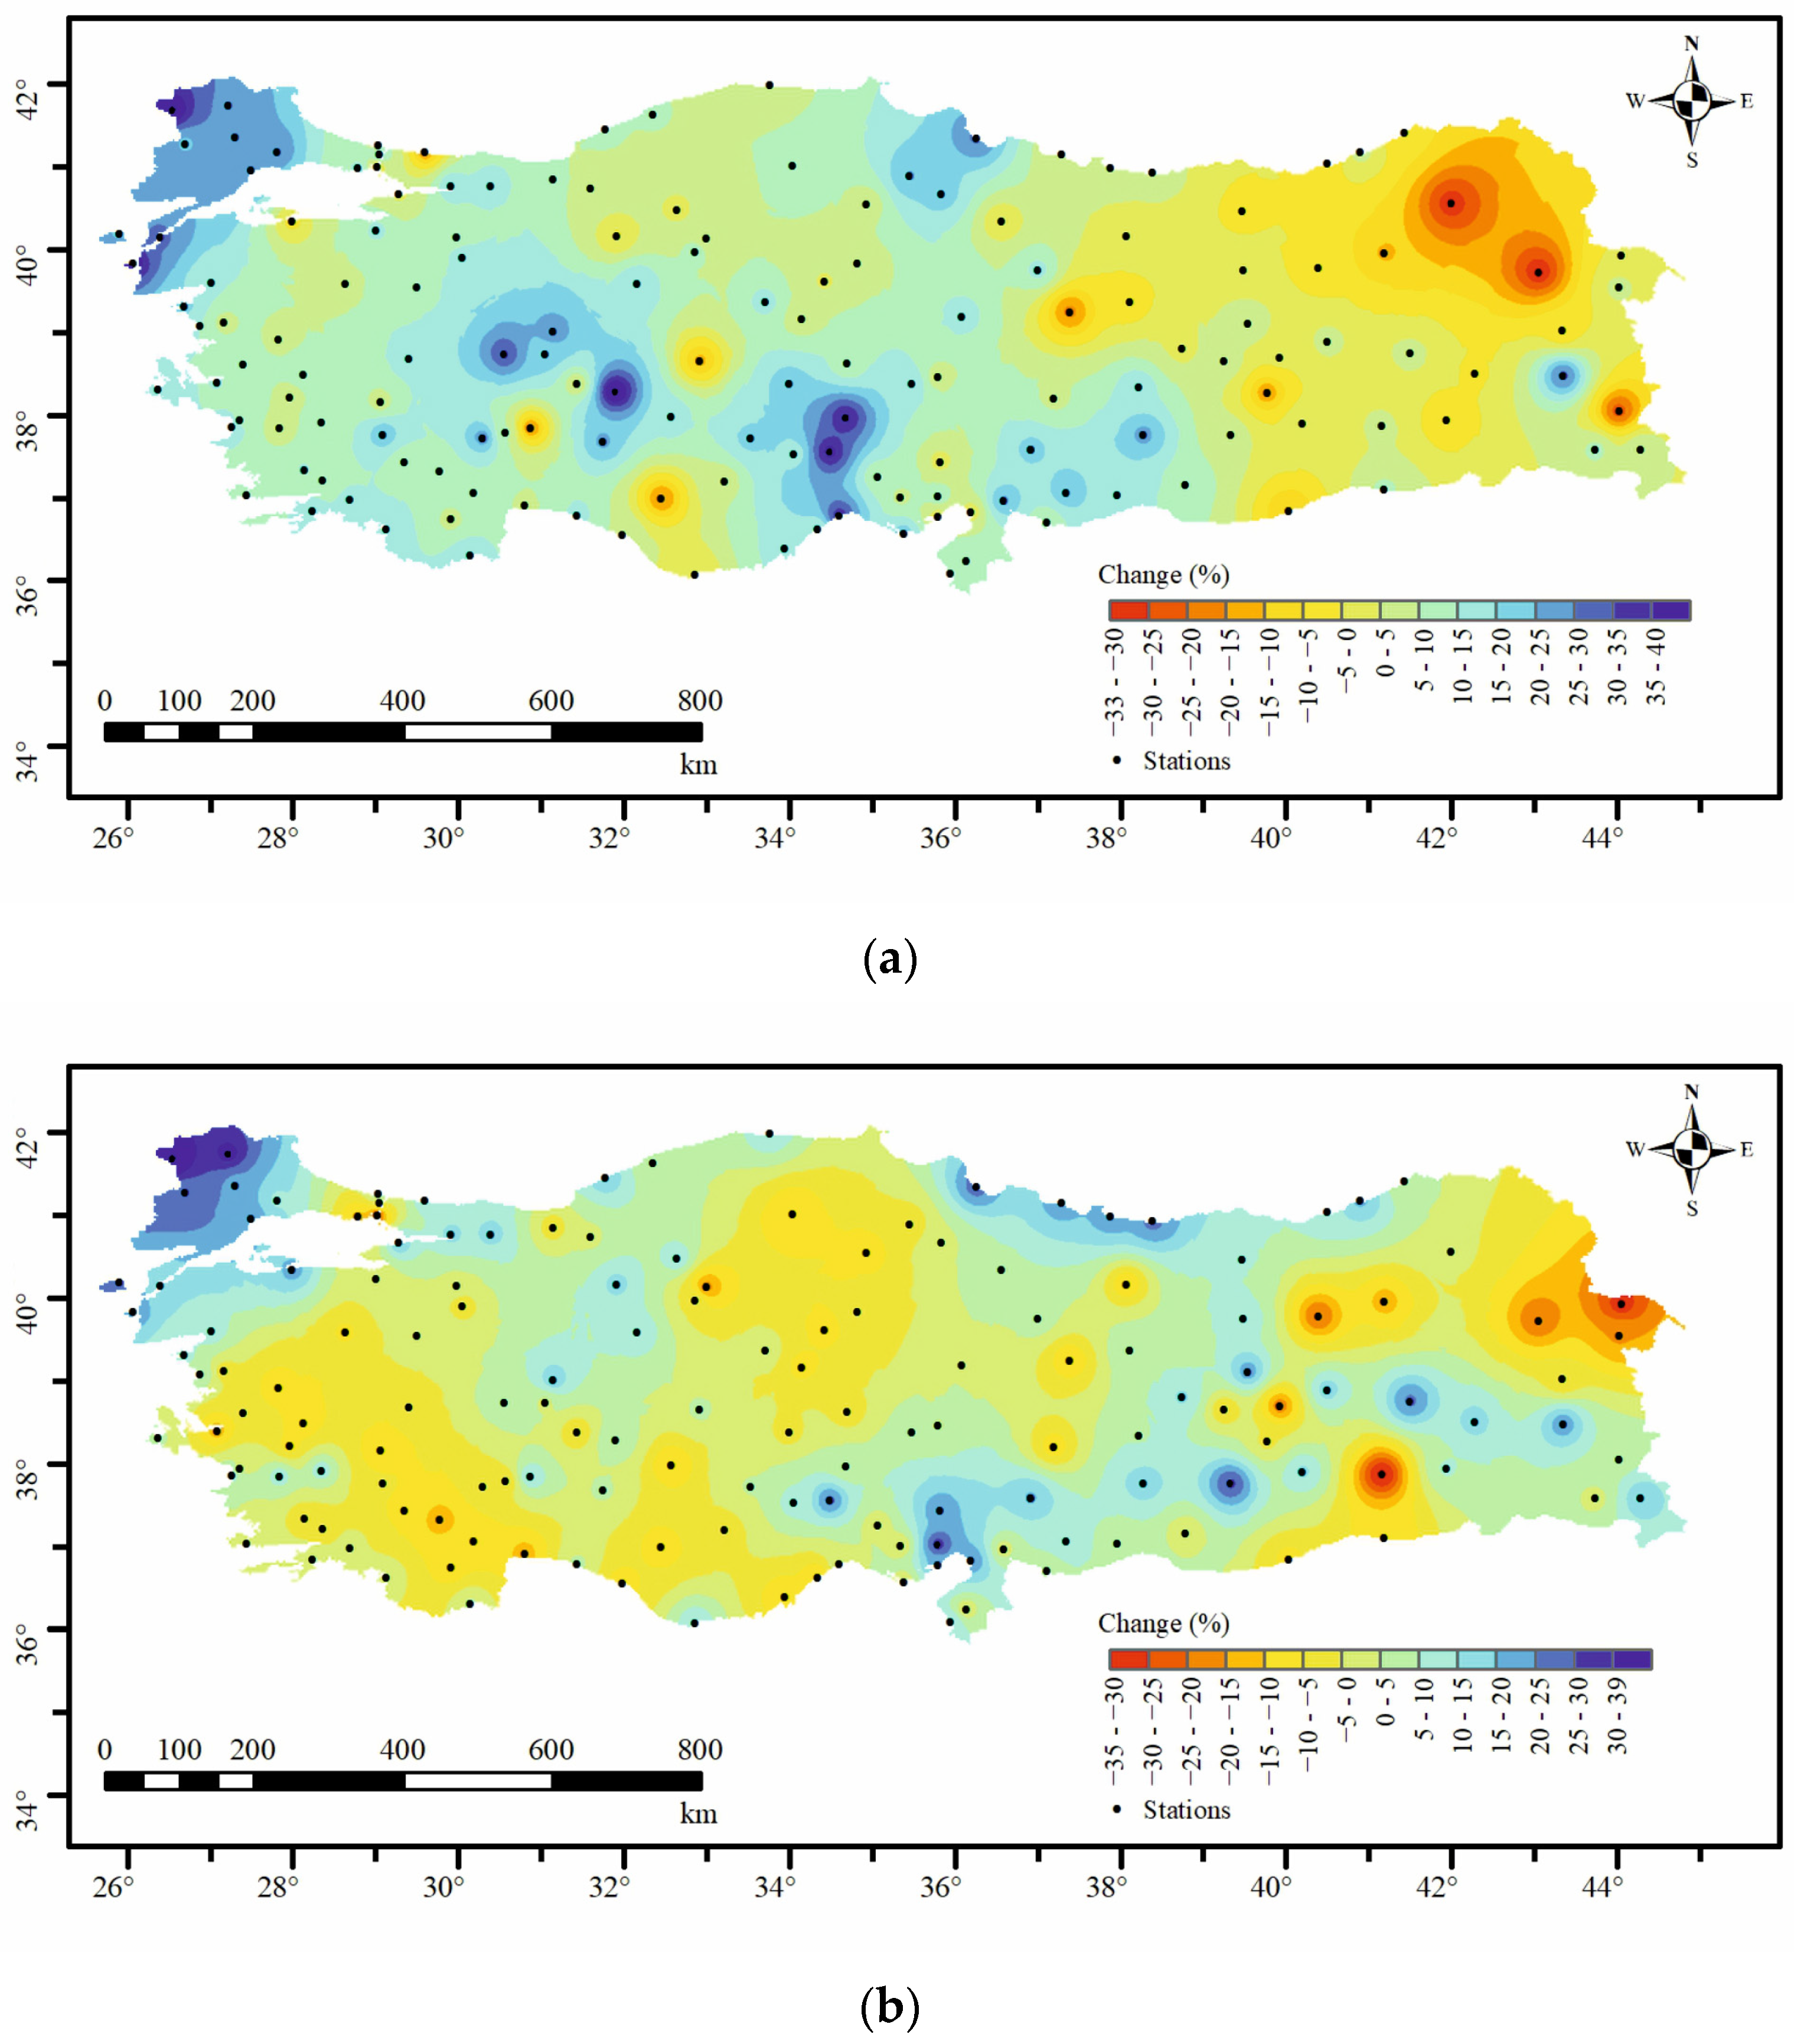
After the homogeneity tests, the analysis of seasonal and annual precipitation data from 156 homogeneous stations distributed across Turkey was conducted using the MK test. The test results were evaluated for three significance levels (20, 10, and 5%, respectively). Given the substantial number of stations, the results of the MK trend test were represented using distinct colors on Turkey’s basin map (Figure 4). As depicted in Figure 4, most stations do not exhibit statistically significant trends at the determined confidence levels. The stations marked as black dots show no discernible trend. Only stations demonstrating a trend have been distinguished with color. Upon scrutinizing the annual trends, statistically significant increases are observed at a 5% significance level in the Eastern Black Sea Basin. Furthermore, a decreasing trend is noted at the same significance level in one station located within two distinct basins. Notable increases are evident along the Black Sea coastline after analyzing the trends for the spring season. Furthermore, varying degrees of significant decreasing trends were identified in the central Anatolia and Aegean regions. A general increasing trend was observed upon reviewing the map prepared for the summer season. A decreasing trend was noted at a low significance level (20%) in one station in the east and another in the west. In autumn, a decreasing trend was evident for both high (5%) and low confidence levels, while an increasing trend was observed for medium significance levels (10%). During the winter, only an increasing trend was noted across all three levels of significance at ten stations.

4.3. IV-ITA Results

The trend analysis outcomes derived from the IV-ITA method for mean annual precipitation time series are illustrated in Figure 5 for stations 17040, 17968, and 17300, respectively. Station 17040 exhibits a monotonic increasing trend, while station 17968 displays a decreasing trend. These stations showed the same trends in the MK method. However, it was determined that there were two cases of increasing or decreasing trends in the IV-ITA method. At station 17040, an ascending trend of 4.7% was identified for the low-data group, whereas a 10.2% increase was observed for the high-data group. Conversely, station 17968 exhibited a decline of 20.2% in the low-data group and 20.5% in the high-data group. It was also determined that there was a 6.9% decreasing trend in the low-data group and an increasing trend of 7.1% in the high-data group for station 17300. As can be seen from the graphs in Figure 5, the new IV-ITA method gives the data numbers and ranges, while the classical ITA method only gives their ranges. This is particularly evident in Figure 5c. In addition to all these, the IV-ITA method provides additional information about the trends in the time series.
The IV-ITA method was applied to the precipitation time series of 156 stations, which were found to be annually and seasonally homogeneous for this study. However, it is only possible to present the graphs of some stations and seasons within the scope of the study. Therefore, the spatial interpolation map change rates are shown in Figure 6, Figure 7, Figure 8, Figure 9 and Figure 10 using the inverse-distance weighting method. It is seen from the maps prepared for annual trends (Figure 6) that trend changes vary between −20 % and 32% for the high-data category. The trends for the low-data category range from −26% to 34%. In the maps depicting the high-data category, notable decreasing trends are observed in the basins situated in the southeastern Anatolian region of Turkey. In contrast, there is an increasing trend in the basins located in the northwest. In addition, it is observed that there is an increasing trend throughout Turkey in the low-data group, except for some stations. The highest increasing trend was observed in the basins located on the southern coastline, where the Mediterranean climate is dominant.
The maps depicting seasonal trends (Figure 7, Figure 8, Figure 9 and Figure 10) illustrate notable declining trends in the southern regions of Turkey within the high-data category. Furthermore, up to an increase of 50% in high values is observed along the southwest coastline. At low values, it was determined that there were significant increases in the Black Sea coastline. It has been identified that there is an increasing trend of up to 70%, particularly evident in stations located in the Black Sea Region. During the summer, a general decreasing trend was observed in the high-data category, whereas significant increasing trends were noted in the low-data category. In the spring, an increasing trend was observed in the high-data category in the basins in the Aegean Region. In contrast, a decreasing trend was evident in the basins situated in the central Anatolia and eastern Anatolia regions. In the low-data category, a notable decreasing trend was observed in the basins in the Southeastern Anatolia Region, whereas a general increasing trend was identified elsewhere. In the maps prepared for the winter high-data category, it is seen that there is an increasing trend of up to 40% throughout Turkey, except for a few stations. In the low-data category, there are significant increasing trends in stations on the Black Sea coastline.

5. Discussion

Climate change has been making its impact felt worldwide in recent years. Countries in Mediterranean climate zones, such as Turkey, particularly experience these effects more intensely [57,58]. Among the prominent consequences are floods and landslides caused by short-term heavy rainfall. It is anticipated that alterations in the precipitation patterns, attributable to the impacts of climate change, will lead to heightened risks of severe floods and droughts [59]. According to the records, the number of casualties in natural disasters that have occurred in recent years in Turkey has increased. For example, the deaths caused by landslides between 2006 and 2013 grew nine times compared to previous periods. Based on records spanning from 1929 to 2019, a total of 1343 individuals lost their lives in 389 landslides in Turkey. The Eastern Black Sea is the region with the most fatal landslide events. When the 67-year trends of catastrophic landslide events are examined, it has been determined that there is an increasing trend, especially in this region. According to the records of fatal landslide events, it was seen that approximately 37% of the landslides occurred due to precipitation variables. This ratio has recorded precipitation as the most critical factor triggering the landslide event [60]. Floods are the second most important natural disaster experienced by Turkey, which has been affected by changing climatic conditions after the earthquakes [61]. Historically, the most devastating floods have occurred on the Black Sea and Mediterranean coasts due to heavy rainfall and topography. According to the records, 2101 flood events occurred in Turkey during the 90 years between 1930 and 2020, and 1026 people lost their lives in these floods. Recent studies have shown that the trend of floods in Turkey is increasing [62]. Hence, numerous studies have been undertaken to ascertain the trends in Turkey’s hydro-meteorological variables over time, employing various trend analysis methods [23,63,64,65,66,67]. In previous studies [57,63,67], there was a significant increase in annual precipitation in northern regions, while there was no significant trend dominance in other areas. Although these results have been updated over time, the trend has mostly stayed the same (Figure 4). However, the trend dominance of seasonal precipitation decreased in this study compared to previous studies [68,69,70]. However, trend states will dominate all seasons in the near and far future [71].
A comprehensive understanding and exploration of changes and trends in precipitation are essential for various critical areas, including sustainable water resource management, environmental protection, agricultural planning, climate change mitigation, risk assessment, and preparedness. In this study, annual and seasonal trends of precipitation time series monitored and recorded for 156 homogeneous stations in Turkey were determined using the new IV-ITA and the classical MK methods. Upon scrutinizing the annual trend maps generated from the MK and IV-ITA methods, it becomes evident that notable increasing trends exist along the Black Sea coasts. Due to its geographical location and characteristics, the Eastern Black Sea Basin is the region in Turkey that experiences frequent episodes of heavy rainfall, leading to recurrent floods and landslides. These results coincide with the trends of flood and landslide disasters mentioned above. Similar results can be said for seasonal trend analyses. In the spring and winter, especially on the Black Sea coast, increasing trends were determined for the MK and IV-ITA methods. Floods have increased in the region due to increased precipitation and snowmelt during spring. However, when the results obtained with the MK method are compared with the IV-ITA, it is seen that it detects a trend for a much smaller number of stations. In the IV-ITA method, trend results were determined for both low- and high-data categories. The maps gave much more detailed information for determining the regions with the trend. When the results obtained from the MK method are compared with the IV-ITA results for this study, the IV-ITA gives much more detailed results than the MK method. Similar results were also emphasized in other studies using the IV-ITA method. The IV-ITA method was initially introduced by Guclu [11] and subsequently applied by Mallick et al. [17] to assess trends in time series of precipitation variables within homogeneous regions of Saudi Arabia. Guclu [11] used the IV-ITA method for eight stations located in regions of Turkey with different climatic characteristics. In addition, the classical MK method was applied to determine the advantages of the IV-ITA method. Guclu [11] stated that while the MK method could not detect statistically significant trends for many stations, the IV-ITA method gave much more detailed results. This is also reported by Mallick et al. [17]. They utilized the IV-ITA, MK, and ITA methods on 40 years of precipitation data collected from 22 meteorological stations in Saudi Arabia. They reported that the classical MK method only identified monotonic increase, decrease, and non-trend trends. Their studies emphasized that the developed IV-ITA method made essential contributions to the ITA method and provided much more detailed information about the time series trends.
Trend analysis studies are increasing daily, and research comparing new methods with established ones is finding its place in the literature. The primary concern in all these studies is the ability to detect the trend of the relevant variable in a more profound and detailed manner. In this context, developed methods are designed to facilitate a better understanding of trends [43]. One of the most recent methods among these is the IV-ITA method. Comparing the frequently used MK method for Turkey, located in the Mediterranean climate zone and highly sensitive to climate change, with the IV-ITA method, it is significant for contributing to the literature. This study identified trends for many stations that were not detected using the MK method. A detailed trend analysis was also conducted for low- and high-data groups. The findings of the IV-ITA method, which was developed to facilitate a clearer understanding of these trends, were presented through mapping. This study will provide crucial information for future trend analyses and serve as a framework for comparing trend analysis results to future period data generated under different climate projections and scenarios. Findings obtained within the scope of this study are anticipated to address the needs of various users, ranging from sustainable water resource management to climate change mitigation.

6. Conclusions

This study aims to apply the improved visualization version (IV-ITA), the newly developed version of classical ITA, to precipitation time series obtained from the homogeneous stations in Turkey. Furthermore, the Mann–Kendall (MK) method, widely employed in trend analysis literature, was utilized on the same time series to compare the outcomes with the IV-ITA method. Trend analyses were carried out annually and seasonally. The significance of the study is highlighted by its ability to offer accurate and comprehensive assessments of precipitation patterns in Turkey. This contributes to a deeper understanding of climate fluctuations and their potential impacts on the environment, agriculture, and water resources. Introducing and implementing an enhanced visualization version (IV-ITA) actively contributes to improving methodologies used in precipitation trend analysis. As a result, the study provides valuable insights for climate studies and informs decision-making processes related to water resource management. The conclusions drawn from our research can be summarized as follows:
  • While the MK method detected trends for only a few stations among the 156 stations, the newly developed IV-ITA method identified trends for a significantly more significant number of stations and separately determined these trends for both the high- and low-data groups. This approach provides a more detailed interpretation of trend detection and enables the detection of trends that traditional methods cannot detect;
  • According to the IV-ITA method, annual trends for the low- and high-data categories ranged from −20 to 30 and −26 to 34, respectively. Conventional methods cannot graphically represent the trend variability of extreme events, such as ‘high’ and ‘low’ monthly precipitation values;
  • According to the IV-ITA method for seasonal trends, different trends are detected for other data groups in different regions for each season. This result highlights the advantage of the IV-ITA method over the MK. The study has the potential to contribute to advancing trend analysis literature with its presented results, and its application to different climate parameters would yield more comprehensive and in-depth outcomes;
  • For countries in the Mediterranean Basin that experience significant impacts of climate change, the IV-ITA method can be employed to investigate trends in various hydrological variables. Thus, using the IV-ITA method, the dominant climate regions in these countries will be identified based on their respective types.
This study also has some limitations. In this study, only the trends of previous precipitation data were investigated. Hence, the results obtained within the study’s scope are intricately linked to the reliability of the data collected from meteorological stations. In addition to the data obtained from meteorological observation stations, a spatial assessment can be conducted using reanalysis datasets incorporating global data. The trends in maximum and minimum temperature values can also be investigated to evaluate climate change comprehensively. Using similar methods is suggested to analyze future precipitation time series trends under the effects of climate change. Mediterranean countries such as Turkey need to determine the changes that will occur in the precipitation regime in the future under different scenarios with the effects of climate change and to make trend analyses on these values. In this way, past and future trends can be compared, and more effective decisions can be taken against the different effects of climate change, especially regarding water resource management. Furthermore, employing the IV-ITA method for assessing the trends in drought intensity within hydrological basins in Turkey is advisable.

Funding

This research received no external funding.

Institutional Review Board Statement

Not applicable.

Informed Consent Statement

Not applicable.

Data Availability Statement

The datasets used and/or analyzed during the current study are available from the corresponding author upon reasonable request.

Conflicts of Interest

The author declares that there are no conflict of interest regarding the publication of this article.

References

  1. Bayazit, M. Nonstationarity of hydrological records and recent trends in trend analysis: A state-of-the-art review. Environ. Process. 2015, 2, 527–542. [Google Scholar] [CrossRef]
  2. Chen, J.; Lyu, Y.; Zhao, Z.; Liu, H.; Zhao, H.; Li, Z. Using the multidimensional synthesis methods with non-parameter test, multiple time scales analysis to assess water quality trend and its characteristics over the past 25 years in the Fuxian Lake, China. Sci. Total Environ. 2019, 655, 242–254. [Google Scholar] [CrossRef] [PubMed]
  3. Luo, P.; Kang, S.; Zhou, M.; Lyu, J.; Aisyah, S.; Binaya, M.; Regmi, R.K.; Nover, D. Water quality trend assessment in Jakarta: A rapidly growing Asian megacity. PLoS ONE 2019, 14, e0219009. [Google Scholar] [CrossRef] [PubMed]
  4. Aydogan, B.; Ayat, B. Spatial variability of long-term trends of significant wave heights in the Black Sea. Appl. Ocean Res. 2018, 79, 20–35. [Google Scholar] [CrossRef]
  5. Ghafarian, P.; Tajbakhsh, S.; Delju, A.H. Analysis of the Long-Term Trend of Temperature, Precipitation, and Dominant Atmospheric Phenomena in Lake Urmia. In The Handbook of Environmental Chemistry; Springer: Berlin/Heidelberg, Germany, 2021. [Google Scholar] [CrossRef]
  6. Ceribasi, G.; Ceyhunlu, A.I.; Ahmed, N. Analysis of temperature data by using innovative polygon trend analysis and trend polygon star concept methods: A case study for Susurluk Basin, Turkey. Acta Geophys. 2021, 69, 1949–1961. [Google Scholar] [CrossRef]
  7. Madhukar, A.; Dashora, K.; Kumar, V. Climate trends in temperature and water variables during wheat growing season and impact on yield. Environ. Process. 2021, 8, 1047–1072. [Google Scholar] [CrossRef]
  8. Mehta, D.J.; Yadav, S.M. Long-term trend analysis of climate variables for arid and semi-arid regions of an Indian State Rajasthan. Int. J. Hydrol. Sci. Technol. 2022, 13, 191–214. [Google Scholar] [CrossRef]
  9. Katipoglu, O.M. Analysis of spatial variation of temperature trends in the semiarid Euphrates basin using statistical approaches. Acta Geophys. 2022, 70, 1899–1921. [Google Scholar] [CrossRef]
  10. Alehu, B.A.; Bitana, S.G. Assessment of climate change impact on water balance of Lake Hawassa Catchment. Environ. Process. 2023, 10, 14. [Google Scholar] [CrossRef]
  11. Guclu, Y.S. Improved visualization for trend analysis by comparing with classical Mann-Kendall test and ITA. J. Hydrol. 2020, 584, 124674. [Google Scholar] [CrossRef]
  12. San, M.; Akcay, F.; Linh, N.T.T.; Kankal, M.; Pham, Q.B. Innovative and polygonal trend analyses applications for rainfall data in Vietnam. Theor. Appl. Climatol. 2021, 144, 809–822. [Google Scholar] [CrossRef]
  13. Alashan, S. An improved version of innovative trend analyses. Arab. J. Geosci. 2018, 11, 50. [Google Scholar] [CrossRef]
  14. Akcay, F.; Kankal, M.; San, M. Innovative approaches to the trend assessment of streamflows in the eastern Black Sea basin, Turkey. Hydrol. Sci. J. 2022, 67, 222–247. [Google Scholar] [CrossRef]
  15. Dimitriadou, S.; Nikolakopoulos, K.G. Evapotranspiration Trends and Interactions in Light of the Anthropogenic Footprint and the Climate Crisis: A Review. Hydrology 2021, 8, 163. [Google Scholar] [CrossRef]
  16. Sanikhani, H.; Kisi, O.; Mirabbasi, R.; Meshram, S.G. Trend analysis of rainfall pattern over the Central India during 1901–2010. Arab. J. Geosci. 2018, 11, 437. [Google Scholar] [CrossRef]
  17. Mallick, J.; Talukdar, S.; Almesfer, M.K.; Alsubih, M.; Ahmed, M.; Islam, A.R.M. Identification of rainfall homogenous regions in Saudi Arabia for experimenting and improving trend detection techniques. Environ. Sci. Pollut. Res. 2021, 29, 25112–25137. [Google Scholar] [CrossRef]
  18. Mallick, J.; Talukdar, S.; Alsubih, M.; Salam, R.; Ahmed, M.; Kahla, N.B.; Shamimuzzaman, M. Analysing the trend of rainfall in Asir region of Saudi Arabia using the family of Mann-Kendall tests, innovative trend analysis, and detrended fluctuation analysis. Theor. Appl. Climatol. 2021, 143, 823–841. [Google Scholar] [CrossRef]
  19. Caloiero, T. Analysis of rainfall trend in New Zealand. Environ. Earth Sci. 2015, 73, 6297–6310. [Google Scholar] [CrossRef]
  20. Mondal, A.; Khare, D.; Kundu, S. Spatial and temporal analysis of rainfall and temperature trend of India. Theor. Appl. Climatol. 2015, 122, 143–158. [Google Scholar] [CrossRef]
  21. Nouaceur, Z.; Murarescu, O. Rainfall variability and trend analysis of annual rainfall in North Africa. Int. J. Atmos. Sci. 2016, 2016, 7230450. [Google Scholar] [CrossRef]
  22. Chattopadhyay, S.; Edwards, D.R. Long-term trend analysis of precipitation and air temperature for Kentucky, United States. Climate 2016, 4, 10. [Google Scholar] [CrossRef]
  23. Oztopal, A.; Sen, Z. Innovative trend methodology applications to precipitation records in Turkey. Water Resour. Manag. 2017, 31, 727–737. [Google Scholar] [CrossRef]
  24. Asfaw, A.; Simane, B.; Hassen, A.; Bantider, A. Variability and time series trend analysis of rainfall and temperature in northcentral Ethiopia: A case study in Woleka sub-basin. Weather Clim. Extrem. 2018, 19, 29–41. [Google Scholar] [CrossRef]
  25. Saadi, Z.; Shahid, S.; Ismail, T.; Chung, E.S.; Wang, X.J. Trends analysis of rainfall and rainfall extremes in Sarawak, Malaysia using modified Mann–Kendall test. Meteorol. Atmos. Phys. 2019, 131, 263–277. [Google Scholar] [CrossRef]
  26. Alsubih, M.; Kumari, M.; Mallick, J.; Ramakrishnan, R.; Islam, S.; Singh, C.K. Time series trend analysis of rainfall in the last five decades and its quantification in Aseer Region of Saudi Arabia. Arab. J. Geosci. 2021, 14, 519. [Google Scholar] [CrossRef]
  27. Hajani, E.; Klari, Z. Trends analysis in rainfall data series in Duhok city, Kurdistan region, Iraq. Model. Earth. Syst. Environ. 2022, 8, 4177–4190. [Google Scholar] [CrossRef]
  28. Sen, Z. Partial trend identification by change-point successive average methodology (SAM). J. Hydrol. 2019, 571, 288–299. [Google Scholar] [CrossRef]
  29. Mann, H.B. Nonparametric tests against trend. Econom. J. Econom. Soc. 1945, 13, 245–259. [Google Scholar] [CrossRef]
  30. Kendall, M.G. Rank Correlation Method; Charless Griffin: London, UK, 1975. [Google Scholar]
  31. Sen, Z. Innovative trend significance test and applications. Theor. Appl. Climatol. 2017, 127, 939–947. [Google Scholar] [CrossRef]
  32. Sen, P.K. Estimates of the regression coefficient based on Kendall’s tau. J. Am. Stat. Assoc. 1968, 63, 1379–1389. [Google Scholar] [CrossRef]
  33. Sen, Z. Innovative trend analysis methodology. J. Hydrol. Eng. 2012, 17, 1042–1046. [Google Scholar] [CrossRef]
  34. Sen, Z. Trend identification simulation and application. J. Hydrol. Eng. 2014, 19, 635–642. [Google Scholar] [CrossRef]
  35. Sen, Z. Innovative Trend Methodologies in Science and Engineering; Springer International Publishing: New York, NY, USA, 2017; pp. 1–349. [Google Scholar] [CrossRef]
  36. Sen, Z. Innovative Trend Analyses. In Innovative Trend Methodologies in Science and Engineering; Springer: Cham, Switzerland, 2017; pp. 175–226. [Google Scholar] [CrossRef]
  37. Naveed, A.; Genxu, W.; Haishen, L.; Martijn, J.B.; Hero, M.; Foyez, A.P.; Shahid, A.; Muhammad, A.I. Attribution of Changes in Streamflow to Climate Change and Land Cover Change in Yangtze River Source Region, China. Water 2022, 14, 259. [Google Scholar] [CrossRef]
  38. Wu, H.; Qian, H. Innovative trend analysis of annual and seasonal rainfall and extreme values in Shaanxi, China, since the 1950s. Int. J. Climatol. 2017, 37, 2582–2592. [Google Scholar] [CrossRef]
  39. Caloiero, T.; Coscarelli, R.; Ferrari, E. Application of the innovative trend analysis method for the trend analysis of rainfall anomalies in southern Italy. Water Resour. Manag. 2018, 32, 4971–4983. [Google Scholar] [CrossRef]
  40. Zhou, Z.; Wang, L.; Lin, A.; Zhang, M.; Niu, Z. Innovative trend analysis of solar radiation in China during 1962–2015. Renew. Energy 2018, 119, 675–689. [Google Scholar] [CrossRef]
  41. Li, J.; Wu, W.; Ye, X.; Jiang, H.; Gan, R.; Wu, H.; He, J.; Jiang, Y. Innovative trend analysis of main agriculture natural hazards in China during 1989–2014. Nat. Hazard 2019, 95, 677–720. [Google Scholar] [CrossRef]
  42. Wang, Y.; Xu, Y.; Tabari, H.; Wang, J.; Wang, Q.; Song, S.; Hu, Z. Innovative trend analysis of annual and seasonal rainfall in the Yangtze River Delta, eastern China. Atmos. Res. 2020, 231, 104673. [Google Scholar] [CrossRef]
  43. Alifujiang, Y.; Abuduwaili, J.; Maihemuti, B.; Emin, B.; Groll, M. Innovative trend analysis of precipitation in the Lake Issyk-Kul Basin, Kyrgyzstan. Atmosphere 2020, 11, 332. [Google Scholar] [CrossRef]
  44. Mohorji, A.M.; Sen, Z.; Almazroui, M. Trend analyses revision and global monthly temperature innovative multi-duration analysis. Earth Syst. Environ. 2017, 1, 9. [Google Scholar] [CrossRef]
  45. Tabari, H.; Taye, M.T.; Onyutha, C.; Willems, P. Decadal analysis of river flow extremes using quantile-based approaches. Water Resour. Manag. 2017, 31, 3371–3387. [Google Scholar] [CrossRef]
  46. Guclu, Y.S. Multiple Sen-innovative trend analyses and partial Mann-Kendall test. J. Hydrol. 2018, 566, 685–704. [Google Scholar] [CrossRef]
  47. Deniz, A.; Toros, H.; Incecik, S. Spatial variations of climate indices in Turkey. Int. J. Climatol. 2011, 31, 394–403. [Google Scholar] [CrossRef]
  48. Von Neumann, J. Distribution of the ratio of the mean square successive difference to the variance. Ann. Math. Stat. 1941, 12, 367–395. Available online: https://www.jstor.org/stable/2235951 (accessed on 1 September 2023). [CrossRef]
  49. Pettitt, A.N. A non-parametric approach to the change-point problem. J. R. Stat. Soc. C 1979, 28, 126–135. [Google Scholar] [CrossRef]
  50. Buishand, T.A. Some methods for testing the homogeneity of rainfall records. J. Hydrol. 1982, 58, 11–27. [Google Scholar] [CrossRef]
  51. Alexandersson, H. A homogeneity test applied to precipitation data. J. Climatol. 1986, 6, 661–675. [Google Scholar] [CrossRef]
  52. Wijngaard, J.B.; Klein Tank, A.M.G.; Können, G.P. Homogeneity of 20th century European daily temperature and precipitation series. Int. J. Climatol. A J. R. Meteorol. Soc. 2003, 23, 679–692. [Google Scholar] [CrossRef]
  53. Yue, S.; Wang, C. The Mann-Kendall test modified by effective sample size to detect trend in serially correlated hydrological series. Water Resour. Manag. 2004, 18, 201–218. [Google Scholar] [CrossRef]
  54. Hamed, K.H. Exact distribution of the Mann–Kendall trend test statistic for persistent data. J. Hydrol. 2009, 365, 86–94. [Google Scholar] [CrossRef]
  55. Tosunoglu, F.; Can, I.; Kahya, E. Evaluation of spatial and temporal relationships between large-scale atmospheric oscillations and meteorological drought indexes in Turkey. Int. J. Climatol. 2018, 38, 4579–4596. [Google Scholar] [CrossRef]
  56. Arikan, B.; Kahya, E. Homogeneity revisited: Analysis of updated precipitation series in Turkey. Theor. Appl. Climatol. 2019, 135, 211–220. [Google Scholar] [CrossRef]
  57. Cicek, I.; Duman, N. Seasonal and annual precipitation trends in Turkey. Carpathian J. Earth Environ. Sci. 2015, 10, 77–84. [Google Scholar]
  58. Touhedi, H.; Kankal, M.; Yıldız, M.B. Trend analysis of maximum rainfall series of standard durations in Turkey with innovative methods. Nat. Hazards 2023, 1–33. [Google Scholar] [CrossRef]
  59. Trenberth, K.E. Changes in precipitation with climate change. Clim. Res. 2011, 47, 123–138. [Google Scholar] [CrossRef]
  60. Gorum, T.; Fidan, S. Spatiotemporal variations of fatal landslides in Turkey. Landslides 2021, 18, 1691–1705. [Google Scholar] [CrossRef]
  61. Gurer, I.; Ozguler, H. Turkey: Recent flood disasters in northwestern black sea region. WMO/GWP Associated Programme on Flood Management. Integrated Flood Management: Case Study. 2004; pp. 1–20. Available online: https://www.floodmanagement.info/publications/casestudies/cs_turkey_sum.pdf (accessed on 1 September 2023).
  62. Haltas, I.; Yildirim, E.; Oztas, F.; Demir, I. A comprehensive flood event specification and inventory: 1930–2020 Turkey case study. Int. J. Disaster Risk Reduct. 2021, 56, 102086. [Google Scholar] [CrossRef]
  63. Partal, T.; Kahya, E. Trend analysis in Turkish precipitation data. Hydrol. Process. Int. J. 2006, 20, 2011–2026. [Google Scholar] [CrossRef]
  64. Unal, Y.S.; Deniz, A.; Toros, H.; Incecik, S. Temporal and spatial patterns of precipitation variability for annual, wet, and dry seasons in Turkey. Int. J. Climatol. 2012, 32, 392–405. [Google Scholar] [CrossRef]
  65. Topaloglu, F.; Ozfidaner, M. Regional trends of precipitation in Turkey. Fresenius Environ. Bull. 2012, 21, 2908–2915. [Google Scholar]
  66. Guner, B.U. Trend analysis of precipitation and drought in the A egean region, Turkey. Meteorol. Appl. 2017, 24, 239–249. [Google Scholar] [CrossRef]
  67. Hadi, S.J.; Tombul, M. Long-term spatiotemporal trend analysis of precipitation and temperature over Turkey. Meteorol. Appl. 2018, 25, 445–455. [Google Scholar] [CrossRef]
  68. Turkes, M.; Koc, T.; Sarıs, F. Spatial and temporal analysis of the changes and trends in precipitation total and intensity series of Turkey. Turk. J. Geogr. Sci. 2007, 5, 57–73. [Google Scholar]
  69. Turkes, M.; Koc, T.; Saris, F. Spatiotemporal variability of precipitation total series over Turkey. Int. J. Climatol. A J. R. Meteorol. Soc. 2009, 29, 1056–1074. [Google Scholar] [CrossRef]
  70. Turkes, M. Climate and Drought in Turkey. In Water Resources of Turkey. World Water Resources; Harmancioglu, N., Altinbilek, D., Eds.; Springer: Cham, Switzerland, 2020; Volume 2. [Google Scholar] [CrossRef]
  71. Bagcaci, S.C.; Yucel, I.; Duzenli, E.; Yilmaz, M.T. Intercomparison of the expected change in the temperature and the precipitation retrieved from CMIP6 and CMIP5 climate projections: A Mediterranean hot spot case, Turkey. Atmos. Res. 2021, 256, 105576. [Google Scholar] [CrossRef]
Figure 1. The digital elevation model of hydrological basins in Turkey.
Sustainability 15 16523 g001
Figure 2. Sample trend analysis for station 17024 using (a) IV-ITA and (b) ITA.
Sustainability 15 16523 g002
Figure 3. The locations of the homogeneous meteorological stations in Turkey.
Sustainability 15 16523 g003
Figure 4. The significance of the annual (a) and seasonal ((b), spring, (c), summer, (d), autumn, and (e), winter) long-term trends in Turkey based on the MK test for different confidence levels.
Sustainability 15 16523 g004aSustainability 15 16523 g004b
Figure 5. The trend analysis results from the ITA and IV-ITA methods of mean annual precipitation time series for the meteorology stations numbered (a) 17040, (b) 17968, and (c) 17300, Turkey.
Sustainability 15 16523 g005
Figure 6. Changes in annual trends for (a) high- and (b) low-data groups.
Sustainability 15 16523 g006
Figure 7. Changes in spring trends for (a) high- and (b) low-data groups.
Sustainability 15 16523 g007
Figure 8. Changes in summer trends for (a) high- and (b) low-data groups.
Sustainability 15 16523 g008aSustainability 15 16523 g008b
Figure 9. Changes in autumn trends for (a) high- and (b) low-data groups.
Sustainability 15 16523 g009
Figure 10. Changes in winter trends for (a) high- and (b) low-data groups.
Sustainability 15 16523 g010
Disclaimer/Publisher’s Note: The statements, opinions and data contained in all publications are solely those of the individual author(s) and contributor(s) and not of MDPI and/or the editor(s). MDPI and/or the editor(s) disclaim responsibility for any injury to people or property resulting from any ideas, methods, instructions or products referred to in the content.

