1. Introduction
The concept of sustainable development (SD) emerged as a response to a growing concern about possible damage to the earth’s ecosystem as a result of human activity. Currently, SD is an innovative model of socio-economic development which has been setting the direction of progress in recent years for civilization, while ensuring a high quality of life by protecting natural, human and man-made capital [
1]. Sustainable development covers many fields and spheres of human activity. Recently, it was enriched with 17 Sustainable Development Goals (SDGs) after the United Nations (UN) conference in New York in September 2015 (the assumption is to achieve them by 2030) [
2]. All 17 goals of the program, known as Agenda 2030, are closely related to each other. This study focuses on goal 12, which relates to the sphere of sustainable consumption and production (SCP). These two categories are identified as one of the basic requirements of sustainable development [
3].
Essentially, many papers have examined sustainable consumption and production [
4,
5,
6,
7]. Wang et al. [
3] drew attention to an important issue from the perspective of this study. The authors emphasized that due to the diversity of socio-cultural conditions, the stage of economic growth, demographics and political procedures, the ability to achieve SCP requires a different focus in developed and developing countries. The debate on sustainable consumption and production patterns can differ between highly developed and less developed countries. So far, in the literature on this subject, relatively less attention has been paid to the analysis of SCP in countries at different levels of development.
This problem particularly affects the European Union (EU). On the one hand, the fundamental condition that must be met for the EU to function efficiently is convergence between individual economies, also in terms of sustainable consumption and production. This is an important phenomenon not only to achieve SDGs at the aggregate level but also to preserve the monolith of European structures, cooperation, mutual trust and support. On the other hand, this most advanced integration group in the world consists of countries at different levels of economic development [
8,
9,
10,
11,
12,
13,
14]. As Uždanavičiūtė and Dagiliūtė [
15] point out, the disproportions in socio-economic development and differences in the well-being of societies are among the greatest threats to SD. Variance among consumption and production structures results in different environmental impacts and different technological possibilities in achieving SDGs. Moreover, the diversity of economic development conditions determines the position of governments towards sustainable development. Therefore, convergence in terms of SCP seems very difficult to achieve in the conditions of the European Union. This means that from the perspective of the sustainable development policy, which is the universal direction of the European Union’s activities, an interesting issue may be the assessment of the similarity of the member states in terms of achieving the goals of sustainable consumption and production. An important issue is the answer to the question of whether there are any signs of convergence in this area.
Convergence issues are considered primarily from the perspective of a group of central and eastern European countries (CEE countries: Bulgaria, Croatia, the Czech Republic, Estonia, Hungary, Latvia, Lithuania, Poland, Romania, Slovakia and Slovenia) in relation to western European countries. This is because the accession of these countries into the EU in 2004 was perhaps the biggest challenge for the EU [
13]. They are similar in many aspects. Geographical proximity is important, and thus a certain cultural and linguistic similarity is present, which is relatively different from the rest of the Union. From an economic point of view, the countries of central and eastern Europe are among the poorer members of the EU, referred to as “catching up” economies. These countries are connected primarily by a history of the command-and-control economy and political transformation, which significantly distinguishes them from other EU countries. On the other hand, the CEE countries also share a good institutional environment, which is considered the main factor in entering the path of rapid convergence with western Europe [
10,
16]. Sustainable development is particularly important for the countries of central and eastern Europe because the implementation of this concept can help achieve a better quality of life, a higher level of social activity and more effective public management [
17]. It therefore seems that from the perspective of these countries, the study of the phenomenon of convergence in sustainable consumption and production is particularly interesting and important. This is the essence of the research problem in this paper.
In the literature on this subject, relatively more attention has been devoted to the issue of convergence of traditional economic indicators in the EU, while relatively less attention has been paid to the study of convergence in terms of sustainable development. Examining this issue based on the division of EU countries in terms of the level of economic development is an attempt to fill a certain research gap. It is also a starting point for further analyses and debates.
The aim of this paper is to assess changes in terms of sustainable consumption and production in the European Union, with particular emphasis on the countries of central and eastern Europe. In order to achieve this research aim, it is useful to formulate the following research questions:
Are the CEE countries that are at a relatively lower level of development really different from other EU countries in terms of sustainable consumption and production?
Can we discuss the occurrence of signs of convergence (σ and β) within the EU in terms of sustainable consumption and production?
How has the pandemic affected sustainable consumption and production in EU countries?
This paper has the following structure. After the introduction, aspects related to the concept of sustainable consumption and production in the EU, especially in recent years, are highlighted. In the next part, theoretical issues related to convergence within the EU are presented. Another part of this work is a description of the research methods used, followed by a description of the results obtained. The next, separate part of this paper is devoted to the discussion. This paper ends with conclusions.
2. Literature Review
2.1. Sustainable Consumption and Production in the EU
Sustainable consumption (SC), as a relatively new economic category, has not yet been clearly defined. The definitions in more recent literature refer to the pursuit of consumption in a way that leads to higher quality in three areas: environmental, social and economic. Sustainable consumption is based on finding a balance between consumer freedom of choice, responsibility for others and being mindful of the entire planet [
18,
19,
20]. Sustainable production, however, is a prerequisite for sustainable consumption [
21]. It does not concern the quantity and types of manufactured products but, above all, the process and method of their production and the resources used for this [
22]. Sustainable production is the key to sustainable development in the social, environmental and economic dimensions [
23]. In order to achieve sustainable production, companies must consider the entire product life cycle, i.e., the design, manufacture and then distribution and recycling of the product.
Consumption and production are closely related spheres. The concept of “sustainable consumption and production” was first defined at the Symposium in Oslo in 1994 [
3]. From the perspective of sustainable development, they refer to the promotion of an efficient use of energy and other resources, sustainable infrastructure, access to basic services, access to decent jobs (including in the environmental sector) and a better quality of life. Promoting models in these matters supports development plans and reduces economic costs at all levels of management [
24].
Literature research indicates that EU countries are international leaders in the category of practices related to the implementation of sustainable consumption and production goals [
3]. This is due to the fact that SD is not a separate category for this grouping, which functions in isolation from other areas of activity. The EU embraces sustainable development as a universal way of doing things that should be present in all policies [
25]. European initiatives in this area include the Amsterdam Treaty (1997), the Lisbon Strategy (2000), the EU Sustainable Development Strategy (2001) and the Europe 2020 Strategy (2010). Today, the SDGs are a fundamental part of the EU political agenda. In recent years, the European Commission has taken concrete steps to achieve these goals. Far-reaching initiatives include the concepts of the European Green Deal, the European Pillar of Social Rights Action Plan and the Climate Law. SDGs are also integrated into the European Semester. In order to counteract the effects of the pandemic, the EU adopted NextGenerationEU, which is also intended to accelerate an ecological transformation. In response to the energy crisis caused by Russian aggression, the European Commission adopted the REPowerEU plan, which aims to for the EU to become independent of Russian fossil fuels [
26]. Sustainable waste management and the introduction of a circular economy (CE) model play important roles in the implementation of the SD concept within the EU. The EU’s Action Plan (COM/2020/98) aims to improve recycling and promote waste reduction [
27]. Such an unprecedented undertaking has far-reaching political implications. In February 2021, MEPs passed a resolution on the EU’s new Circular Economy Action Plan, demanding additional measures to achieve a neutral economy by 2050, including stricter recycling rules. In March 2022, the European Commission published the first package of measures to accelerate the transition to a circular economy, and new EU packaging rules were proposed in November of the same year [
28,
29].
Research on the process of implementing the concept of sustainable development within the EU is a frequently discussed topic in the literature [
11,
15,
21,
23,
27,
30,
31,
32,
33,
34,
35,
36]. Currently, the effects of implementing actions for SD are verified within the goals set out in the 2030 Agenda [
2,
17,
24,
37,
38,
39,
40,
41,
42]. The European Commission is taking many steps with this program. One example is the communication “Next steps for a sustainable European future” adopted on 22 November 2016, which specifies the initiatives taken in relation to each of the 17 Sustainable Development Goals. The communiqué also includes the activities undertaken so far which have contributed to the fulfillment of the Agenda’s assumptions. Another document is the letter of intent of 13 September 2017 of the President of the Commission (attached to the State of the Union speech) which announced a document opening the debate entitled “Towards a Sustainable Europe by 2030”. The document was announced as a follow-up to the document of 30 January 2019. It contains the activities undertaken by the Union related to SD so far. It reflects the EU’s strong commitment to achieving the UN’s Sustainable Development Goals. The emphasis was placed, among others, on how to move away from a linear economy towards a circular economy and how to adjust energy resources. The main factors determining sustainable development include education, research and development, innovation, technology, computerization, appropriate financing, taxation, pricing policy and competition. Corporate social responsibility and new business models are also of great importance. Policy coherence at all levels of functioning is also key [
24].
Important activity related to the implementation of the SDGs is a document published in 2023 entitled “Sustainable development in the European Union. Monitoring report on progress towards the SDGs in an EU context”. The year 2023 is the halfway point of the functioning of the 2030 Agenda. For this reason, the European Union decided to present a voluntary report on the monitoring of the Sustainable Development Goals at the UN High-Level Political Forum in July 2023. In the context of monitoring the 12th goal of SD (referring to sustainable consumption and production), the EU draws attention to the separation of economic growth from environmental pressures, waste management and a green economy [
43]. For this purpose, the following indicators are monitored: consumption of hazardous chemicals, raw material consumption, average CO
2 emissions per km from new passenger cars, circular material use rate, generation of waste, gross value added in the environmental goods and services sector, and energy productivity. The European Union presents progress towards the goals related to SCP in the analyzed five-year period in detail (2016–2021) (
Table 1).
In summary, the EU, presenting the results of the report, notes that progress towards the sustainable consumption and production target has been mixed [
26]. Within the EU structures, the situation of central and eastern European countries is particularly important. In 2004, on the eve of accession to the EU, the concept of sustainable development was perceived in these countries as an ambitious development challenge. However, this goal was pushed into the background by socio-economic problems (infrastructural gap, relatively high unemployment rate, need for better transport connections with Europe, emigration of people, relatively low purchasing power of households, etc.). Several years after the accession of most CEE countries to the EU, their situation is different. They have made a significant civilizational and economic leap. A key question is whether, alongside these achievements, there has been significant progress in sustainable development that can help these countries achieve a better quality of life. Germany, France and the Scandinavian countries can be considered as a reference point for upwardly mobile countries [
17,
44,
45]. Therefore, interesting extension of the analysis from
Table 1 may be an attempt to assess whether EU countries are characterized by convergence in terms of SCP. The next section of this paper deals with the essence of this issue.
2.2. Convergence within the EU versus Sustainable Consumption and Production
The phenomenon of convergence in the EU is a key condition for the efficient functioning of this grouping. Convergence should occur on many levels, including sustainable consumption and production. According to the authors, this is an important phenomenon not only to achieve SDGs at the aggregate level (presented in the previous section of the article) but also to preserve the monolith of European structures, cooperation and mutual support.
Convergence is characterized by a multitude of approaches to this issue, as well as the possibilities of its interpretation. In the literature on this subject, definitions and types of convergence find their sources primarily in the concepts of σ-convergence (which occurs when the dispersion of a given indicator between countries decreases over time, mainly measured by standard deviation or the coefficient of variation) and β-convergence (which occurs when economies with a lower level of development show a higher growth rate of a given indicator compared to more developed economies). Convergence can be analyzed at three levels: nominal (regarding the macroeconomic situation), real (referring to actual levels of basic economic values) and structural (referring to a given structure of the economy and the economies of partner countries). Changes in consumption and production patterns fall within the framework of real and structural convergence [
46,
47].
The impact of integration processes on the sphere of consumption and production of a given country is a natural consequence of participation in the common market. Convergence can be expected as a result of many processes, e.g., changes in the labor market, leveling of the pace of labor productivity growth, unification of technologies and production systems, or the implementation of identical institutional solutions. In other words, consumers in EU countries are involved in processes aimed at harmonizing consumption patterns [
48]. A popular path of change in this sphere, adequate to the development of a given economy, is the decreasing share of expenditure on basic goods (e.g., food) and the increasing share of expenditure on higher order goods (e.g., recreation and culture). In general, trends in consumption patterns are determined by countries at a higher level of development, and the intensification of economic integration should mean convergence in this respect [
47].
In the literature on this subject, convergence in the sphere of consumption and production is considered mainly from the perspective of the traditional approach, i.e., the similarity of their structures [
12,
14,
49,
50,
51,
52,
53]. Relatively less research has been devoted to the convergence of EU countries in terms of indicators representing sustainable consumption and production, although some studies take environmental aspects into account. For example, Liobikienė and Mandravickaitė [
31] indicate the relationship between changes in the consumption structure of households and the impact of individual consumption categories on the environment. In the research, the authors analyzed the convergence of the new EU member states with the old ones in terms of household consumption structure. On the basis of the assessment of the selected categories of consumption, depending on the intensity of greenhouse gas emissions and acidifying compounds, it was found that changes in the structure of consumption expenditures led to a reduction in the level of households’ environmental impact (except Hungary). Raszkowski and Bartniczak [
17] attempted to assess the implementation of the concept of sustainable development in CEE countries using a synthetic measure for the years 2010–2016. The authors observed an improvement in all analyzed countries in terms of the estimated indicator. Nevertheless, the situation in none of the analyzed countries can be assessed as favorable (the best results were achieved by the Czech Republic and Slovenia, and the worst by Bulgaria and Romania). Biekša et al. [
40] analyzed the sustainable economic development of EU countries according to indicators related to SDGs (economic, social, environmental, knowledge indices and environmental footprint index) and the integrated indicator. The analysis of individual indicators showed that their distribution varies greatly between countries. The results confirm that despite similar development activities, the current economic, social and environmental situation in EU countries is different. Nevertheless, the overall value of the integrated sustainability indicator is quite evenly distributed among EU countries. Małysa-Kaleta [
11] proved that the consumption structure of less developed EU countries is evolving towards “modern” consumption, which is characteristic of countries at a higher level of development and which is conducive to sustainable consumption. Rodríguez-Antón et al. [
41] proved that the behavior of EU countries is not homogeneous in terms of the effects of initiatives aimed at implementing a circular economy. Eastern countries, central countries and some Mediterranean countries have different behaviors regarding the implementation of the CE which can “generate different positions in the challenge for the EU to adopt, in a generalized way, a CE model”. The diversity of European countries in the practical implementation of the circular economy is also confirmed by the research of A. Colasante et al. [
34]. The innovative proprietary Waste Circularity Index (WCI) suggests that the 28 European member states can be divided into six groups, with a reference to the European average. In the years 2014–2018, CEE countries showed diversity in terms of the examined feature. There was also no significant improvement. Uždanavičiūtė and Dagiliūtė [
15] attempted to assess the convergence of the main indicators of sustainable consumption and production in the new EU member states in 2000–2010. The conducted research shows that apart from the domestic material consumption, convergence took place during the period of economic growth in the years 2000–2007; however, due to the global economic crisis in 2009, the differences between countries increased. In the period under consideration, the authors came to the conclusion that the countries of central and eastern Europe approached the average values in terms of the analyzed indicators. The formulated recommendation is that the new EU member states, striving to achieve a higher economic level, should maintain lower levels of consumption, waste generation and pollution. More attention should also be paid to energy and resource efficiency.
The issue related to the convergence of sustainable consumption and production has great potential for research and is a research gap that is only beginning to be filled. Due to the fact that the European Commission undertakes many activities in connection with the 2030 Agenda, it is reasonable to investigate this aspect. The next part of this article presents research methods that are the basis for assessing this phenomenon in EU countries.
3. Methods
The first stage of this research was to attempt to assess the level of development of EU countries in terms of SCP. For this purpose, a synthetic measure of development was used, which allows the ranking of the examined objects and their assessment. Indicators for monitoring the implementation of the 12th Sustainable Development Goal (listed in the previous part of the study and for which data were available at the national level) were used to build the level of development indicator. Further research was also based on them [
43]:
Raw material consumption (tons per capita).
Average CO2 emissions per km from new passenger cars (g/km).
Circular material use rate (%).
Generation of waste (hazardous and non-hazardous, kg per capita).
Gross value added in the environmental goods and services sector (% of GDP).
Among the methods for determining a synthetic measure, methods with and without a pattern can be distinguished. The only indicator within the sustainable consumption and production category for which the EU has a quantified target is the “Circular material use rate”. This category is implemented in accordance with the policy contained in the Circular Economy Action Plan. Other indicators do not have such a precisely defined purpose in the document [
26]. Due to this heterogeneity and the fact that the determination of the so-called pattern for other indicators is not an undisputed matter, the study uses a method without a pattern. The relative level of development indicator is based on the idea of the method of sums of standardized values and was calculated according to the formula below [
54]:
where:
—relative level of development indicator (a synthetic measure of development).
—value of the -th feature for the -th object (diagnostic variable).
—arithmetic mean of feature number .
—standard deviation of feature number .
All destimulants were converted to stimulants according to the following formula [
55]:
where:
, —constants taken arbitrarily ( = 1, = 0).
—original destimulant value.
—the value of a destimulant transformed into a stimulant.
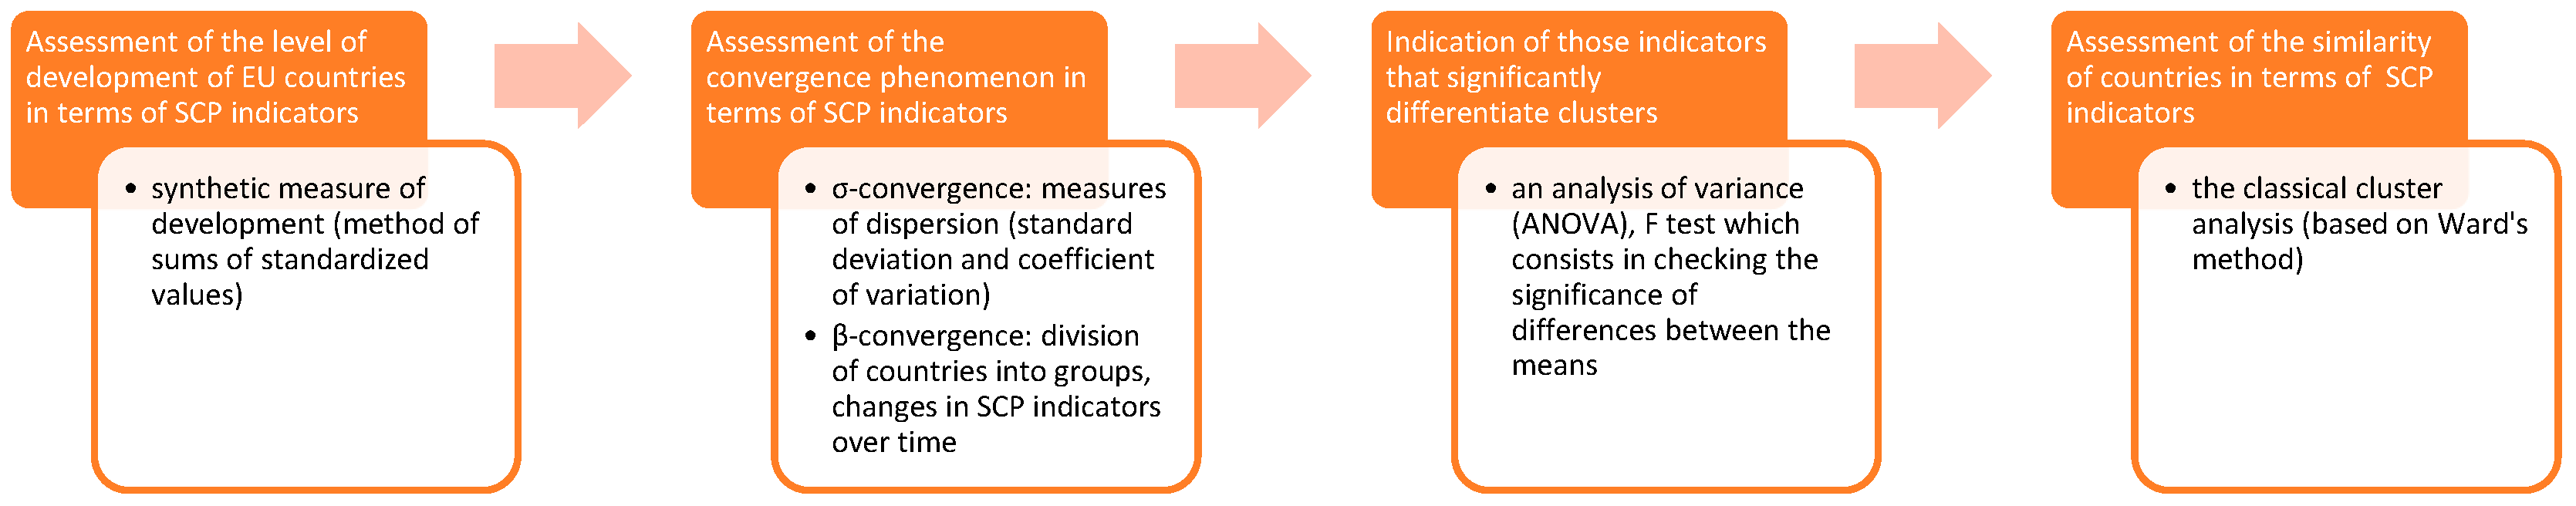
In order to assess the σ-convergence in terms of indicators representing the SCP, the classical measures of dispersion—standard deviation and coefficient of variation—were used. In order to assess β-convergence, it was necessary to divide countries into two clusters: CEE countries and other EU countries. The assessment was made on the basis of a comparative analysis of the mean values and standard deviations of individual SCP indicators and their changes over time (it should also be remembered that from a sustainable development point of view, convergence is only positive when countries converge to lower levels of environmental impact). An analysis of variance (ANOVA) was carried out in order to stipulate those indicators that significantly differentiate the clusters. The test consists of checking the significance of differences between the means. The test to check whether a given variable distinguishes between groups is the F test.
An additional analysis in the study was the assessment of the similarity of countries in terms of the level of SCP indicators, which was performed using the classical cluster analysis. This method allows for the division of the examined objects into certain segments, which are characterized by the belonging of units similar to each other in terms of selected features. The grouping was based on the same indicators as above.
In the first stage of the study, variables were normalized (standardization rule). Its aim was to bring the variables to comparability by depriving the titers of the measurement results and unifying their orders of magnitude [
56,
57]. In the next step, the Euclidean distances between individual units were estimated. Cluster analysis starts by selecting the smallest value in the matrix that represents the most similar objects in a given metric (
Figure 1).
The Ward method was used to determine new distances for the reduced set of units. The measure of the variation is the Error of Sum Square [
58]:
where:
The research procedure is presented in a concise graphical format (
Figure 2).
The choice of years for the study was very difficult due to the incompleteness of data for some countries and the publication of information every second year for some indicators. In order to conduct the analysis as coherently and comprehensively as possible in terms of sustainable consumption and production, it was decided that the year 2014 would be the first subject of the study. This is the first period for which data are complete for almost all countries and indicators. It is also the year preceding the introduction of Agenda 2030, which is a good starting point. The most recent available data for all indicators and countries are from 2020, which was also selected for the analysis. However, this was a pandemic year and may be considered unrepresentative. Although a public health crisis can be considered symmetrical, administrative decisions to close many industries in individual countries were administrative in nature, and the duration of the lockdown varied. Therefore, studies for 2018 were also carried out (some indicators for 2019 are not published in Eurostat) and 2021 (data for this year were only available for 3 indicators, therefore all research methods, including the construction of a synthetic indicator, could not be applied).
4. Results
The starting point in the adopted research procedure was the assessment of the relative level of development of EU countries in terms of SCP. The values of the synthetic measure are presented in
Table 2.
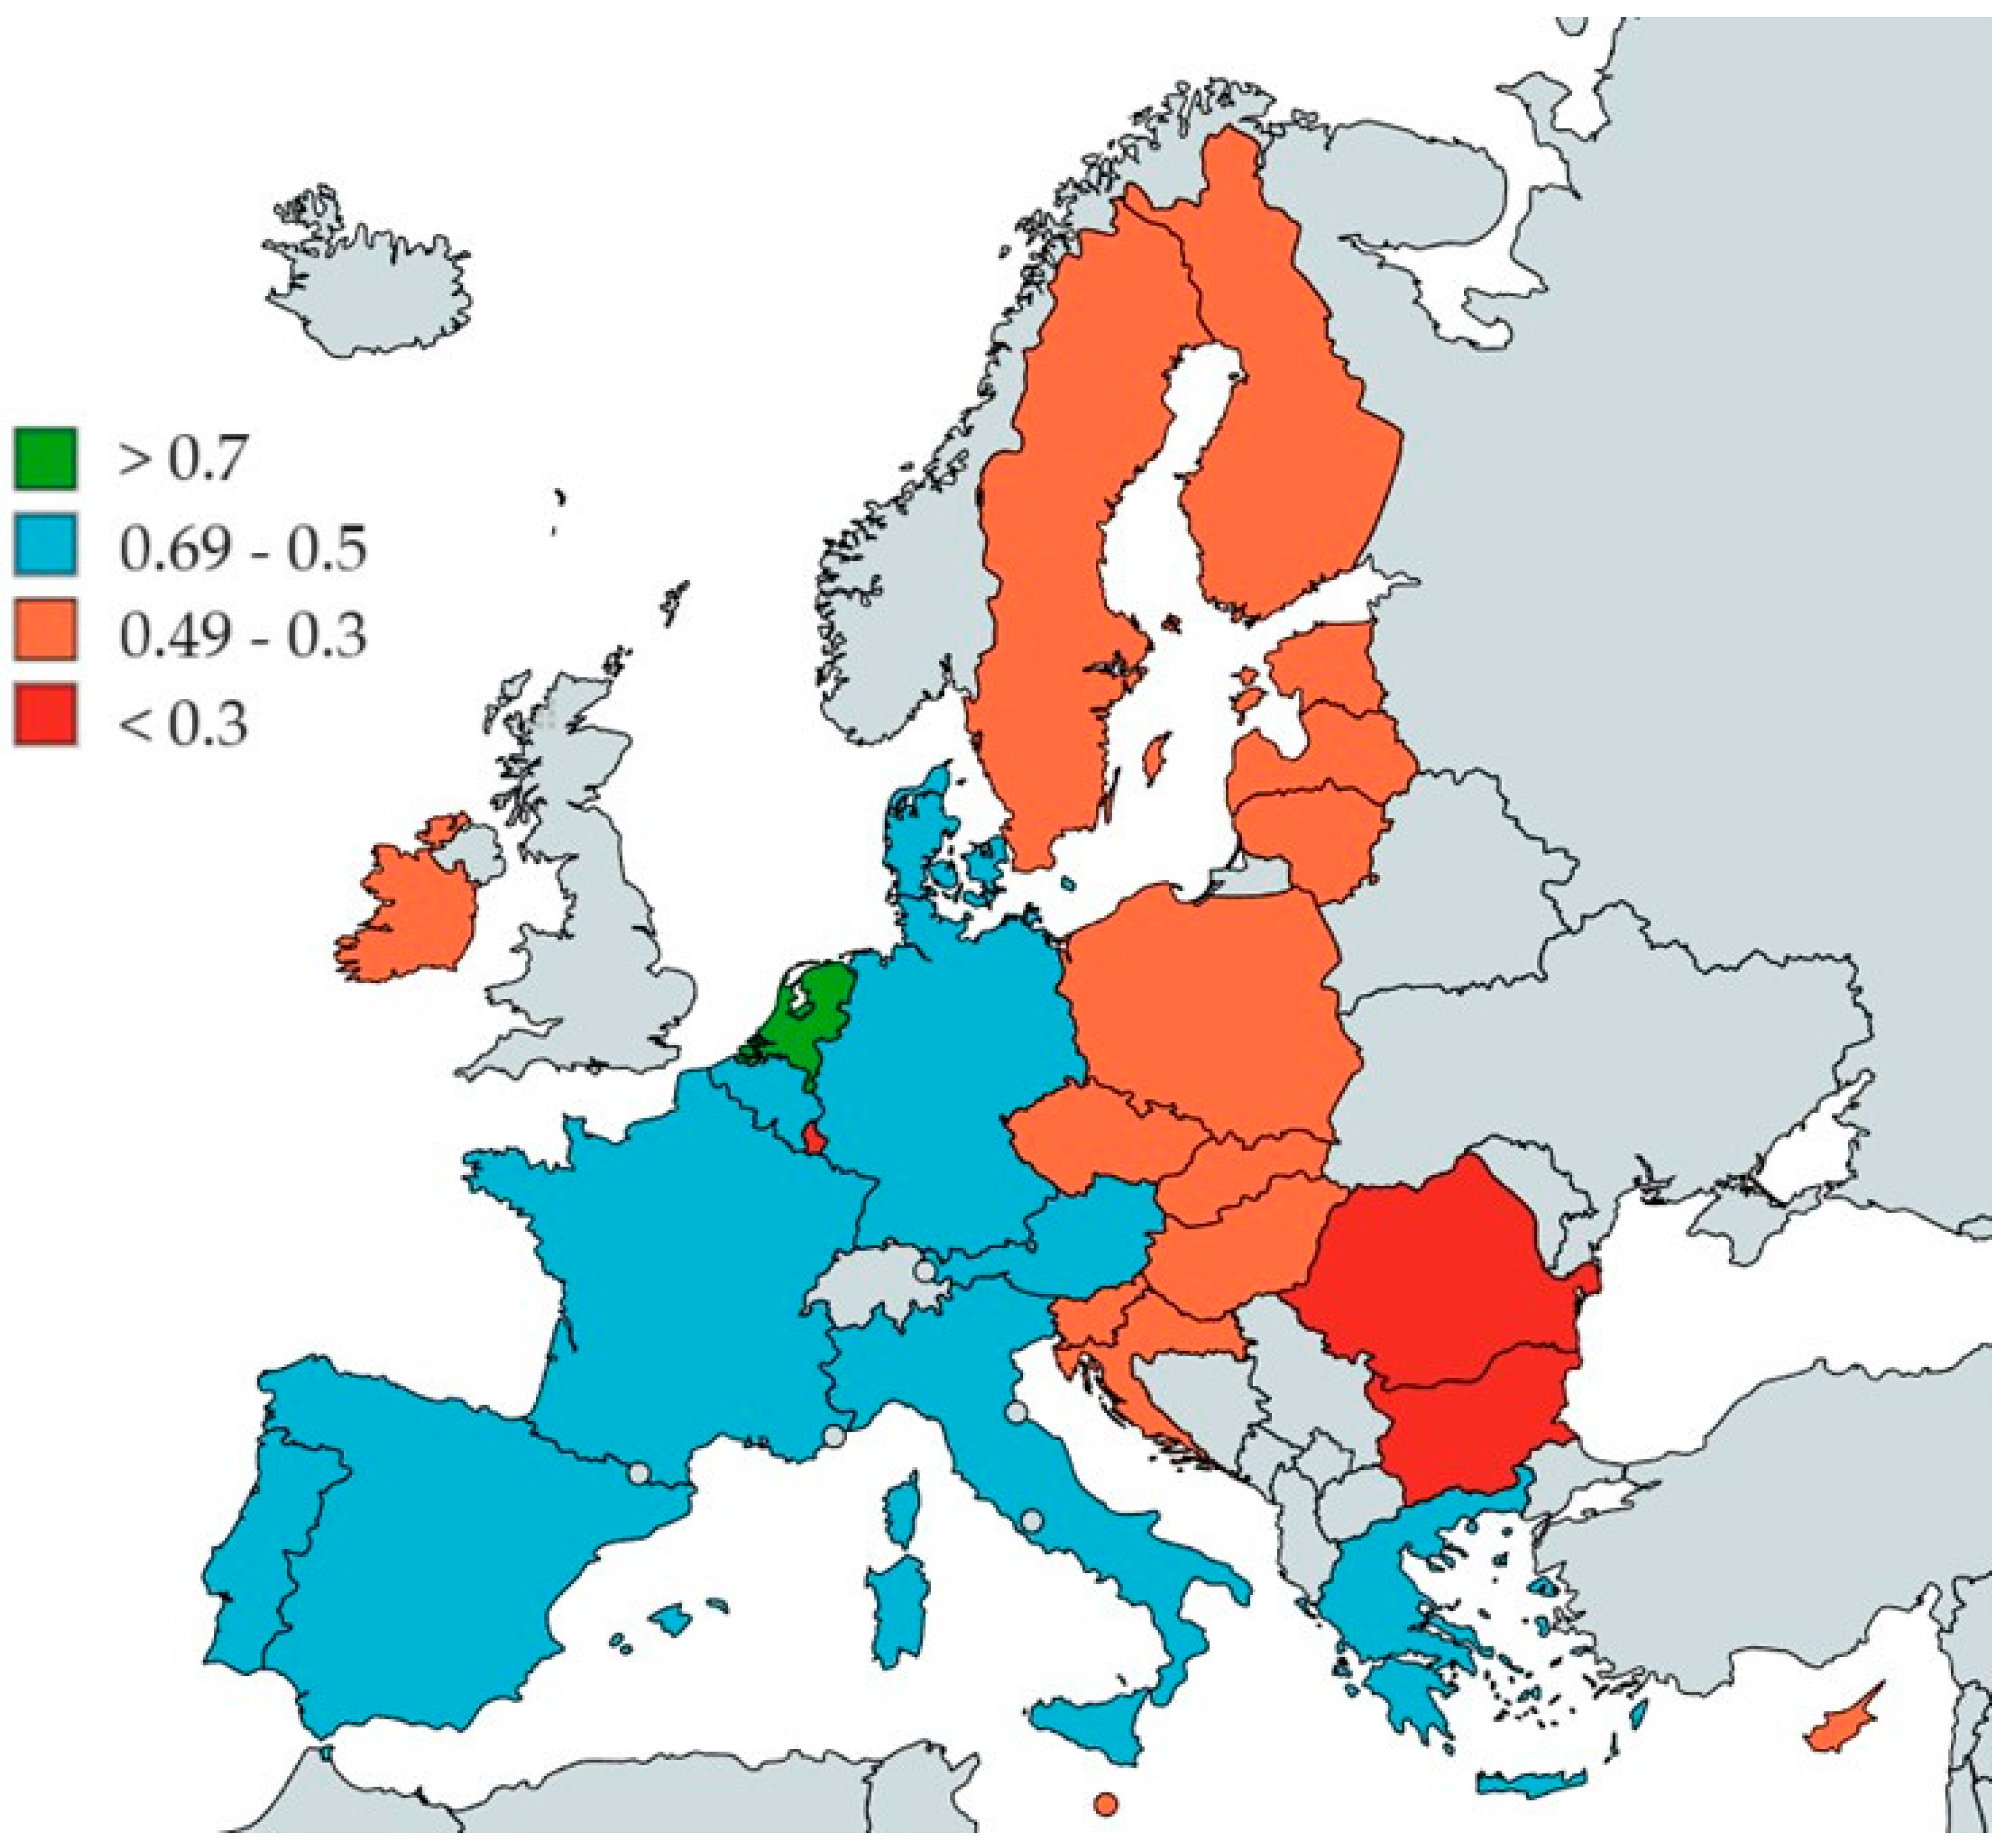
On this basis, it can be concluded that CEE countries lagged behind the other EU countries in the level of development of sustainable consumption and production (it is important that the indicator does not allow for comparisons over time. Each year should be treated as a separate ranking). In 2020, this was especially visible (
Figure 3). This situation justifies the need to study the phenomenon of convergence within the EU in terms of sustainable consumption and production indicators.
Verification of the process of convergence (σ-type) over time can be carried out on the basis of measures of dispersion (
Table 3).
Based on the measured standard deviation, it can be concluded that in 2018, the level of differentiation was lower in the “Average CO2 emissions…” and “Generation of waste” categories. It should also be remembered that from a sustainable development point of view, convergence is only positive when countries converge to lower levels of environmental impact. Positive changes in 2018 (depending on the indicator—a decrease or increase in the arithmetic mean) were observed in the case of “Average CO2 emissions…” and “Circular material use rate”. In 2018, signs of σ-type convergence were observed only in the case of “Average CO2 emissions…”.
In 2020 (pandemic time), among the five indicators taken into account, both an increase and a decrease in dispersion measures were observed. It should be remembered that the coefficient of variation is a relative measure, so a decrease in diversity may result from an increase in the average of a given category. In 2020, positive changes (for the environment) in the mean value were observed in all indicators. Signs of convergence (compared with changes in the measures of dispersion) in 2020 compared to 2018 can be found in the case of “Generation of waste”, “Circular material use rate” and “Gross value added…” (in the last two indicators only on the basis of the coefficient of variation).
In 2021, data in the Eurostat database were available only for the first three indicators. In the case of “Raw material consumption” and “Average CO2 emissions…”, the standard deviation and coefficient of variation increased as the mean value increased. These are destimulants, so the observed situation indicates divergence and an increase in harmful impact on the environment. Moreover, in the case of these indicators, the mean value exceeded the pre-pandemic value (2018). There was also variation in the “Circular material use rate”, with an average decrease in this indicator. This is also a negative situation because this variable is a stimulant. However, the mean value was slightly higher than before the pandemic. Based on the above observations, it can be assumed that the conditions of gradual relaxation of pandemic restrictions favored divergence in the scope of SCP (higher values of dispersion measures with environmentally unfavorable changes in the average value).
An interesting issue is the answer to the question of whether, and if so, certain areas of sustainable consumption and production distinguish the countries of central and eastern Europe from other EU members.
Table 4 shows the equality test of the means of individual indicators for the group of CEE countries and other EU countries (The test to check whether a given variable distinguishes between groups is the F test, which consists of checking the significance of differences between the means. The test involves comparing the variance relating to variability between groups with the variability within groups. The following hypotheses were verified [
60]: H0: μ1 = μ2 and H1: μ1 ≠ μ2, where μ1 is the mean of CEE countries and μ2 is the mean of the other EU countries. Under H0, some slight random fluctuations in the means for the two groups can be expected. Under H0, the variance estimated from within-group variability should be the same as the variance from between-group variability. These two variance estimates can be compared using the F test, which is used to assess whether the ratio of two variance estimates is significantly greater than 1. If the
p-value is lower than the assumed significance level (0.05), H0 is rejected, and H1 is accepted. This means that two separate groups of countries differ from each other in a statistically significant way due to the mean of a given indicator).
In 2014, the category differentiating CEE countries from other EU countries was “Average CO2 emissions…”. According to the results of the F test, the averages of the other categories for these two groups of countries were not significantly different. It is worth noting, however, that in the case of “Raw material consumption”, “Generation of waste” and “Gross value added…”, the values of CEE countries looked better than in the other European countries.
For 2018, the test results lead to similar conclusions. However, it is worth paying attention to the direction and scale of changes in the average values of the indicators. β-convergence occurs when the positive direction of changes in SCP indicators (indicating a lower environmental impact) is larger in CEE countries than in other European countries. In the case of “Average CO2 emissions…”, CEE countries caught up to some extent (2.34 g/km). This confirms both σ-convergence and β-convergence in this field. Despite the increase in the average value of the indicator, the distance to other EU countries increased in the “Circular material use rate” category (3.54 p.p. vs. 3.89 p.p.); therefore, there are no signs of β-convergence. In the case of “Raw material consumption”, the average values increased in both groups of countries, but in CEE countries, it increased relatively more. A deterioration in the situation of both groups also occurred in the “Generation of waste” category. Undoubtedly, a negative picture is the change in the indicator “Gross value added…”. While in the western countries of the EU, this indicator increased, in CEE countries, it decreased. Thus, in the last three indices mentioned, β-convergence did not occur.
In 2020, relatively small changes were observed in “Raw material consumption”. In CEE countries, the change was also negative. However, the value of the indicator for “Average CO2 emissions…” and “Generation of waste” decreased significantly, which is obvious due to the lockdowns. The first of these categories, similar to the previous research, was the only one whose means were statistically significantly different for the two analyzed groups of countries. This time, the distance between CEE countries and the other EU countries increased (the decrease in the indicator in CEE countries was smaller). In the case of “Generation of waste”, the situation was similar, but the decrease in the index in CEE countries was greater. Both in the case of CEE countries and other EU members states, the “Circular material use rate” and “Gross value added in environmental goods and services sector” index increased, which should be assessed positively. In the case of the first indicator, the distance between CEE countries and other EU countries decreased, so these are signs of convergence.
In 2021, which can be characterized as the conditions for the gradual relaxation of COVID-19 restrictions, the category differentiating two separate groups of countries was still “Average CO2 emissions…”. In the case of “Raw material consumption”, the mean value for the two clusters reached the highest value among all of the years examined. The difference in mean values for clusters was slightly lower than in 2020 but higher than before the pandemic (2018). This proves divergence and an increase in negative impacts on the environment. In the case of “Average CO2 emissions…” the average mean for CEE countries was also the highest in 2021, and for the remaining EU countries, it was even lower than in 2018. In the case of this indicator, divergence occurred both in relation to the pre-pandemic situation (2014, 2018) and in relation to the first pandemic year (2020). Signs of β-convergence can be seen in the case of “Circular material use rate”. In 2021, the distance between CEE countries and other EU countries was the lowest of all of the years examined. However, this situation results to a greater extent from the decline in the mean value for the remaining EU countries than from the increase in the mean value for CEE countries. Therefore, it cannot be entirely assessed positively because the overall effect on the environment is negative. Unfortunately, due to a lack of data, the remaining SCP categories could not be assessed.
The supplement of the above observations is the constructed function of discrimination, which is a fundamental technique of data classification [
61]. It allows an indication of which category distinguishes the countries of central and eastern Europe to the greatest extent from other EU countries. The function can be considered in terms of regression. The dependent variable is coded as two groups (1 and 2). The explanatory variables are the indicators of sustainable consumption and production (marked successively from
to
). The interpretation is as follows: the variables that have the largest standardized coefficients contribute the most to dividing objects into groups. The function for 2018 is presented below:
The indicator that most discriminates countries into two groups is “Average CO2 emissions per km from new passenger cars” (). All the more so, the observed convergence in this category should be considered a positive phenomenon. The least important is “Generation of waste” ().
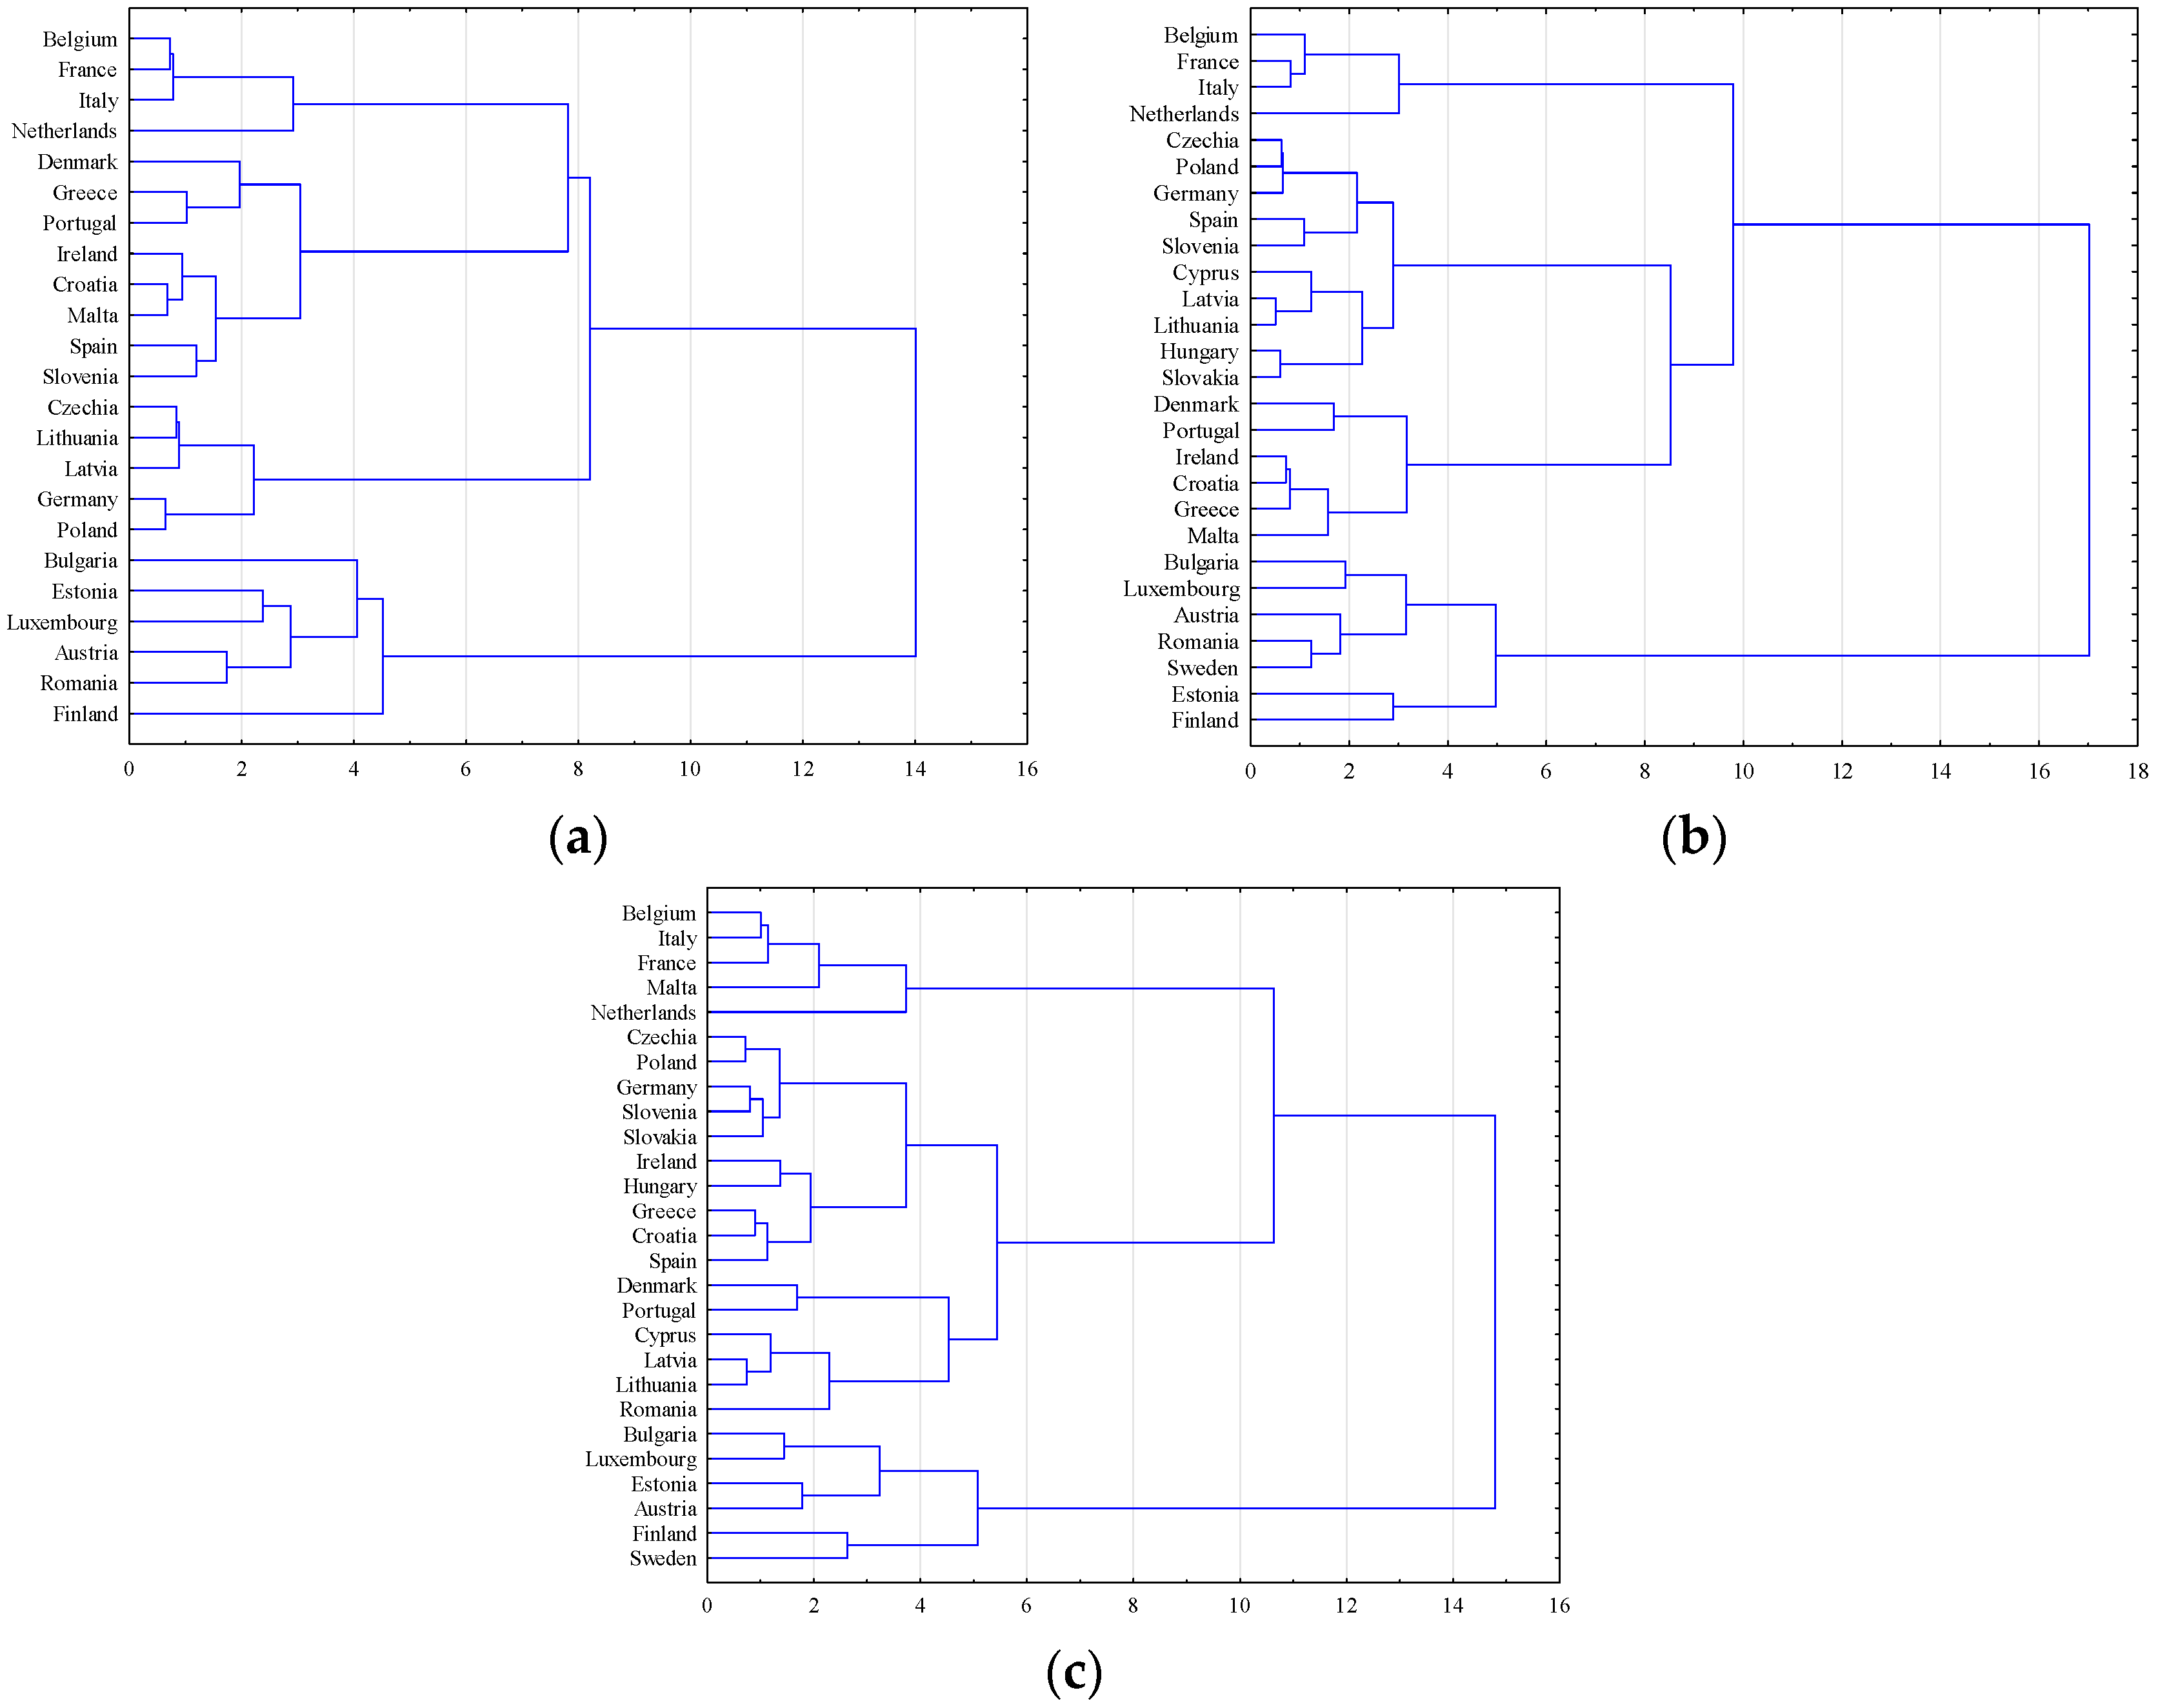
The last stage of the study was to assess the similarity of countries in terms of SCP indicators. The results of grouping countries are presented using dendrograms (
Figure 4).
In 2014, four clusters can be distinguished (this number of clusters was indicated by the maximum distance difference method). The countries of central and eastern Europe clearly differed from the old EU members, although the two groups dominated by these countries also included Germany, Luxembourg, Austria and Finland. On the other hand, Croatia and Slovenia were relatively more similar to western countries. In 2018, four groups were also distinguished. The first and fourth clusters remained almost identical. CEE countries dominated the second cluster, which also included Germany and Spain (as well as Cyprus from the new EU members), while Croatia retained its position. It should be remembered that Euclidean distances are generally not comparable for two different years for the same objects. When examining the similarity of EU countries during the 2020 pandemic, moderate changes were observed. The second cluster, dominated in 2018 by CEE countries, was joined by Ireland, Greece and Croatia, while Latvia, Lithuania and Cyprus left it by moving closer to Denmark and Portugal. Romania already entered the third cluster, while Bulgaria and Estonia remained in the group with Luxembourg, Austria, Sweden and Finland.
5. Discussion
The general observation of the conducted research is that CEE countries are characterized by a relatively low level of development in terms of sustainable consumption and production compared to other EU countries. There are only a few signs of convergence. In the following discussion, attention is first drawn to the potential difficulties in achieving the goals of sustainable consumption and production in the countries of central and eastern Europe, and then to the directions of future actions.
Trying to indicate the difficulties in achieving the goals of sustainable consumption and production strictly from the perspective of the countries of central and eastern Europe, one should first of all mention the structure of consumption in EU countries. The results of the research on consumption convergence are varied. Some of them confirm the convergence of expenditure structures among EU countries, and some prove stability in this respect [
12,
49,
50]. Although the research confirms Engel’s law among the new EU member states [
31], the differences in the structure of household expenditures still exist. According to Liobikienė’s and Mandravickaitė’s [
31] research, food and beverages are the most polluting consumption group. Consumption categories such as health, communication, recreation and culture, education, and miscellaneous goods and services are classified as the most environmentally friendly. CEE countries are still characterized by a clearly higher share of consumption of products from the category with the most polluting impact on the environment. On the other hand, consumption from the categories with the least environmental importance is usually lower (
Table 5). This aspect is important from the perspective of sustainable development because different categories of consumption affect the environment in different ways.
Achieving sustainable development in individual EU countries is also determined by the convergence of production structures. The structural transformation of developing countries consists of transferring resources from sectors characterized by relatively lower productivity to sectors with higher productivity. A common pattern of structural change is to shift certain economic categories from the industrial sector to the service sector (servitization). As mentioned above, the use of the service sector has less environmental impact. Therefore, changes bringing the economic structures of CEE countries closer to a certain “pattern” set by more advanced countries are considered beneficial. It is an important issue for achieving the goals of SCP.
The issue related to the structural convergence of the EU member states is still far from being resolved on empirical grounds. Research results in this area are quite varied and ambiguous. Some of them confirm, and others negate, the existence of structural convergence [
14,
51,
52,
53]. Difficulties in the convergence of economic structures may result from the tendency towards specialization, the hermetic nature of new technologies and even brain drain, i.e., the outflow of qualified staff from less developed countries [
63,
64]. It should also be added that the convergence of production structures faces challenges that no integration group in the world has faced so far. As indicated by C. Gräbner et al. [
9], European integration shapes the conditions of economic development, which should be understood as the beginning of an evolutionary process characterized by different trajectories for individual countries—partly by shaping new paths and opportunities and partly by reinforcing pre-existing trends. These paths may not always be conducive to achieving convergence in various fields, such as sustainable production. Research by C. Gräbner et al. [
9] shows that Europe is characterized by a lack of convergence in terms of technological capabilities.
Another important issue that differentiates CEE countries from other EU countries is ICT capital. The role of information and communication technologies in the environmental context is often discussed in the literature [
65,
66,
67,
68]. Digitalization in the European Union has had a significant and positive impact on energy efficiency [
35]. In CEE countries, investments in ICT have had a positive influence on economic growth and have grown faster compared to the EU-15 average, which means that the ICT infrastructure gap has been closing. However, an analysis of various measures of the digital economy shows that in CEE countries, the level of complementary investments that create a digitally friendly environment is insufficient [
69]. An undoubted challenge is to introduce ecological innovations into information and communication technologies to mitigate the harmful impact of human activity on the environment.
Achieving the goals of sustainable consumption and production requires closely coordinated actions of companies, geographical regions and political units [
24]. The catching up with western countries by CEE countries is conditioned by close co-operation between the public and private sectors and non-governmental organizations (NGO) [
17]. It is necessary to balance the “bottom-up” effort, i.e., the activities of enterprises, and the “top-down” effort, i.e., coming from political decision makers. Differentiation in the conditions of economic development determines the attitude of business entities towards sustainable development. In CEE countries at a lower level of development, an important element of the policy is to catch up with the west in a strictly economic sense. Economic growth is still a priority [
3,
70]. At the national level, governments may be reluctant to impose pollution-related restrictions on companies because it reduces export competitiveness, even when the obvious result would be an improvement in the environment [
71]. Thinking in terms of sustainable development at the scale of individual enterprises is also quite a difficult process. The choice between maximizing profit/increasing market position and implementing the concept of sustainable production is often a binary one. So, companies and governments prefer the first option. This is confirmed by a study conducted by Avanade (a leading provider of Microsoft solutions), showing that 93% of organizations face difficulties in achieving Sustainable Development Goals. The key barrier to their implementation is higher business priorities in companies. In addition, 45% of respondents admitted that business goals are now a higher priority for them [
72]. This confirms that contemporary economic successes are based on neoliberal concepts, getting rich quickly, a short-term perspective and maximization of production [
73]. This is somewhat confirmed by research showing that investment in non-financial assets and energy use improves economic growth at the expense of environmental sustainability [
74]. On the other hand, research also shows that the Sustainable Development Goals promote efficiency in the economic sense. An important issue is examining the impact of environmental, social and governance (ESG) practices on financial performance [
75]. Eliwa et al. [
33] prove that in 15 EU countries, credit institutions value companies’ ESG performance and disclosure of information about taking such actions. This is reflected in lending decisions (companies with better ESG performance have a lower cost of debt). Zakari et al. [
76] prove that sustainable economic and financial development are improved by energy efficiency. Green innovations also have a positive impact. It follows from the above that SCP strategies should not ignore the relationship between the economic dimension of the SDGs and gross domestic product. Given such observations, it is possible to formulate an appropriate policy that promotes sustainable development in the environmental and economic sense.
The challenges in implementing the SD concept in CEE countries also includes the aging of society (which de facto concerns the vast majority of European countries) and the need for urgent revitalization in the following areas: social, economic, environmental, spatial and technical. Despite the incoming funds from the EU, there is still a strong need to revitalize rural areas. A better quality of life in cities does not always mean the same situation outside them. Social stratification in CEE countries is also a significant obstacle. Sustainable development will not be achieved when a significant part of society is at risk of poverty. Social stability is built on a large and strong middle class, not on a narrow group of wealthy people. It is also worth emphasizing that public participation in solving national and regional problems is lower in CEE countries than in western Europe. This is important for promoting the concept of SD [
17].
In trying to list more general barriers to the implementation of the concept of SD in CEE countries, one should first recognize the multiplicity and ambiguity of the definition of this issue, which leads to its perception as enigmatic. The inaccuracy or noticeable vagueness of defining the concept of sustainable development is also sometimes considered to be the main reason for the impossibility of practical implementation of the idea of sustainable development [
73]. As a consequence, the level of awareness and knowledge of societies regarding SD is low, and actions to implement this idea result in freedom of interpretation, lack of instruments for their implementation and lack of consistency in action. Moreover, the idea of sustainable development is often politicized and used as an argument in election campaigns. Depending on the political party in power, activities for SCP can be resumed and abandoned alternately, which is not conducive to achieving the goals.
In light of the obtained results and the above discussion, it can be concluded that the replacement of conventional cars with zero-emission vehicles is a significant challenge for CEE countries in order to achieve the EU goals. “Average CO
2 emission…” is the only SD category that differentiates CEE countries in a statistically significant way from other EU countries. Data on the share of zero-emission vehicles (% of newly registered passenger cars) for 2021 indicate that CEE countries still clearly differ from the old EU member states in this respect. The average for these two groups of countries is, respectively, 2.8% and 9.5% [
26].
As a result of the conducted research, it seems that in CEE countries, it is necessary to intensify efforts to improve the implementation of the circular economy model, all the more so because the research [
32] confirms that there is a lack of investment in this area in the mentioned countries. EU countries also vary in terms of the practical implementation of the CE model and waste management policies [
27,
34]. It is true that the “Generation of waste” indicator does not look good in the group of other EU countries; however, it should be noted that the EU-15 countries use a significant part of their waste to produce energy. This is a common practice in the Nordic countries (on the other hand, such action is not conducive to increasing recycling rates). Countries such as Belgium, Germany, France and Italy also have extensive and efficient recycling systems and a high level of innovation in the field of activities for the circular economy. The Netherlands, Austria, Sweden, Finland and Denmark also perform well in terms of recycling rates. All of these countries are characterized by a high level of environmental awareness and large private investments [
32]. It is a crucial aspect because, as evidenced by Rodríguez-Antón et al. [
41], specific actions aimed at implementing the CE will enable the implementation of the 2030 Agenda, which will allow the EU, directly or indirectly, to achieve the SDGs in the European space by 2030.
In the long term, convergence in the field of sustainable consumption and production should be supported by the process of catching up with western countries by eastern European countries in terms of living standards and labor standards. Liobikienė and Mandravickaitė [
31] indicate, however, that changes only in the structure of household consumption are insufficient. In order to achieve sustainable consumption patterns, it is necessary to put emphasis on consumer policy and the supply side of the economy and technological development. Efforts are necessary to adapt legislation to EU environmental requirements, implement renewable energy sources and pursue a rational raw material policy [
17]. The challenge is to try to solve the energy trilemma: ensuring energy affordability and availability, energy security and, of course, environmental sustainability [
77]. At the enterprise level, it is important to enforce new concepts of human resource management. The most popular concept is sustainable HRM (S-HRM). It includes practices that ensure the transfer of knowledge and skills to the future generation, support environmental management and enhance the self-esteem and well-being of employees [
36].
Effective implementation of the SD concept is conditioned by actions aimed at increasing ecological awareness and co-responsibility for development [
17,
31]. A high level of environmental awareness among the entire society is crucial for achieving the goals related to SCP because, as Grzega [
24] points out, sustainable development requires the co-operation of all market entities, both at the micro-, meso- and macroeconomic levels. In order to increase public awareness of SCP, there should be ongoing discussions at various levels. Currently, as emphasized by Banaszyk and Gorynia [
78], more attention should be paid to global rationality and the implementation of the “common good” metaphor. In the case of the concept of sustainable development, this should be understood even as translating the supranational interest over the national interest. Therefore, in discussions at various levels, it is necessary to use the tools of heterodox economics. More importantly, unlike mainstream economics, a more multi-faceted view of the economy does not ignore the aspect of environmental variability. Heterodox economics also takes into account the impact of the geographical environment, as well as institutional and historical aspects, and has a long-term perspective. The use of elements of evolutionary or behavioral economics can be helpful in achieving the goals of sustainable development. Generally, non-mainstream economic assumptions can be transmitted through two channels. The first is to present the problems and possible solutions to the widest possible audience using the media, organizations and associations. The second is the popularization of heterodox economics through universities (teaching students and publications) [
79]. Increased activity of the non-governmental organization sector may also be important to increase environmental awareness. Non-governmental organizations can act as partners in the implementation of joint projects (with the private and public sectors). The activities of these organizations create new opportunities because they often promote intergenerational responsibility and can also stimulate the endogenous potential of local communities. NGOs also have wide opportunities for financial support from the European Union [
17]. Unfortunately, the effects of actions resulting from increased ecological awareness will be visible only after some time: decades, or even after a change in generations.
6. Conclusions
The current study has a multi-faceted significance for research into sustainable consumption and production. The conducted research made it possible to achieve the assumed aim and formulate the following conclusions:
CEE countries are characterized by a relatively low level of development in terms of sustainable consumption and production compared to other EU countries, as indicated by the synthetic measure covering all individual SCP indicators. In general, CEE countries are more similar in terms of indicators representing sustainable consumption and production. In 2018, almost all of them joined one cluster.
Based on the measures of dispersion and mean (σ-convergence) and the analysis of changes in SCP indicators (β-convergence), it can be concluded that in 2018, compared to 2014, the convergence of the two types occurred only in the case of “Average CO2 emissions…”. It is also the only indicator that statistically significantly distinguishes the countries of central and eastern Europe from other EU countries. In CEE countries, changes in other indicators were mainly negative (increased adverse environmental impact), and the distance to other EU countries increased. The lack of convergence (while reducing the environmental impact) may be a serious problem in achieving the SD objectives at the EU level in the future.
In 2020, the pandemic reduced the impact of EU countries on the environment, which is indicated by the direction of changes in the mean value of all indicators taken into account. Comparing these changes with dispersion measures, it can be concluded that unusual circumstances in 2020 favored σ-convergence in terms of “Generation of waste”. Considering only the coefficient of variation, “Circular material use rate” and “Gross value added…” can be added. In terms of β-convergence, the pandemic was conducive to convergence in terms of “Circular material use rate”. It can be assumed that in 2021, the conditions of gradual easing of pandemic restrictions favored divergence in the three SCP indicators that could be assessed due to the availability of data (higher values of dispersion measures with environmentally unfavorable changes in the average value). In 2020, a certain decline in the similarity of CEE countries to each other in terms of selected indicators can be observed, which is indicated by the cluster analysis carried out for 2020 (e.g., change in the cluster of Latvia and Lithuania). The category that significantly distinguished the countries of central and eastern Europe from other EU countries in 2020 and 2021 was again the “Average CO2 emissions…”. However, this was a pandemic time, and it is difficult to define it as a constant trend. It may be considered unrepresentative. The results should be compared with the data for the following years in order to assess whether these changes were permanent. Of particular interest seems to be the verification of whether the post-pandemic rebound could have led to a permanent divergence in SCP.
On theoretical grounds, there are many reasons for the difficulties in achieving the SCP objectives in CEE countries and achieving convergence within the entire EU in this respect. The challenge for CEE countries will undoubtedly be the replacement of conventional cars with zero-emission cars and the continuation of convergence in this area. Effort should also be intensified in the implementation of the circular economy concept. In the discussion at various levels, it is necessary to use the tools of heterodox economics in order to increase the ecological awareness of societies and to promote the idea of “common good”.
The main implication of the above conclusions is to draw attention in the discussion at various levels to the lack of convergence in the framework of sustainable production and consumption in the EU. The observed phenomenon may pose a threat to the monolith of European structures, achieving common SDGs at the aggregate level and maintaining mutual trust by generating political tensions. An awareness of threats to sustainable development in CEE countries allows for the construction of short- and long-term strategies. The dilemmas observed in this study may justify a more individual approach in the debate on the implementation of elements of the SD concept. The formulated conclusions and recommendations can be treated as a stimulus to intensify activities in this area, because sustainable development in central and eastern Europe should be perceived as a goal promoting prosperity also in a strictly economic sense. Publishing research results on sustainable development is also important for increasing ecological awareness and activating non-governmental organizations. The strength of this paper is the comprehensive approach to the phenomenon of SCP within the framework of indicators serving the implementation of goal no. 12 from the Agenda 2030, taking into account all EU countries allowed to provide synthetic knowledge on the development of processes related to SCP convergence. This fills a certain research gap, as relatively little attention has been paid to this issue in the literature so far. However, some limitations of this study should be emphasized.
A certain limitation is the short time period available in the statistical database and the lack of data for 2014 for some countries (Cyprus, Hungary, Slovakia and Sweden). As statistics are updated and new information becomes available, the results should be compared with the data for the following years.
All conclusions in this work apply to the entire bloc of CEE countries. It should be remembered that within the two groups of countries identified in this study, there may be certain sub-groups that influence the results to some extent. It may be particularly important to distinguish a third group consisting of Mediterranean countries, due to the climate and different behaviors regarding the implementation of the CE. The analysis can also be extended to other countries belonging to central and eastern Europe (e.g., Albania, Belarus, Ukraine, Serbia or Montenegro). In order to refine the recommendations, it is necessary to take into account the detailed specificity of the study area, including social, cultural and historical factors. This means that the SCP strategies used should vary from country to country. It is also necessary to continue researching how to synthesize the category of sustainable development and convergence of economies in order to fully understand how European integration could shape the growth trajectory of a given country.
The analysis of sustainable consumption and production may go beyond the indicators adopted in this study. The impact of SCP can also be measured by a reduction in economic costs or an increase in competitiveness as a result of implementing the SD concept. An attempt to identify and evaluate such indicators is an important element in a comprehensive assessment because research on sustainable consumption and production cannot ignore the strictly economic dimension which is especially important in CEE countries.
The choice of research methods, also in this work, is always associated with certain limitations (e.g., the synthetic measure used). A research tool can never be completely objective because the results are only correct in the light of a given method. Therefore, future studies should use new, unconventional methods to assess SCP changes in European countries. They should be substitutive and complementary. An example may be the use of Synthetic Control Methods, thanks to which it is possible to compare the actual situation with a hypothetical situation (e.g., an attempt to compare the state of the natural environment with the hypothetical state if the SD concept had not been introduced).
Economics is a social science, and it is obvious that quantitative research does not reflect all dilemmas and problems, especially in the field of sustainable consumption and production. Therefore, it is necessary to use qualitative methods. Research related to the assessment of residents’ awareness of sustainable development seems to be an important aspect. Regularly obtained and comparable information in spatial and temporal terms would allow for the precise identification of areas in which (and using what methods) it is necessary to intensify information campaigns. Increasing pressure on the government in terms of environmental aspects seems necessary, because only in this way will these issues cease to be the subject of election campaigns and will become an actual long-term development model.
Due to the dilemmas highlighted above, in the authors’ opinion, there is a strong need to continue researching SCP and convergence in this area within the European Union. This research should be multi-dimensional and interdisciplinary.


