Article

Research on the Spatio-Temporal Changes of Vegetation and Its Driving Forces in Shaanxi Province in the Past 20 Years

1
Institute of Intelligent Machines, Hefei Institutes of Physical Science, Chinese Academy of Sciences, Hefei 230031, China
2
Intelligent Agriculture Engineering Laboratory of Anhui Province, Hefei 230031, China
3
College of Geomatics, Xi’an University of Science and Technology, Xi’an 710054, China
4
School of Resources and Environmental Engineering, Anhui University, Hefei 200601, China
5
Hefei Institutes of Collaborative Research and Innovation for Intelligent Agriculture, Hefei 231131, China
*
Author to whom correspondence should be addressed.
Sustainability 2023, 15(23), 16468; https://doi.org/10.3390/su152316468
Submission received: 2 November 2023 / Revised: 20 November 2023 / Accepted: 28 November 2023 / Published: 30 November 2023

Abstract

:
(1) Background: Vegetation is an important component of ecosystems. Investigating the spatio-temporal dynamic changes in vegetation in various Shaanxi Province regions is crucial for the preservation of the local ecological environment and sustainable development. (2) Methods: In this study, the KNDVI vegetation index over the 20-year period from 2003 to 2022 was calculated using MODIS satellite image data that was received from Google Earth Engine (GEE). Sen and MK trend analysis as well as partial correlation analysis were then utilized to examine the patterns in vegetation change in various Shaanxi Province regions. This paper selected meteorological factors, such as potential evapotranspiration (PET), precipitation (PRE), and temperature (TMP); human activity factors, such as land-use type and population density; and terrain factors, such as surface elevation, slope direction, and slope gradient, as the influencing factors for vegetation changes in the research area in order to analyze the driving forces of vegetation spatio-temporal changes. These factors were analyzed using a geo-detector. (3) Results: The vegetation in the research area presented a growth trend from 2003 to 2022, and the area of vegetation improvement was 189,756 km2, accounting for 92.15% of the total area. Among them, the area of significantly improved regions was 174,262 km2, accounting for 84.63% of the total area, and the area of slightly improved regions was 15,495 square kilometers, accounting for 7.52% of the total area. (4) Conclusions: The strengthening of bivariate factors and nonlinear enhancement were the main interaction types affecting vegetation changes. The combination of interaction factors affecting vegetation change in Shaanxi Province includes PRE ∩ PET as well as TMP ∩ PET. Therefore, climate conditions were the main driving force of KNDVI vegetation changes in Shaanxi Province. The data supported by this research are crucial for maintaining the region’s natural ecosystem.

1. Introduction

A crucial component of ecosystems, vegetation, is essential to the global atmospheric and energy cycles, as well as to the flow of carbon and water [1]. It also plays an important role in global change monitoring, providing essential information for research on material cycles, biodiversity, land use, and climate change, as well as being a scientific basis for environmental protection and sustainable development. Thus, one of the hottest subjects in regional and global change study is tracking the dynamics of vegetation [2,3,4].
Currently employed as one of the vegetation indices, NDVI (Normalized Difference Vegetation Index) [5] is a useful predictor of vegetation growth state, biological activity, and geographical distribution [6]. It may accurately reflect the information about changes in land surface vegetation and has a strong link with measures such as aboveground biomass [7], leaf area index [8], chlorophyll fluorescence produced by sunlight [9], and GPP [10]. It has been applied by many scholars in monitoring vegetation dynamics. Using NDVI, Beck et al. [11] examined how the vegetation changed dynamically in high-latitude regions, while Pettorelli et al. [12] used NDVI to examine how plants react to changes in their environment. The Nenjiang River Basin’s vegetation dynamic changes in response to multiscale drought stress were examined by Zhu Guanglei et al. [13]. The Brazilian Amazon region’s main vegetation underwent dynamic changes, which were examined by Raquel Carvalho et al. [14]. Moreover, both natural and man-made causes have an impact on vegetation alterations. The growth and spread of plants are strongly correlated with several environmental elements, including terrain, climate, and others [15,16,17,18]. Among climate factors, temperature and precipitation have a significant impact on vegetation. For instance, Zhou et al. [19] discovered that in some high-latitude regions of the northern hemisphere, precipitation is the primary factor influencing variations in plant cover. According to Suzuki et al. [20], rising temperatures have been shown to lengthen the growth season and increase vegetation production. Regarding human influences, they frequently affect vegetation dynamics in both good and bad ways. For instance, Ma Haiyun et al. [21] discovered that changes in southwest China’s plant cover are positively impacted by human activity. According to Wang et al. [22], ecological initiatives such as converting farms back into forests and grasslands may greatly expand the amount of vegetation in an area. According to Maeda et al. [23] and Nunes et al. [24], local vegetation cover will be significantly reduced as a result of land development, urbanization, excessive forest logging, and other human activities.
The current research mainly focuses on the impact of single factors (such as climate, topography, human activities, etc.) on vegetation. The effect of human and environmental causes on vegetation is not as well studied. When monitoring vegetation dynamics, commonly used vegetation indices such as NDVI and NIRv are often used as monitoring indicators. Nevertheless, photosynthesis itself is not reflected in the nonlinear, saturated connection between NDVI and aboveground biomass. Interactions between human and natural elements frequently affect vegetation [25,26]. A skewed interpretation of vegetation changes and an overestimation of the significance of the elements under research may result from focusing solely on the response of vegetation to a particular factor and ignoring the causes that induce vegetation changes. Therefore, in addition to considering traditional climate factors, the driving forces of vegetation changes must also comprehensively consider the influence of natural elements such as topography and human activities. In the past, techniques including trend analysis, partial correlation analysis, and residual analysis were mostly utilized in the investigation of the mechanisms behind changes in vegetation. Nevertheless, complex nonlinear interactions may also be a part of the process of driving variables for vegetation changes, in addition to a straightforward linear connection [27]. The nonlinear linkages between many influencing elements, particularly the one between human causes and climate change, cannot be explained by the aforementioned approaches. Wang Jinfeng et al. [28] proposed a statistical method called geographic detector, which can quantitatively identify the driving forces of single factors, the interaction between two factors, and risk zone detection. This method does not assume linearity and can better explain the interaction between factors and analyze variables. Currently, this model has been widely used in the study of vegetation NDVI driving mechanisms [29,30,31,32,33]. For example, Yao Bo et al. [34] examined the spatial patterns and underlying causes of vegetation dynamics in the Chongqing region of the Yangtze River Basin using geographic detector analysis. The results indicate that the locations experiencing trends in vegetation growth are largely found in the Chong-qing urban areas of the Wuling Mountain region and the Three Gorges Reservoir region. The three main factors influencing vegetation changes were human activity, climate, and geography. The factors that had the most influence were elevation, the average annual temperature, and the amount of light present at night. Pei Hongze et al. [35] used geographic detector to study the net ecosystem productivity (NEP) of the Loess Plateau region between 2000 and 2020, with a particular emphasis on the factors that drive it and its spatio-temporal structure. The results showed that the main reasons of NEP in the west, center, and east sub-regions of the research area had distinct geographical differentiation features. Precipitation, relative humidity, and other moisture conditions were the main climatic factors affecting the central and western regions. Combinations of geography, climate, and human activity most impacted the eastern area, with land use serving as the most prominent human component.
GEE is a cloud platform for planetary-scale geospatial analysis in terms of data gathering [36]. It significantly cuts down on the time needed for the collecting and processing of remote sensing data by offering rich open-source data and robust computer resources for regional and global change studies. For these reasons, the study constructed a time series of KNDVI spanning from 2003 to 2022 for the province of Shaanxi and used the Google Earth Engine platform to gather monthly NDVI datasets for the study region. The vegetation dynamics and changes in the research region over a 20-year period were then examined using the Sen and MK trend analysis techniques. In order to offer a theoretical foundation and methodological reference for the vegetation dynamics, evaluation, and ecosystem preservation in Shaanxi Province, partial correlation analysis and geographic detector were then employed to examine the driving forces behind the temporal variations in KNDVI data.

2. Study Area

Shaanxi Province is located in central China in the center of the Yellow River. It borders the higher levels of the Jialing River in the Qinba Mountain region as well as the southern portion of the Han River Basin, which is a Yangtze River tributary. Sichuan Province and Chongqing Municipality to the south, Hubei Province and Henan Province to the southeast, Ningxia Hui Autonomous Region and Gansu Province to the west, Shanxi Province to the east across the Yellow River, and Inner Mongolia Autonomous Region to the north are its borders. There are 206,000 square kilometers in all. The province is mostly made up of several types of topography, with a tendency toward higher elevations in the north and south and lower elevations in the center. These terrains include plains, mountains, plateaus, and basins. The climate of Shaanxi Province’s north and south varies significantly, as do the kinds and amounts of flora in each region. Northern Shaanxi, Guanzhong, and southern Shaanxi are the province’s three naturally occurring geographical areas, separated by variations in terrain, landforms, and flora types. Shaanxi spans three climatic zones, with the northern part of northern Shaanxi and along the Great Wall belonging to the temperate zone, southern Shaanxi belonging to the northern subtropical zone, and Guanzhong and most of northern Shaanxi belonging to the warm temperate zone. The province’s yearly mean temperature ranges from 0 to 16 °C, progressively dropping from east to west and from south to north. The province experiences between 340 and 1240 mm of precipitation on average every year, with the south receiving more precipitation than the north. The regions of Guanzhong, northern Shaanxi, and southern Shaanxi are semi-arid, semi-humid, and humid, respectively. There are large disparities in the distribution of the province’s complex and varied flora types. The region north of the Great Wall in Shaanxi’s northern region is near the desert, where desert plants predominate and there is little vegetation. The southern part of Yulin and the northern part of Yan’an, south of the Great Wall, are typical loess plateau regions where soil erosion is severe and vegetation coverage is low, mainly consisting of shrubs. The Beishan Mountains are distributed with deciduous broad-leaved forests, with higher vegetation coverage. The Guanzhong region is characterized by a large number of agricultural fields, and urban development has led to lower vegetation coverage. The Qinling Mountains and the northern part of southern Shaanxi are dominated by warm temperate deciduous broad-leaved forests, while the Bashan region has evergreen broad-leaved forests and deciduous broad-leaved forests, with good vegetation coverage. Figure 1 depicts the study area’s location, land-use types, and elevation distribution, where Figure 1A indicates the location, Figure 1B illustrates the distribution of land-use types in the study area in 2022, and Figure 1C depicts the distribution of surface elevation in the study area.

3. Materials and Methods

3.1. Data Preprocessing and Acquisition

This article selects monthly MODIS data from 2003 to 2022 as the data source for calculating the KNDVI vegetation index. The Loess Plateau branch of the NESS Data Center (htxxp://loess.geodata.cn, accessed on 31 December 2022) provided the monthly average temperature (TMP) and monthly average precipitation (PRE), specifically the 1 km resolution average temperature and monthly precipitation datasets for China from 1901 to 2022. East View Cartographic contributed the population density data (PD), which come from the LandScan global population dataset created by ORNL (Oak Ridge National Laboratory, Oak Ridge, TN, USA). LandScan is the most accurate and reliable global population dynamic statistical analysis database based on geographic location, using innovative methods such as remote sensing and GIS, and it has the best resolution and distribution models (htxxps://landscan.ornl.gov/, accessed on 31 December 2022). The 1 km monthly potential evapotranspiration dataset for China from 1901 to 2022 is sourced from the National Tibetan Plateau Data Center (data.tpdc.ac.cn, accessed on 31 December 2022). The yearly China Land Cover Dataset (CLCD), which is a 30 m yearly land cover dataset and its dynamics in China from 1985 to 2022 (zenodo.org, accessed on 31 December 2022), was created by Huang Xin et al. from Wuhan University using 335,709 scenes of Landsat data on Google Earth Engine as the basis for the land-use dataset [37]. The DEM data is derived from the Geographic Spatial Data Cloud’s 90 m resolution SRTM data. Table 1 displays the particular parameters of each dataset.
The GEE platform database is the source of the MODIS data that was previously discussed. Through the use of an internet database, we were able to obtain the MODIS data and resample it to a spatial resolution of 1000 m. Each month’s KNDVI is computed, and the yearly KNDVI data are then obtained by performing the maximum value synthesis. In order to match the spatial resolution of other data, the DEM data’s spatial resolution is resampled to 1000 m and utilized to compute the research area’s slope and aspect information. The ArcGIS closest neighbor approach is used to resample the CLCD land-use type data to a geographic resolution of 1000 m. A uniform projection transformation is applied to all data in order to guarantee coordinate systems consistency.
Figure 2 shows the mean distribution of temperature, precipitation, and potential evapotranspiration (PET, PRE, and TMP, respectively) in the study area over a period of 20 years. Panels (a)–(c) depict the 20-year average distribution of potential evapotranspiration (PET), precipitation (PRE), and temperature (TMP), respectively. From Figure 2, it is evident that the spatial distribution of the three meteorological factors exhibits significant heterogeneity. In Panel (a), the 20-year mean of potential evapotranspiration ranges from 45.79 mm to 105.98 mm. The central region (Guanzhong) has higher values of evapotranspiration, while values are smaller in northern and southern Shaanxi. Panel (b) illustrates that the 20-year mean precipitation ranges from 26.93 mm to 97.88 mm. The southern Shaanxi region has the highest precipitation, followed by the Guanzhong region, and the lowest is in northern Shaanxi, especially in the northwest region, which, being close to the desert, has low vegetation coverage and scarce precipitation. Panel (c) reveals that the 20-year mean temperature ranges from −0.98 °C to 16.83 °C. The northern Shaanxi region has the lowest average temperature, while the Guanzhong and southern Shaanxi regions have relatively higher average temperatures. The urbanized Guanzhong region, characterized by a high proportion of impervious surfaces, exhibits elevated temperatures, while the southern Shaanxi region, boasting high elevation and abundant sunlight, also experiences higher temperatures.

3.2. KNDVI Calculation

The most used indicator for tracking vegetation changes is the NDVI; however, it has two main drawbacks. First, there is a nonlinear and saturating relationship between NDVI and green biomass [38]. The enhanced vegetation index (EVI) and other indices have attempted to use additional band information to construct vegetation indices to compensate for this issue, but the saturation phenomenon still exists. Second, when constructing vegetation indices, they respond to the presence of green leaves but do not directly reflect the process of photosynthesis in green vegetation. This means that GPP can decrease without leaf loss (i.e., reduced LAI) or a decrease in leaf chlorophyll [39]. In 2021, scholars from multiple countries proposed a non-linear vegetation index, KNDVI, in SCIENCE ADVANCES [40]. This index maximizes the utilization of spectral information and employs a machine-learning perspective, using kernel analysis to linearize NDVI and effectively prevent its saturation and sluggish response to photosynthesis. It addresses the long-standing problem of satellite observation of the terrestrial biosphere and can more accurately reflect the dynamic changes between land carbon sources and sinks. Compared to traditional NDVI, NIRv, and other vegetation indices, this method demonstrates greater stability and robustness. The method is shown in Equations (1)–(4).
K N D V I = k n , n k n , r k n , n + k n , r
The reflectance of the red band is denoted by r in the equation, the reflectance of the near-infrared band by n, and the correlation between the bands is represented by k(n,n) and k(n,r).
Furthermore, a radial basis function (RBF) is used to describe the correlation between the bands.
k ( n , r ) = exp ( ( n r ) 2 ) 2 σ 2
The near-infrared and red bands’ separation from one another is determined by the equation’s parameter σ .
K N D V I = 1 k ( n , r ) 1 + k ( n , r ) = tanh ( ( n r 2 σ ) 2 )
The average distance between the red and near-infrared bands, or σ = 0.5 ( n + r ) , is fixed as the length scale parameter σ in order to further simplify the index. The index functions well in practice thanks to this simplification, which enables it to be adaptable for every pixel. Equation (4) displays the outcome of the final computation.
K N D V I = tanh ( N D V I 2 )

3.3. Methods

Theil-Sen Median and Mann-Kendall trend analysis techniques have been used in the quantitative study of vegetation change trends in Shaanxi Province over the previous 20 years using temporal KNDVI data. This study used elevation, slope, and aspect as environmental parameters and land-use type and population density as anthropogenic elements in accordance with previous research [41,42,43,44,45]. The meteorological parameters that were selected included the yearly average temperature, the annual average precipitation, and the annual average potential evapotranspiration. The association between the KNDVI data and each component was examined and evaluated using the partial correlation analysis approach. The reactions and underlying causes of interannual vegetation changes to each condition were also examined using the geo-detector. The study’s flowchart is displayed in Figure 3.

3.3.1. Trend Analysis

Sen’s slope estimation, sometimes referred to as the Theil-Sen median method, is a reliable non-parametric statistical approach for determining trends. The technique is less susceptible to outliers and measurement mistakes and has a very high computing efficiency. It is frequently used to examine trends in data from lengthy time periods [46,47,48].
S K N D V I = m e a n ( x j x i j i ) , ( j > i )
In the equation, SKNDVI represents the slope of vegetation change and xi and xj represent long time-series KNDVI data. SKNDVI > 0 and SKNDVI < 0 indicate vegetation improvement and degradation trends, respectively. Mann–Kendall is a commonly used method for non-parametric statistical testing. Its advantages are that it does not require the measured values to follow a normal distribution, does not assume a linear trend, and is not affected by missing values and outliers. It has been widely used in the trend significance testing of long time-series data [49,50,51,52]. For a time series Xi,j = 1, 2, …, i, …, j, …, n, the standardized test statistic, Z, is defined as
Z = S V a r ( S ) , S > 0 0 , ( S = 0 ) S + 1 V a r ( S ) , S < 0
S = i = 1 n 1 j = i + 1 n s i g n ( x j x i )
s i g n ( K N D V I i K N D V I j ) = 1 , i f ( K N D V I i K N D V I j ) < 0 0 , i f ( K N D V I i K N D V I j ) = 0 1 , i f ( K N D V I i K N D V I j ) > 0
In the formula, n represents the number of data points, while xi and xj stand for long time-series KNDVI data. In this work, we examined 20 years’ worth of Shaanxi Province vegetation KNDVI data, where n is greater than or equal to 8. With mean and variance, the test statistic S has an approximation normally distributed distribution:
E ( S ) = 0
V a r ( S ) = n ( n 1 ) ( 2 n + 5 ) 18
At the significance level α, if Z > Z 1 α / 2 , it indicates a significant change trend in the time-series data. Z 1 α / 2 represents the value corresponding to the standard normal distribution function at a confidence level of α. Based on the significance testing method and referring to relevant literature [53,54,55], Z s = 1.96 is chosen as the criterion for significance division. When Z s 1.96 , it indicates that the vegetation change is not significant, and when Z s > 1.96 it indicates that the vegetation change is significant.

3.3.2. Partial Correlation Analysis

In order to assess the correlations between land use, population density, annual average temperature, yearly average precipitation, annual average potential evapotranspiration (which are regarded as five parameters), and KNDVI, this study used the partial correlation analysis approach. The link between each component and KNDVI was examined independently by adjusting for other factors. The relationship between land use, population density, annual average temperature, yearly average precipitation, annual average potential evapotranspiration, and KNDVI is shown by the positive or negative value of the partial correlation coefficient [56,57,58].
r x y = i = 1 n [ ( x i x ¯ ) ( y i y ¯ ) ] i = 1 n ( x i x ¯ ) 2 i = 1 n ( y i y ¯ ) 2
reflects the correlation between variables x and y in the equation, where sample number is denoted by i. The vegetation’s KNDVI value for the i-th year is represented by the symbol xi, and one of the contributing elements, such as the annual average temperature or the annual average precipitation for the corresponding time, is represented by the symbol yi. x ¯ represents the average value of KNDVI for the study area from 2003 to 2022 and y ¯ represents the value of the influencing factor for the corresponding time period.

3.3.3. Analysis by Geographic Detector

Wang Jinfeng et al. created the Geodetector statistical technique, which can be used to analyze geographical differentiation and identify its causes [59]. By using the viewpoint of spatial stratified heterogeneity, it ascertains how comparable the spatial distributions of two variables are [60,61,62,63]. Four components make up the Geodetector framework: factor detection, interaction detection, ecological detection, and danger detection. We used Geodetector’s factor and interaction detection features in this investigation.
The spatial differentiation of the dependent variable (Y), which in this study is the KNDVI, and the explanatory power (q) of the driving factors (X), which in this study are the KNDVI, potential evapotranspiration, annual temperature, precipitation, and CLCD, on the spatial differentiation of the dependent variable, are investigated using factor detection. Its goal is to investigate how driving factors affect the KNDVI’s spatial variation and differentiation. Equations (12) and (13) present the computation formulas:
q = 1 h = 1 L N h σ h 2 N σ 2 = 1 S S W S S T
S S W = h = 1 L N h σ h 2 ,   S S T = N σ 2
Higher q values in the equation signify a factor’s stronger explanatory power; the q value ranges from [0, 1]; L represents the strata of the dependent variable Y or the factor X; Nh and N represent the number of units in stratum h and the entire region, respectively; σ h 2 and σ 2 represent the variance of Y values in stratum h and the entire region, respectively; and SSW and SST represent the sum of within-stratum variances and the total variance of the entire region.
The purpose of interaction detection is to determine whether the various influencing factors, Xs, work in concert to affect the dependent variable Y. It assesses whether there is a difference in the explanatory power of the dependent variable Y when different factors interact compared to when they act individually. This is done by separately calculating the q(X1) and q(X2) for different factors such as X1 and X2 on the dependent variable Y and then calculating their interaction term q ( X 1 X 2 ) . Finally, q(X1), q(X2), and q ( X 1 X 2 ) are compared. Various types of interactions are shown in Table 2.

4. Results

4.1. Temporal Analysis of Mean Value of KNDVI

The average KNDVI of Shaanxi Province and its geographical sub-regions between 2003 and 2022 was subjected to statistical analysis; the findings are displayed in Figure 4. The figure shows that Shaanxi Province’s average KNDVI varied between 0.42 and 0.52 over the given period. The spatial distribution of KNDVI was categorized into three groups based on earlier research [64,65,66]: medium-low (0.2~0.4), medium (0.4~0.6) and medium-high (0.6~0.8). Medium-low and medium vegetation cover categories were the most common in Shaanxi Province. The average KNDVI in the southern Shaanxi region was greater than in other parts of the province, followed by the Guanzhong region and the northern Shaanxi region, based on the geographic sub-regions. The average KNDVI ranged from 0.58 to 0.61 in southern Shaanxi from 2003 to 2022, from 0.46 to 0.53 in the Guanzhong area, and from 0.24 to 0.42 in northern Shaanxi. The amount of vegetation varied clearly by region, with the cover falling toward the north. Shaanxi Province and every geographic sub-region had positive slopes in the linear regression analysis on the annual KNDVI values, suggesting an overall trend toward increased plant cover. The regression function’s slope was 0.0046 throughout Shaanxi, 0.0073 in northern Shaanxi, 0.0027 in the Guanzhong region, and 0.003 in southern Shaanxi. This suggests that the northern Shaanxi region had the highest rate of vegetation cover expansion, followed by the Guanzhong region and the southern Shaanxi region.

4.2. Trend Analysis of KNDVI

The temporal KNDVI data slopes were estimated using the Theil–Sen median method, as shown in Figure 5. The analysis reveals an overall improvement in vegetation cover in Shaanxi Province, with localized areas exhibiting a declining trend. Urban regions such as Xi’an, Baoji et al. in the Guanzhong urban cluster, significant cities in southern Shaanxi such as Hanzhong and Ankang, and urban areas in northern Shaanxi such as Yulin and Yan’an are the main locations of vegetation degradation. The area with improved vegetation growth covers 189,756 km2, accounting for 92.15% of the total area; the area with stable vegetation growth covers 3977 km2, accounting for 1.93% of the total area; and the area with deteriorating vegetation growth covers 12,184 km2, accounting for 5.92% of the total area. In terms of geographic regions, the area with improved vegetation growth has the highest proportion in the northern Shaanxi region, accounting for 98.92% of the northern Shaanxi area, followed by the southern Shaanxi region, accounting for 95.71% of the southern Shaanxi area, and finally the Guanzhong region, accounting for 78.08% of the Guanzhong area. The area with stable vegetation growth has the highest proportion in the Guanzhong region, accounting for 4.58% of the Guanzhong area, followed by the southern Shaanxi region, accounting for 1.32% of the southern Shaanxi area, and finally the northern Shaanxi region, accounting for 0.61% of the northern Shaanxi area. In the Guanzhong region, the area with declining vegetation growth makes up the largest proportion (17.34%), followed by the southern Shaanxi region (2.98%) and the northern Shaanxi region (0.47%) of the Guanzhong region.
Figure 6 illustrates the results of the MK significance test. It is evident from the figure that the vegetation growth throughout Shaanxi Province shows significant spatial heterogeneity, with degradation primarily concentrated in urban areas, particularly in large cities such as Xi’an and Xianyang. Consistent with earlier study findings, the improvement in vegetation growth is greatest in the northern and southern parts of Shaanxi and least in the center region. By statistically analyzing the area of different trends in vegetation change, the area showing an improvement trend is 189,757 km2, of which the area of significant improvement is 174,262 km2, accounting for 84.63% of the total area. The area of slight improvement is 15,495 km2, accounting for 7.52% of the total area. The area of stable and unchanged vegetation is 3977 km2, accounting for 1.93% of the total area. The area showing a degradation trend is 12,184 km2, of which the area of slight degradation is 5767 km2, accounting for 2.8% of the total area, and the area of significant degradation is 6417 km2, accounting for 3.12% of the total area. In terms of different geographical regions, for the northern region of Shaanxi, the area of improvement accounts for 98.92% of the total area, of which the area of significant improvement accounts for the highest proportion, 93.06% of the total area, followed by the area of improvement, accounting for 5.86% of the total area. In the central region, the area of deterioration makes up 17.34% of the whole area, with the area of considerable degradation being 5126 km2, and the area of improvement is 78.08% of the total area, with the area of improvement being 36,321 km2. In Shaanxi’s southern region, the area of improvement makes up 95.71% of the total area, while the area of deterioration makes up 2.98%.

4.3. Partial Correlation Analysis of Influencing Factors

Due to different hydrothermal conditions in different regions, human activities have varying effects and degrees of impact on nature, resulting in spatial variations in vegetation growth. In this study, the corresponding KNDVI data were used as the dependent variable for a partial correlation analysis, and the land-use types (a), population density (b), annual average potential evapotranspiration (c), annual average precipitation (d), and annual average temperature (e) data from 2003 to 2022 were used as independent variables. Figure 7 presents the findings. The KNDVI ranges from −0.97 to 0.98 for population density data, from −0.82 to 0.91 for yearly average potential evapotranspiration, from −0.95 to 0.88 for yearly average precipitation, and from −0.92 to 0.83 for yearly average temperature. The partial correlation coefficients between land-use types and KNDVI range from −0.99 to 0.95.
The significant pixel area at the significance level for all land-use categories in the province is 73,944 km2. Of this total area, 48.35% is made up of positively correlated pixels, while 51.65% is made up of negatively correlated pixels. According to population density, the relevant pixel area at the significance level is 73,944 km2, of which 37.26% and 62.74% are positively correlated and negatively correlated, respectively, of the entire area of this kind of pixel. At the significance level, the yearly average potential evapotranspiration has a significant pixel area of 73,908 km2. Of this type of pixel, the positively correlated pixel area makes up 50.35% of the entire area, while the negatively correlated pixel area makes up 49.65%. The relevant pixel area for yearly average precipitation at the significance level is 73,908 km2, of which the positively correlated pixel area makes up 27.95% and the negatively correlated pixel area accounts for 72.05% of the total area of this type of pixel. At the significance level, the yearly average temperature has a significant pixel size of 73,908 km2. Of this type of pixel, the positively correlated pixel area makes up 24.7% of the overall area, while the negatively correlated pixel area makes up 75.3%.
For different geographical regions, the proportion of the area where KNDVI is negatively correlated with land-use types in the northern Shaanxi and Guanzhong regions (23.68%, 17.81%) is greater than the proportion of the area where it is positively correlated (20.7%, 13.01%). In contrast, in southern Shaanxi, the proportion of the area where KNDVI is positively correlated with land-use types (17.04%) is greater than the proportion of the area where it is negatively correlated (13.28%). KNDVI is negatively correlated with population density in the northern Shaanxi, Guanzhong, and southern Shaanxi regions, with the proportions being 30.69%, 20.11%, and 15.17%, respectively. KNDVI is positively correlated with annual average potential evapotranspiration in northern Shaanxi (29.33%), while it is negatively correlated in the Guanzhong and southern Shaanxi regions (18.43%, 20.52%). There is a negative correlation between each region and annual average precipitation, with the proportions being northern Shaanxi (33.82%), Guanzhong (21.59%), and southern Shaanxi (20.2%). Additionally, there is a negative association between the yearly average temperature and each region; the proportions are as follows: Guanzhong (16.01%), southern Shaanxi (24.21%), and northern Shaanxi (37.23%).
Figure 8 computes and displays the annual count of interactions between different variables from 2003 to 2022. Bivariate enhancement and nonlinear enhancement are two examples of the interactions between influencing elements that are depicted in the graph. In graph (a), the interaction effects among influencing factors leading to changes in vegetation KNDVI in Shaanxi Province were relatively balanced between the two types from 2003 to 2011. However, from 2012 to 2022, the number of bivariate enhancement interaction types exceeds that of nonlinear enhancement. From graph (b), it can be seen that, in the northern Shaanxi region, the number of nonlinear enhancement interaction types between influencing factors is greater than that of bivariate enhancement. From graph (c), it can be seen that, in the Guanzhong region, the bivariate enhancement is the dominant type of interaction between influencing factors. From graph (d), it can be seen that, for the southern Shaanxi region, the interaction types between influencing factors are similar to those in the Guanzhong region, with bivariate enhancement being the main type.

5. Discussion

5.1. Response of KNDVI to Influencing Factors

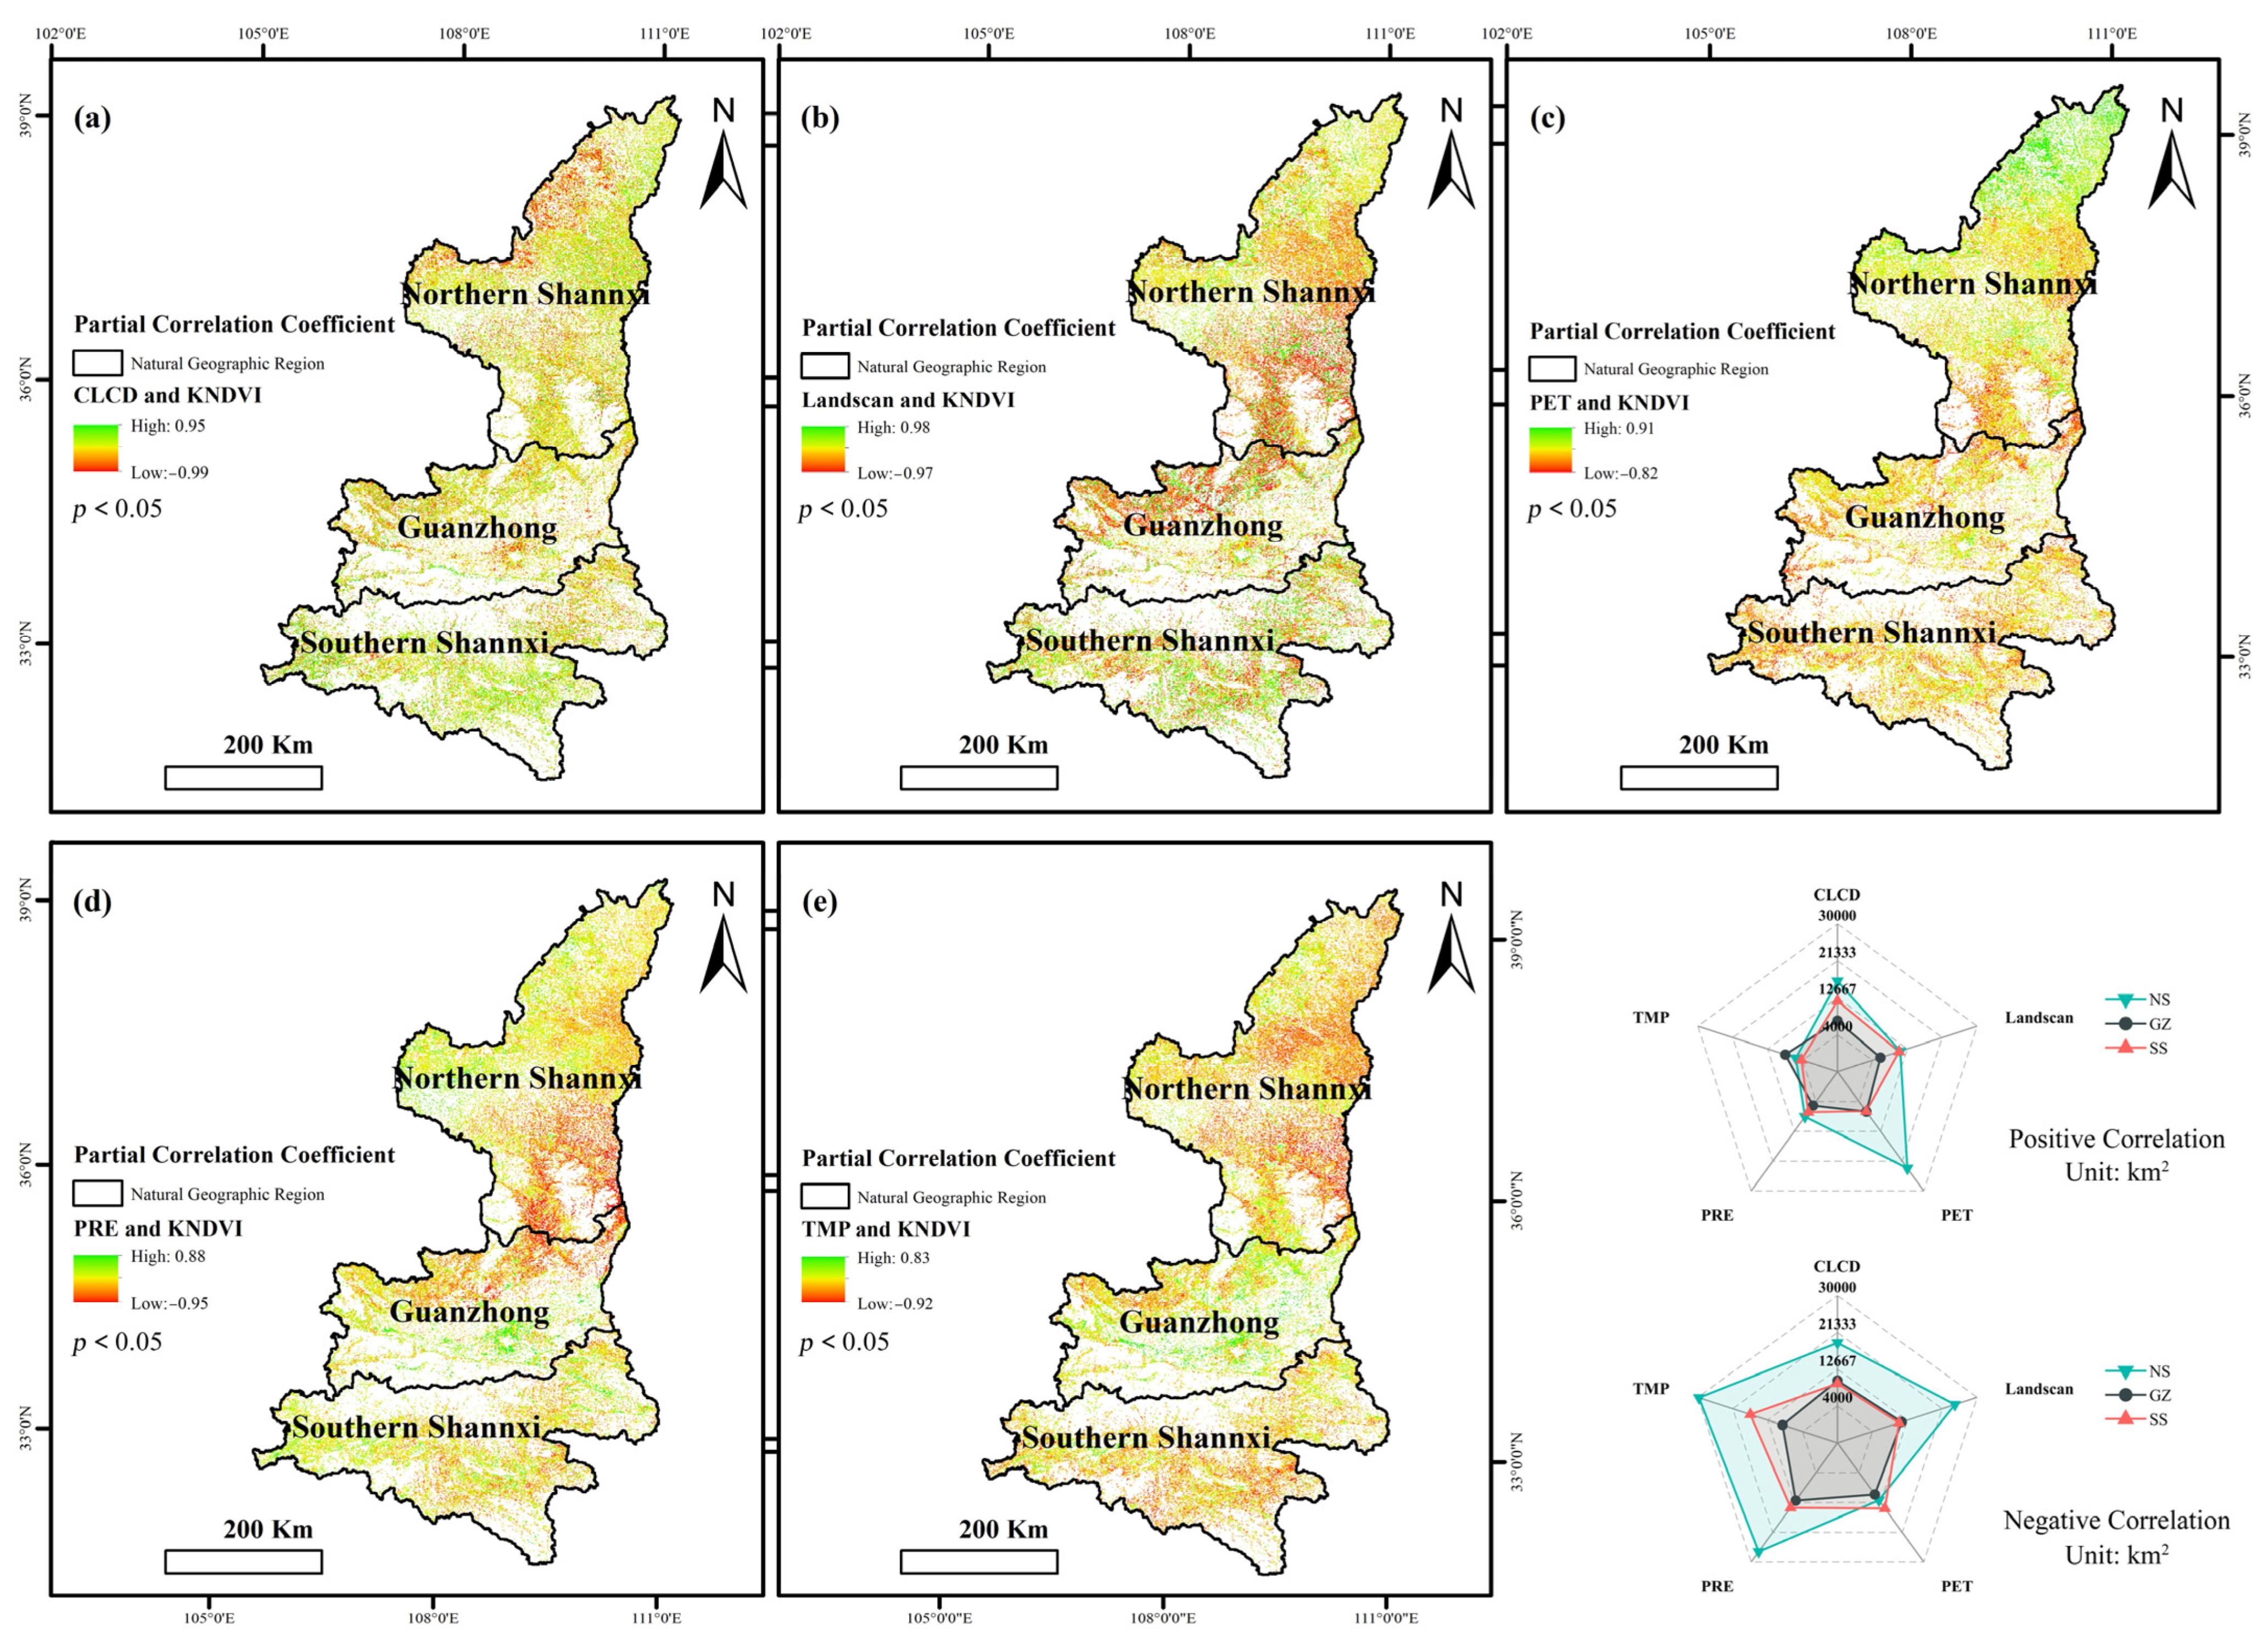
In this study, the relationship between the eight influencing factors—land-use type (CLCD), elevation (DEM), slope (Slope), aspect (Aspect), population density (Landscan/PD), annual average potential evapotranspiration (PET), annual average precipitation (PRE), and annual average temperature (TMP) and the changes in the KNDVI in Shaanxi Province from 2003 to 2022 was examined using the Geographic Detector. Figure 9 displays the findings of the Geographic Detector’s single-factor study. Among them, (a), (b), (c), and (d) represent the single-factor detection results for Shaanxi Province, northern Shaanxi, Guanzhong, and southern Shaanxi, respectively. From Figure 9a, it can be seen that there are significant differences in the contribution values (q values) of each factor to the KNDVI of vegetation in the entire province of Shaanxi. By calculating the average q values for each factor over the years and sorting them, the ranking is as follows: CLCD (0.655) > PRE (0.584) > PET (0.423) > Slope (0.382) > TMP (0.133) > DEM (0.093) > Landscan (0.023) > Aspect (0.007).
The changes in land-use type have caused significant variations in vegetation KNDVI, which may be related to anthropogenic factors such as urban expansion, afforestation, and reforestation. Precipitation is the most important climate factor affecting vegetation KNDVI changes, as adequate rainfall can promote vegetation growth. When analyzing the effects of different factors on vegetation KNDVI changes, we found that the year 2015 (q = 0.678) had the greatest impact of land-use type changes on vegetation k-NDVI values, 2003 (q = 0.117) for surface elevation, 2017 (q = 0.406) for slope, 2022 (q = 0.01) for aspect, 2022 (q = 0.085) for population, 2005 (q = 0.53) for annual potential evapotranspiration, 2004 (q = 0.789) for annual average precipitation, and 2007 (q = 0.176) for annual average temperature.
Different climatic conditions, natural environments, and vegetation types in different geographical regions result in varying effects of different influencing factors on vegetation KNDVI changes. For the northern Shaanxi region, the relationship of the effects of different influencing factors on regional vegetation KNDVI changes is as follows: CLCD (0.538) > PRE (0.524) > PET (0.386) > Slope (0.1) > TMP (0.098) > DEM (0.03) > Aspect (0.006) > Landscan (0.001). The year 2003 (q = 0.669) was found to have the greatest influence of land-use type changes on vegetation k-NDVI values, 2016 (q = 0.04) for surface elevation, 2012 (q = 0.118) for slope, 2022 (q = 0.008) for aspect, 2022 (q = 0.002) for population, 2003 (q = 0.587) for annual potential evapotranspiration, 2021 (q = 0.829) for annual average precipitation, and 2012 (q = 0.182) for annual average temperature. Thus, it can be seen that land-use type and precipitation are the most important influencing factors causing vegetation k-NDVI changes in the northern Shaanxi region.
For the Guanzhong region, the relationship of different influencing factors on regional vegetation KNDVI changes is as follows: CLCD (0.621) > DEM (0.587) > PET (0.496) > TMP (0.429) > Slope (0.342) > PRE (0.277) > Aspect (0.041) > Landscan (0.01). In the year 2022, land-use type, surface elevation, and slope were found to have the greatest influence on vegetation KNDVI changes, with the respective q values of 0.676, 0.658, and 0.408. The year 2019 (q = 0.051) had the greatest influence of aspect on vegetation KNDVI changes, 2007 (q = 0.016) for population, 2003 (q = 0.557) for annual potential evapotranspiration, 2005 (q = 0.351) for annual average precipitation, and 2012 (q = 0.495) for annual average temperature. Thus, it can be seen that land-use type, elevation, and evapotranspiration are the most important influencing factors causing vegetation KNDVI changes in the Guanzhong region.
For the southern Shaanxi region, the relationship of different influencing factors on regional vegetation KNDVI changes is as follows: DEM (0.43) > CLCD (0.378) > PET, PRE (0.217) > Slope (0.215) > TMP (0.068) > Landscan (0.041) > Aspect (0.021). The year 2020 (q = 0.452) was found to have the greatest influence of land-use type changes on vegetation KNDVI values, 2006 (q = 0.502) for surface elevation, 2022 (q = 0.262) for slope, 2014 (q = 0.025) for aspect, 2020 (q = 0.071) for population, 2003 (q = 0.338) for annual potential evapotranspiration, and 2011 (q = 0.123) for annual average temperature. Thus, it can be seen that elevation, land-use type, evapotranspiration, and precipitation are important influencing factors causing vegetation KNDVI changes in the southern Shaanxi region.

5.2. Examination of the Factors Influencing Vegetation KNDVI

The dynamic and multifaceted process of vegetation change is impacted by a wide range of variables. China has been implementing ecological measures since 2000, such as preserving natural forests and converting farms back to forests and grasslands. These actions have increased the amount of plant cover and promoted beneficial ecological growth [67,68,
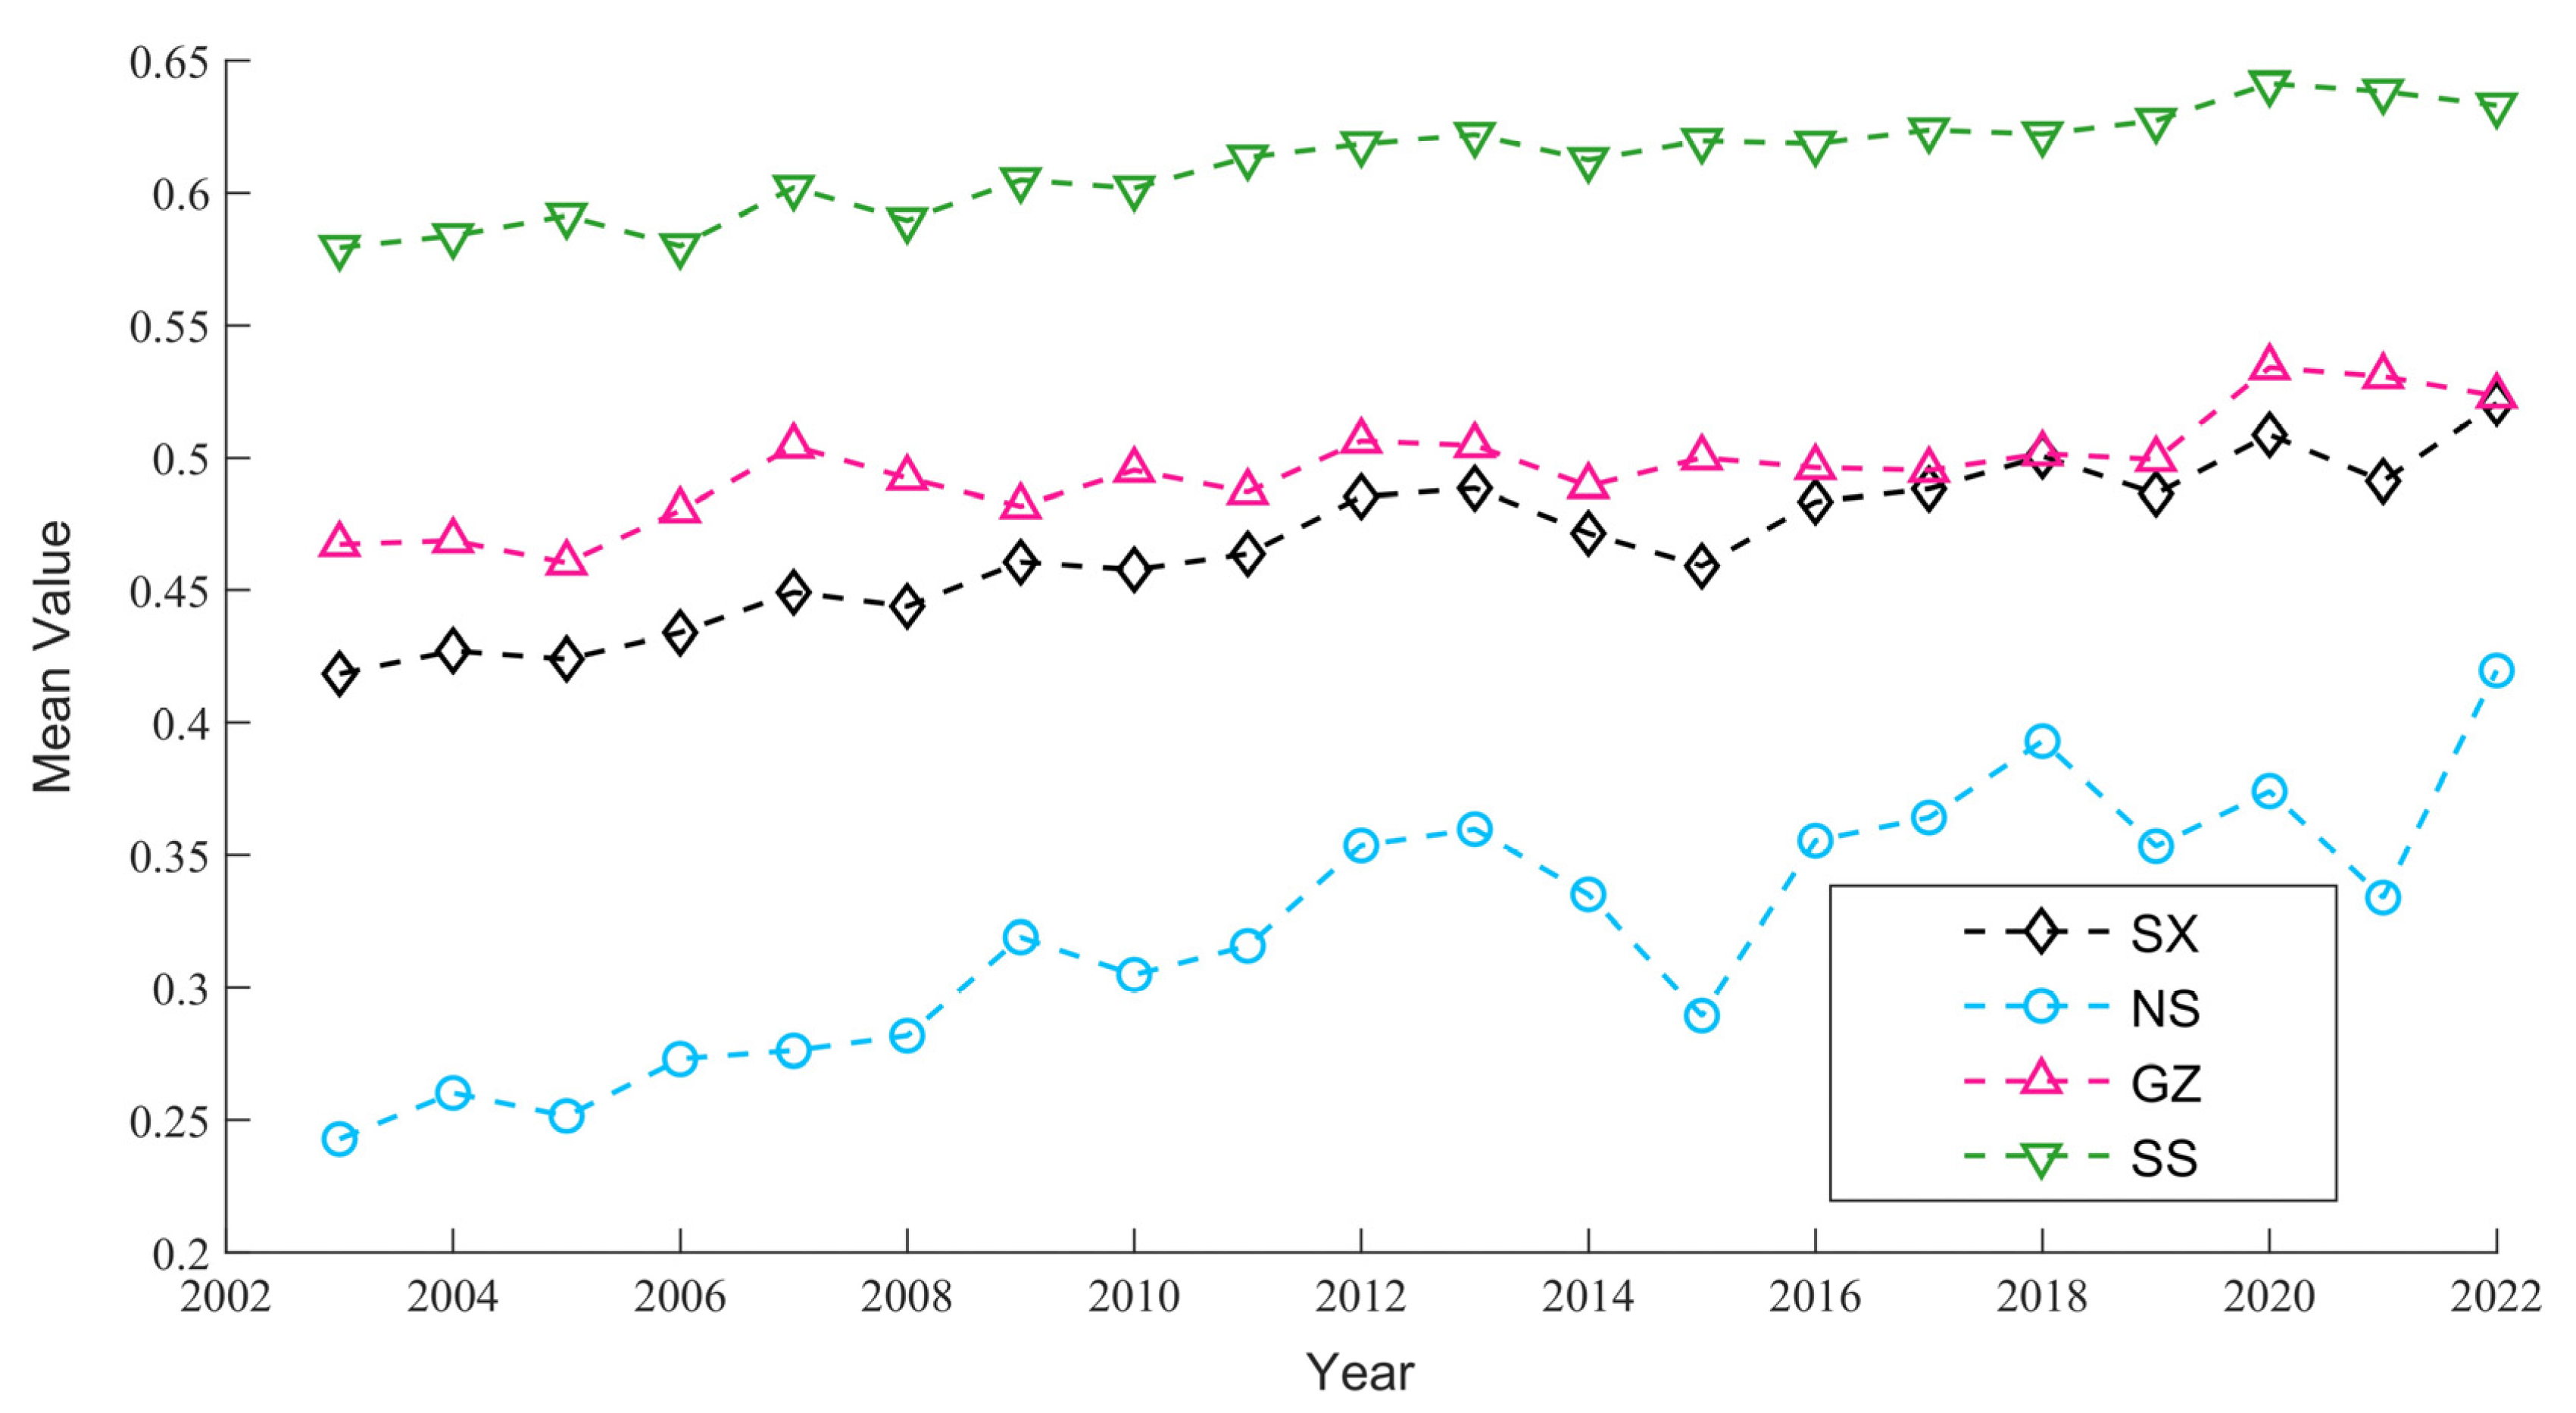
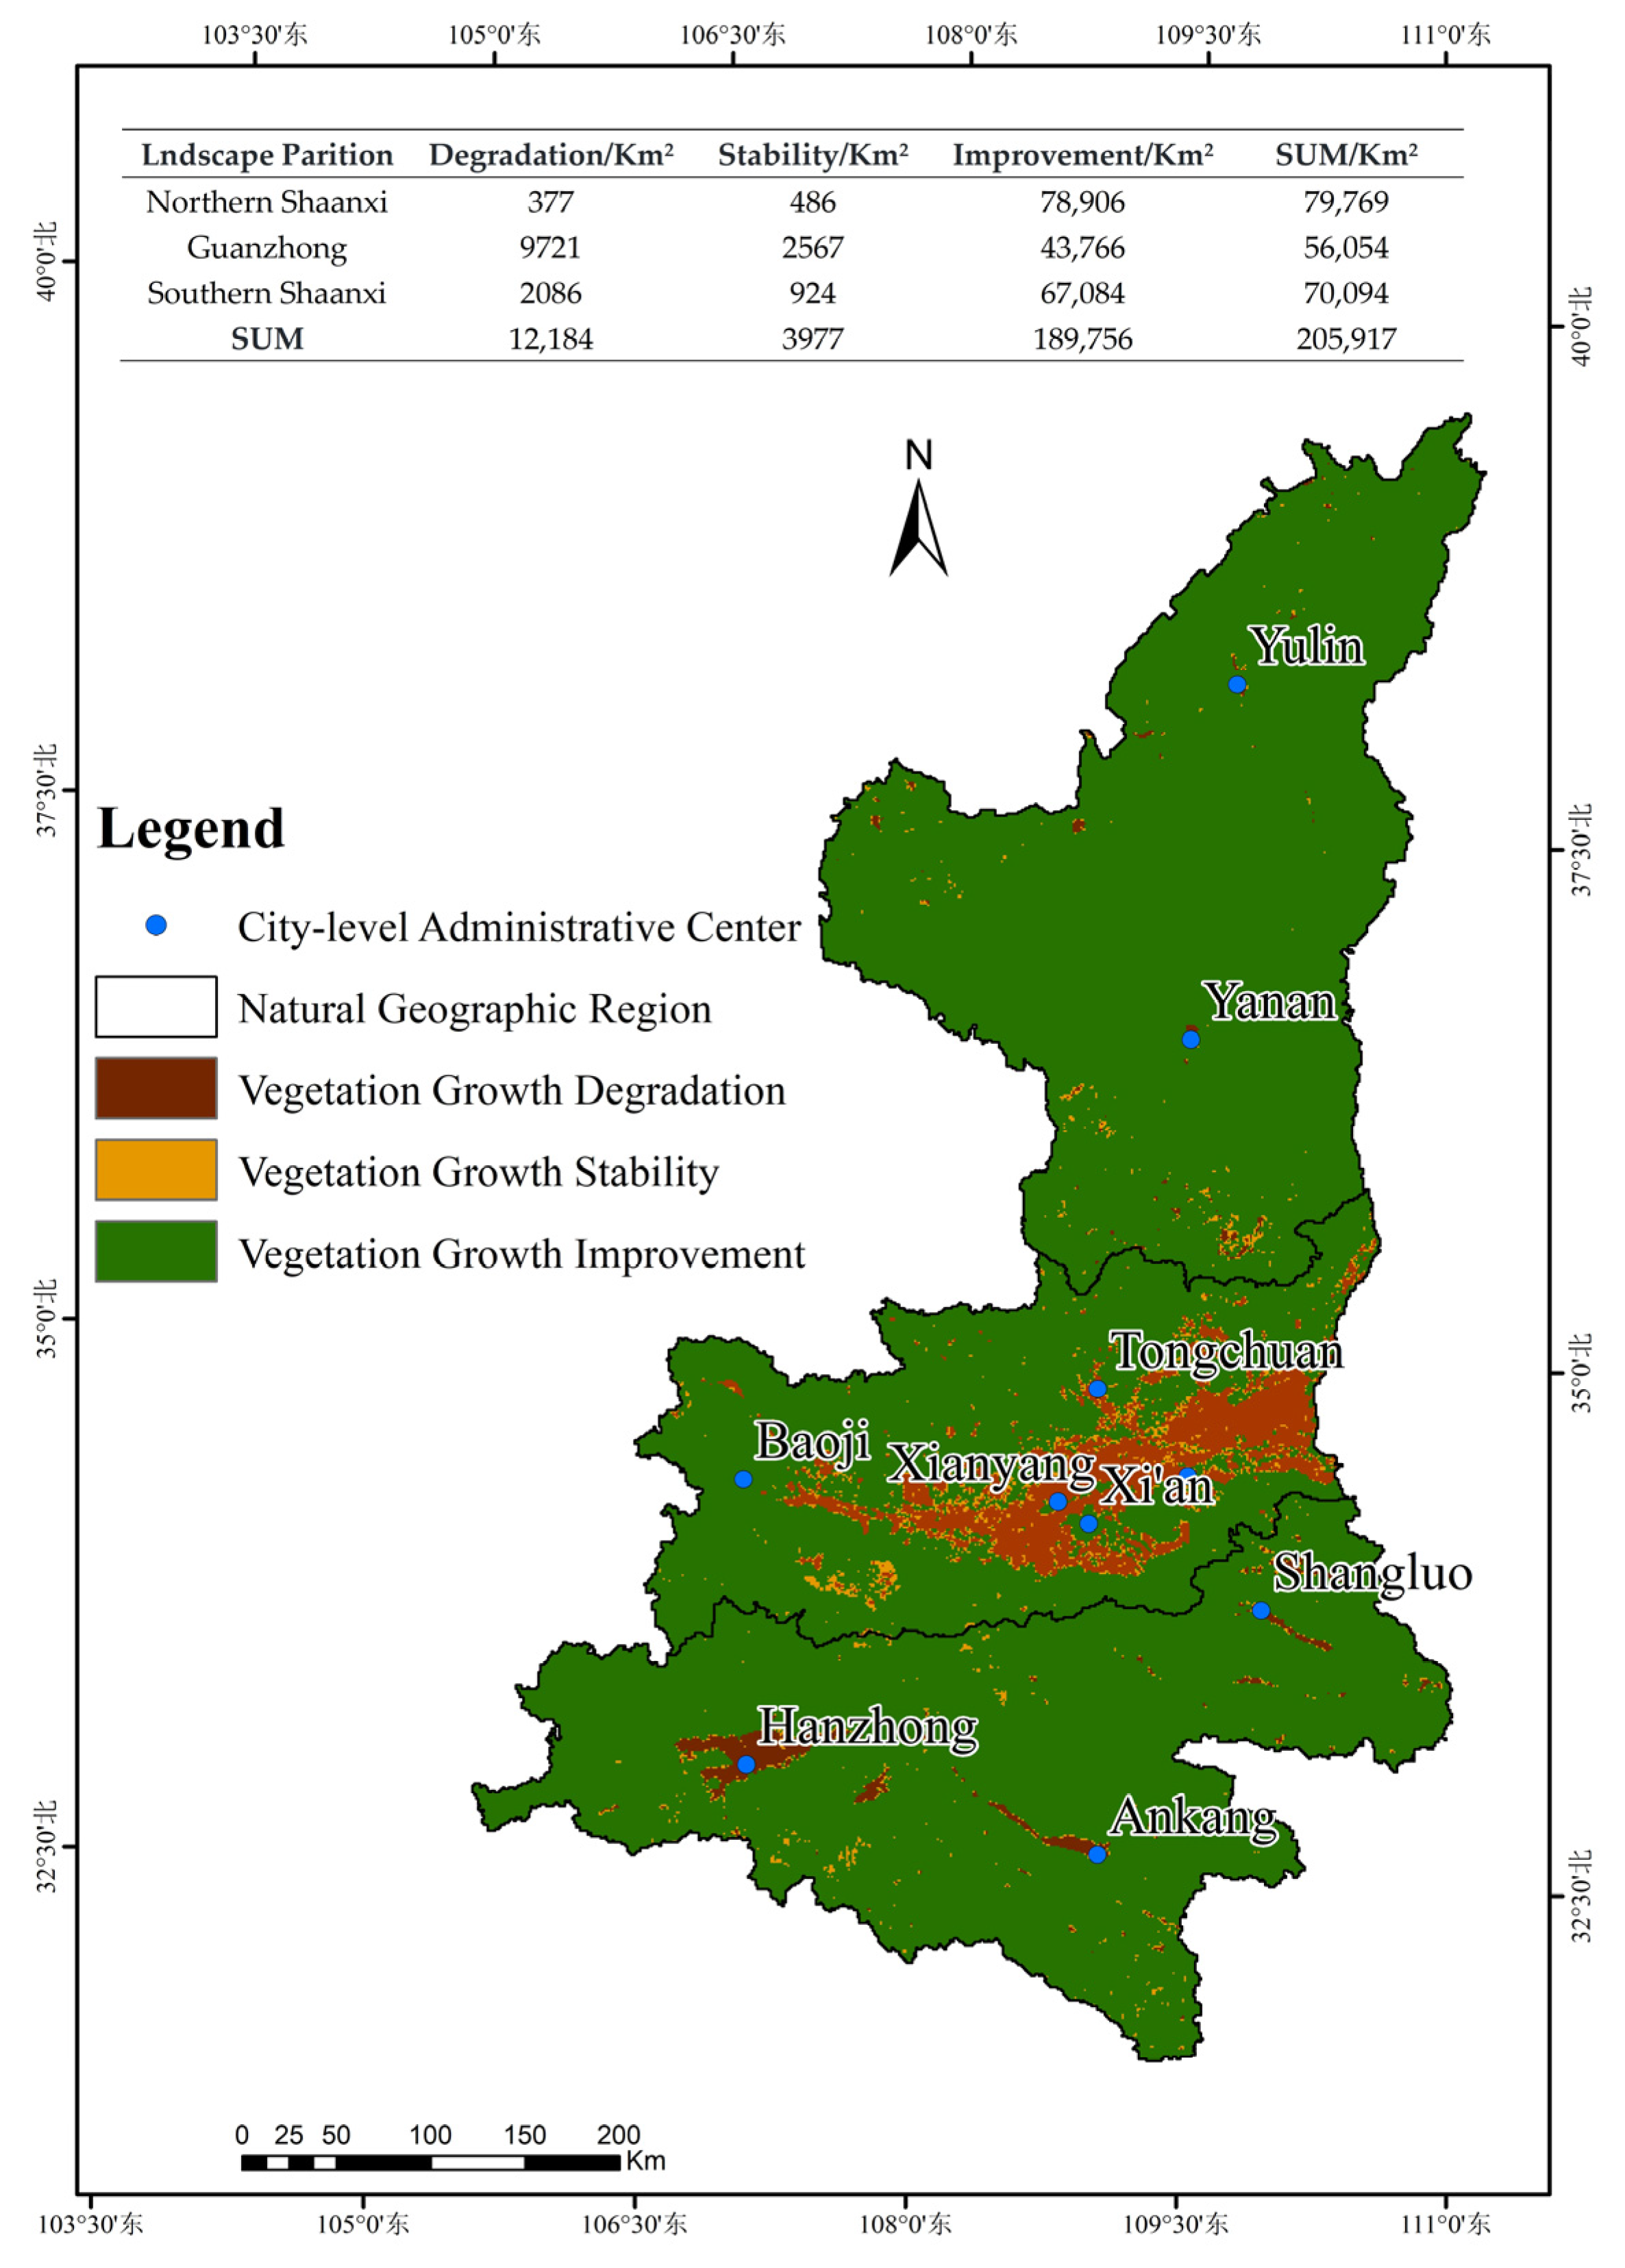
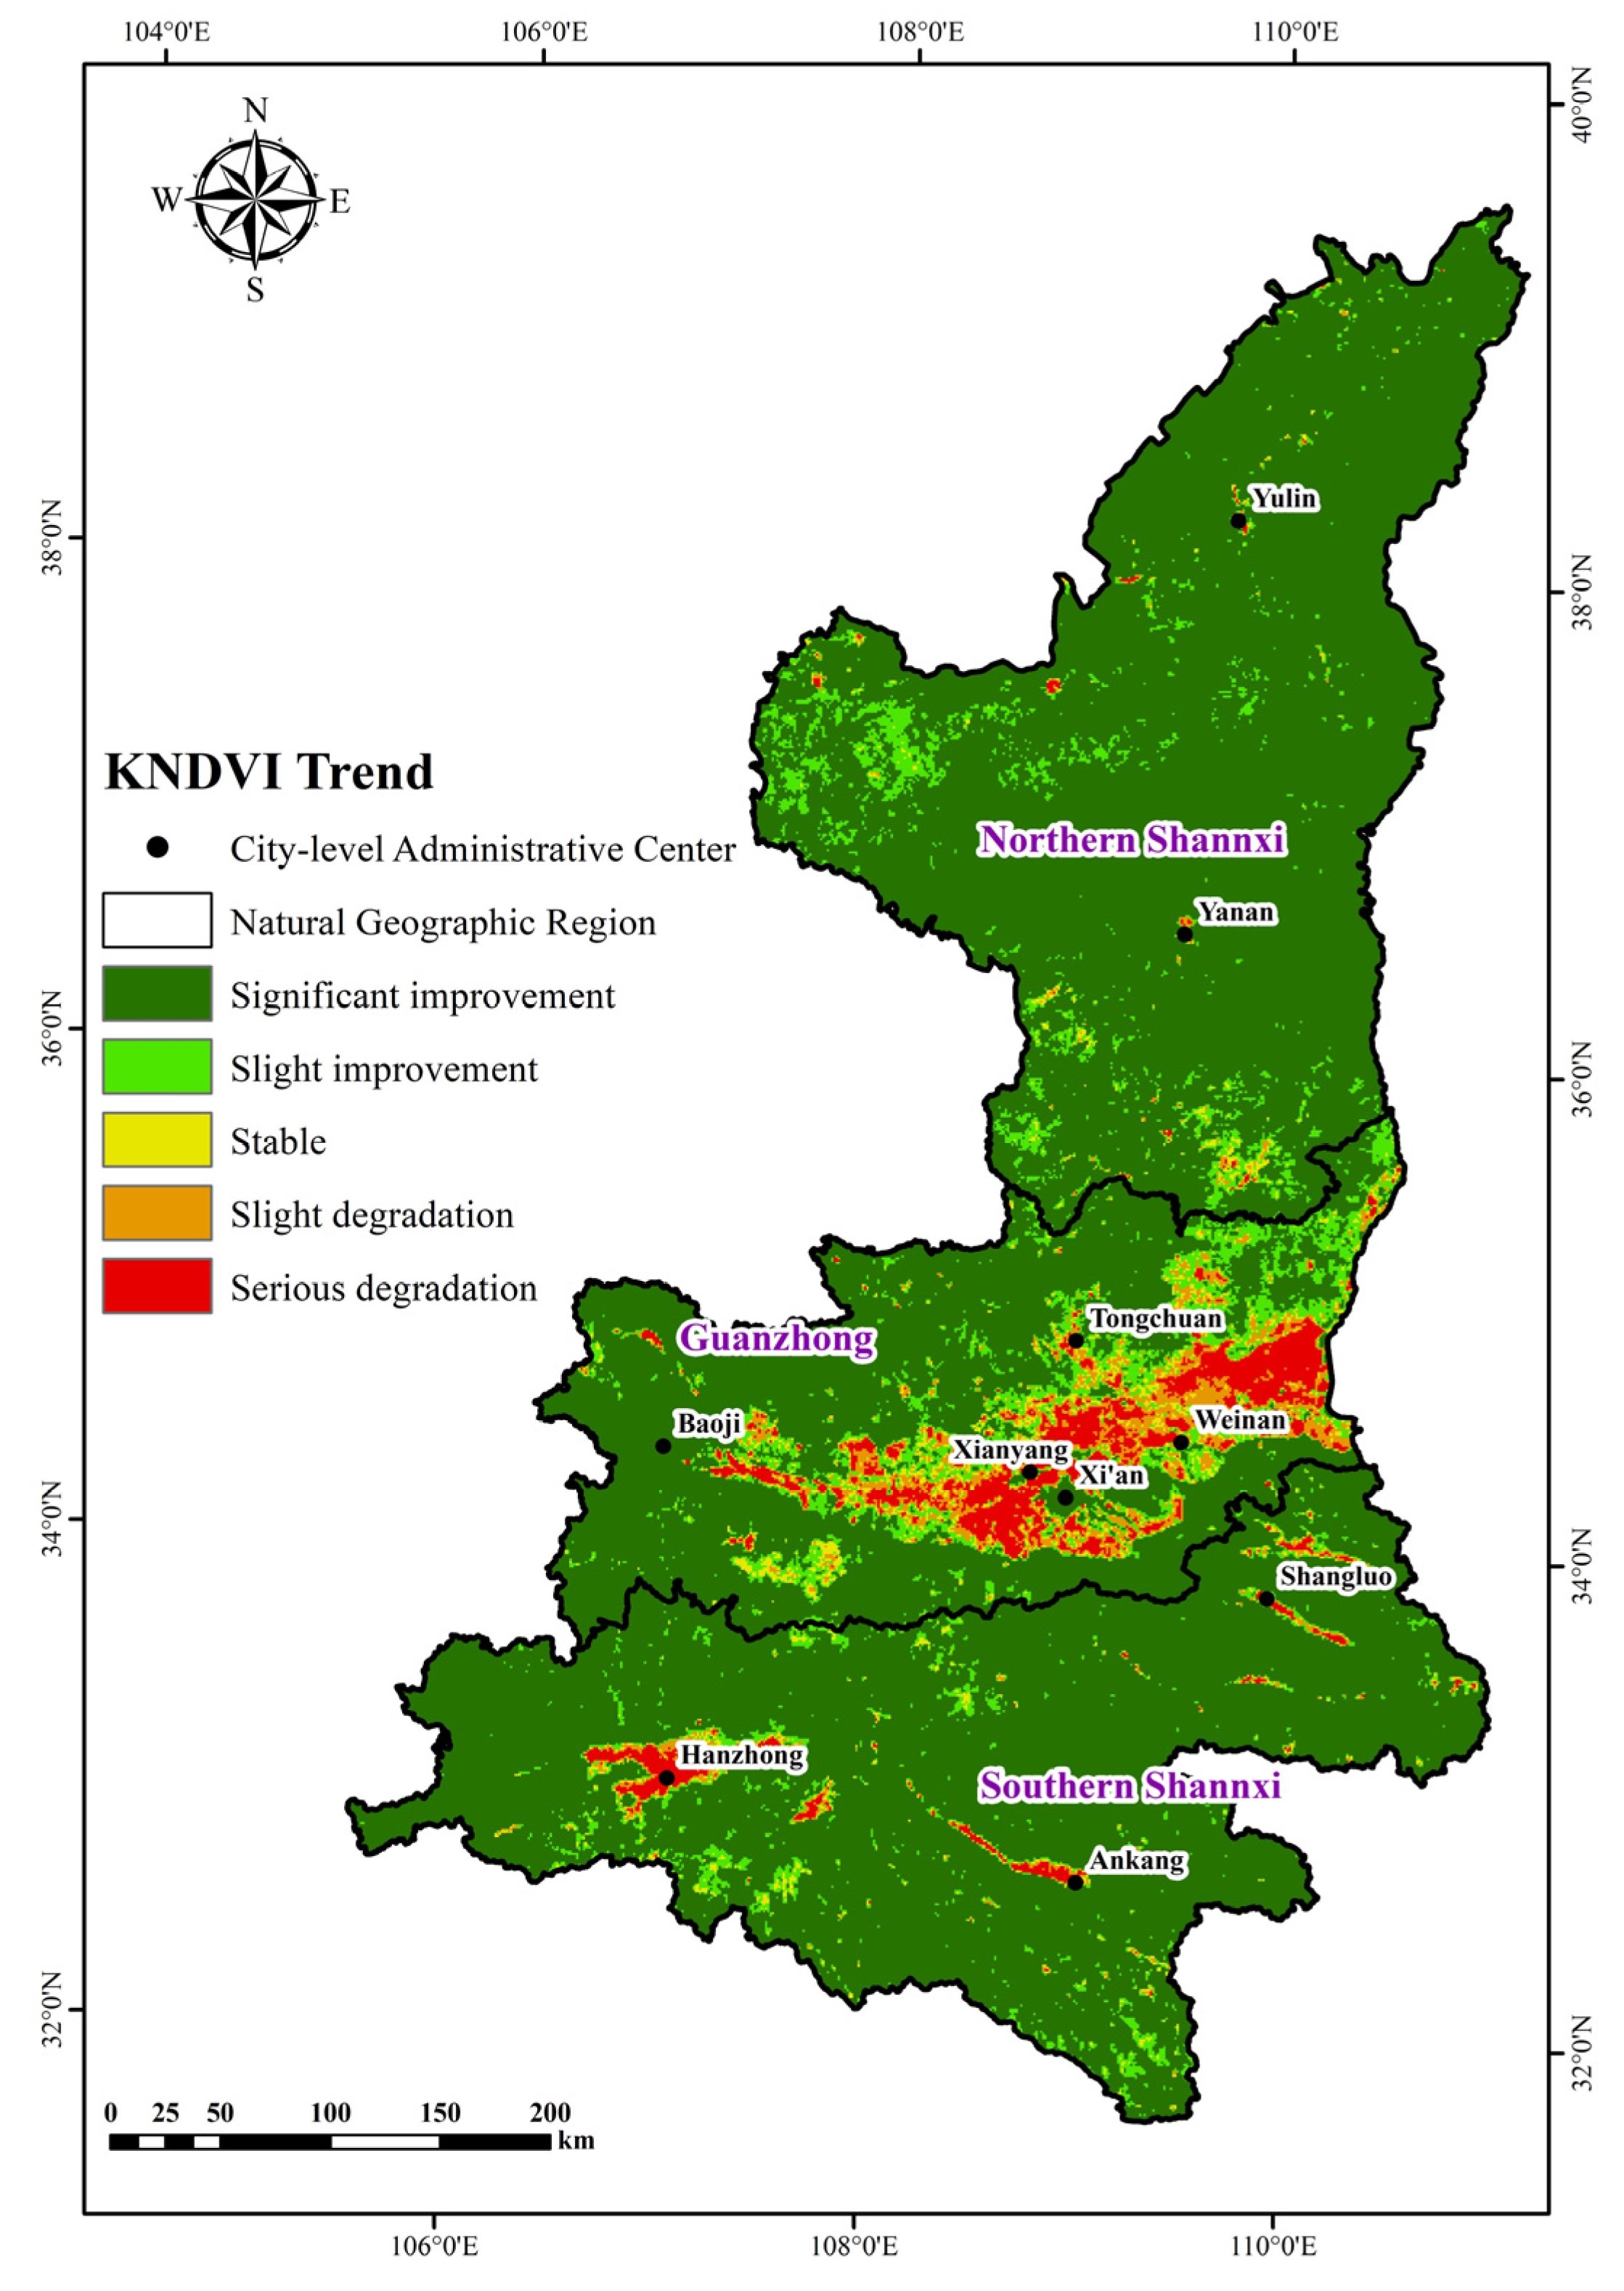
69]. According to this study, there is a general tendency toward improvement as the KNDVI values of the vegetation in Shaanxi Province steadily rise from north to south. Shaanxi’s northern region, which makes up 98.92% of the territory’s total land, has seen the greatest increase in vegetation. The southern region, which makes up 95.71% of the region’s total area, is next in line. Lastly, 78.08% of its land is made up of the Guanzhong region. The northern Shaanxi region has shown the greatest improvement in vegetation, which is in line with earlier research [70,71,72]. The primary factors impacting the development of vegetation are slope, evapotranspiration, precipitation, and land use. Shaanxi Province’s environment has become warmer and more humid over time, which might be good for the growth and recovery of vegetation [73,74,75,76].
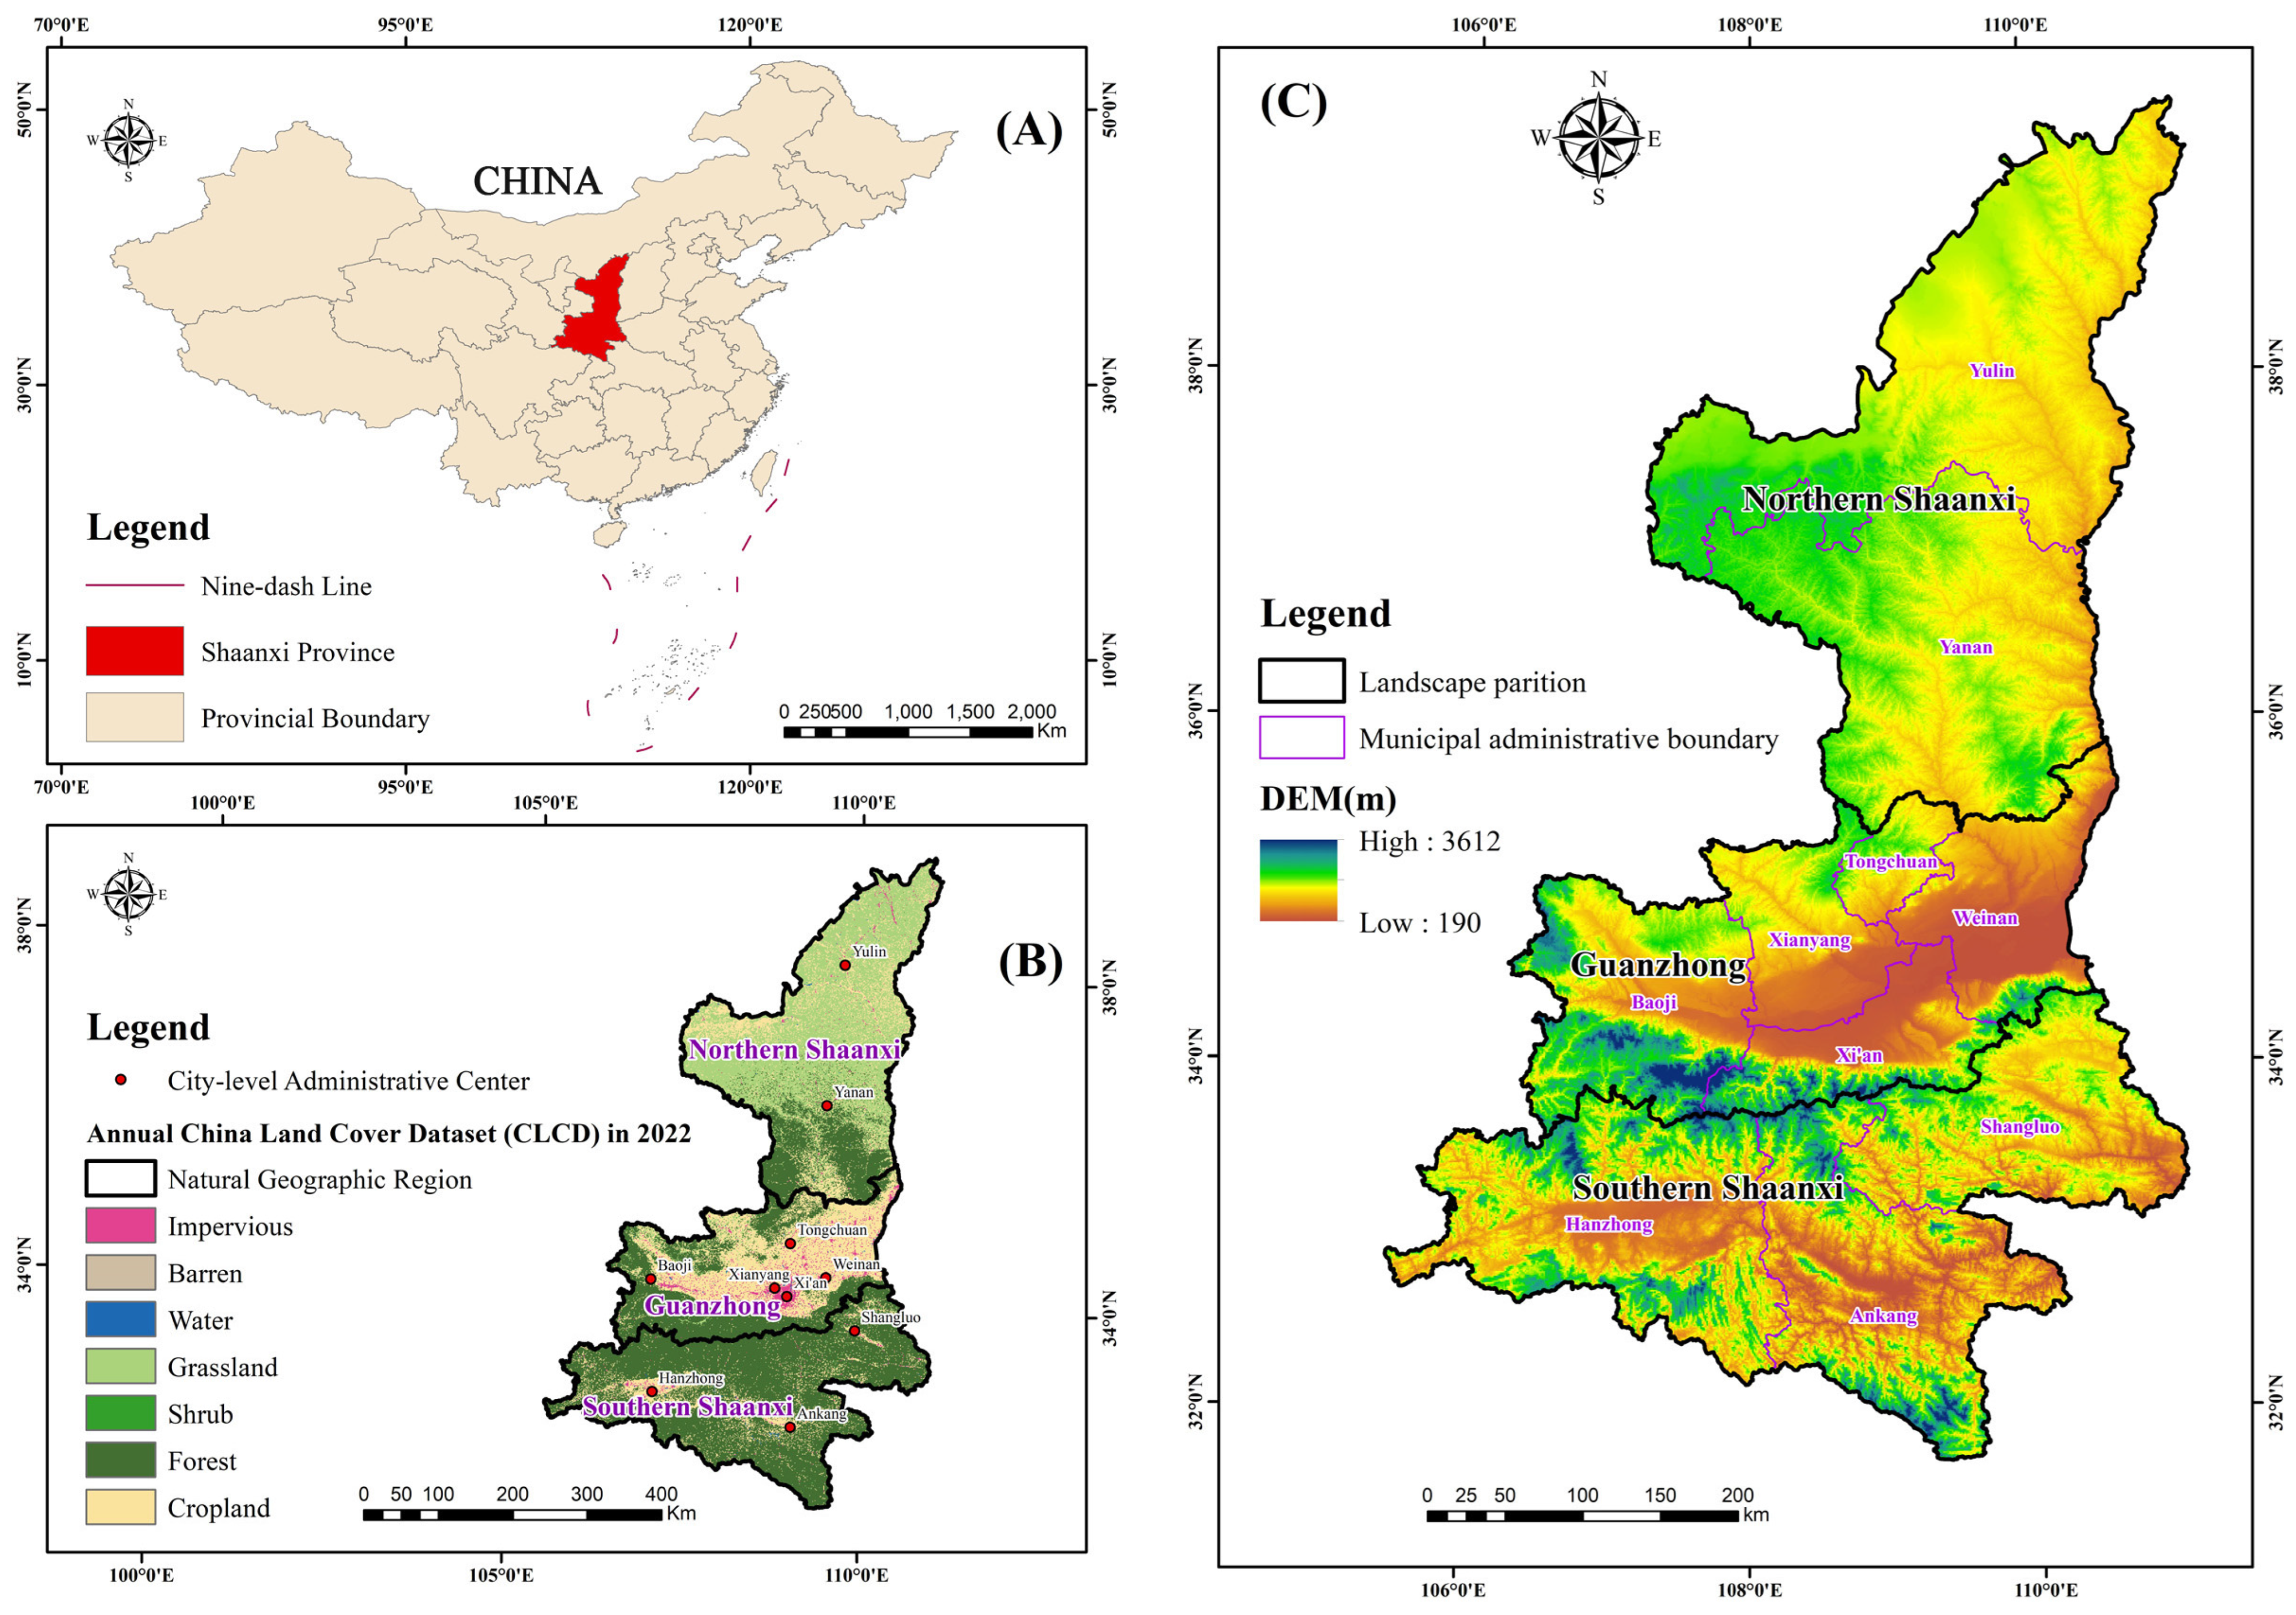
From 2003 to 2022, the areas in Shaanxi Province with higher KNDVI values are mainly located in high-altitude regions such as the Qinling Mountains. These areas have suitable temperatures, sufficient rainfall, low human activity intensity, predominantly forest vegetation types, strong resistance to natural disasters such as soil erosion, and good vegetation stability, exhibiting low fluctuation. Therefore, these areas exhibit high KNDVI values. The areas with lower vegetation KNDVI values are primarily located in urban areas with intensive human activities, such as the Guanzhong urban agglomeration, including cities such as Xi’an, Xianyang, and Baoji, or in environmentally harsh desertification areas, such as regions near the Mu Us Desert in northern Shaanxi.
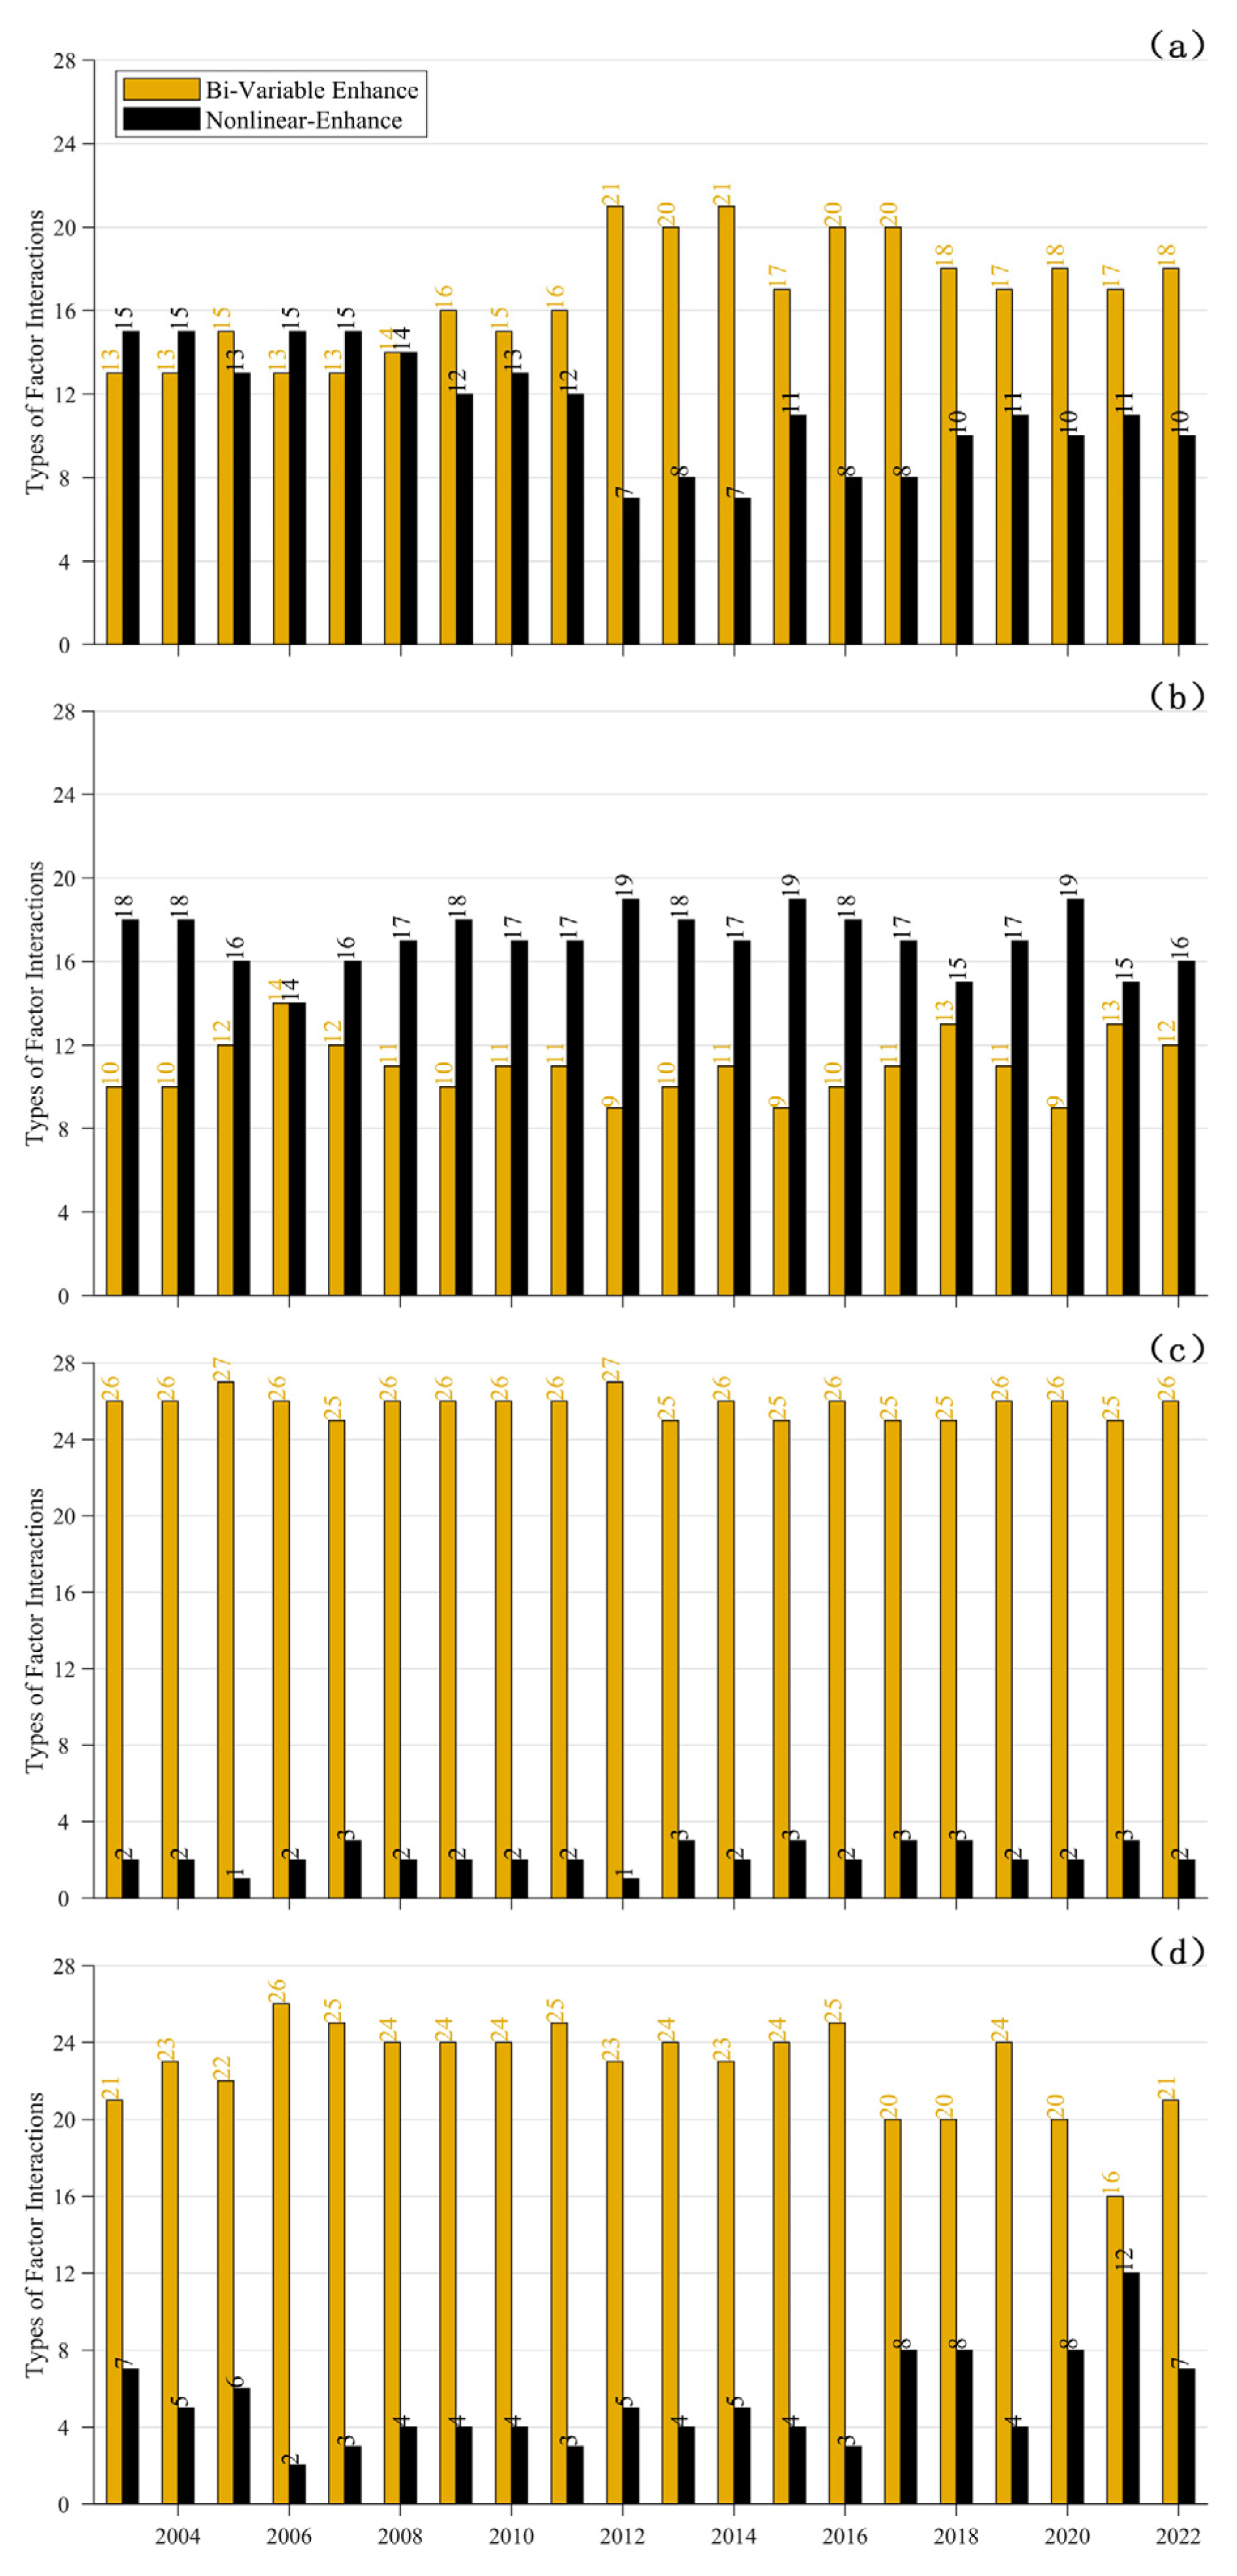
This work maps the findings of the interactions among numerous factors in Shaanxi Province, as shown in Figure S1 (see Supplementary Materials), in order to analyze the interactions between different factors in different years. With less noticeable interactions with elevation, slope, aspect, and population density, the figure shows a substantial association between land-use categories, yearly average precipitation, annual average evaporation, and annual average temperature. To elaborate, the association with other parameters like DEM, Slope, Aspect, and PD is less prominent, even if the correlation with CLCD, PRE, PRE, and TMP is strong. The strongest interacting factors for different years are summarized in Table 3.
Table 3 shows that TMP ∩ PET and PRE ∩ PET are the main interaction variables influencing the vegetation KNDVI variations in Shaanxi Province. Over the 20-year period, there were 6 years of interaction between annual precipitation and annual potential evapotranspiration, and 9 years of interaction between annual average temperature and annual potential evapotranspiration. The statement makes it abundantly evident that the research area’s plant KNDVI fluctuations are mostly caused by the local climate.
The climate conditions vary in different regions of Shaanxi Province, with significant differences in vegetation types. This results in noticeable variations in the influencing factors among different natural geographical zones. Therefore, an analysis of the influencing factors and driving forces of vegetation KNDVI changes in different geographical zones is conducted. Figure S2 (see Supplementary Materials) illustrates the interactions of influencing factors in different geographical zones from 2003 to 2022.
The land-use type (CLCD), elevation (DEM), annual average precipitation (PRE), annual average evapotranspiration (PRE), and annual average temperature (TMP) show rather substantial interactions with other affecting elements, as shown in Figure S2 (see Supplementary Materials). Conversely, the relationships between population density (PD), aspect (Aspect), and slope (Slope) are less strong. Table 4 provides a summary of the most influential elements for each year.
For the northern part of Shaanxi, the primary interacting factors affecting vegetation KNDVI changes are TMP ∩ PET and PRE ∩ PET. Over the 20-year period, there were 6 years of interaction between annual precipitation and annual potential evapotranspiration and 6 years of interaction between annual average temperature and annual potential evapotranspiration. This suggests that climatic conditions are the most significant driving force for vegetation KNDVI changes in the northern region.
The primary interacting elements affecting vegetation KNDVI changes in the Guanzhong area are DEM ∩ CLCD. There was 18 years of interaction between land-use type and elevation throughout the 20-year timeframe. This suggests that the main factors influencing plant KNDVI variations in the Guanzhong region are elevation and human activity.
The combination of elevation and land-use type was the largest interaction element during the 20-year period, with DEM ∩ CLCD being the key variables impacting vegetation KNDVI changes for the southern half of Shaanxi. This statement implies that elevation and human activity are the main drivers of vegetation KNDVI changes in the southern area.

5.3. Changes in Land Use and Their Effects on Vegetation KNDVI

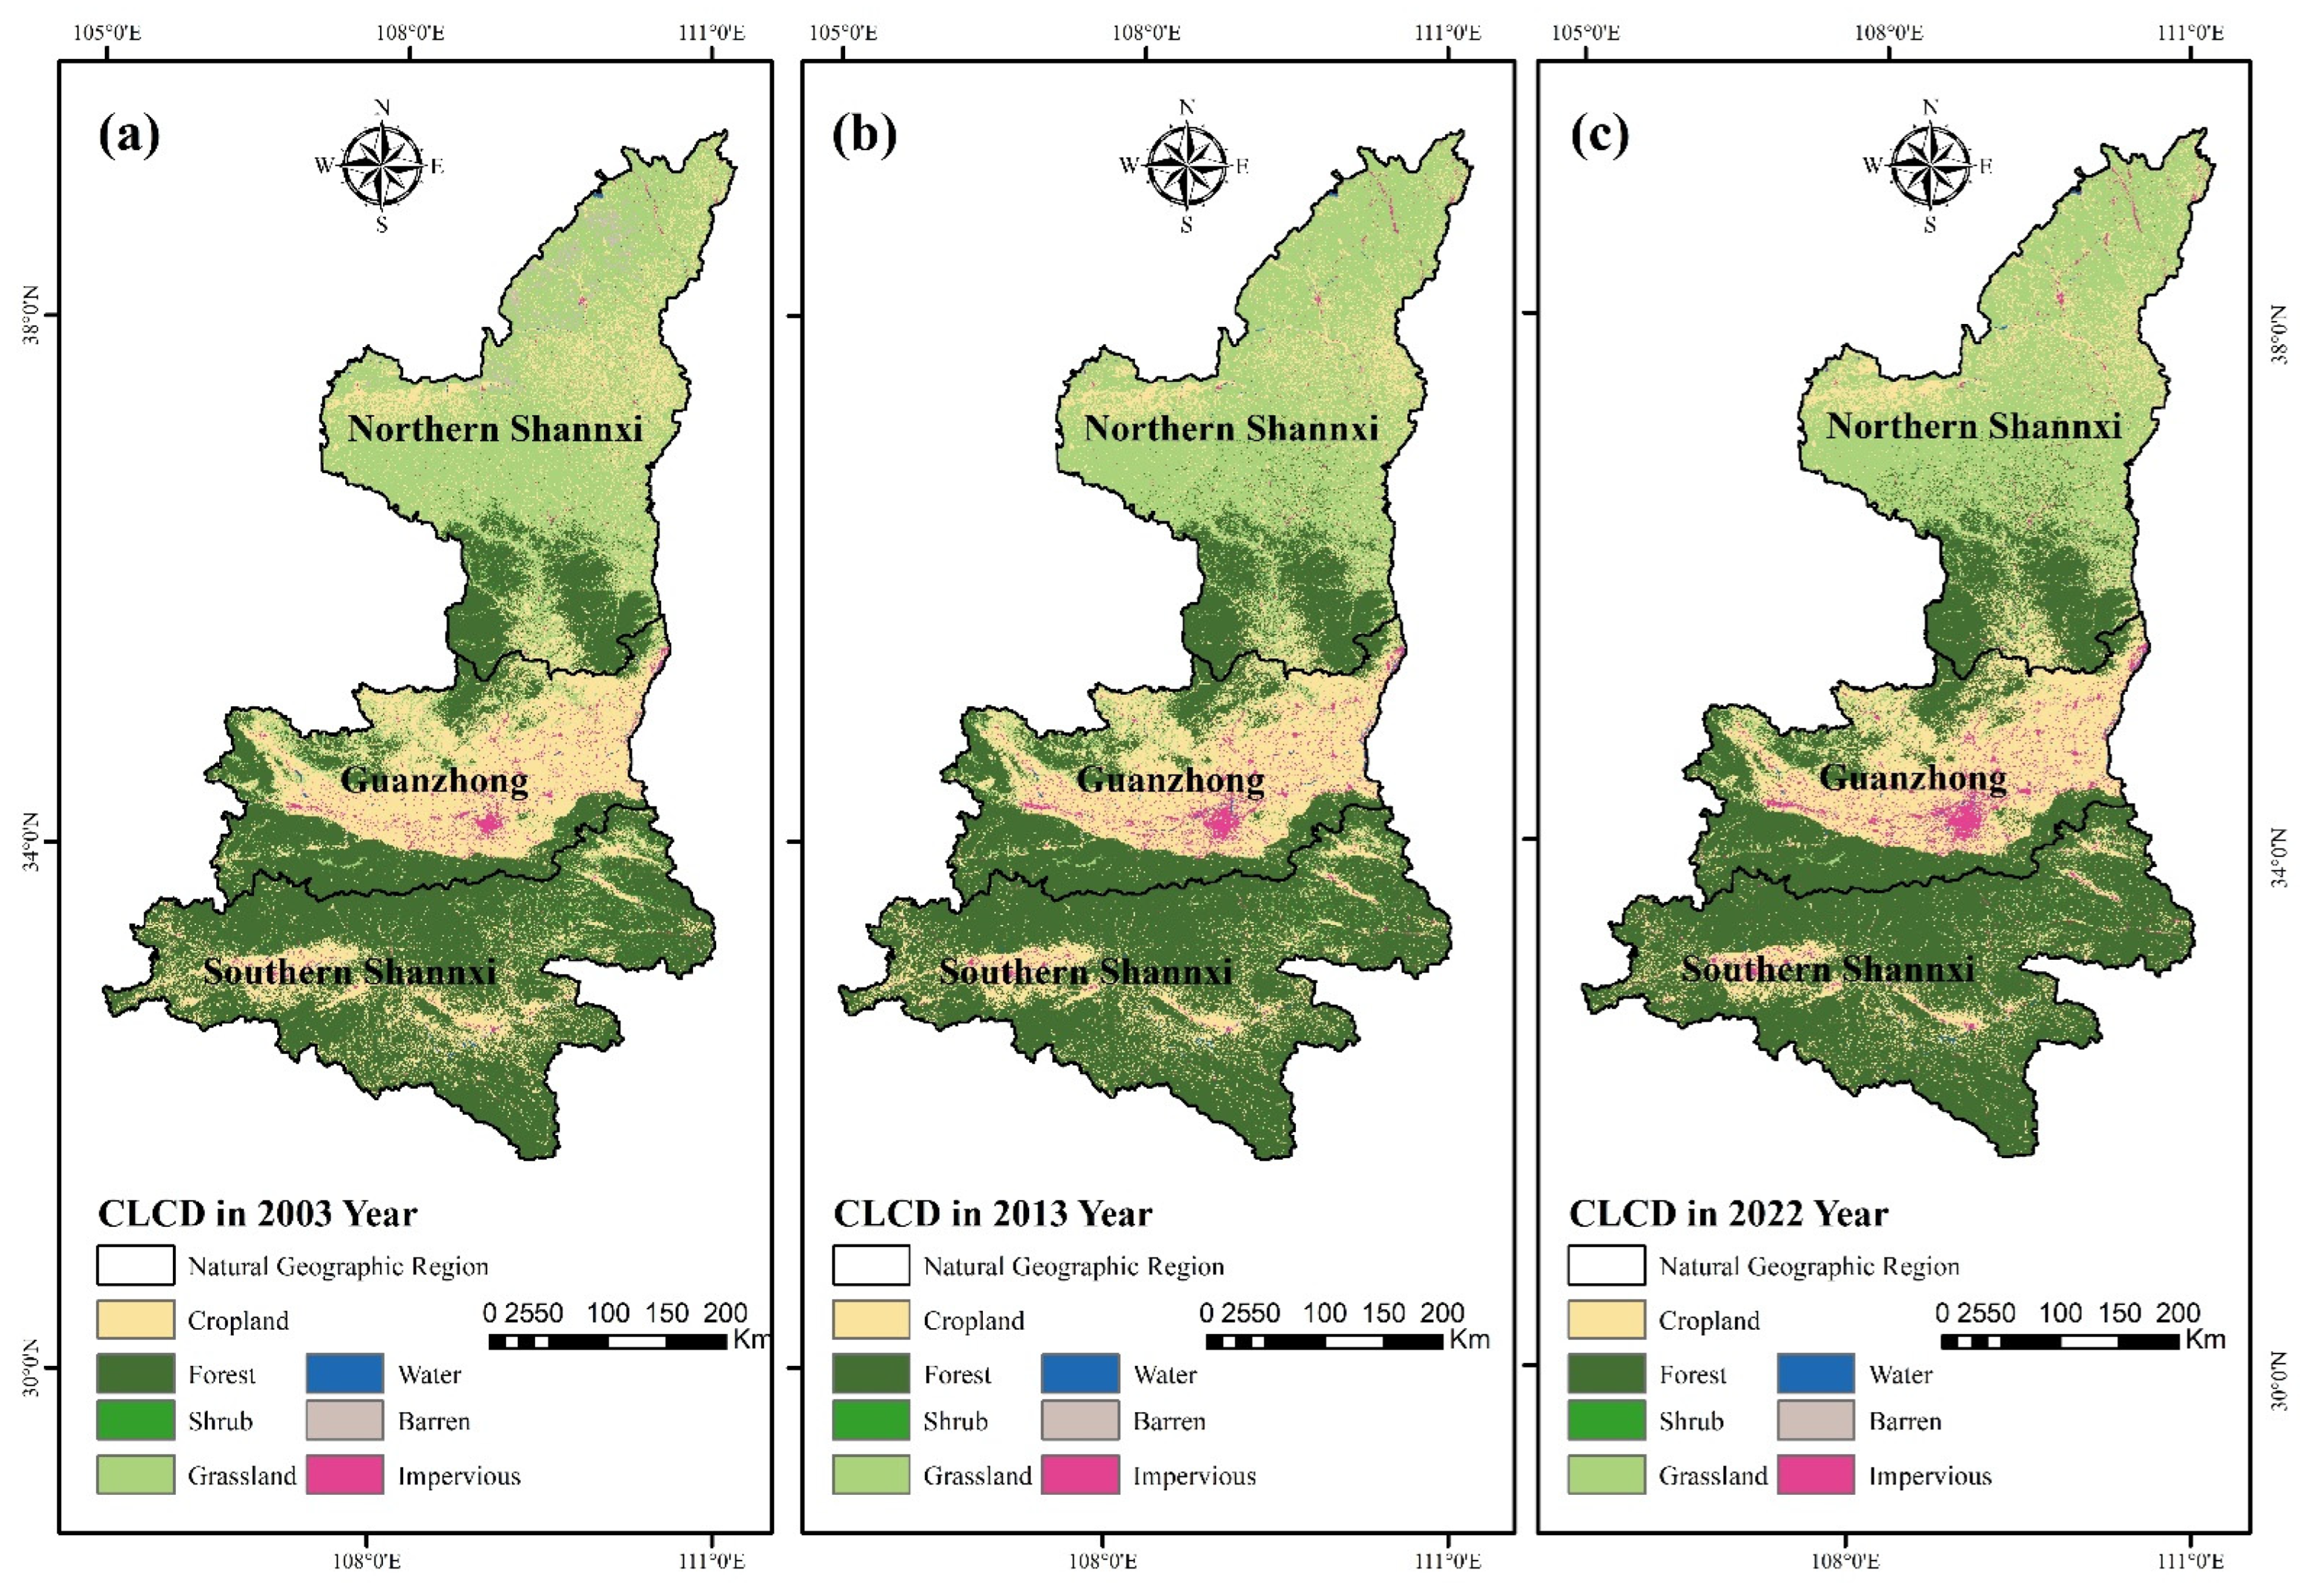
In order to investigate the effects of land-use changes in Shaanxi Province during the previous 20 years on vegetation KNDVI changes, this research used land-use data from the years 2003, 2013, and 2022 as the data source. The land cover scenario for the years 2019, 2020, and 2021 is shown in Figure 10.
Table 5 illustrates that, between 2003 and 2013, the greatest area of land in Shaanxi Province that was converted to other land uses was agricultural land, accounting for 24,881 km2. Of them, 11,371 km2 was the greatest area converted to grassland, making up 45.7% of the total area transformed in that category. At 90,339 km2, or 43.9% of the entire area, the province’s forest area was the greatest in 2013. The area covered by forests grew by 16,409 km2 in comparison to 2003. Table 6 presents an examination of land-use categories in Shaanxi Province from 2013 to 2022.
Table 6 shows that 8024 km2 was the largest amount of grassland in Shaanxi Province that was changed to other land-use categories between 2013 and 2022. Of all of them, 65.1% of the total conversion area fell into the group where the largest area was turned into cultivated land. With 95,145 km2 of forest covering 46.2% of the province’s total area in 2022, it was the largest in the province. The amount of forest land grew by 6119 km2 in comparison to 2013. According to the aforementioned conclusions, the province’s total forest covering has increased, which has raised vegetation KNDVI values in line with earlier research.
This article calculates the land-use transition matrix for the northern Shaanxi, Guanzhong, and southern Shaanxi areas from 2003 to 2022 in order to assess changes in land use in various geographical locations, as indicated in Table 7.
From 2003 to 2022, the northern Shaanxi region witnessed substantial land-use changes, notably the conversion of 8326 km2 of grassland to cultivated land, representing the largest transformation. By 2022, this region encompassed 48,728 km2 of grassland, constituting 61.1% of its total area.
Between 2003 and 2022, Guanzhong saw the most land-use type conversion area, which was the conversion of cultivated land to other land-use types. Of these, 2930 km2 accounted for 43.7% of the total conversion area in that category. This is connected to the Guanzhong region’s rising rate of urbanization and urban growth. With 48.1% of Guanzhong’s total area under cultivation in 2022, the Guanzhong region possessed the most amount of land.
From 2003 to 2022, the land-use type in southern Shaanxi that had the greatest area conversion was the conversion of cultivated land to other land uses, with 8298 km2 of that land changed to forest land, or 92.6% of the total area converted in that category. In 2022, the southern Shaanxi region possessed the most area of forest land, with 58,145 km2, or 83% of the region’s entire area.
In 2022, the total amount of vegetation, which included grassland, shrubland, and forests, was calculated for various geographic locations; 79.6%, 44.2%, and 83.7% of the total area in each region were represented by the areas for the northern Shaanxi, Guanzhong, and southern Shaanxi regions, which were 63,491 km2, 24,795 km2, and 58,684 km2, respectively. It is evident that different geographic locations have varying levels of plant covering, which results in various KNDVI values. In line with the earlier findings, the Guanzhong area has the lowest vegetation coverage, while the southern and northern Shaanxi regions have the greatest coverage.
The Guanzhong region’s densely populated urban cluster is seeing a notable growth rate in its urban regions due to the accelerating urbanization process. This expansion is accompanied by a notable rise in building land and a decrease in the area of existing agriculture. Both urban and rural regions see an increase in water demand when there is a concentration of people. The Guanzhong region’s vegetation covering is growing slowly, which is explained by the significant influence of human activity on this cover.
The Guanzhong area has seen tremendous expansion in both agricultural and industrial development throughout the last 20 years. The region’s vegetation sustainability has been significantly impacted by this development. Consequently, the explanation of the Guanzhong region’s vegetation sustainability will be the main goal of this research.
Firstly, the Guanzhong region’s vegetation cover has been trending downward as a result of increased industrial and agricultural activity. There is a decline in the amount of woodland and grassland regions as a result of the extensive land usage for farming and factory construction. As a result, the environment is under strain, endangering the preservation and protection of biodiversity. Numerous plant species have been harmed, upsetting the ecological equilibrium.
Second, both the survival and growth of plants have been adversely impacted by water contamination resulting from industrial and agricultural operations. Groundwater and surface water have been contaminated by the release of wastewater from factories and the use of chemical pesticides and fertilizers on agricultural land. This has tainted plant water supplies, limiting the development of the plants. Certain delicate plant species might not be able to withstand this environmental stress, which would cause their populations to decline or perhaps go extinct.
In addition, climate change has had an impact on the Guanzhong region’s capacity to sustain its flora. Changes in temperature and precipitation patterns brought forth by global warming might affect plant lifecycles and growth seasons. There might be a decline in the population of some plant species if they are unable to adjust to these changes.
Future population growth, economic expansion, and the resulting increased demand for land and water resources might present the Guanzhong area with ever-greater issues. These elements may make water pollution and deforestation worse. The viability of the vegetation may also be further jeopardized by worsening climate change, which might expose the area to increasingly frequent and severe extreme weather events such as floods and droughts. The area’s capacity to preserve its vegetation has been weakened throughout the last 20 years of rapid industrial and agricultural growth. Reduced vegetation covering and the adverse impacts of water pollution and climate change on plant development and survival are possible outcomes. Implementing sustainable agriculture techniques, strengthening land conservation initiatives, and raising environmental awareness are all necessary to address these problems.

6. Conclusions

While certain localized locations in Shaanxi Province are showing a deteriorating trend, overall, the province’s vegetation covering is improving: 92.15% of the entire area, or 189,756 km2, is covered by the enhanced vegetation growth area; 3977 km2, or 1.93% of the total area, are covered by areas with steady vegetation growth; while 12,184 km2, or 5.92% of the total area, are covered by areas with falling vegetation growth. This research shows that although plant growth has improved over a large region of the province, there has been a dramatic decrease in vegetation cover in a smaller but important area.
The types of interaction factors include two categories: bivariate enhancement and nonlinear enhancement. The main interactive factors affecting the variation of vegetation k-NDVI in Shaanxi Province are TMP∩PET and PRE∩PET. Climatic conditions serve as the primary driving force for the variation of vegetation k-NDVI in Shaanxi Province.

Supplementary Materials

The following supporting information can be downloaded at: https://www.mdpi.com/article/10.3390/su152316468/s1.

Author Contributions

Conceptualization, M.S.; methodology, M.S. and X.J.; software, F.L.; validation, M.S.; formal analysis, M.S. and F.L.; investigation, F.L.; resources, Y.H.; data curation, X.J.; writing—original draft preparation, M.S.; writing—review and editing, F.L., Y.S. and X.J. visualization, B.L., J.Q. and M.W.; supervision, Y.H.; project administration, Y.H.; funding acquisition, Y.H. All authors have read and agreed to the published version of the manuscript.

Funding

This research was funded by National Key Research and Development Program (grant number 2021YFD2000200), Agricultural non-point source pollution control and supervision guidance project in Feidong County (grant number GH20230401), and National Natural Science Foundation of China (grant number 42171394).

Institutional Review Board Statement

Not applicable.

Informed Consent Statement

Not applicable.

Data Availability Statement

No new data were created or analyzed in this study. Data sharing is not applicable to this article.

Acknowledgments

We would like to extend our sincere thanks to Yitong Qin of Sun Yat-sen University. The authors thanks him for guidance and assistance in code writing.

Conflicts of Interest

The authors declare no conflict of interest.

References

  1. Verrall, B.; Pickering, C.M. Alpine vegetation in the context of climate change: A global review of past research and future directions. Sci. Total Environ. 2020, 748, 141344. [Google Scholar] [CrossRef]
  2. Li, Z.; Chen, Y.; Li, W.; Deng, H.; Fang, G. Potential impacts of climate change on vegetation dynamics in Central Asia. J. Geophys. Res. Atmos. 2015, 120, 12345–12356. [Google Scholar] [CrossRef]
  3. Jiang, L.; Jiapaer, G.; Bao, A.; Guo, H.; Ndayisaba, F. Vegetation dynamics and responses to climate change and human activities in Central Asia. Sci. Total Environ. 2017, 599, 967–980. [Google Scholar] [CrossRef]
  4. Kidane, Y.; Stahlmann, R.; Beierkuhnlein, C. Vegetation dynamics, and land use and land cover change in the Bale Mountains, Ethiopia. Environ. Monit. Assess. 2012, 184, 7473–7489. [Google Scholar] [CrossRef]
  5. Walsh, S.J.; Moody, A.; Allen, T.R.; Brown, D.G. Scale dependence of NDVI and its relationship to mountainous terrain. In Scale in Remote Sensing and GIS; Routledge: London, UK, 2023; pp. 27–55. [Google Scholar]
  6. Hendricks, A.S.; Bhatt, U.S.; Frost, G.V.; Walker, D.A.; Bieniek, P.A.; Raynolds, M.K.; Lader, R.T.; Epstein, H.E.; Pinzon, J.E.; Tucker, C.J.; et al. Decadal variability in spring sea-ice concentration linked to summer temperature and NDVI on the Yukon-Kuskokwim Delta. Earth Interact. 2023, 27, e230002. [Google Scholar] [CrossRef]
  7. Anuar, N.I.; Khalid, N.; Tahar, K.N.; Othman, A.N. Analyze the Relationship between Aboveground Biomass and NDVI Values Derived from UAV Multispectral Imagery. In Proceedings of the IOP Conference Series: Earth and Environmental Science, Al Diwaniyah, Iraq, 17–18 May 2023; IOP Publishing: Bristol, UK, 2023; Volume 1240, p. 012015. [Google Scholar]
  8. Furlanetto, J.; Dal Ferro, N.; Longo, M.; Sartori, L.; Polese, R.; Caceffo, D.; Nicoli, L.; Morari, F. LAI estimation through remotely sensed NDVI following hail defoliation in maize (Zea mays L.) using Sentinel-2 and UAV imagery. Precision Agric. 2023, 24, 1355–1379. [Google Scholar] [CrossRef]
  9. Zhang, R.; Zhou, Y.; Hu, T.; Sun, W.; Zhang, S.; Wu, J.; Wang, H. Detecting the Spatiotemporal Variation of Vegetation Phenology in Northeastern China Based on MODIS NDVI and Solar-Induced Chlorophyll Fluorescence Dataset. Sustainability 2023, 15, 6012. [Google Scholar] [CrossRef]
  10. Wang, Q.; Moreno-Martínez, Á.; Muñoz-Marí, J.; Campos-Taberner, M.; Camps-Valls, G. Estimation of vegetation traits with kernel NDVI. ISPRS J. Photogramm. Remote Sens. 2023, 195, 408–417. [Google Scholar] [CrossRef]
  11. Beck, P.S.A.; Atzberger, C.; Høgda, K.A.; Johansen, B.; Skidmore, A.K. Improved monitoring of vegetation dynamics at very high latitudes: A new method using MODIS NDVI. Remote Sens. Environ. 2006, 100, 321–334. [Google Scholar] [CrossRef]
  12. Pettorelli, N.; Vik, J.O.; Mysterud, A.; Gaillard, J.M.; Tucker, C.J.; Stenseth, N.C. Using the satellite-derived NDVI to assess ecological responses to environmental change. Trends Ecol. Evol. 2005, 20, 503–510. [Google Scholar] [CrossRef] [PubMed]
  13. Zhu, G.; Zhao, C.; Tong, S.; Zhu, W. Response of vegetation dynamic change to multi-scale drought stress in the high-latitude Nenjiang River basin in China. Front. Ecol. Evol. 2022, 10, 1074199. [Google Scholar] [CrossRef]
  14. Carvalho, R.; de Aguiar, A.P.D.; Amaral, S. Diversity of cattle raising systems and its effects over forest regrowth in a core region of cattle production in the Brazilian Amazon. Reg. Environ. Change 2020, 20, 1–15. [Google Scholar] [CrossRef]
  15. Peng, W.; Kuang, T.; Tao, S. Quantifying influences of natural factors on vegetation NDVI changes based on geographical detector in Sichuan, western China. J. Clean. Prod. 2019, 233, 353–367. [Google Scholar] [CrossRef]
  16. Zhao, H.; Gu, B.; Lindley, S.; Zhu, T. Regulation factors driving vegetation changes in China during the past 20 years. J. Geogr. Sci. 2023, 33, 508–528. [Google Scholar] [CrossRef]
  17. Guo, B.; Liu, Y.; Fan, J.; Lu, M.; Zang, W.; Liu, C.; Wang, B.; Huang, X.; Lai, J.; Wu, H. The salinization process and its response to the combined processes of climate change–human activity in the Yellow River Delta between 1984 and 2022. Catena 2023, 231, 107301. [Google Scholar] [CrossRef]
  18. Wang, F.; Liu, J.; Fu, T.; Gao, H.; Qi, F. Spatial-Temporal Variations in of Soil Conservation Service and Its Influencing Factors under the Background of Ecological Engineering in the Taihang Mountain Area, China. Int. J. Environ. Res. Public Health 2023, 20, 3427. [Google Scholar] [CrossRef]
  19. Zhou, L.; Tucker, C.J.; Kaufmann, R.K.; Slayback, D.; Shabanov, N.V.; Myneni, R.B. Variations in northern vegetation activity inferred from satellite data of vegetation index during 1981 to 1999. J. Geophys. Res. Atmos. 2001, 106, 20069–20083. [Google Scholar] [CrossRef]
  20. Suzuki, R.; Masuda, K.; Dye, D.G. Interannual covariability between actual evapotranspiration and PAL and GIMMS NDVIs of northern Asia. Remote Sens. Environ. 2007, 106, 387–398. [Google Scholar] [CrossRef]
  21. Ma, H.; Zhang, L.; Wei, X.; Shi, T.; Chen, T. Spatio-temporal changes in land use and vegetation cover in the Southwest region of China from 2000 to 2015. Chin. J. Appl. Ecol. 2021, 32, 618–628. [Google Scholar]
  22. Wang, J.; Wang, K.; Zhang, M.; Zhang, C. Impacts of climate change and human activities on vegetation cover in hilly southern China. Ecol. Eng. 2015, 81, 451–461. [Google Scholar] [CrossRef]
  23. Maeda, E.E.; Pellikka, P.K.E.; Siljander, M.; Clark, B.J.F. Potential impacts of agricultural expansion and climate change on soil erosion in the Eastern Arc Mountains of Kenya. Geomorphology 2010, 123, 279–289. [Google Scholar] [CrossRef]
  24. Nunes, A.N.; De Almeida, A.C.; Coelho, C.O.A. Impacts of land use and cover type on runoff and soil erosion in a marginal area of Portugal. Appl. Geogr. 2011, 31, 687–699. [Google Scholar] [CrossRef]
  25. Fang, L.; Wang, L.; Chen, W.; Jia, S.; Cao, Q.; Wang, S.; Wang, L. Identifying the impacts of natural and human factors on ecosystem service in the Yangtze and Yellow River Basins. J. Clean. Prod. 2021, 314, 127995. [Google Scholar] [CrossRef]
  26. Zhu, L.; Meng, J.; Zhu, L. Applying Geodetector to disentangle the contributions of natural and anthropogenic factors to NDVI variations in the middle reaches of the Heihe River Basin. Ecol. Indic. 2020, 117, 106545. [Google Scholar] [CrossRef]
  27. Quillet, A.; Peng, C.; Garneau, M. Toward dynamic global vegetation models for simulating vegetation–climate interactions and feedbacks: Recent developments, limitations, and future challenges. Environ. Rev. 2010, 18, 333–353. [Google Scholar] [CrossRef]
  28. Wang, J.; Xu, C. Geographical Detectors: Principles and Prospects. Acta Geogr. Sin. 2017, 72, 116–134. [Google Scholar]
  29. Solly, B.; Jarju, A.M.; Sonko, E.; Yaffa, S.; Sawaneh, M.; Jarju, A. Detection of recent changes in Gambia vegetation cover using time series MODIS NDVI. BELGEO 2021, 2021, 1–14. [Google Scholar] [CrossRef]
  30. Dong, Y.; Yin, D.; Li, X.; Huang, J.; Su, W.; Li, X.; Wang, H. Spatial–temporal evolution of vegetation NDVI in association with climatic, environmental and anthropogenic factors in the loess plateau, China during 2000–2015: Quantitative analysis based on geographical detector model. Remote Sens. 2021, 13, 4380. [Google Scholar] [CrossRef]
  31. Yan, L.; He, R.; Kašanin-Grubin, M.; Luo, G.; Peng, H.; Qiu, J. The dynamic change of vegetation cover and associated driving forces in Nanxiong Basin, China. Sustainability 2017, 9, 443. [Google Scholar] [CrossRef]
  32. Meng, N.; Wang, N.; Cheng, H.; Liu, X.; Niu, Z. Impacts of climate change and anthropogenic activities on the normalized difference vegetation index of desertified areas in northern China. J. Geogr. Sci. 2023, 33, 483–507. [Google Scholar] [CrossRef]
  33. Cao, Z.; Li, Y.; Liu, Y.; Chen, Y.; Wang, Y. When and where did the Loess Plateau turn “green”? Analysis of the tendency and breakpoints of the normalized difference vegetation index. Land Degrad. Dev. 2018, 29, 162–175. [Google Scholar] [CrossRef]
  34. Yao, B.; Ma, L.; Si, H.; Li, S.; Gong, X.; Wang, X. Spatial Pattern of Changing Vegetation Dynamics and Its Driving Factors across the Yangtze River Basin in Chongqing: A Geodetector-Based Study. Land 2023, 12, 269. [Google Scholar] [CrossRef]
  35. Pei, H.; Zhao, Y.; Zhang, T. Spatial and temporal patterns and driving forces of Net Ecosystem Productivity (NEP) on the Loess Plateau from 2000 to 2020. Arid. Zone Res. 2023, 1–14. Available online: https://link.cnki.net/urlid/65.1095.X.20231016.1736.004 (accessed on 1 November 2023).
  36. Zhao, Q.; Yu, L.; Li, X.; Peng, D.; Zhang, Y.; Gong, P. Progress and trends in the application of Google Earth and Google Earth Engine. Remote Sens. 2021, 13, 3778. [Google Scholar] [CrossRef]
  37. Yang, J.; Huang, X. The 30 m annual land cover dataset and its dynamics in China from 1990 to 2019. Earth Syst. Sci. Data 2021, 13, 3907–3925. [Google Scholar] [CrossRef]
  38. Gao, S.; Zhong, R.; Yan, K.; Ma, X.; Chen, X.; Pu, J.; Gao, S.; Qi, J.; Myneni, R.B. Evaluating the saturation effect of vegetation indices in forests using 3D radiative transfer simulations and satellite observations. Remote Sens. Environ. 2023, 295, 113665. [Google Scholar] [CrossRef]
  39. Wang, R.; Gamon, J.A.; Emmerton, C.A.; Springer, K.R.; Yu, R.; Hmimina, G. Detecting intra- and inter-annual variability in gross primary productivity of a North American grassland using MODIS MAIAC data. Agric. For. Meteorol. 2020, 281, 107859. [Google Scholar] [CrossRef]
  40. Camps-Valls, G.; Campos-Taberner, M.; Moreno-Martínez, Á.; Walther, S.; Duveiller, G.; Cescatti, A.; Mahecha, M.D.; MarÍ, J.M.; GarcÍa-haro, F.J.; Running, S.W.; et al. A unified vegetation index for quantifying the terrestrial biosphere. Sci. Adv. 2021, 7, eabc7447. [Google Scholar] [CrossRef]
  41. Zhang, S.; Zhou, Y.; Yu, Y.; Li, F.; Zhang, R.; Li, W. Using the Geodetector Method to Characterize the Spatiotemporal Dynamics of Vegetation and Its Interaction with Environmental Factors in the Qinba Mountains, China. Remote Sens. 2022, 14, 5794. [Google Scholar] [CrossRef]
  42. Shi, S.; Wang, X.; Hu, Z.; Zhao, X.; Zhang, S.; Hou, M.; Zhang, N. Geographic detector-based quantitative assessment enhances attribution analysis of climate and topography factors to vegetation variation for spatial heterogeneity and coupling. Glob. Ecol. Conserv. 2023, 42, e02398. [Google Scholar] [CrossRef]
  43. Shen, F.; Yang, L.; Zhang, L.; Guo, M.; Huang, H.; Zhou, C. Quantifying the direct effects of long-term dynamic land use intensity on vegetation change and its interacted effects with economic development and climate change in jiangsu, China. J. Environ. Manag. 2023, 325, 116562. [Google Scholar] [CrossRef] [PubMed]
  44. Assede, E.S.P.; Orou, H.; Biaou, S.S.H.; Geldenhuys, C.J.; Ahononga, F.C.; Chirwa, P.W. Understanding drivers of land use and land cover change in Africa: A review. Curr. Landsc. Ecol. Rep. 2023, 1–11. [Google Scholar] [CrossRef]
  45. Penny, J.; Ordens, C.M.; Barnett, S.; Djordjević, S.; Chen, A.S. Small-scale land use change modelling using transient groundwater levels and salinities as driving factors–An example from a sub-catchment of Australia’s Murray-Darling Basin. Agric. Water Manag. 2023, 278, 108174. [Google Scholar] [CrossRef]
  46. Zaman, T.; Alakuş, K. Integrating Jackknife into the Theil-Sen Estimator in Multiple Linear Regression Model. REVSTAT-Stat. J. 2023, 21, 97–114. [Google Scholar]
  47. Zhou, J.; Deitch, M.J.; Grunwald, S.; Screaton, E. Do the Mann-Kendall test and Theil-Sen slope fail to inform trend significance and magnitude in hydrology? Hydrol. Sci. J. 2023. just-accepted. [Google Scholar] [CrossRef]
  48. Malisch, R.; Fürst, P.; Šebková, K.; Sapunova, D.; Kalina, J. Time Trends in Human Milk Derived from WHO-and UNEP-Coordinated Exposure Studies, Chapter 3: Perfluoroalkyl Substances (PFAS). In Persistent Organic Pollutants in Human Milk; Springer International Publishing: Cham, Switzerland, 2023; pp. 543–600. [Google Scholar]
  49. Hamed, K.H. Trend detection in hydrologic data: The Mann–Kendall trend test under the scaling hypothesis. J. Hydrol. 2008, 349, 350–363. [Google Scholar] [CrossRef]
  50. Xue, Y.; Song, D.; Chen, J.; Li, Z.; He, X.; Wang, H.; Zhou, C.; Sobolev, A. Integrated rockburst hazard estimation methodology based on spatially smoothed seismicity model and Mann-Kendall trend test. Int. J. Rock Mech. Min. Sci. 2023, 163, 105329. [Google Scholar] [CrossRef]
  51. De Beurs, K.M.; Henebry, G.M. Trend analysis of the Pathfinder AVHRR Land (PAL) NDVI data for the deserts of Central Asia. IEEE Geosci. Remote Sens. Lett. 2004, 1, 282–286. [Google Scholar] [CrossRef]
  52. Ngwira, G.M.; Bolaane, B.; Parida, B.P. Investigating the trend of road traffic fatalities in Malawi using Mann-Kendall statistic. Heliyon 2023, 9, e13700. [Google Scholar] [CrossRef]
  53. Chukwuka, A.V.; Ogbeide, O.; Otomo, P.V. Trend relationship between mountain normalized difference vegetation index (NDVI) and aerosol optical depth (AOD) across two decades: Implication for water quality within the Lesotho Highlands, Drakensberg, South Africa. Environ. Monit. Assess. 2023, 195, 584. [Google Scholar] [CrossRef]
  54. Adan, M.; Tonnang, H.E.Z.; Greve, K.; Borgemeister, C.; Goergen, G. Use of time series normalized difference vegetation index (NDVI) to monitor fall armyworm (Spodoptera frugiperda) damage on maize production systems in Africa. Geocarto Int. 2023, 38, 2186492. [Google Scholar] [CrossRef]
  55. Wang, J.; Rich, P.M.; Price, K.P. Temporal responses of NDVI to precipitation and temperature in the central Great Plains, USA. Int. J. Remote Sens. 2003, 24, 2345–2364. [Google Scholar] [CrossRef]
  56. Gong, C.; Wang, S.X.; Lu, H.C.; Chen, Y.; Liu, J. Research Progress on Spatial Differentiation and Influencing Factors of Soil Heavy Metals Based on Geographical Detector. Huan Jing Ke Xue 2023, 44, 2799–2816. [Google Scholar] [PubMed]
  57. Wang, H.; Xu, Y.; Wei, X. Rural Resilience Evaluation and Influencing Factor Analysis Based on Geographical Detector Method and Multiscale Geographically Weighted Regression. Land 2023, 12, 1270. [Google Scholar] [CrossRef]
  58. Li, C.; Wang, J.; Wang, Q.; Wang, D.; Song, X.; Wang, Y.; Huang, W. Estimating Wheat Grain Protein Content Using Multi-Temporal Remote Sensing Data Based on Partial Least Squares Regression. J. Integr. Agric. 2012, 11, 1445–1452. [Google Scholar] [CrossRef]
  59. Ma, Y.; Ren, X.; Hu, H.; Liu, M.; Meng, Q. Vegetation dynamics and its driving force in Otindag Sandy Land based on Geodetector. J. Desert Res. 2021, 41, 195–204. [Google Scholar]
  60. Xie, W. A Novel Hybrid Method for Landslide Susceptibility Mapping-Based GeoDetector and Machine Learning Cluster: A Case of Xiaojin County, China. Int. J. Geo-Inf. 2021, 10, 93. [Google Scholar] [CrossRef]
  61. Kang, Y.; Guo, E.; Wang, Y.; Bao, Y.; Bao, Y.; Mandula, N. Monitoring vegetation change and its potential drivers in Inner Mongolia from 2000 to 2019. Remote Sens. 2021, 13, 3357. [Google Scholar] [CrossRef]
  62. Liu, X.; Zhu, X.; Pan, Y.; Zhao, A. Spatiotemporal changes in vegetation coverage in China during 1982—2012. Acta Ecol. Sin. 2015, 35, 5331–5342. [Google Scholar]
  63. Li, S.; Wang, J.; Zhang, M.; Tang, Q. Characterizing and attributing the vegetation coverage changes in North Shanxi coal base of China from 1987 to 2020. Resour. Policy 2021, 74, 102331. [Google Scholar] [CrossRef]
  64. Duo, A.; Zhao, W.; Qu, X.; Jing, R.; Xiong, K. Spatio-temporal variation of vegetation coverage and its response to climate change in North China plain in the last 33 years. Int. J. Appl. Earth Obs. Geoinf. 2016, 53, 103–117. [Google Scholar]
  65. Nie, T.; Dong, G.; Jiang, X.; Lei, Y. Spatio-temporal changes and driving forces of vegetation coverage on the loess plateau of Northern Shaanxi. Remote Sens. 2021, 13, 613. [Google Scholar] [CrossRef]
  66. Li, S.; Yan, J.; Liu, X.; Wan, J. Response of vegetation restoration to climate change and human activities in Shaanxi-Gansu-Ningxia Region. J. Geogr. Sci. 2013, 23, 98–112. [Google Scholar] [CrossRef]
  67. LLi, S.; Yang, S.; Liu, X.; Liu, Y.; Shi, M. NDVI-based analysis on the influence of climate change and human activities on vegetation restoration in the Shaanxi-Gansu-Ningxia Region, Central China. Remote Sens. 2015, 7, 11163–11182. [Google Scholar] [CrossRef]
  68. Wei, H.; Fan, W.; Ding, Z.; Weng, B.; Xing, K.; Wang, X.; Lu, N.; UIgiati, S.; Dong, X. Ecosystem services and ecological restoration in the Northern Shaanxi Loess Plateau, China, in relation to climate fluctuation and investments in natural capital. Sustainability 2017, 9, 199. [Google Scholar] [CrossRef]
  69. Yuan, W.; Wu, S.; Hou, S.; Xu, Z.; Lu, H. Normalized Difference Vegetation Index-based assessment of climate change impact on vegetation growth in the humid-arid transition zone in northern China during 1982–2013. Int. J. Climatol. 2019, 39, 5583–5598. [Google Scholar] [CrossRef]
  70. Hao, L.; Sun, G.; Liu, Y.; Gao, Z.; He, J.; Shi, T.; Wu, B. Effects of precipitation on grassland ecosystem restoration under grazing exclusion in Inner Mongolia, China. Landsc. Ecol. 2014, 29, 1657–1673. [Google Scholar] [CrossRef]
  71. El Kateb, H.; Zhang, H.; Zhang, P.; Mosandl, R. Soil erosion and surface runoff on different vegetation covers and slope gradients: A field experiment in Southern Shaanxi Province, China. Catena 2013, 105, 1–10. [Google Scholar] [CrossRef]
  72. Bai, J.; Bai, J.; Wang, L. Spatio-temporal Change of Vegetation NDVI and Its Relations with Regional Climate in Northern Shaanxi Province in 2000–2010. Sci. Geogr. Sin. 2014, 34, 882–888. [Google Scholar]
  73. Vernet, W.J.L. Vegetation, sedimentary deposits and climates during the Late Pleistocene and Holocene in eastern Morocco. Palaeogeogr. Palaeoclimatol. Palaeoecol. 1992, 94, 141–167. [Google Scholar] [CrossRef]
  74. Trivedi, A.; Tang, Y.-N.; Qin, F.; Farooqui, A.; Wortley, A.H.; Wang, Y.-F.; Blackmore, S.; Li, C.-S.; Yao, Y.-F. Holocene vegetation dynamics and climatic fluctuations from Shuanghaizi Lake in the Hengduan Mountains, southwestern China. Palaeogeogr. Palaeoclimatol. Palaeoecol. 2020, 560, 110035. [Google Scholar] [CrossRef]
  75. Kato, K.; Tanizoe, C.; Beiles, A.; Nevo, E. Geographical Variation in Heading Traits in Wild Emmer Wheat, Triticum Dicoccoides. II. Variation in Heading date and Adaptation to Diverse Eco-Geographical Conditions. Hereditas 2004, 128, 1601–5223. [Google Scholar] [CrossRef]
  76. Sun, W.; Lu, H.; Wang, Y.; Han, F.; Wang, H.; Li, Y.; Wu, G.; Li, S.; Jiang, P. Deposits and Palaeoenvironmental Record of the Eocene Honghe Formation in Lantian, Weihe Basin, Central China. Geol. J. China Univ. 2017, 23, 533–544. [Google Scholar]
Figure 1. (AC) Map of the study area location and land use.
Sustainability 15 16468 g001
Figure 2. Mean distribution maps of three meteorological factors in the study area from 2013 to 2022. Specifically, panels (ac) illustrate the mean values of potential evapotranspiration (PET), precipitation (PRE), and temperature (TMP), respectively.
Sustainability 15 16468 g002
Figure 3. Experimental flowchart.
Sustainability 15 16468 g003
Figure 4. The research area’s yearly average KNDVI values from 2003 to 2022. Shaanxi Province is represented by SX, whereas the areas of Guanzhong, northern Shaanxi, and southern Shaanxi are represented by GZ, NS, and SS, respectively.
Sustainability 15 16468 g004
Figure 5. Temporal trend analysis of KNDVI based on the Theil–Sen method.
Sustainability 15 16468 g005
Figure 6. Significance analysis of temporal KNDVI change trend.
Sustainability 15 16468 g006
Figure 7. Partial correlation analysis of influencing factors and KNDVI, where NS, GZ, and SS represent northern Shaanxi, Guanzhong, and southern Shaanxi, respectively. (ae) respectively represent CLCD, Landscan, PET, PRE, and TMP.
Sustainability 15 16468 g007
Figure 8. Statistics of interaction types between influencing factors in Shaanxi Province and its geographical regions from 2003 to 2022. Graphs (ad) represent the Shaanxi Province, northern Shaanxi, Guanzhong, and southern Shaanxi regions, respectively.
Sustainability 15 16468 g008
Figure 9. (ad) Results of single-factor detection. Graphs (a), (b), (c), and (d) respectively represent the single-factor detection results of Shaanxi Province, Northern Shaanxi, Guanzhong, and Southern Shaanxi.
Sustainability 15 16468 g009
Figure 10. The land cover distribution in Shaanxi Province for the years 2003, 2013, and 2022, where (ac) represent the years 2003, 2013, and 2022, respectively.
Sustainability 15 16468 g010
Table 1. Data sources and description.
Satellite DataParameterUnitSpatial Resolution/m
MOD13Q1Vegetation Indices/250
CLCDLand Cover/30
DEMDigital Elevation Modelm90
Landscan/PDPopulation DensityPopulation density/km21000
PETPotential Evapotranspirationmm1000
PREPrecipitationmm1000
TMPTemperature°C1000
Table 2. Information on interaction types.
DescriptionInteraction
Weaken, nonlinear q ( X 1 X 2 ) < min [ q ( X 1 ) , q ( X 2 ) ]
Weaken, uni- min [ q ( X 1 ) , q ( X 2 ) ] < q ( X 1 X 2 ) < max [ q ( X 1 ) , q ( X 2 ) ]
Enhance, bi- q ( X 1 X 2 ) > max [ q ( X 1 ) , q ( X 2 ) ]
Independent q ( X 1 X 2 ) = q ( X 1 ) + q ( X 2 )
Enhance, nonlinear q ( X 1 X 2 ) > q ( X 1 ) + q ( X 2 )
Table 3. Maximum Interaction of Influencing Factors in Shaanxi Province from 2003 to 2022.
YearMax ValueTypeYearMax ValueType
20030.892PRE ∩ PET20130.732TMP ∩ CLCD
20040.89PRE ∩ PET20140.83TMP ∩ PET
20050.899PRE ∩ PET20150.824TMP ∩ PET
20060.791TMP ∩ PET20160.782TMP ∩ PET
20070.805TMP ∩ PET20170.791TMP ∩ PET
20080.789TMP ∩ PET20180.744TMP ∩ PET
20090.811PRE ∩ PET20190.795PRE ∩ CLCD
20100.83PRE ∩ CLCD20200.809PRE ∩ PET
20110.834PRE ∩ PET20210.853PRE ∩ CLCD
20120.786TMP ∩ PET20220.761PRE ∩ CLCD
Table 4. Strongest interacting factors and interaction types in different geographical zones from 2003 to 2022.
Northern Shaanxi
YearMax ValueTypeYearMax ValueType
20030.856PRE ∩ PET20130.638TMP ∩ CLCD
20040.863PRE ∩ CLCD20140.746TMP ∩ PET
20050.869PRE ∩ PET20150.64TMP ∩ PET
20060.673TMP ∩ CLCD20160.654TMP ∩ PET
20070.708TMP ∩ CLCD20170.676TMP ∩ PET
20080.696TMP ∩ CLCD20180.621TMP ∩ PET
20090.677PRE ∩ PET20190.651PRE ∩ PET
20100.721PRE ∩ CLCD20200.68PRE ∩ PET
20110.669PRE ∩ CLCD20210.797PRE ∩ PET
20120.655TMP ∩ PET20220.61PRE ∩ CLCD
Guanzhong
YearMax ValueTypeYearMax ValueType
20030.667DEM ∩ CLCD20130.696DEM ∩ CLCD
20040.681DEM ∩ CLCD20140.73DEM ∩ CLCD
20050.701DEM ∩ CLCD20150.727DEM ∩ CLCD
20060.676DEM ∩ CLCD20160.707DEM ∩ CLCD
20070.65DEM ∩ CLCD20170.739DEM ∩ CLCD
20080.681DEM ∩ CLCD20180.755DEM ∩ CLCD
20090.68DEM ∩ CLCD20190.739DEM ∩ CLCD
20100.707PET ∩ CLCD20200.732DEM ∩ CLCD
20110.731PET ∩ CLCD20210.74DEM ∩ CLCD
20120.749DEM ∩ CLCD20220.774DEM ∩ CLCD
Southern Shaanxi
YearMax ValueTypeYearMax ValueType
20030.539DEM ∩ CLCD20130.557DEM ∩ CLCD
20040.585DEM ∩ CLCD20140.553DEM ∩ CLCD
20050.543DEM ∩ CLCD20150.629DEM ∩ CLCD
20060.612DEM ∩ CLCD20160.608DEM ∩ CLCD
20070.533DEM ∩ CLCD20170.629DEM ∩ CLCD
20080.565DEM ∩ CLCD20180.593DEM ∩ CLCD
20090.596DEM ∩ CLCD20190.599DEM ∩ CLCD
20100.478DEM ∩ CLCD20200.661DEM ∩ CLCD
20110.569DEM ∩ CLCD20210.628DEM ∩ CLCD
20120.578DEM ∩ CLCD20220.643DEM ∩ CLCD
Table 5. Land-use transition matrix for Shaanxi Province from 2003 to 2013.
2013CLCD
2003CLCDBarrenCroplandForestGrasslandImperviousShrubWaterSUM/km2
Barren908501538130121738
Cropland1534,70410,30911,37128174632359,585
Forest0708173,93029241043145184,404
Grassland1239827514640,0254094216255,734
Impervious1151512923110290552960
Shrub096746990170958
Water71967959610137539
SUM/km223653,50490,33956,2474433419740205,918
Table 6. Land-use transition matrix for Shaanxi Province from 2013 to 2022.
2022CLCD
2013CLCDBarrenCroplandForestGrasslandImperviousShrubWaterSUM/km2
Barren72300120806236
Cropland145,8973325330491316353,504
Forest0126989,02619124090,339
Grassland1155220250648,22315916856,247
Impervious040043830464433
Shrub020287360760419
Water109516550573740
SUM/km219852,53595,14551,7085519117696205,918
Table 7. Land-use transition matrix for different geographical regions in Shaanxi Province from 2003 to 2022.
NS2022CLCD
2003CLCDBarrenCroplandForestGrasslandImperviousShrubWaterSUM/km2
Barren5218201463260131736
Cropland1255831135919218014516,148
Forest079910,0409951822411,878
Grassland1218326334136,817460613549,206
Impervious378151688407355
Shrub01819742100258
Water74465119062189
SUM/km219515,03014,73448,7287882926679,770
GZ2022CLCD
2003CLCDBarrenCroplandForestGrasslandImperviousShrubWaterSUM/km2
Barren00000022
Cropland121,946251410932930515628,645
Forest0151817,9075492621620,027
Grassland122231696839701124842
Impervious1118726109500372211
Shrub0321086000146
Water08115533047181
SUM/km2326,98722,266250240092726056,054
SS2022CLCD
2003CLCDCroplandForestGrasslandImperviousShrubWaterSUM/km2
Cropland583482989146849714,792
Forest410847,932276101433952,499
Grassland30612629213941686
Impervious154108112407394
Shrub5347917050554
Water6366116023169
SUM/km210,51858,1454787226117070,094
Disclaimer/Publisher’s Note: The statements, opinions and data contained in all publications are solely those of the individual author(s) and contributor(s) and not of MDPI and/or the editor(s). MDPI and/or the editor(s) disclaim responsibility for any injury to people or property resulting from any ideas, methods, instructions or products referred to in the content.

