Article

The Spatial Distribution and Influencing Factors of Heavy Metals in Soil in Xinjiang, China

1
Xinjiang Biomass Solid Waste Resources Technology and Engineering Center, College of Chemistry and Environmental Science, Kashi University, Kashi 844000, China
2
Key Laboratory of Soil Environment and Pollution Remediation, Institute of Soil Science, Chinese Academy of Sciences, Nanjing 210008, China
*
Authors to whom correspondence should be addressed.
Sustainability 2023, 15(23), 16379; https://doi.org/10.3390/su152316379
Submission received: 17 October 2023 / Revised: 17 November 2023 / Accepted: 20 November 2023 / Published: 28 November 2023

Abstract

:
Heavy metal pollution has been a problem of concern in soil ecology in recent decades. This study investigated the spatial distribution of heavy metals and their pollution levels in the soil of Xinjiang, based on the data of heavy metals published in the literature in the past five years, by using a geostatistical method, pollution index method, and geographic information system (GIS)-based spatial analysis. Additionally, the effects of five economic development indicators, such as population and industrial activities on the accumulation of heavy metals in soil, were explored by correlation analysis. The results showed that the average contents of Cd, Cr, Cu, Ni, Pb, and Zn in the soils were 2.858, 1.062, 1.194, 1.159, 1.192, and 1.086 times higher than the background values in Xinjiang, respectively. The semi-variance functions indicated that the Cd and Pb block gold coefficients of soils were greater than 25% and less than 50%, with an obvious spatial correlation. The spatial patterns showed that the high values of Cd, Cr, Cu, Ni, Pb, and Zn were mainly distributed in Karamay, Changji, Tacheng, and Kashi areas, with an overall decreasing trend from north to south, and the pollution index showed that the pollution of heavy metal Cd in soil was the most serious. Furthermore, Karamay, Changji, and Kashi areas were at heavy pollution levels. Correlation analysis showed that heavy metal Pb in the soil was significantly positively correlated with the agricultural GDP in Xinjiang, while Cd was correlated significantly and positively with comprehensive energy consumption and more significantly with industrial GDP. Thus, this study could provide a scientific basis for local evaluation of soil environmental quality and prevention and control of soil heavy metal pollution, which is of great significance for understanding the impact of human activities.

1. Introduction

Soil, a major ecosystem component, is a habitat for organisms and a basis for sustaining human survival. Industrialization has intensified, and cities have expanded due to the rapidly developing global economy. Consequently, mineral resource exploitation, metal processing and smelting, chemical production, sewage irrigation, and irrational application of fertilizers and pesticides have led to the continuous enrichment of heavy metals in soil [1,2]. Additionally, the excessive accumulation of heavy metals may become a source of pollution of surface water, groundwater, and organisms [3]. Over the past two decades, the term “heavy metals” has been widely used. However, heavy metal has no authoritative definition to be found in the relevant literature so far. To replace current terminology with something better for toxicity assessment or for the consideration of potential biological effects, it is desirable to establish an appropriate chemical classification of metals [4]. Heavy metals can harm humans through oral intake, dermal contact, and respiratory intake, and they can even lead to cancer risk [5]. Incidents of heavy metal contamination in Chinese soils have become more frequent [6] and have received widespread attention around the world.
In recent years, many studies have focused on the content characteristics, enrichment levels, source resolution, spatial distribution characteristics [2,3,7], health risk evaluation [8], phytoremediation, and bioremediation [9,10] of heavy metals in soils. Multivariate statistics and geostatistical analysis have gradually matured and improved the study of soil heavy metal sources and spatial differentiation [11]. Multivariate statistical analysis (e.g., correlation analysis and principal component analysis) are classic statistical methods commonly used to identify the anthropogenic and natural sources of heavy metals in soil. For example, principal component analysis was used to study spatial distribution and potential sources of heavy metals in the soils of a farmland protection area in Hubei Province [12]. Geostatistics have been widely used to characterize the spatial distribution of heavy metals in soil to quantify spatial distribution patterns by obtaining semi-variate functions [13,14]. For example, Reza et al. [15] used the ordinary kriging (OK) method to study the spatial structure of heavy metal pollution in mining areas. Thomas et al. [16] used ordinary and indicative kriging methods to analyze the spatial heterogeneity and pollution sources of heavy metals in the metropolitan area of Mexico City. Mahmoudabadi et al. [17] studied the factors influencing the distribution of heavy metals in soils. Du et al. [18] assessed the pollution characteristics and sources of soil heavy metals on the Qinghai-Tibet Plateau using geostatistics, the positive matrix factorization (PMF) model, and disjunctive kriging. Analyzing important information, such as the degree of pollution and possible source pathways of heavy metals in soil, provides the theoretical basis and scientific decision support to develop reasonable industrial and agricultural layouts, pollution prediction, pollution warnings, and pollution prevention and control measures.
Many heavy metal pollution studies start from the micro-interface migration and transformation processes and move toward the regional pollution formation mechanism. Heavy metal pollution is closely related to the regional economic development level and the nature of leading local enterprises. In particular, regional soil pollution due to heavy metal is more serious with a higher degree of industrialization, such as the combustion of coal, oil, and other traditional energy minerals and the “three waste” emissions of chemical mining, mainly enriching the soil layer with As, Cd, Cr, Hg, Pb, Cu, and Zn elements [19,20]. Peng et al. [8] showed that the content of heavy metals in soil was relatively high in the Chinese cities of economically developed coastal provinces (e.g., Zhejiang) and resource-based provinces (e.g., Hunan). Chen et al. [1] showed that the spatial distribution characteristics of heavy metals in Chinese farmland soils varied significantly, and the southern farmland soils had significantly higher heavy metal content than those in the north. Subsequently, this showed that the differences in regional economic development affected the spatial distribution characteristics of heavy metals in soil. The highly industrialized and economically developed regions of China have seen an increase in studies on the spatial distribution characteristics of heavy metals there. Some studies have been conducted in arid regions with relatively poor economic development (e.g., Xinjiang). However, with the promulgation of the West Development and Silk Road economic belt policy, increased attention has been paid to the heavy metal pollution in the soil of the oasis farmland in Xinjiang [21]. The studies in Xinjiang have mostly focused on the enrichment characteristics and spatial distribution of heavy metals in small-scale areas such as agricultural fields [22,23], pasture [24], orchards [25], vegetables [26], urban soils [27], and industrial and mining areas [28,29]. However, there have been few studies on spatial variability and source analysis on a large scale on heavy metals in the soil at the provincial level. Particularly, the knowledge on the correlation of heavy metal content in soil and the statistical information of the socio-economic development level in Xinjiang has not been fully explored.
Rong et al. [30] selected 14 indicators of the ecological environment and the economic system to evaluate the coordinated development of 30 provinces in China. Peng et al. [8] explored the correlation between the average concentrations of heavy metals in urban soil and economic indicators (e.g., permanent population, GDP, etc.). Wang et al. [31] found that the GDP was one of the most important factors that affected the concentration and spatial variation of As in soil. Chen et al. [32] showed an inverted U-shaped environmental Kuznets curve of Cr emissions and economic indicators in Singapore. The key role of developing an indicator framework in the environmental economy system was based on the specific determinants of well-being within a particular country. Therefore, the selection of the indicator inventory was targeted at the representative group reflecting the practical status of socio-economic development within the policy and development decision-making processes carried out by the Chinese government [30]. Herein, based on the data of heavy metals published in the literature in the past five years, the spatial distribution of heavy metals such as Cr, Cu, Cd, Ni, Zn, and Pb in the soils of Xinjiang was studied using geostatistical methods and geographic information system (GIS)-based spatial analysis. Furthermore, the economic development indicators, such as population, regional GDP, agricultural GDP, industrial GDP, and integrated energy consumption were also selected for correlation analysis with heavy metal content in soil to explore the influence of socio-economic development on heavy metal accumulation in soil concerning five aspects: population, economy, industry, energy, and transportation in Xinjiang. The results of this study were of great significance for understanding the spatial distribution, enrichment level, and human influence of heavy metals in the soil of Xinjiang on a macro scale, which was also crucial for developing effective response measures. These efforts not only protect human health and ecological safety but also provide a solid foundation for sustainable development.

2. Materials and Methods
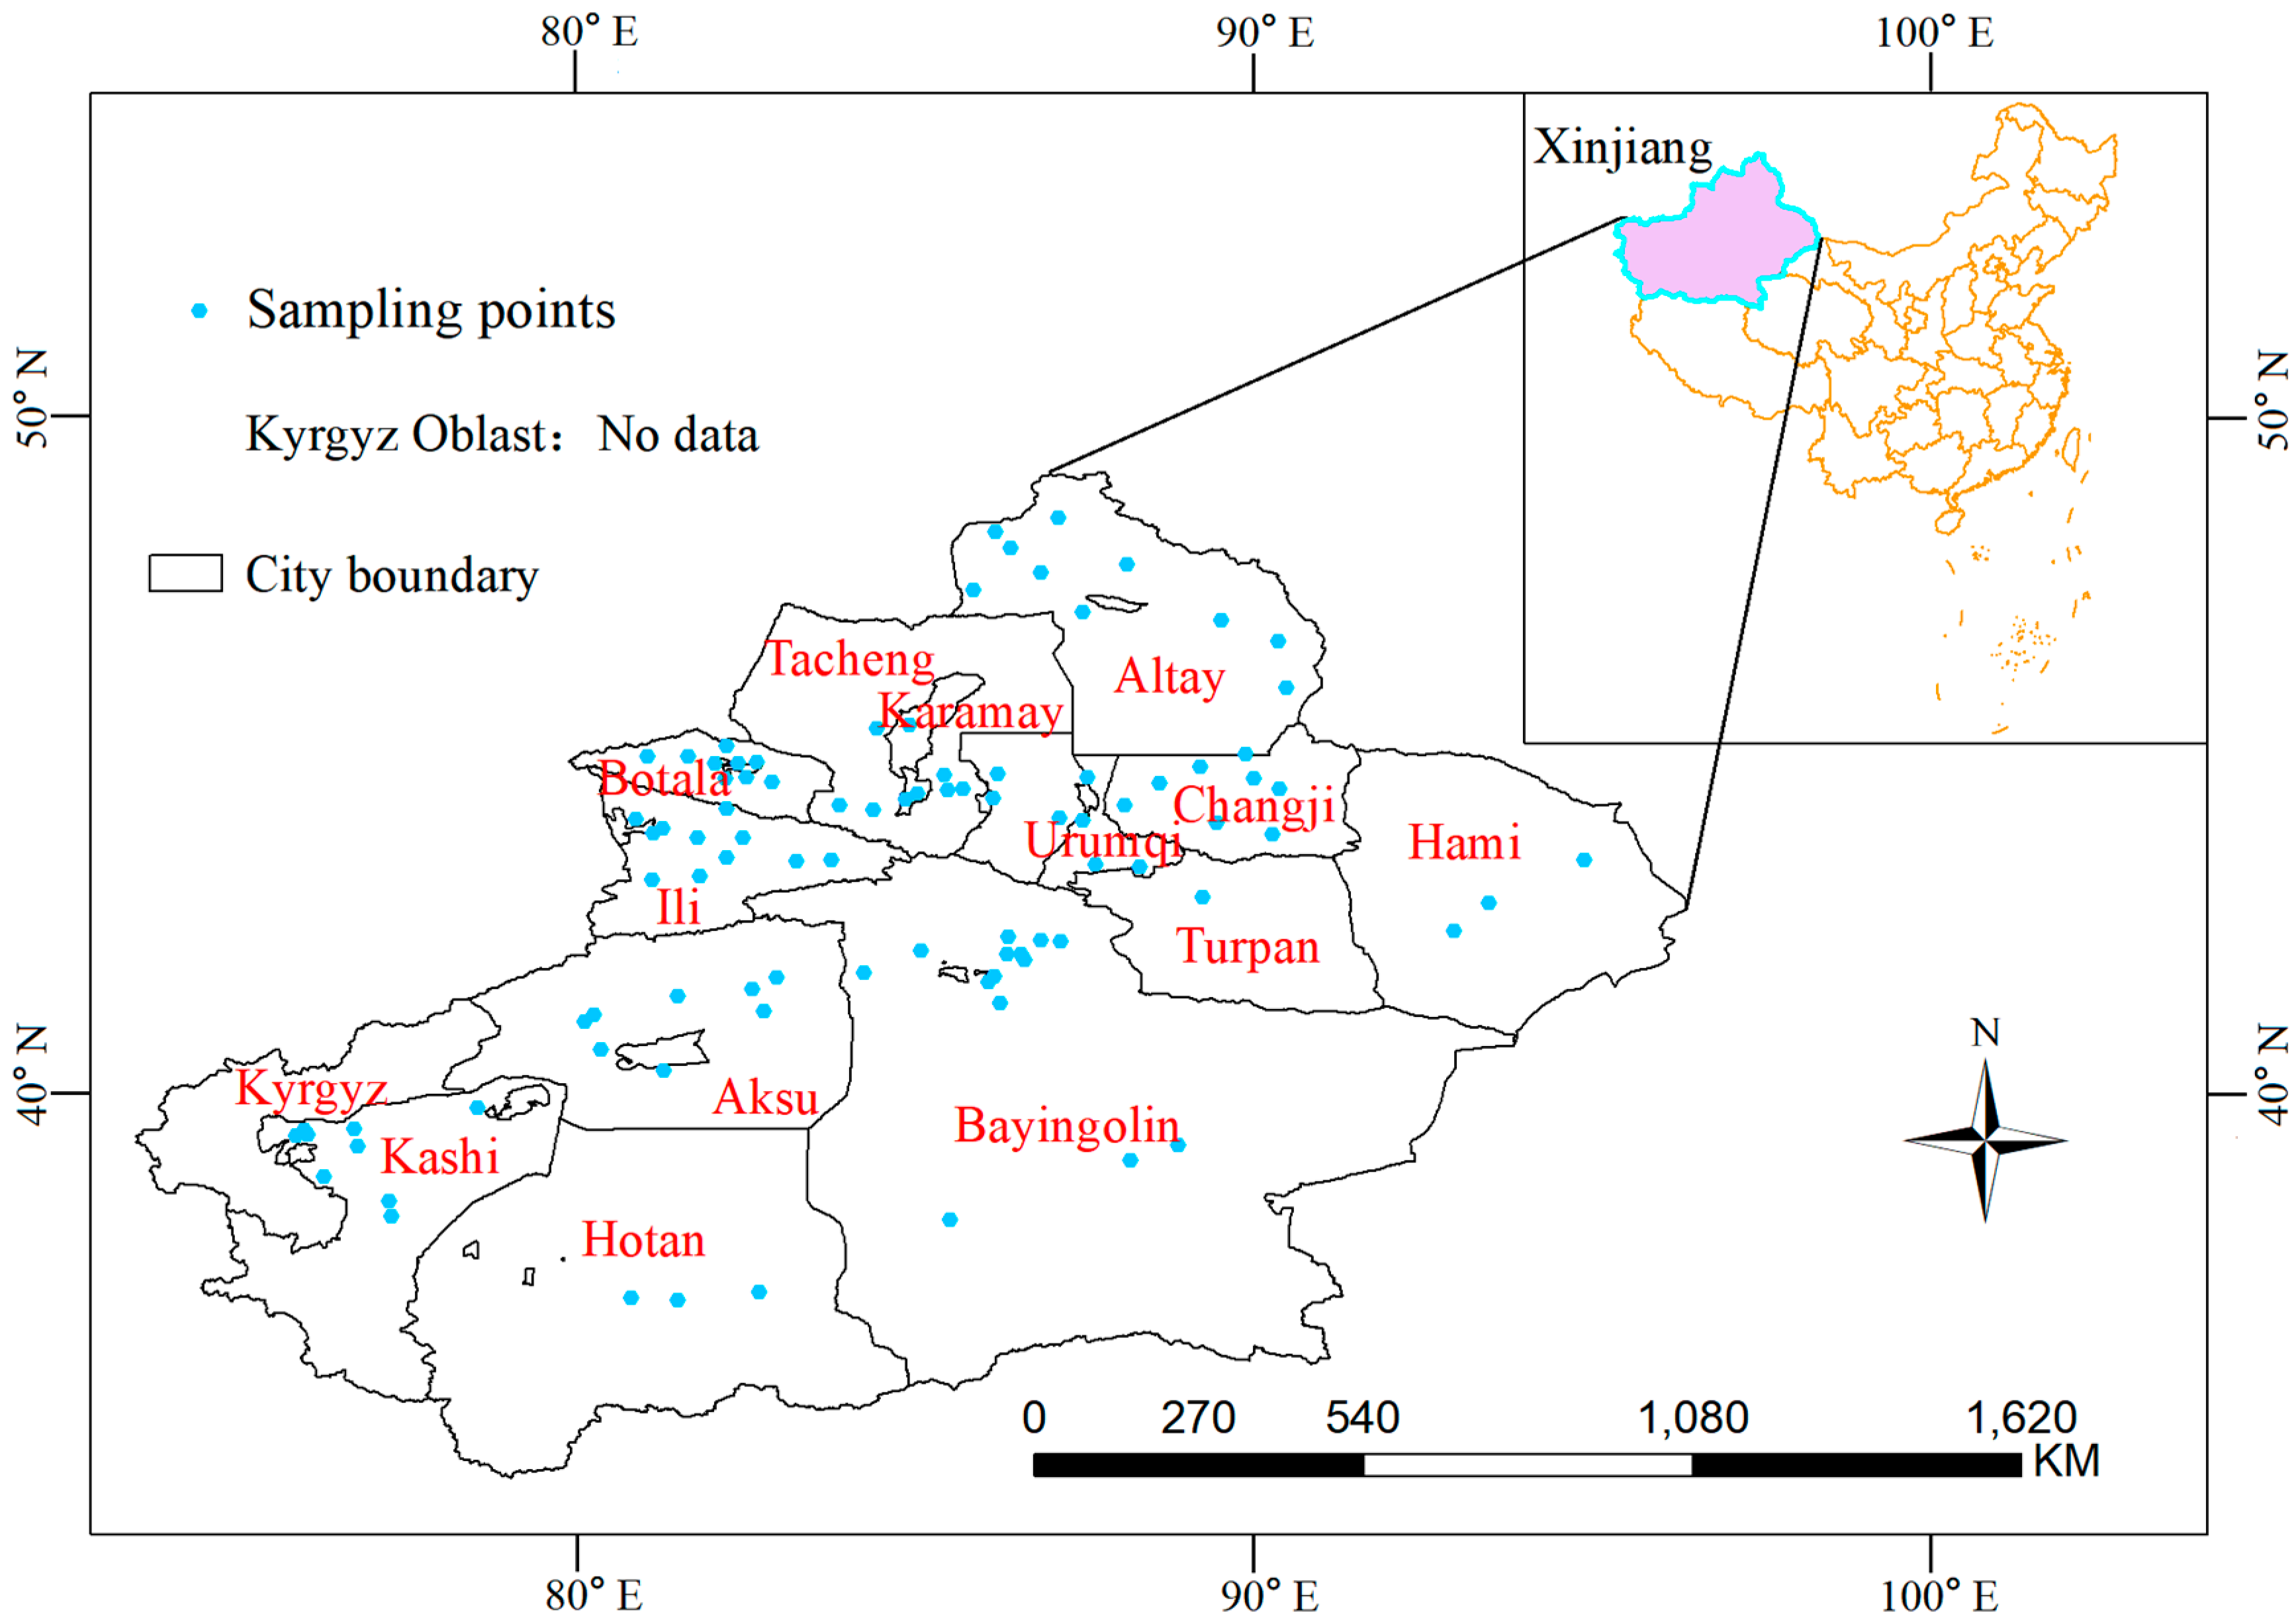
2.1. Study Area

Xinjiang, located in the northwest of China (73°40–96°18′ E, 34°25′–48°10′ N), has an area of 1,664,900 square km, giving it the largest land area in China. Its direct jurisdiction is spread over four prefecture-level cities, five regions, five autonomous prefectures, and eleven county-level cities under the central government of autonomous regions. Xinjiang has a critical strategic location. It has a land border of more than 5600 km, bordering eight countries, including Russia, and is a must-pass for the second “Asia–Europe Continental Bridge”. The land area directly available for agriculture, forestry, and animal husbandry in Xinjiang is 685,333 square km, accounting for more than one-tenth of the land area suitable for agriculture, forestry, and animal husbandry in China. Xinjiang has abundant mineral resources such as oil, natural gas, coal, gold, and rare metals, with broad development prospects. In 2022, the Xinjiang Uyghur Autonomous Region of China achieved a regional gross domestic product (GDP) of CNY 1774 billion, an increase of 3.2% compared to the previous year, with the primary, secondary, and tertiary industries increasing by 5.3%, 4.8%, and 1.5% year-on-year, respectively [33].

2.2. Data Source and Preprocessing

This study collected and organized 51 peer-reviewed papers published in the past five years and obtained 92 sets of data on heavy metals in soil in 13 regions of Xinjiang (without data from Kyrgyz Oblast). The regions were the main cities in Xinjiang, including Aksu (Aksu Prefecture), Altay (Altay Prefecture), Bayingolin (Bayingolin Mongol Autonomous Prefecture), Botala (Botala Mongol Autonomous Prefecture), Changji (Changji Hui Autonomous Prefecture), Hami (Hami City), Hotan (Hotan Prefecture), Kashi (Kashi Prefecture), Karamay (Karamay City), Tacheng (Tacheng Prefecture), Turpan (Turpan City), Urumqi (Urumqi City), Ili (Ili Kazakh Autonomous Prefecture). The literature was screened in China Knowledge Network, Web of Science, and ScienceDirect databases, using “soil heavy metals”, “spatial distribution of heavy metals”, and the names of different regions in Xinjiang as keywords. Since the data for six heavy metals, Cd, Cr, Cu, Ni, Pb, and Zn, were more comprehensive in the literature, they were used as targets in this study. The data for some heavy metals were incomplete in the literature. Consequently, 79 Cd, 91 Cr, 85 Cu, 60 Ni, 91 Pb, and 74 Zn samples were collected, and the distribution is shown in Figure 1.
The data on socio-economic development indicators were extracted from the statistical yearbooks of the national economy and various regional cities, prefectures, and cities of the Xinjiang Uygur Autonomous Region Bureau of Statistics. Since the selected papers were published or sampled mainly around 2019, the data of 2019 were selected as the socio-economic development indicators, including five economic development indicators, to explore the influence of socio-economic development status on the heavy metals in the soils of Xinjiang. The economic development indicators are shown in Table 1.
The collected data included the mean value of the heavy metals in soil in each study as the content value at that point. Then, the mean ± three times the standard deviation was applied to the raw data to eliminate abnormal samples since these samples may be affected by factors such as mining area, resulting in high values [34].

2.3. Research Methods

2.3.1. Variance Function

Geostatistics have been widely used to characterize the spatial distribution of heavy metals in soil by obtaining semi-variance functions to quantify the spatial distribution patterns. The semi-variance function is important for studying the characteristics of spatial variation of regionalized variables of heavy metals at certain scales using geostatistics. Additionally, the theoretical models of semi-variance function mainly include exponential, spherical, and Gaussian models. Furthermore, the main parameters include block gold values, abutment values, block gold coefficients, variance, and residuals. The basic theory and specific calculation methods of geostatistics have been described in detail in the literature [34,35]. This study calculated the semi-variance function using the Kolmogorov–Smirnov normality test module in SPSS 20.0 software to test the normal distribution of heavy metals in the soil. If the data had a normal distribution, GS+ 9.0 software was used to calculate the semi-variance function and fit theoretical models like Gaussian and spherical models. However, if the data did not obey normal distribution, logarithmic transformation was required to make them close to a normal distribution before performing relevant calculations and analysis.

2.3.2. Ordinary Kriging Method

Since the enrichment of heavy metals in the soil varies spatially in the region with no statistical information in some areas, reflecting the actual soil conditions accurately by simply using sample data for analysis and evaluation was difficult. Kriging interpolation, an optimal method of spatial interpolation that is based on the spatial location of samples and the difference in correlation degree between samples, quantifies each sample with weights and calculates the sliding weighted average to make the evaluation results more accurate and realistic [34]. Kriging interpolation is also known as spatial self-covariance optimal interpolation. This study selected OK, a kriging algorithm, to determine the spatial distribution characteristics of heavy metals in the soils of Xinjiang.

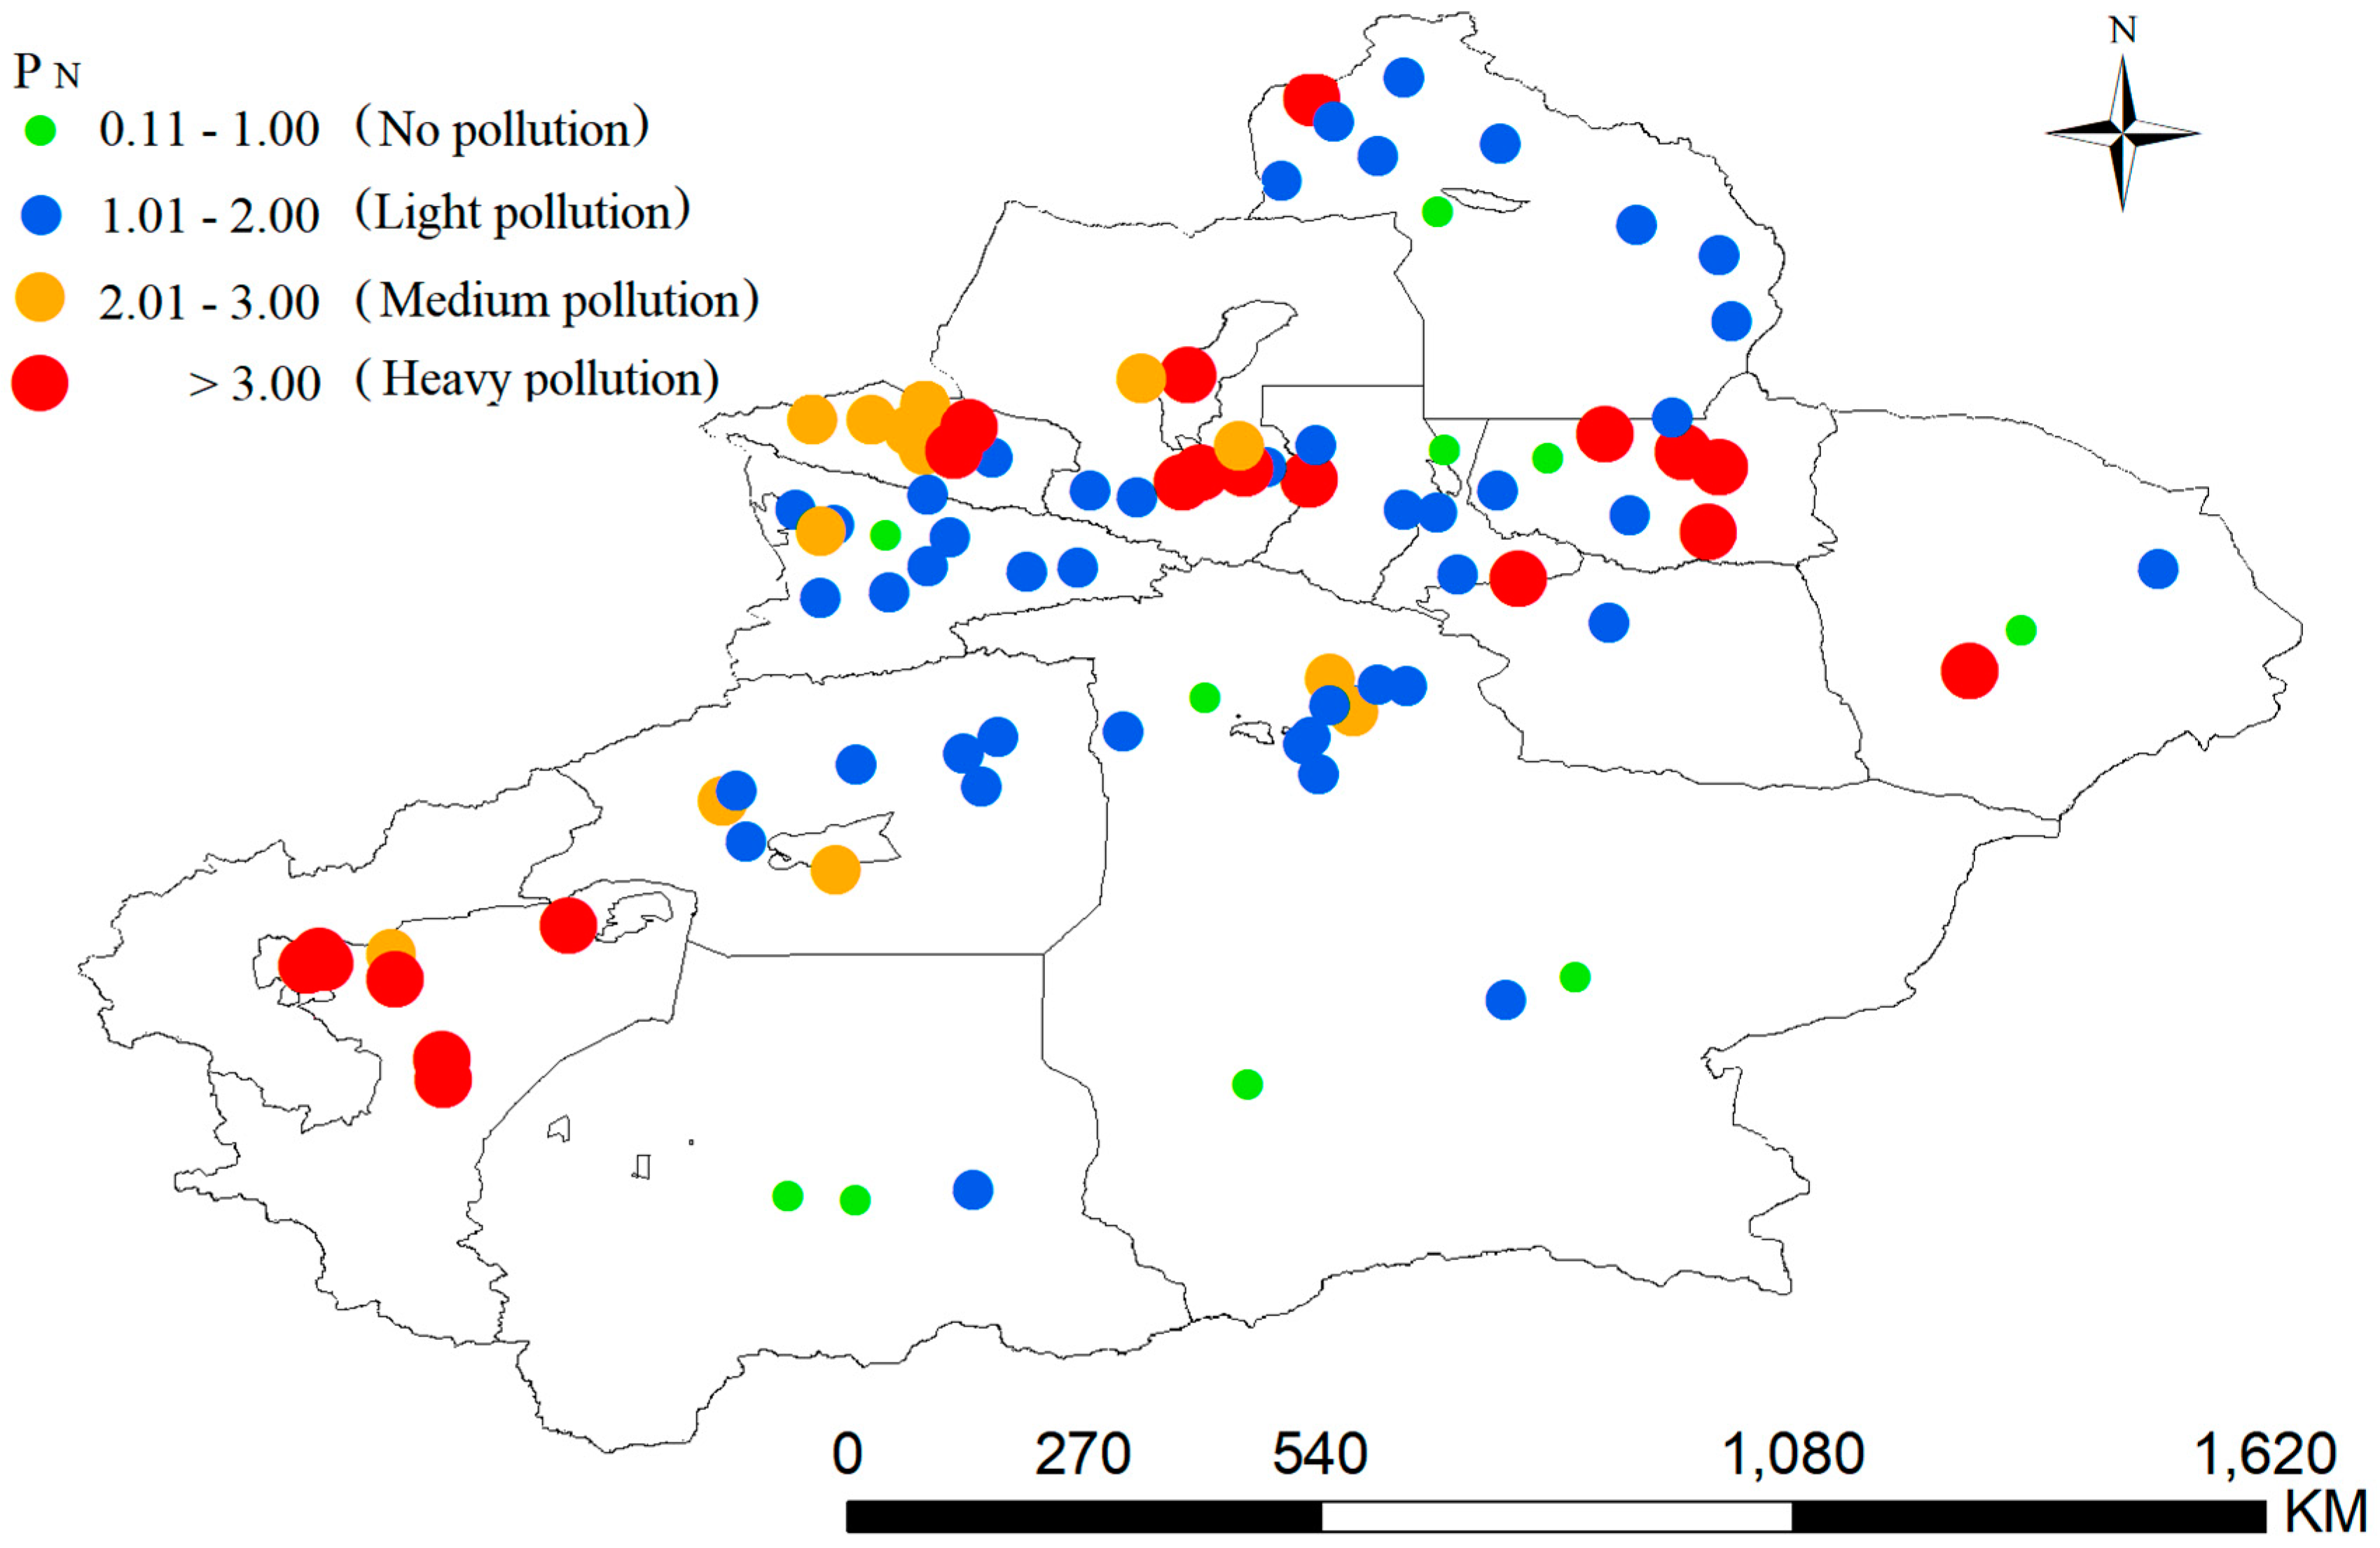
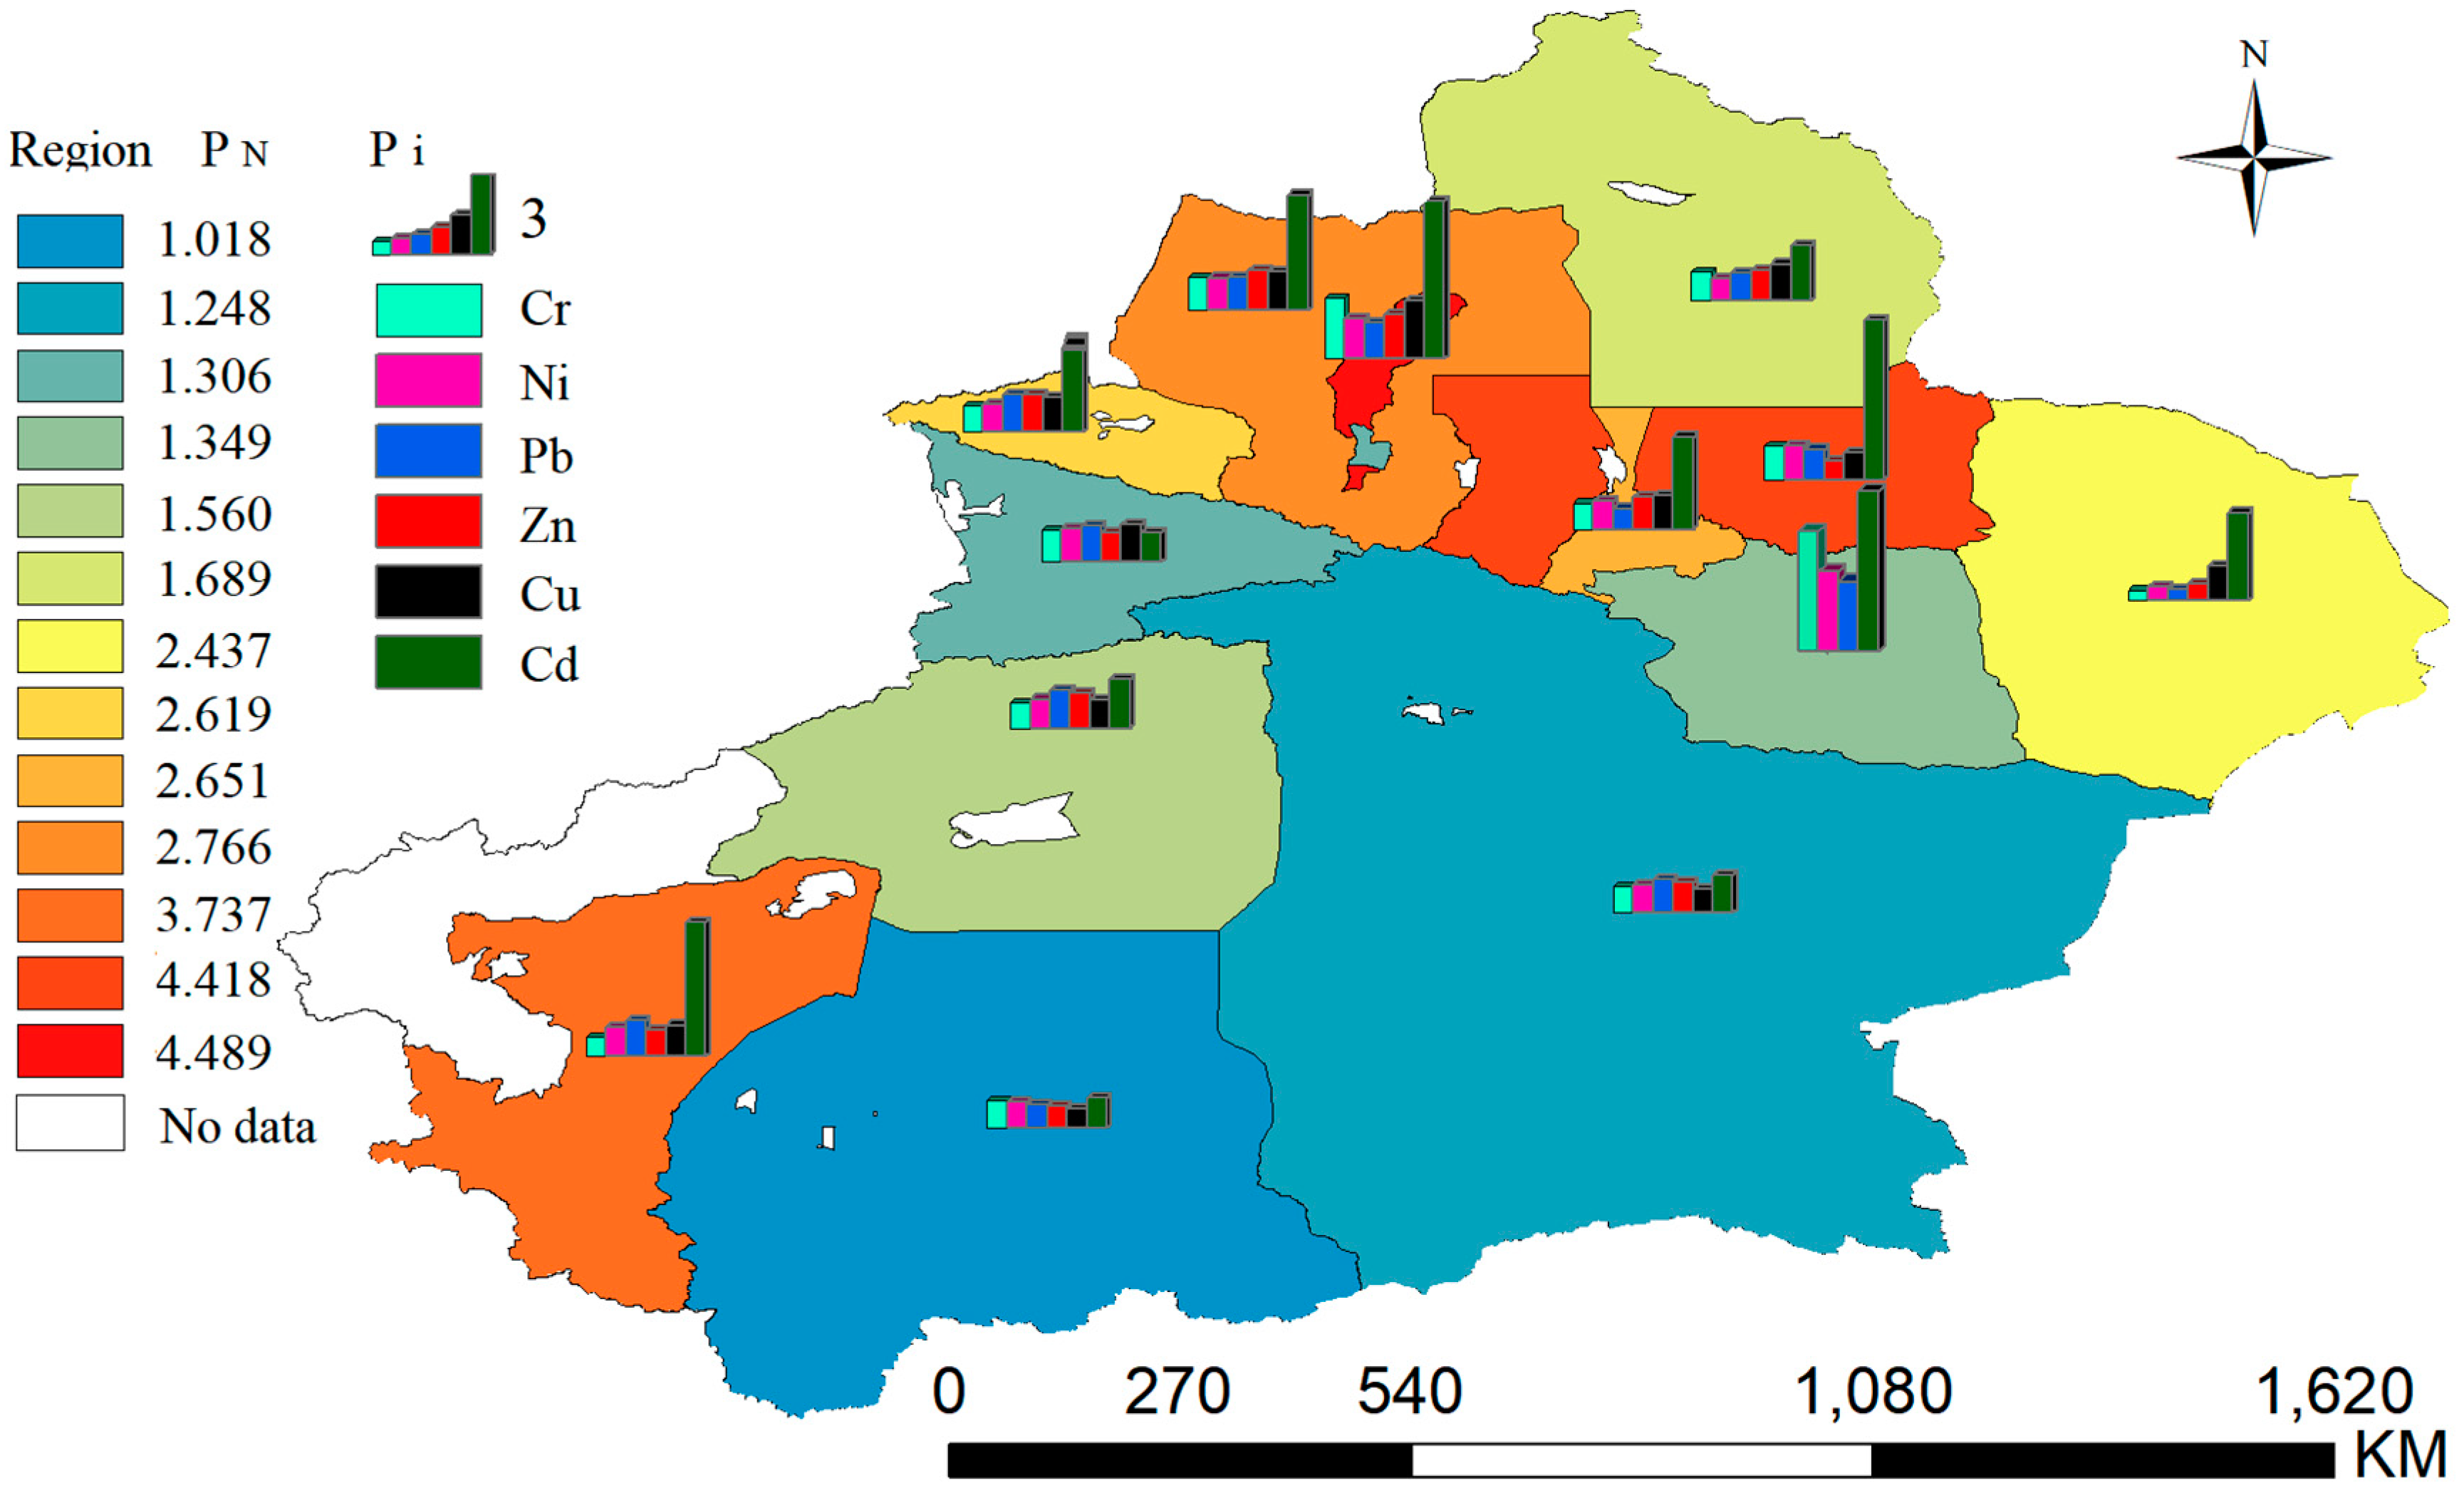
2.3.3. Nemero Integrated Pollution Index

Nemero’s comprehensive pollution index method can comprehensively reflect the average pollution level of various pollutants in different soil functions and also highlight the harm caused to the environment by the most severe pollution. The calculation formula is given as follows:
P N = { [ ( c i / S i ) max 2 + ( c i / S i ) ave 2 ] / 2 } 1 / 2
where Pi and PN represent the single-factor pollution index and integrated pollution index, respectively, and Pi = ci/Si. ci and Si represent the measured concentration and evaluation standard of pollutant i (in mg-kg–1), respectively, and the background value of soil elements in Xinjiang was selected [36]. (Pi)max and (Pi)ave are the maximum and average values of the pollution index of soil pollution, respectively. Additionally, PN ≤ 1, 1 < PN ≤ 2, 2 < PN ≤ 3, and PN > 3 indicate no, light, medium, and heavy pollution, respectively.

2.4. Statistical Analysis and Graphing

SPSS 20.0 was used for the descriptive analysis and normal distribution tests of sample data of heavy metals in soil. Geostatistical analysis was performed with GS+ 9.0, and kriging interpolation and spatial distribution maps were carried out with ArcGIS 10.5. Pearson’s correlation analysis generally illustrates the pairwise associations for a set of variables and decides their direction and strength. MATLAB 2015a was used to analyze the correlation between socio-economic development and heavy metals, and a heat map was further generated according to the correlation coefficient matrix.

3. Results and Discussion

3.1. Descriptive Statistics of Heavy Metal Content in the Soil

The descriptive statistical analysis results for heavy metals of soils in Xinjiang after excluding the abnormal values are shown in Table 2. The average concentrations of Cd, Cr, Cu, Ni, Pb, and Zn in the soils were 0.343, 52.373, 31.878, 29.204, 23.127, and 74.732 mg/kg, which were 2.858, 1.062, 1.194, 1.159, 1.192, and 1.086 times their corresponding background concentrations, respectively, indicating different degrees of anthropogenic activities. These results suggested the average contents of Cd and Cu in the soils of Xinjiang were higher than the average contents of agricultural soils in China, while the contents of Cr, Pb, and Zn in soil were lower than the national average [1]. Compared with the results reported by Peng et al. [8], the contents of Cd, Cu, Pb, and Zn in soil were lower than the average values of urban soils in China. The coefficient of variation could reflect the regional differences in the heavy metal element distribution. The spatial distribution of the elemental content became more uneven, and the disturbance by anthropogenic activities increased as the coefficient of variation increased. The coefficients of variation for the heavy metals in soil followed the order of Cd > Pb > Cu > Cr > Zn > Ni. The largest differences were between samples with Cd and Pb, with their coefficients of variation reaching 0.837 and 0.554, respectively. This result indicated that Cd and Pb were subject to strong spatial variability due to external disturbances, followed by Cu, Cr, Zn, and Ni, whose coefficients of variation are relatively small and were less affected by external influences. Furthermore, skewness and kurtosis coefficients represent the distribution of heavy metals in soil, and the larger the coefficient, the higher the aggregation degree of heavy metals [37]. In this study, the skewness and kurtosis values of soil Cd and Pb were higher, indicating that Cd and Pb in the soil showed a high accumulation state. Zhang et al. [38] showed that the differences in the spatial distribution of heavy metal contents were related mainly to the differences in soil-forming parent materials, background values, regional differences in economic development, and the types of industries in different regions.

3.2. Spatial Variability Characteristics of Heavy Metal Content in the Soil

As shown in Table 3, the geographic coordinates and content data of the pre-treated heavy metals in soil were analyzed using the geostatistical software to fit the semi-variance function of heavy metal content in soil and calculate the optimal model parameters for kriging interpolation. The results showed that the Cd, Cr, and Pb contents in the soil deviated severely from the normal distribution, for which logarithmic transformation was performed. Based on the principle of minimum residual sum of squares (RSS) and maximum coefficient of determination (R2), the best theoretical model of the spatial variation function was obtained under isotropic conditions. As shown in Table 3, Cd, Pb, and Zn fitted the spherical model, Cr and Ni fitted the exponential model, and only Cu fitted the Gaussian model.
The strength of spatial variability was classified by the magnitude of the block gold coefficient, i.e., the ratio of block gold values to abutment values [39]. The R2 and RSS values for all heavy metals in soil were above 0.70 and close to 0, respectively, indicating the prediction accuracy of the six heavy metal contents under the fitted variance function theoretical model was high and the prediction results reflected the distribution of heavy metals in the soils of Xinjiang. The Cr and Ni nugget coefficients were less than 25%, which suggested that Cr and Ni in the soil had a strong spatial correlation and were less affected by anthropogenic disturbances and mainly ascribed to the action of natural factors. The Cd and Pb nugget coefficients were greater than 25% and less than 50%, indicating Cd and Pb in the soil had a significant spatial correlation, which was due to the combined action of anthropogenic and natural factors. The Cu and Zn nugget coefficients were greater than 50% and less than 75%, indicating Cu and Zn in the soil had a moderate spatial correlation and may be subjected to a more pronounced combined effect of anthropogenic and natural factors [39].

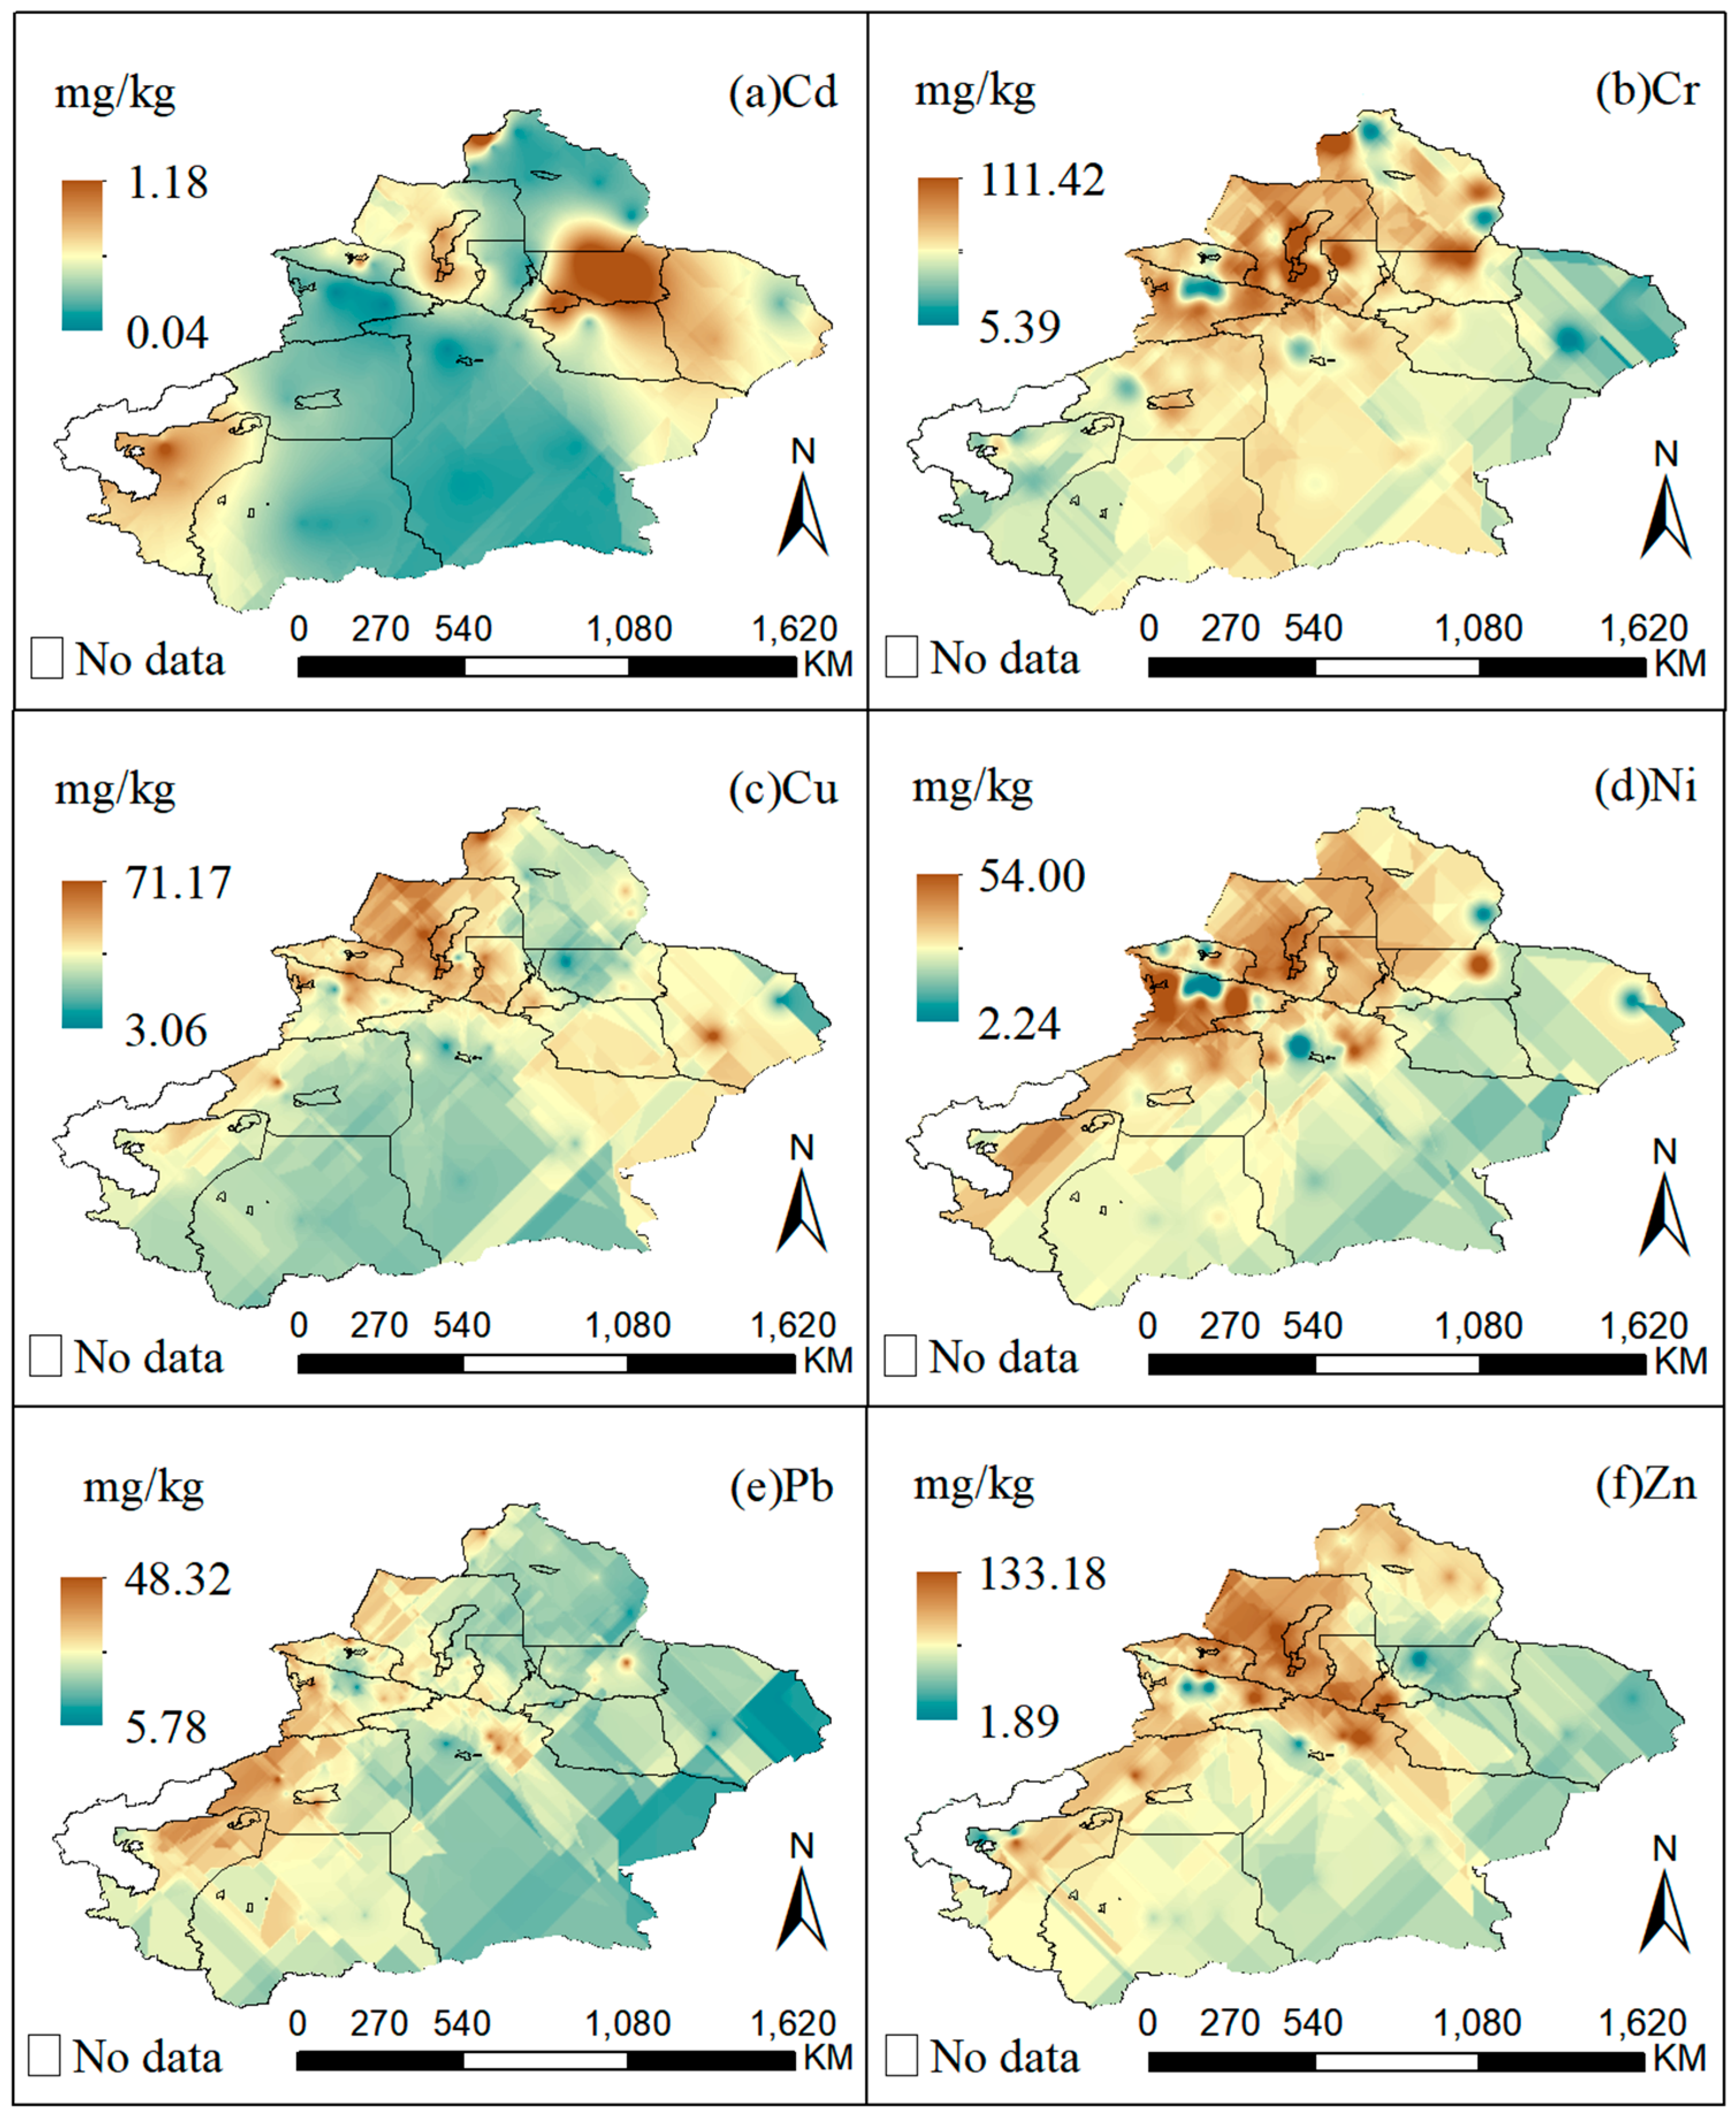
3.3. Spatial Distribution of Heavy Metals

The collected point data of heavy metal content in the soils of Xinjiang were subjected to kriging interpolation based on the parameters of the semi-variance function analysis model to obtain the spatial distribution map of heavy metal content.
As shown in Figure 2, the spatial distributions of heavy metals in the soils of Xinjiang had differences and similarities. The areas with high values of Cd content in soil were primarily distributed in eastern Changji, Karamay, northwestern Kashi, central-eastern Tacheng, eastern Urumqi, the northwestern corner of Botala, and central-western Hami. A general trend of increasing content from the center of the study area to the northeast and southwest regions was observed. Furthermore, the high Cr and Ni values were primarily distributed in Karamay, Changji, Tacheng, and Ili. The spatial distribution pattern of Cr and Ni content in the soil showed a trend of decrease from north to south. Additionally, it showed an increasing and then decreasing trend from west to east. The areas with high Cu and Zn values were mainly distributed in Karamay, Tacheng, Botala, northern Altay, and Ili. The high-Pb-value areas were mainly distributed in northwestern Aksu, Botala, northern Kashi, the east and west parts of Ili, southern Karamay, and northern Bayingolin. There was an overall trend of decrease from north to south.
In summary, the areas with high values of heavy metals Cd, Cr, Cu, Ni, Pb, and Zn in the soils of Xinjiang were mainly distributed in Tacheng, Karamay, Changji, and Kashi, with an overall trend of decrease from north to south. The areas with high levels of these six heavy metals may be correlated with urban development patterns. Wang et al. [2] showed that pollutant emissions from urban residences, industrial production, and transportation could be the main sources of the high content of heavy metals in soil.

3.4. Characteristics of Heavy Metal Accumulation in Soil in Xinjiang

Administrative divisions counted the collected data on heavy metals in Xinjiang territory to obtain the mean values of heavy metals in soils of all regions, states, and cities, as shown in Table 4. The PN values for the six heavy metals at all the sample sites were calculated. Spatial distribution maps were drawn using the background values in Xinjiang as the standard, as shown in Figure 3 and Figure 4.
As shown in Table 4, the heavy metal contents in the soils of different regions in Xinjiang varied widely, and the highest Cd, Cr, Cu, Ni, Pb, and Zn contents in the soil were distributed in Changji, Karamay, and Aksu. The average Cd value in Changji soil was 0.71 mg/kg. The average Cr, Cu, Ni, and Zn values in Karamay soil were 109.95, 56.83, 39.04, and 111.55 mg/kg, respectively. The average Pb value in Aksu soil was 27.43 mg/kg.
Furthermore, PN could reflect the overall accumulation level of heavy metals in urban soils. As shown in the spatial distribution of heavy metal contamination of soil in Figure 3, only 10.87% of the sample sites in Xinjiang were not contaminated with heavy metals, according to the PN contamination level. However, 89.13% of the sample sites were contaminated with different levels of heavy metals, of which 23.91%, 15.22%, and 50.00% of the soils were heavily, moderately, and lightly contaminated, respectively. Overall, the PN values in most cities were less than two, indicating that the heavy metal accumulation in soil was low in most cities of Xinjiang. However, high PN values were found primarily in Karamay, Changji, Tacheng, and Kashi of south Xinjiang, which was related to the developed activities of the coal-processing industry, extraction of energy sources such as petroleum, busy transportation, and agriculture in these cities.
As shown in the spatial distribution of the soil pollution index of heavy metal in Xinjiang in Figure 4, the PN values of different regions in Xinjiang followed the order: Karamay > Changji > Kashi > Tacheng > Urumqi > Botala > Hami > Altay > Aksu > Turpan > Ili > Bayingolin > Hotan. Karamay, Changji, and Kashi were at heavy pollution levels. Tacheng, Urumqi, Botala, and Hami were at medium pollution levels. Altay, Aksu, Turpan, Ili, Bayingolin, and Hotan areas were at light pollution levels. Karamay is an important national petroleum and petrochemical base and the gathering area of the world petroleum and petrochemical industry, especially in the central-eastern region. It has developed industries, the largest ethylene plant, a 10 million ton oil refinery, a thermal power plant, and other chemical enterprises using oil and coal as raw materials. Therefore, it was inferred that industrial production and urban activities were important factors leading to heavy metal pollution in the region [28,40]. Furthermore, the Zhundong coalfield is located in Changji, where coal mining and industrial activities contributed the highest percentage of heavy metals in soil, reaching 48.52% [41]. Moreover, 32.42% of Cd and Zn in Kashi soil were from industrial and transportation activities [25].
Furthermore, the Pi values in Karamay followed the order of Cd > Cr > Cu > Zn > Ni > Pb. The Pi values in Changji followed the order of Cd > Ni > Cr > Pb > Cu > Zn. The Pi values in Kashi followed the order of Cd > Pb > Cu > Ni > Zn > Cr. The Pi values in Tacheng followed the order of Cd > Zn > Cu > Cr > Pb > Ni. The Pi values in Urumqi followed the order of Cd > Cu > Zn > Ni > Cr > Pb. The Pi values in Botala followed the order of Cd > Pb > Zn > Cu > Ni > Cr. The Pi values in Hami followed the order of Cd > Cu > Zn > Ni > Pb > Cr. The Pi values in Altay followed the order of Cd > Cu > Zn. The Pi values in the Aksu followed the order of Cd > Pb > Zn > Ni > Cu > Cr. The Pi values in Turpan followed the order of Cd > Cr > Ni > Pb. The Pi values in Ili followed the order of Cu > Pb > Ni > Cr > Cd > Zn. The Pi values in Bayingolin followed the order of Cd > Pb > Zn > Ni > Cr > Cu. In general, the degree of soil pollution in Xinjiang followed the order of Cd > Cu > Pb > Ni > Zn > Cr. Peng et al. [8] showed that the pollution level of soil heavy metals in major cities in China was ranked as follows: Cd > Zn > Pb > Cu. Among them, the city with the most serious soil Cd pollution was in Yangzhou. Chen et al. [1] showed that the cumulative index of national farmland soil followed the order of Cd > Hg > Pb > Cu > Zn > As > Cr. Among them, the farmland with the most severe Cd pollution was in Fujian.

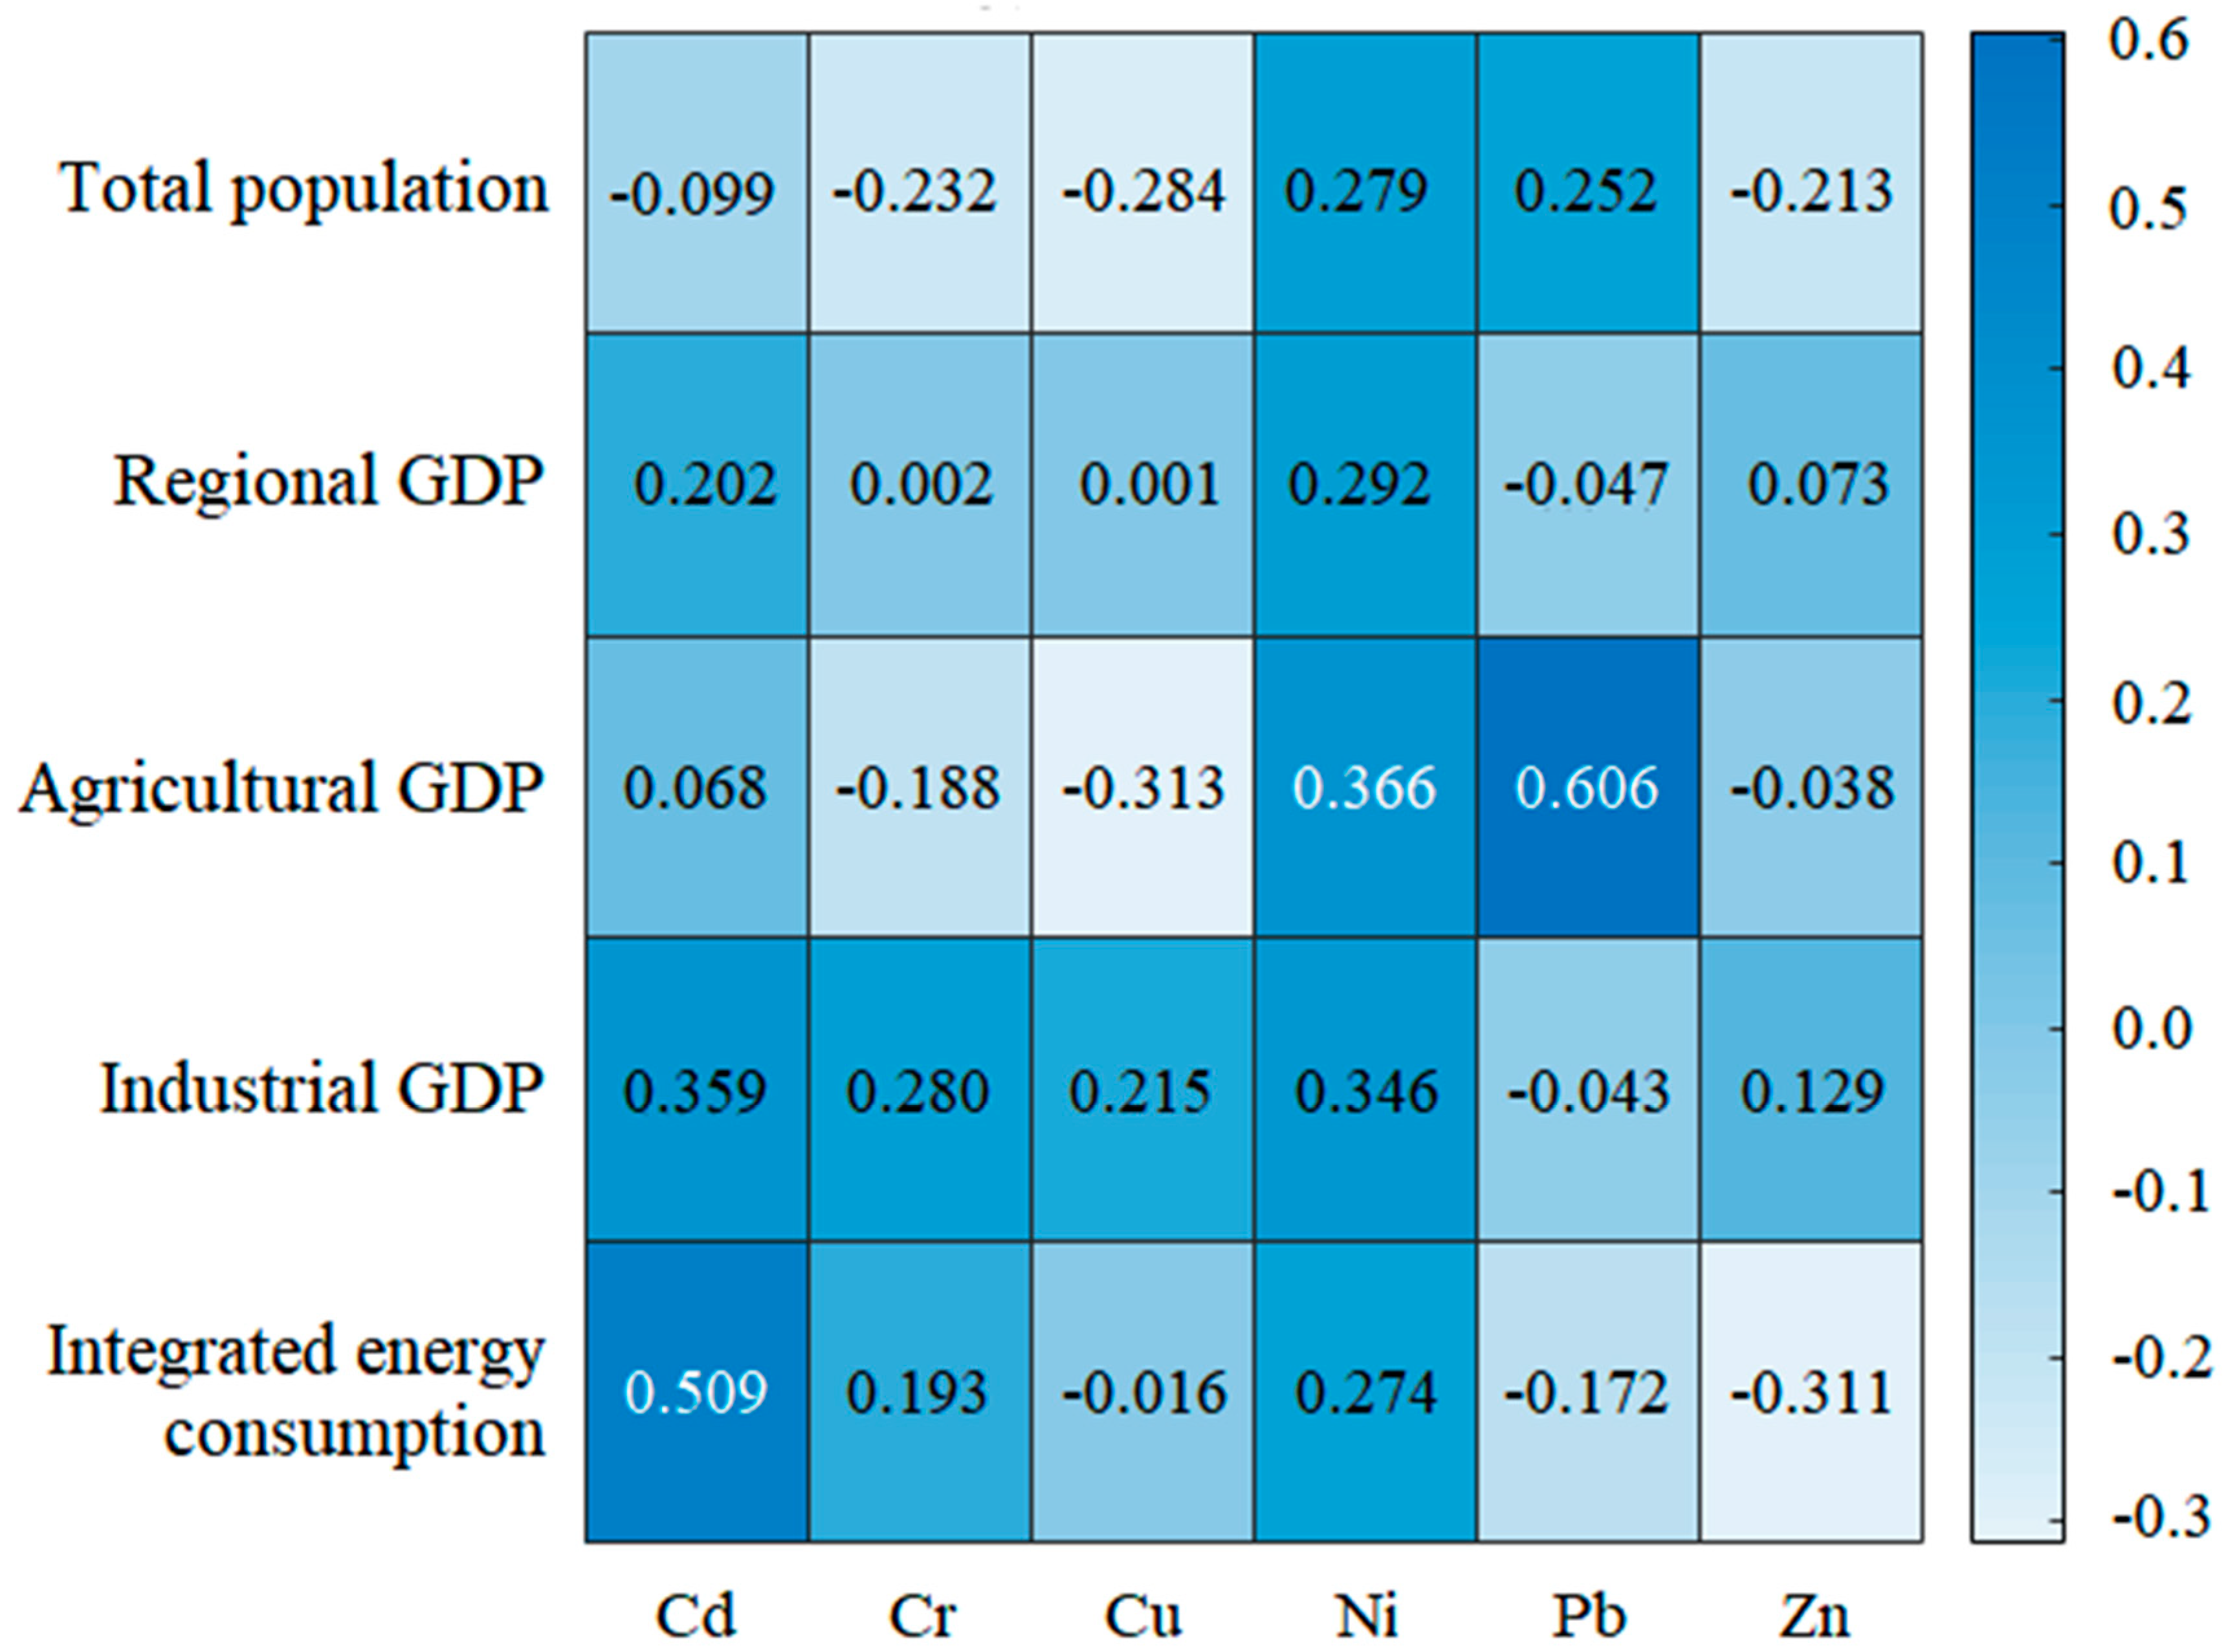
3.5. Impact of Socio-Economic Development on Soil Pollution Due to Heavy Metals in Xinjiang

The results of the correlation analysis between socio-economic development indicators and heavy metal contents in the soils of Xinjiang are shown in Figure 5. The socio-economic development of cities, such as urban resident population and gross national product, reflected the total urban heavy metal emissions to some extent [42]. However, this study showed that the correlation between the contents of six heavy metals in soil and the total population was insignificant, consistent with the results of previous studies [43]. Not all of the contents of the six heavy metals in soil were positively correlated with the urban population and the economic development degree, and some were even negatively correlated. For example, Cd, Cr, Cu, and Zn were negatively correlated with the total population. Cr, Cu, and Pb were negatively correlated with regional GDP. Cr, Cu, and Zn were negatively correlated with agricultural GDP. Pb was negatively correlated with industrial GDP. Cu, Pb, and Zn were negatively correlated with integrated energy consumption. This may be ascribed to economic development that has become more focused on environmental benefits with changes in the economic development stages, and development can no longer be pursued at the expense of the environment and high-quality development [43].
Except for Cd and Pb, the remaining four heavy metal contents were insignificantly correlated with each socio-economic index, which indicated that there were many anthropogenic and natural factors, such as soil background values, soil disturbance, urban development history, sampling locations, and analytical errors, possibly affecting heavy metal contents in soil [8,44,45]. Zhang et al. [38] showed that the high-value distribution of heavy metals occurred in the soil in southwest China due to its original higher background value distribution, but also due to the development of heavy industry and human activities. Chen et al. [39] showed that the heavy metal content in the soil in Yutian County of Xinjiang showed a clear demarcation between agricultural and non-agricultural land.
This study mainly used literature review data to collect limited soil sample heavy metal data and obtained the spatial distribution of heavy metals in the soils of Xinjiang through analysis and interpolation. Among them, there were more and more sample points in the northwest of Xinjiang due to more research, while there were fewer sample points in the southeast of Xinjiang due to less relevant research, which to some extent had a certain impact on the results. For example, there were few sample points in Bayingolin, Turpan, and Hami, and the interpolation analysis was affected by the high-value distribution of heavy metals in Karamay and Changji, which caused the result of an overall high content of heavy metals in its soil. In the literature research consulted, areas with significant heavy metal pollution in the soil were often considered as research areas, so the results obtained in this study will inevitably be on the high side.

4. Conclusions

Based on geostatistics, GIS spatial analysis, and correlation analysis, this study highlighted the spatial heterogeneity of heavy metal pollution in large-scale soils and analyzed the spatial distribution, pollution characteristics, and the impact of socio-economic activities on the accumulation of six heavy metals in soil in Xinjiang.
(1)
The average values of Cd, Cr, Cu, Ni, Pb, and Zn in the soils were 2.858, 1.062, 1.194, 1.159, 1.192, and 1.086 times the background values in Xinjiang, respectively. The Cd and Pb block gold coefficients were greater than 25% and less than 50%, indicating an obvious spatial correlation between Cd and Pb in soil due to the joint action of anthropogenic and natural factors.
(2)
The proportion of soil pollution due to heavy metals in Xinjiang was 89.13%, with an overall trend of decrease from north to south. Karamay, Changji, and Kashi were at heavy pollution levels, and the pollution degree of each heavy metal followed the order of Cd > Cu > Pb > Ni > Zn > Cr.
(3)
The heavy metal Pb in soil was significantly and positively correlated with the agricultural GDP with a 0.605 correlation coefficient. Cd was significantly and positively correlated with comprehensive energy consumption with a 0.518 correlation coefficient. Additionally, Cd was more significantly correlated with the industrial GDP. Therefore, agricultural activities, comprehensive energy consumption, and industrial production were the main socio-economic factors affecting the heavy metal content in the soil in Xinjiang.
This study is of great significance for understanding the spatial distribution characteristics of heavy metals in the soils of Xinjiang at a macro scale and the impact of human activities. It also provides a scientific basis for the prevention and control of heavy metal pollution in local soil and the evaluation of soil environmental quality.

Author Contributions

Conceptualization, X.Z. and Y.L.; formal analysis, G.F. and Y.L.; investigation, J.X. and J.C.; resources, Y.Z. and F.L.; data curation, Y.L., X.Z. and G.F.; writing—original draft preparation, Y.L.; writing—review and editing, X.Z. and G.F.; visualization, Y.Z. and Y.L.; supervision, X.Z. and G.F.; project administration, Y.L., X.Z. and G.F. All authors have read and agreed to the published version of the manuscript.

Funding

This work was supported by the project of the Natural Science Foundation of Xinjiang Uygur Autonomous Region (No. 2020D01B02); Special Fund Project for Guiding Local Science and Technology Development by the Central Government of Xinjiang Uygur Autonomous Region, China (No. ZYYD2023B16).

Institutional Review Board Statement

Not applicable.

Informed Consent Statement

Not applicable.

Data Availability Statement

Data are contained within the article.

Conflicts of Interest

The authors declare no conflict of interest.

References

  1. Chen, W.X.; Li, Q.; Wang, Z.; Sun, Z.J. Spatial distribution characteristics and pollution evaluation of heavy metals in farmland soil in China. Environ. Sci. 2020, 41, 2822–2833. [Google Scholar]
  2. Wang, Y.Z.; Duan, X.J.; Wang, L. Spatial distribution and source analysis of heavy metals in soils influenced by industrial enterprise distribution: Case study in Jiangsu Province. Sci. Total Environ. 2020, 710, 134593. [Google Scholar] [CrossRef] [PubMed]
  3. Guagliardi, I.; Cicchella, D.; De Rosa, R. A geostatistical approach to assess concentration and spatial distribution of heavy metals in urban soils. Water Air Soil Pollut. 2012, 223, 5983–5998. [Google Scholar] [CrossRef]
  4. Duffus, J.H. “Heavy metals”—A meaningless term? Pure Appl. Chem. 2002, 74, 793–807. [Google Scholar] [CrossRef]
  5. Bi, X.Y.; Liang, S.Y.; Li, X.D. A novel in situ method for sampling urban soil dust: Particle size distribution, trace metal concentrations, and stable lead isotopes. Environ. Pollut. 2013, 177, 48–57. [Google Scholar] [CrossRef]
  6. Niu, L.L.; Yang, F.X.; Xu, C.; Yang, H.Y.; Liu, W.P. Status of metal accumulation in farmland soils across China: From distribution to risk assessment. Environ. Pollut. 2013, 176, 55–62. [Google Scholar] [CrossRef]
  7. Hu, S.M.; Chen, X.M.; Jing, F.; Liu, W.; Wen, X. An assessment of spatial distribution and source identification of five toxic heavy metals in Nanjing, China. Environ. Eng. Res. 2021, 26, 200135. [Google Scholar] [CrossRef]
  8. Peng, C.; He, Y.L.; Guo, Z.H.; Xiao, X.Y.; Zhang, Y. Characteristics and risk assessment of heavy metals in urban soils of major cities in China. Environ. Sci. 2022, 43, 1–10. [Google Scholar]
  9. Su, R.K.; Ou, Q.Q.; Wang, H.Q.; Dai, X.R.; Chen, Y.H.; Luo, Y.T.; Yao, H.S.; Ouyang, D.X.; Li, Z.S.; Wang, Z.X. Organic-inorganic composite modifiers enhance restoration potential of Nerium oleander L. to lead-zinc tailing: Application of phytoremediation. Environ. Sci. Pollut. Res. 2023, 30, 56569–56579. [Google Scholar] [CrossRef]
  10. He, L.J.; Su, R.K.; Chen, Y.H.; Zeng, P.; Du, L.; Cai, B.; Zhang, A.S.; Zhu, H.H. Integration of manganese accumulation, subcellular distribution, chemical forms, and physiological responses to understand manganese tolerance in Macleaya cordata. Environ. Sci. Pollut. Res. 2022, 29, 39017–39026. [Google Scholar] [CrossRef]
  11. Dai, L.J.; Wang, L.Q.; Li, L.F.; Liang, T.; Zhang, Y.Y.; Ma, C.X.; Xing, B.S. Multivariate geostatistical analysis and source identification of heavy metals in the sediment of Poyang Lake in China. Sci. Total Environ. 2018, 621, 1433–1444. [Google Scholar] [CrossRef] [PubMed]
  12. Huang, T.; Deng, Y.H.; Zhang, X.L.; Wu, D.S.; Wang, X.L.; Huang, S. Distribution, source identification, and health risk assessment of heavy metals in the soil-rice system of a farmland protection area in Hubei Province, Central China. Environ. Sci. Pollut. Res. 2021, 28, 68897–68908. [Google Scholar] [CrossRef] [PubMed]
  13. Wu, W.; Xie, D.Y.; Liu, H.B. Spatial variability of soil heavy metals in the three gorges area: Multivariate and geostatistical analyses. Environ. Monit. Assess. 2009, 157, 63–71. [Google Scholar] [CrossRef] [PubMed]
  14. Borkowski, A.S.; Kwiatkowska-Malina, J. Geostatistical modelling as an assessment tool of soil pollution based on deposition from atmospheric air. Geosci. J. 2017, 21, 645–653. [Google Scholar] [CrossRef]
  15. Reza, S.K.; Baruah, U.; Singh, S.K.; Das, T.H. Geostatistical and multivariate analysis of soil heavy metal contamination near coal mining area, Northeastern India. Environ. Earth Sci. 2015, 73, 5425–5433. [Google Scholar] [CrossRef]
  16. Thomas, I.H.L.; Bautista, F.; Ruíz, F.R.C.; Delgado, M.D.; Owen, P.Q.; Aguilar, D.; Goguitchaichvili, A. Concentration of toxic elements in topsoils of the metropolitan area of Mexico City: A spatial analysis using ordinary kriging and indicator kriging. Rev. Int. Contam. Ambient. 2015, 31, 47–62. [Google Scholar]
  17. Mahmoudabadi, E.; Sarmadian, F.; Moghaddam, R.N. Spatial distribution of soil heavy metals in different land uses of an industrial area of Tehran (Iran). Int. J. Environ. Sci. Technol. 2015, 12, 3283–3298. [Google Scholar] [CrossRef]
  18. Du, H.L.; Wang, J.S.; Wang, Y.; Yao, Y.B.; Liu, X.Y.; Zhou, Y. Contamination characteristics, source analysis, and spatial prediction of soil heavy metal concentrations on the Qinghai-Tibet Plateau. J. Soil. Sediment. 2023, 23, 2202–2215. [Google Scholar] [CrossRef]
  19. Castañeda-Espinoza, J.; Salinas-Sánchez, D.O.; Mussali-Galante, P.; Castrejón-Godínez, M.L.; Rodríguez, A.; González-Cortazar, M.; Zamilpa-Alvarez, A.; Tovar-Sánchez, E. Dodonaea viscosa (Sapindaceae) as a phytoremediator for soils contaminated by heavy metals in abandoned mines. Environ. Sci. Pollut. Res. 2023, 30, 2509–2529. [Google Scholar] [CrossRef]
  20. Tong, Y.L.; Yue, T.; Gao, J.J.; Wang, K.; Wang, C.L.; Zuo, P.L.; Zhang, X.X.; Tong, L.; Liang, Q.M. Partitioning and emission characteristics of Hg, Cr, Pb, and as among air pollution control devices in Chinese coal-fired industrial boilers. Energy Fuels 2020, 34, 7067–7075. [Google Scholar] [CrossRef]
  21. Eziz, M.; Mohammad, A.; Mamut, A.; Hini, G. A human health risk assessment of heavy metals in agricultural soils of Yanqi Basin, Silk Road Economic Belt, China. Hum. Ecol. Risk Assess. 2018, 24, 1352–1366. [Google Scholar] [CrossRef]
  22. Mamut, A.; Eziz, M.; Mohammad, A.; Anayit, M.; Rixit, A. Contamination and risk assessment of heavy metals in farmland soils of Baghrash County, Xinjiang, Northwest China. Sci. Cold Arid. Reg. 2017, 9, 467–475. [Google Scholar]
  23. Mamut, A.; Eziz, M.; Mohammad, A. Pollution and ecological risk assessment of heavy metals in farmland soils in Yanqi County, Xinjiang. Eurasian Soil Sci. 2018, 51, 985–993. [Google Scholar] [CrossRef]
  24. Li, Y.F.; Zhou, P.; Shen, X.Y.; Zhao, K. Molybdenum fertilizer improved antioxidant capacity of Chinese merino sheep under compound contamination. Biol. Trace Elem. Res. 2023, 201, 1717–1725. [Google Scholar] [CrossRef] [PubMed]
  25. Turhun, M.; Eziz, M. Identification of the distribution, contamination levels, sources, and ecological risks of heavy metals in vineyard soils in the main grape production area of China. Environ. Earth Sci. 2022, 81, 40. [Google Scholar] [CrossRef]
  26. Sawut, R.; Kasim, N.; Maihemuti, B.; Hu, L.; Abliz, A.; Abdujappar, A.; Kurban, M. Pollution characteristics and health risk assessment of heavy metals in the vegetable bases of northwest China. Sci. Total Environ. 2018, 642, 864–878. [Google Scholar] [CrossRef]
  27. Li, Y.W.; Mo, Z.X.; Xue, J.P.; Zhang, L.; Zha, X.H. Pollution evaluation and source apportionment of heavy metals in soils from Kashi region, Xinjiang, China. J. Arid Land Resour. Environ. 2020, 34, 147–153. [Google Scholar]
  28. Zhang, H.W.; Zhang, F.; Song, J.; Tan, M.L.; Kung, H.T.; Johnson, V.C. Pollutant source, ecological and human health risks assessment of heavy metals in soils from coal mining areas in Xinjiang, China. Environ. Res. 2021, 202, 111702. [Google Scholar] [CrossRef]
  29. Wang, W.; Lai, Y.S.; Ma, Y.Y.; Liu, Z.L.; Wang, S.F.; Hong, C.L. Heavy metal contamination of urban topsoil in a petrochemical industrial city in Xinjiang, China. J. Arid Land 2016, 8, 871–880. [Google Scholar] [CrossRef]
  30. Rong, B.; Chu, C.J.; Zhang, Z.; Li, Y.T.; Yang, S.H.; Wang, Q. Assessing the coordinate development between economy and ecological environment in China’s 30 Provinces from 2013 to 2019. Environ. Model. Assess. 2023, 28, 303–316. [Google Scholar] [CrossRef]
  31. Wang, X.L.; Sun, Y.J.; Zhang, L.P.; Mei, Y.A. Spatial variation and influence factor analysis of soil heavy metal As based on geoDetector. Stoch. Environ. Res. Risk Assess. 2021, 35, 2021–2030. [Google Scholar] [CrossRef]
  32. Chen, Q.Q.; Taylor, D. Economic development and pollution emissions in Singapore: Evidence in support of the Environmental Kuznets Curve hypothesis and its implications for regional sustainability. J. Clean. Prod. 2020, 243, 118637. [Google Scholar] [CrossRef]
  33. Website of the People’s Government of Xinjiang Uygur Autonomous Region. Statistical Bulletin on National Economic and Social Development of Xinjiang Uygur Autonomous Region in 2022 (28 March 2023). 2023. Available online: http://www.xinjiang.gov.cn/xinjiang/tjgb/202303/a527e6eb22524c40bc7fca952a05710e.shtml (accessed on 20 July 2023).
  34. Wang, S.; Cai, L.M.; Wang, Q.S.; Luo, J.; Tang, C.H.; Mu, G.Z.; Jiang, H.H.; Liu, T.Y. Spatial distribution and accumulation of heavy metals in urban surface dust of China. Geogr. Res. 2018, 37, 1624–1640. [Google Scholar]
  35. Ju, Q.D.; Hu, Y.B.; Xie, Z.G.; Liu, Q.M.; Zhang, Z.G.; Liu, Y.; Peng, T.S.; Hu, T.F. Characterizing spatial dependence of boron, arsenic, and other trace elements for Permian groundwater in Northern Anhui plain coal mining area, China, using spatial autocorrelation index and geostatistics. Environ. Sci. Pollut. Res. 2023, 30, 39184–39198. [Google Scholar] [CrossRef]
  36. China National Environmental Monitoring Centre. Background Values of Soil Elements in China; China Environmental Science Press: Beijing, China, 1990. [Google Scholar]
  37. Guo, H.; Sun, Y.J.; Wang, X.L.; Zhang, L.P.; Mei, Y.A.; Liu, Q.H.; Wang, Q. Spatial distribution characteristics and source analysis of soil heavy metals in county-level city. Acta Sci. Circumstantiae 2022, 42, 287–297. [Google Scholar]
  38. Zhang, X.M.; Zhang, X.Y.; Zhong, T.Y.; Jiang, H. Spatial distribution and accumulation of heavy metal in arable land soil of China. Environ. Sci. 2014, 35, 692–703. [Google Scholar]
  39. Chen, Y.F.; Zeng, Y.Y.; Zhou, J.L.; Wang, S.T.; Du, J.Y.; Liu, Y.F. Spatial distribution characteristics and influence factors of soil heavy metal contents in oasis area of Yutian County, Xinjiang. Trans. Chin. Soc. Agric. Mach. 2019, 50, 263–273. [Google Scholar]
  40. Lai, Y.S.; Ma, Y.Y.; Wang, W.; Wang, S.F.; Hong, C.L.; Shi, L. Assessment of heavy metal pollution and potential ecological risks of soils in Shawan of Xinjiang. J. Shihezi Univ. 2016, 34, 518–523. [Google Scholar]
  41. Biral, I.; Abdu, A.A.; Shi, Q.D.; Liu, S.H.; Nigati, K.; Li, H. Pollution and source identification of heavy metals in surrounding soils of Eastern Junggar Coalfield based on PMF model. Trans. Chin. Soc. Agric. Eng. 2019, 35, 185–192. [Google Scholar]
  42. Jiang, Y.T.; Sun, Y.J.; Zhang, L.P.; Wang, X.L. Influence factor analysis of soil heavy metal Cd based on the GeoDetector. Stoch. Environ. Res. Risk Assess. 2020, 34, 921–930. [Google Scholar] [CrossRef]
  43. Liu, J.; Chen, X.L.; Fan, Y.F.; Chen, X.W. Spatial distribution characteristics and influencing factors of heavy metals in urban park dust in China. Environ. Chem. 2022, 41, 450–459. [Google Scholar]
  44. Zhang, X.X.; Zha, T.G.; Guo, X.P.; Meng, G.X.; Zhou, J.X. Spatial distribution of metal pollution of soils of Chinese provincial capital cities. Sci. Total Environ. 2018, 643, 1502–1513. [Google Scholar] [CrossRef]
  45. Qishlaqi, A.; Moore, F.; Forghani, G. Characterization of metal pollution in soils under two landuse patterns in the Angouran region, NW Iran; a study based on multivariate data analysis. J. Hazard. Mater. 2009, 172, 374–384. [Google Scholar] [CrossRef]
Figure 1. Distribution of sampling points.
Sustainability 15 16379 g001
Figure 2. Spatial distribution of six heavy metals in soil.
Sustainability 15 16379 g002
Figure 3. Spatial distribution of heavy metals PN in soils.
Sustainability 15 16379 g003
Figure 4. Spatial distribution of soil heavy metal PN in soils of different regions.
Sustainability 15 16379 g004
Figure 5. Correlation between socio-economic development and heavy metals in Xinjiang.
Sustainability 15 16379 g005
Table 1. Main indicators of Xinjiang’s economic development.
RegionTotal PopulationRegional GDP/ MillionAgricultural GDP/MillionIndustrial GDP/MillionIntegrated Energy Consumption/Million Tons of Standard Coal
Aksu2,561,674122,242.5727,573.2838,418.304.50
Altay657,26533,916.125650.1412,256.830.68
Bayingolin1,285,700114,934.1917,431.1461,407.447.78
Botala475,48335,429.186830.798960.540.77
Changji1,603,900132,474.0021,507.2055,408.3435.02
Hami557,60060,481.534126.9034,114.849.68
Hotan2,522,80037,764.786871.775721.780.52
Kashi4,624,000104,832.2029,592.8119,987.311.13
Karamay462,34797,292.521604.4866,966.2911.23
Tacheng910,80069,658.1824,788.1415,504.911.72
Turpan633,40038,448.095397.0616,963.617.00
Urumqi3,552,000341,325.872769.9890,613.8219.83
Ili4,556,800119,070.5420,533.8829,386.577.49
Note: The above data were from the Statistical Yearbook of Xinjiang Uygur Autonomous Region Statistical Bureau for each city.
Table 2. Descriptive statistics of heavy metals in the soil.
Heavy
Metal
Sample PointsMinimum ValueMaximum ValueMean Value/
mg/kg
Standard DeviationVariation
Coefficient
SkewnessKurtosisThe Background Values in Xinjiang/
mg/kg
Average Value of Our Agricultural Soil mg/kg [1]China Urban Soil Mean mg/kg [8]
Cd790.0301.2700.3430.2870.8371.4061.3330.120.240.49
Cr911.410117.86052.37323.9070.4560.4590.68849.359.97-
Cu850.92574.60931.87815.1210.4740.8100.59926.728.9142.1
Ni600.87755.40029.20410.2820.352−0.1070.57225.2--
Pb911.51358.97023.12712.8050.5541.0530.79319.432.7358.5
Zn740.593136.00074.73230.8310.413−0.123−0.11568.886.52156.3
Table 3. Optimum theoretical semi-variogram model and corresponding parameters.
ElementP(k-S)Distribution
Type
Theory
Models
Nugget ValueAbutment ValueNuggets of Gold
Coefficient/
Variable Range/Decisions
Coefficient
Residuals
Square
RMSSE
C0C0 + C%kmR2RSS
Cd0.000Logarithmic
Normal
Spherical0.0700.14049.64%150.60.7359.01 × 10−41.129
Cr0.112NormalExponential0.0080.1256.47%43.90.8418.76 × 10−41.024
Cu0.079NormalGaussian0.0720.13155.02%347.10.7626.16× 10−41.027
Ni0.809NormalExponential0.0160.11913.26%24.20.7131.43 × 10−20.965
Pb0.029Logarithmic
Normal
Spherical0.0460.09747.93%146.80.8951.92 × 10−40.939
Zn0.964NormalSpherical0.1300.24453.41%611.50.7322.72 × 10−40.894
Table 4. Heavy metal content of soil in Xinjiang.
RegionsCdCrCuNiPbZn
Aksu0.2246.3928.4628.5527.4389.17
Altay0.2453.2836.2722.1119.9677.48
Bayingolin0.1748.4023.7126.9124.0576.85
Botala0.4047.0434.2226.8326.4393.48
Changji0.7162.4626.8733.8022.1448.77
Hami0.3919.1634.3113.578.1243.06
Hotan0.1350.5519.2025.2517.1055.82
Kashi0.6035.8531.0429.8926.1266.56
Karamay0.70109.9556.8339.0425.53111.55
Tacheng0.4261.4038.5232.3023.77101.94
Turpan0.1959.00-21.0013.41-
Urumqi0.4148.1933.5128.3214.9382.89
Ili0.1359.2236.9332.9626.0473.90
Average value0.3653.9133.3227.7321.1676.79
Maximum value0.71109.9556.8339.0427.43111.55
Minimum value0.1319.1619.2013.578.1243.06
The background values in Xinjiang0.1249.326.725.219.468.8
Note: The above data are from Xinjiang from published literature; “-” is no data.
Disclaimer/Publisher’s Note: The statements, opinions and data contained in all publications are solely those of the individual author(s) and contributor(s) and not of MDPI and/or the editor(s). MDPI and/or the editor(s) disclaim responsibility for any injury to people or property resulting from any ideas, methods, instructions or products referred to in the content.

