Abstract
This study analyzed the trends and changes in climate-sensitive plants based on environmental attributes, using on-site survey data collected between 2006 and 2018. In combination with environmental attributes, 16 plant species were chosen as climate-sensitive biological indicator species and were spatially distributed based on national ecological survey data. With the use of regression methods and locally weighted scatterplot smoothing, possible changes in the vegetation distribution trends were simulated. The findings indicated that annual rainfall and temperature are critical environmental attributes, as they mostly affect the plant ecosystem. The simulated results suggest that plant habitats for the selected 16 individual species tend to be found in higher temperature zones, with a few exceptions. However, there was no clear pattern of the effects of annual rainfall on climate-sensitive plant species. The effects of climate change on these species are a risk to the environment; however, depending on the situation, adequate adaptation and management plans could provide opportunities for policy makers to make evidence-based decisions.
1. Introduction
Owing to its geographical location, the Korean peninsula is associated with climate variability and diverse flora and fauna. There have been numerous attempts to identify the impact of the current climate change on predictions about future vegetation. Monitoring natural habitats is an important process for sustaining wildlife and vegetation. Therefore, species distribution is key to understanding the complexity of natural habitats, and models of this have drawn considerable attention for predicting the flora environment in various scenarios as a result of climate change [1,2,3,4].
Internationally, a lot of countries introduced their own ecological management system to maintain environmentally sustainable and sound habitats including their own flora and fauna. The Ministry of Environment (MoE) in Korea also publishes the climate-sensitive biological indicator species (CBIS) for governmental watchlists, targeting changes or projected changes in seasonal distribution, numbers, and sizes caused by climate change. This includes 18 vertebrates, 44 plants, and 10 fungus/seaweeds (https://species.nibr.go.kr/index.do accessed on 3 November 2023). Despite the fact that monitoring these species is key to maintaining locally characterized habitats, a comprehensive chorological or species-oriented review has not been conducted, to date.
Under the guidance of the MoE, government agencies, such as the National Institute of Ecology, conduct national surveys to identify and analyze national flora and fauna. For instance, a large number of plant surveyors are sent out to fields to identify individual plant species; therefore, such information is solid evidence of plant distribution on the Korean peninsula [5]. The survey information also contains locations that potentially provide habitat suitability in conjunction with environmental variables. This periodical survey has been the foundation of national ecological degree maps, which are essential for the maintenance of national flora and fauna. In particular, field survey information on flora is valuable evidence-based data that can be suitably implemented in relation to different habitat, distribution, and climate-change issues [6].
Together with solid evidence-based survey data on individual species, reviewing the trend of such indicators of key environmental attributes can be a strong reference for habitat suitability projections and maintenance of the Korean peninsula. Therefore, the study aims to explore trends in the distribution of climate-sensitive species in conjunction with key environmental variables, such as rainfall and temperature, which have been identified through a literature review. Further, findings in the current paper are based on strong evidence-based data that were collected by human surveyors in the field over several years.
Therefore, this study investigated the distribution of climate-sensitive species using field survey data accumulated over several years in relation to environmental variables. The flowchart of this study is shown in Figure 1. After interpolating the environmental variables in GIS, the study employed statistical methods using nonparametrically estimated trends via locally weighted scatterplot smoothing (LOESS) for 16 individual indicator species designated by the MoE. Although LOESS cannot reveal any specific numerical details of the relationships between responses and predictors, its implementation provides an overall impression of trends without fitting parametric models and allows for flexibility in interpreting the overall trends. This can be an effective way of exploring trends in habitat changes for specific plants, particularly when considering key environmental attributes such as rainfall and temperature. Therefore, in this study, annual average temperature and annual average rainfall were implemented as environmental attributes.
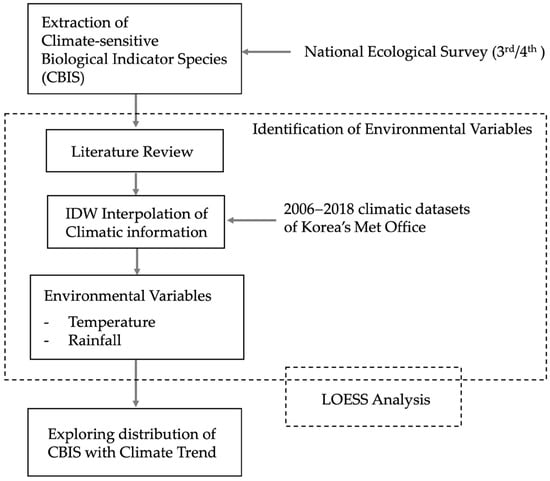
Figure 1.
Research flow chart.
2. Climate-Sensitive Species and Environmental Variables
Recently, a lot of research has focused on habitat suitability and vegetation distributions. With regard to climate change, the vegetation distribution of sensitive species was investigated within the Tibetan plateau areas [1]. Implementing BIOME4 models in areas of high altitude, the simulated results illustrate a reduction in alpine meadows, steppes, sparse and cushion vegetation, and deserts. These models clearly showed increases and decreases in various types of vegetation in response to climate change in the region. There have been several studies on the distribution of vegetation. Calef et al. [7] investigated plant distribution in the Alaska region by using a logistic regression approach. This study aimed to understand the impact of recent climate change on vegetation. In particular, a logistic regression method was used to predict the potential distribution of various vegetation types. Meanwhile, plant distribution was examined using time-series methods [8]. Implementing MAPSS models, researchers found changes in potential equilibrium distribution and time-dependent changes in vegetation in the United States. Another study based in Estonia used a time-series analysis to examine the effects of climate change on plant, bird, and fish populations over 35 years [9]. Moreover, a study also investigated carbon and fire distribution [10]. Vegetation-specific research was conducted in a California region based on 30 years of time-series data and the elevation of plants. Researchers set up two different scenarios, and employed the MAPSS-CENTURY 1 vegetation modeling method [11]. To identify critical species for climate change, a study based in the Netherlands selected specific plant species using several steps including climate sensitivity, habitat constraints, and suitability for monitoring [12]. For example, lichen was tested as a bio-indicator for assessing climate change and air-pollution vulnerability [13]. The physical, chemical, and biological parameters of lichen were assessed against air pollution. Historically, olive trees have also been examined as climate change indicators in the Mediterranean regions. Reconstructing various models from the Medieval Climate Anomaly and Little Ice Age, future olive-growing areas are expected to expand northward by 2100. This research provides a historical methodology for examining vegetation distribution.
In the southern hemisphere, research in Australia used long-term flowering plants on the Victorian Coast as biological indicators of climate change [14]. The research emphasized that the acquisition of data is critical, especially for longitudinal databases, which are not often available in the southern hemisphere. Six flowering plants—Atriplex paudosa R.BR., Dendrophthoe vittelina (F.Muell) Tiegh, Lepidium foliosum Desv., Logania ovata R.Br., Pultenaea prolifera H.B.Will., and Spinifex sericeus R.Br.—were used as bio-indicators to perform a regression analysis, further demonstrating the use of sensitive indicator species in similar research. Another study conducted in Sweden [15] investigated the variation in vegetative and flowering phenology triggered by recent climate change. Environmental variables in the research included local environment, plant size, and flowering time of Actaea spicata. Even though no environmental factors directly affected flowering time, high potassium concentrations and being south-facing made the plant emerge early. A study in the Rocky Mountain regions of the US investigated the changes in populations and elevation ranges of two North American conifers [16]. The results indicated that tree distributions are significantly affected by moisture, and climate conditions are more suitable for the habitat of limber pine than Engelmann spruce, due to the warming or watering-induced changes. A similar study [17] examined the responses of alpine summit vegetation to climate change in the region between a subtropical and tropical humid environment. A study in Taiwan implemented two indicators of thermophilic and mesophilic bacteria to evaluate the impact of climate change on six summits. Furthermore, the recent drop in Populus tremuloides numbers in North America was investigated in relation to climate change [18], with indices of moisture stress and insect defoliation examined as potential reasons for the decline.
For many years, time-series smoothing methods have been used extensively to reduce noise and extract plant phenological parameters [19]. However, in the comparison between environmental attributes and investigating trends of plant habitats, little research has been carried out with line-smoothing methods. This paper shows that the large number of studies conducted on vegetation habitat suitability in conjunction with environmental variables such as temperature and rainfall are mostly based on remote-sensing datasets. Some are based on evidence on the ground; however, those studies are focused on numerical details rather than investigating overall trends.
3. Methodology
The current study explored and examined trends in climate-sensitive vegetation, while accounting for climate attributes. Recently, the use of global climate data such as WorldClim and Biomod2 has become popular, but in this study, data measured by national automatic weather stations in the Korea Meteorological Administration (KMA) were used. This makes it possible to see the effects of climate factors on a precise scale. Many studies have confirmed the impact of climate data on plant habitats, among which annual average temperature and annual precipitation were found to be the main elements [2,4,20,21,22,23]. Therefore, the paper identified two important environmental elements—annual average temperature and rainfall. The study area covers the South Korean Peninsula, including associated major islands. The geographical data of approximately 100,210 square kilometers were supplied by the Ordnance Survey of Korea. The Korean Peninsula has a temperate climate, and because of its location and the peninsula’s characteristics [24], there are clear and varying climatic changes and seasons: spring, summer, autumn, and winter, which are affected by Siberia and the Pacific Ocean. In particular, the average annual temperature in Korea is 7~15 °C (August, the hottest month: 19.7~26.7 °C; January, the coldest month: −6.9~3.6 °C); annual precipitation is 1306.3 mm, but summer precipitation accounts for 54% (KMA, http://www.weather.go.kr accessed on 3 November 2023). In addition, the annual average humidity ranges from 59 to 75%, and from July to August it is high, at 78 to 79%. Owing to such climatic characteristics, the Korean Peninsula has a strong biodiversity of native and endemic species, including approximately 3034 species of vascular plants throughout the peninsula.
3.1. National Ecological Survey and Climate-Sensitive Species
The Korean Central Government has administered a periodical ecological survey every five years since 1986. It is performed by the National Ecological Institute, MoE, based on statutory legislation. This extensive national survey on flora and fauna is composed of an on-site field survey and conducted by highly trained surveyors; therefore, it is considered highly accurate, and provides strong evidence of the natural habitat on the Korean Peninsula.
Since the start of the survey in 1986, it has been improved in terms of the number of survey personnel and methodology. In this paper, the 3rd survey (2006–2013) and 4th survey (2014–2018) datasets were used, because several environmental attributes were digitized during this survey period. As a base, a 1:25,000 Digital Elevation Model (DEM) was used and later it was split into 824 individual parts. Each part was further divided into 9 areas to represent where a group of field surveyors conducted the actual work.
In 2017, the National Institute of Biological Resources in Korea published the CBIS, which defines actual or expected changes in biological species by their numbers, habitats, and behaviors caused by climate change. Those species become indicators, whose constant surveying and monitoring is a statutory requirement of the central government.
Within CBIS species, 16 woody trees and shrubs were extracted from the periodical National Ecological Survey to investigate how those indicator species have responded to climate change, in particular temperature and rainfall. Table 1 lists the 16 species.

Table 1.
Climate-sensitive Biological Indicator Species (CBIS): 16 plants species extracted from the National Ecological Survey.
A lot of the data from the first and second phases of the National Ecological Survey are unavailable, and have not been digitalized. For this reason, we focused on data from the 3rd (2006–2013, 8-year period) and 4th (2014–2018, 5-year period) surveys, to investigate the impact of climate change on CBIS plants (Table 2).
Table 2.
CBIS data from the 3rd and 4th National Ecological Survey.
As shown in Table 2, the sample size for the 16 individual species is relatively small; however, the purpose of the research is to analyze the impact of climate change over time, and the two phases of the survey will provide data from a 12-year timespan. Moreover, the National Ecological Survey is protected by statutory legislation enacted in 1986, and currently the 6th phase of the survey is on-going. Therefore, analyzing the trends and methodology of climate change impact using these data is appropriate, and adding more datasets over time will allow for enhanced accuracy and validity of the analysis. This process takes time, as it requires performing chronological surveys.
For example, B. ermanii has only 12 observations identified in the 3rd survey, whereas 36 are identified in the 4th survey. Meanwhile, E. japonica has 290 observations surveyed in the 3rd survey and 169 in the 4th.
In terms of geological distribution of the 16 CBIS plant species, the locations cover the entire South Korean Peninsula, as it matches the periodical survey areas (Figure 1 and Figure 2). Moreover, the locations vary, as the field survey is normally conducted within smaller cells, as stated previously.
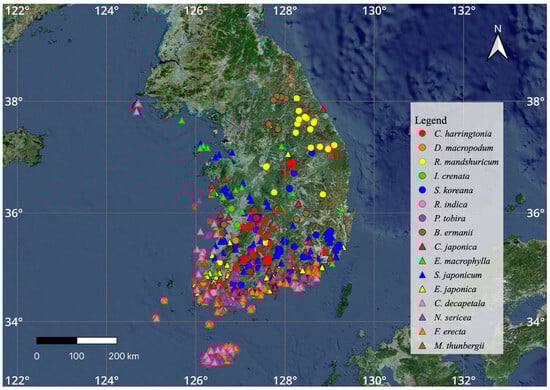
Figure 2.
CBIS locations obtained from the 3rd National Ecological Survey (2006–2013, 8 years).
Figure 2 and Figure 3 illustrate the actual locations of the 16 CBIS plant species identified in the 3rd and 4th survey. This means that these are locations where surveyors found actual physical evidence during the 16 years of the surveys.
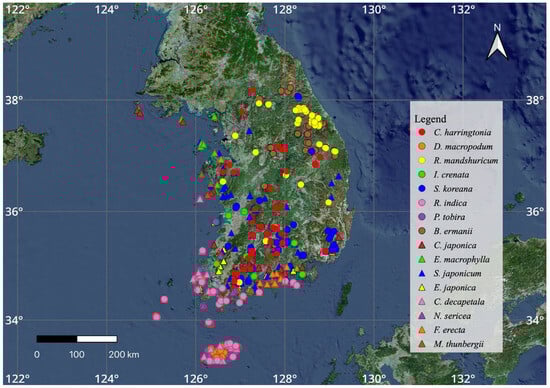
Figure 3.
CBIS locations obtained from the 4th National Ecological Survey (2014–2018, 5 years).
3.2. Environmental Attributes
There are various environmental attributes that could typically affect natural habitats and distributions. Apart from the locations of the 16 CBIS plant species, environmental variables need to be considered when investigating the impact of climate change. An extensive literature review revealed the relationship between the key elements of temperature and rainfall and climate change and its direct effects on the plant community.
The majority of existing research employed climate scenarios with key environmental attributes to run environmental models and determine their predictive potential. For example, most habitat-suitability studies examined general environmental elements [1,7,18], while some also investigated vegetation and soil [1]. Through these study findings, the two environmental attributes of temperature and rainfall were narrowed down, and are those which are most likely to affect CBIS plant habitats, according to the literature.
The climatic attributes of temperature and rainfall were mostly interpolated and extracted by KMA, which collected climatic information from 62 nationwide locations. QGIS was used to merge datasets with CBIS species’ locations, climate, and topography.
3.3. Onsite Survey Information and Trends toward Climate Change
The ordnance location datasets of CBIS plant species were extracted from the 3rd and 4th survey of the National Ecological Survey in .csv format. This file and the associated environmental attributes were merged with the Korean Ordnance Survey, using QGIS.
A literature review was used to identify the most appropriate line-smoothing methods to investigate the trends that impact climate change for the 16 CBIS plant species.
To minimize the noise of the datasets, similar to other studies [19], time-series line-smoothing methods were employed for extracting vegetation distributions. Despite these efforts, research combining the impact of plant habitats on environmental variables has received little attention. The line-smoothing methods included LOESS, Generalized Additive Models (GAM), Linear Model (LM), and Robust-fitting of Linear Models (RLM), in several statistical packages. For datasets with fewer than one thousand samples, the common tool is LOESS, whereas for datasets with more than one thousand samples, GAM is widely implemented [25]. Therefore, LOESS methods were selected for their efficiency and ability to account for the multiple datasets in this study.
Moreover, to compare the attributes identified above, several analysis methods were employed for individual indicator species. For example, between two survey-trend periods, which was a 5-year span for the 3rd and 4th national surveys, the average temperature and rainfall were analyzed, adding the LOESS trends. The main reason LOESS was added to the nonparametric smoothing aspects was its ability to provide flexible support for interpreting overall trends. However, this method does not provide many specifics regarding values associated with the relationships between response and predictors.
LOESS in the R package is a nonparametric smoothing technique that produces smoothed trends by using regression methods on localized subsets of the data.
Initially, three environmental elements: temperature, rainfall, and altitude were explored in this study; however, the lack of data availability on altitude influenced the decision to implement the LOESS analysis on temperature and rainfall attributes only. Moreover, temperature could serve as a substitute for altitude.
For the LOESS analysis, ggplot2 (version 3.4.0) packages were used in the R Studio version build 353 and XQuartz was used to support OpenGL visualization within the macOS environment, with Apple Silicon CPU.
4. Results and Discussion
This study investigates the impact of and trends in temperature and rainfall on CBIS plants. To achieve the analysis, LOESS within ggplot2, R Studio was used. The function in R was as follows:
geom_smooth (method = “loess”)
A LOESS analysis was conducted for each individual CBIS plant species (Table 1), in conjunction with two environmental attributes (Figure 4): annual average temperature and annual rainfall.
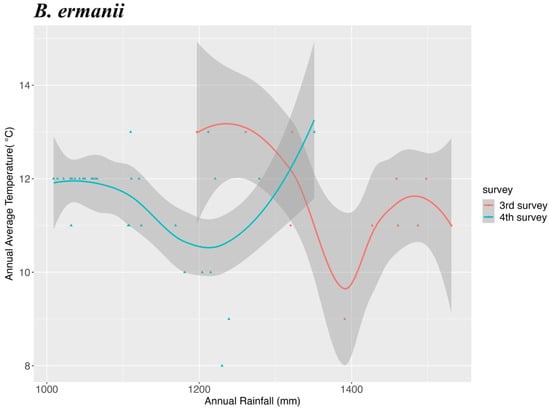
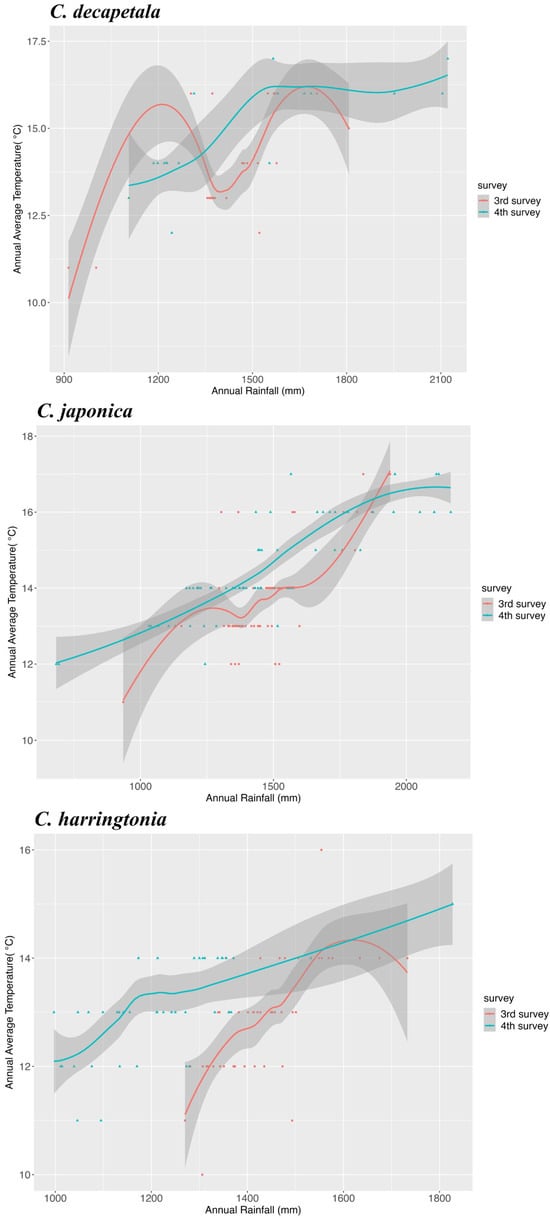
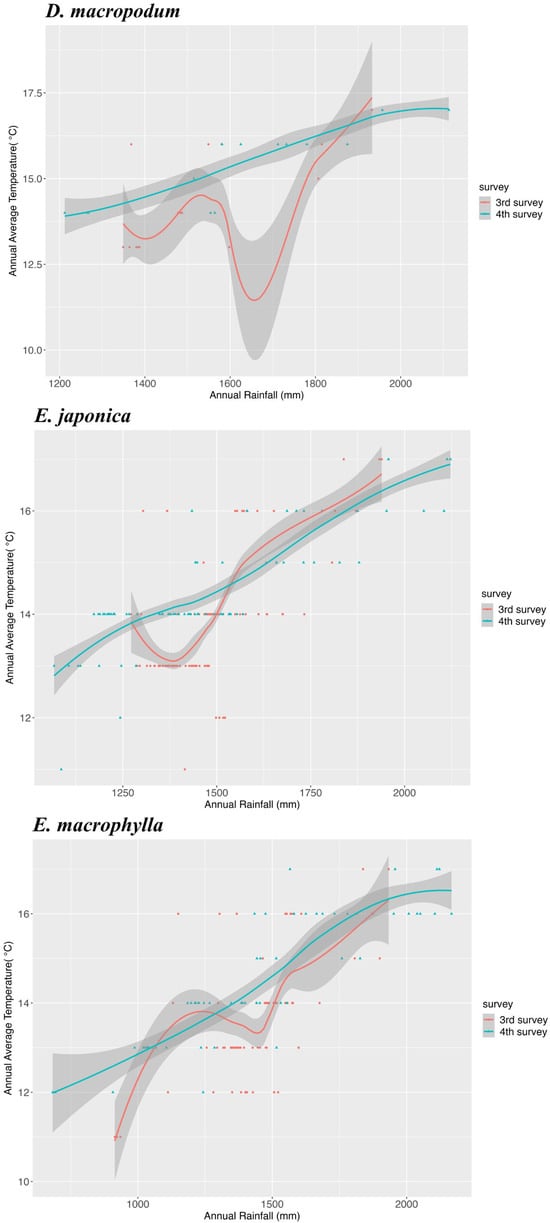
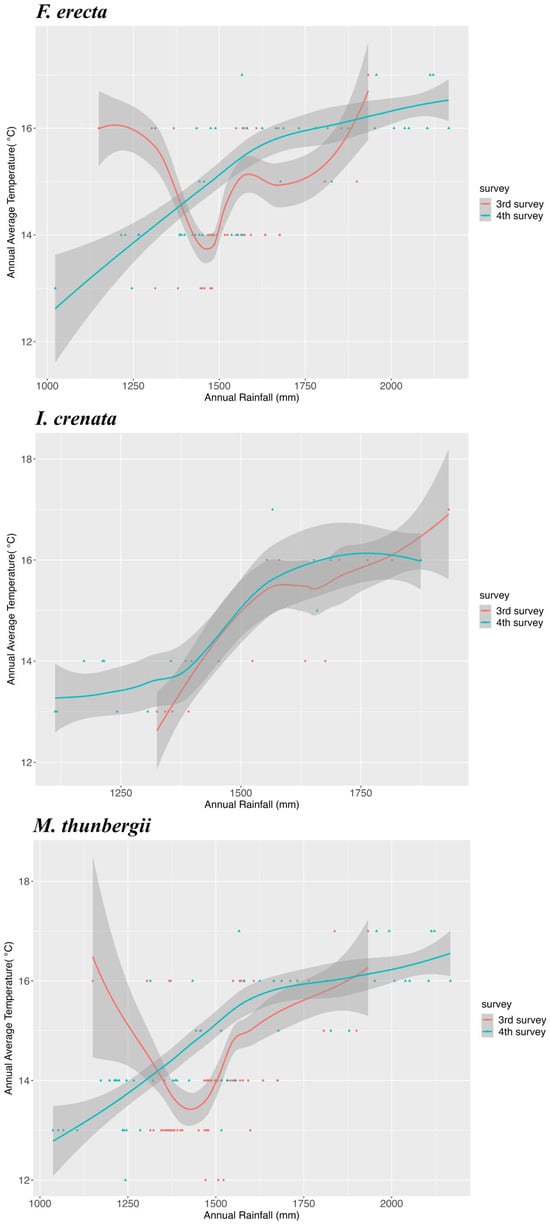
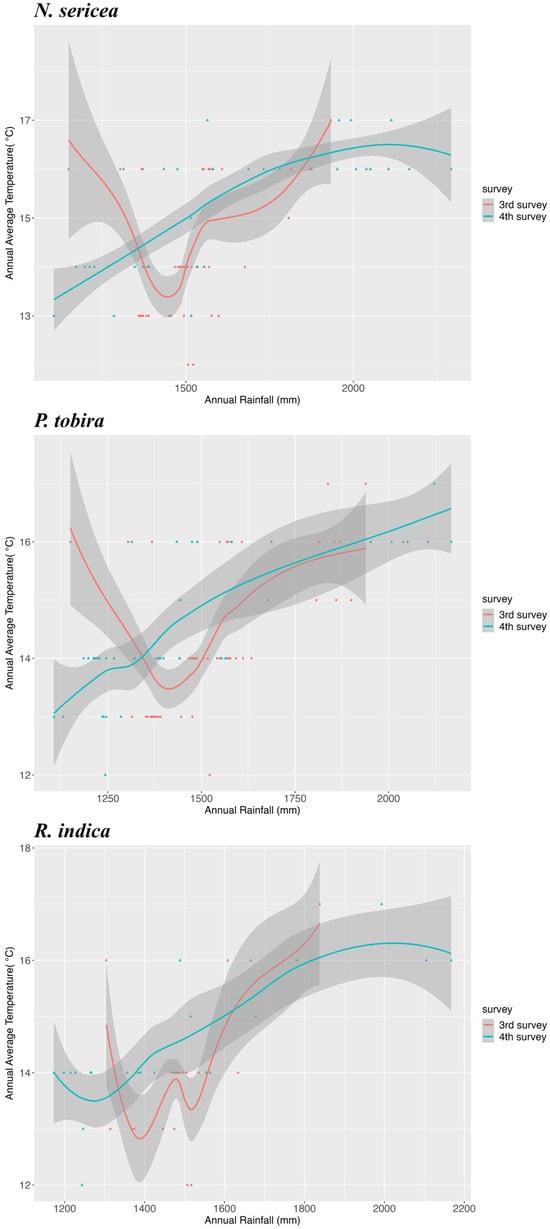
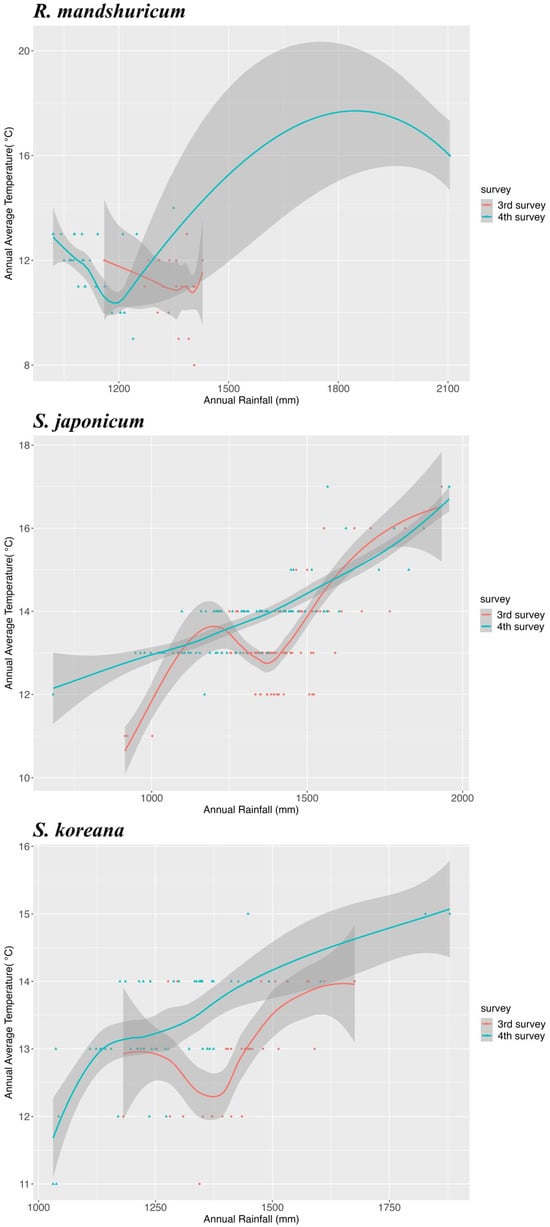
Figure 4.
LOESS analysis comparison of 3rd and 4th Survey.
There are clear color-coded keys provided. The blue dots indicate the third survey values, and red dots indicate the fourth survey results. As stated above, the maximum time span between the two survey phases is 16 years.
The results clearly illustrate time-series trends of the third and fourth survey, in accordance with annual average temperature and annual rainfall. Most CBIS plant species were found in higher-temperature zones as time passed. Some exceptions were B. ermanii and E. japonica. In terms of rainfall, more plants were found in heavier-rainfall areas over time, with the exception of Betula ermanii.
The framework chosen for investigating trends and the impact of climate change on indicator plant species was LOESS, a line-smoothing method. These procedures are based on on-site survey datasets, and this approach has created substantial possibilities for future dealings with the National Ecological Survey, creating trend modeling and enabling future predictions, which is critical for monitoring and maintaining natural habitats.
According to the studies in South Korea using the time-series monitoring of flora and fauna, future biodiversity on the Korean Peninsula is expected to decrease steadily, due to climate change [26]. Furthermore, the decrease in f biodiversity was the highest among the estimated costs of climate change-induced damage [27].
As the results indicated, CBIS plant species change according to the current climate trends. There were clear shifting trends in CBIS plant habitats as more specimens were surveyed where there was more rainfall and higher-temperature zones. It is a similar result to that of Kang et al., who analyzed habitat change for Kalopanax septemlobus, and potential plant habitat change can be accelerated by climate change [23]. However, there are a few species that do not fall into this trend, such as B. ermanii, although the impact of climate change on trends for these species is also apparent over time. Therefore, as future data accumulate, it is necessary to continuously monitor plant habitat change and to establish forest management or conservation strategies, accordingly.
Although the LOESS analysis provides apparent trends, the tradeoff of this analysis is clear; LOESS does not provide detailed numeric values for the trends. Nonetheless, the current paper provides solid evidence using on-site survey data that encompass a 16-year timeframe. In addition, it is significant that more precise plant habitat changes have been confirmed by utilizing the climate data which are established nationwide in South Korea. This enhances the strength of the evidence-based results regarding the impact and trends associated with climate change. The results are also important for setting a framework for future monitoring and maintenance of natural habitats.
The Korean government’s National Ecological Survey has been administered since 1986, and will continue to be conducted every 5 years. This means that more data will be collected, allowing for the analysis of more longitudinal data in the future. Therefore, it is highly critical to establish trend analysis frameworks and continuously monitor such climate change trends, to provide clear direction and guidance for policy makers. In addition, for monitoring the changing climate on the Korean Peninsula in the future, sustainable guidelines for CBIS and other protected species should be prepared accordingly. In future studies, the analysis of soil and topographic elements on the Korean Peninsula and the long-term future predictions will have to be followed by detailed climate change scenarios.
5. Conclusions
As climate change evolves, investigating vegetation distribution is highly critical for maintaining natural habitats. However, other studies on similar topics were based on remote-sensing data, and focused on numerical analysis. This led to limitations in concrete evidence-based research and in the representation of overall trends on how key environmentally sensitive species have been affected and influenced by critical environmental attributes.
Therefore, the current study aimed to explore trend analyses of vegetation distributions and the impact of key environmental factors. In particular, the research implements periodical on-site survey data, which is a part of the Korean National Ecological Survey scheme, providing concrete evidence-based supports.
To achieve these aims, the study employed LOESS methods in R Studio. Even though this method was unable to provide numerical detailed results, the LOESS’ strength is its ability to compare overall trends among survey data. Key environmental attributes such as temperature and rainfall were identified, based on the literature, and then extracted from datasets published by Korea’s Met Office. CBIS plant species were based on MoE’s list, which selected 16 trees and shrubs. The actual field-survey data of the 16 species’ locations were implemented, and the on-site survey was conducted during the third and fourth phases, which expand over a 16-year spectrum (2006–2018). Examination of the occurrence of these species over time provides useful evidence for the impact of climate change on CBIS plant habitats.
The results illustrate a very clear picture of most CBIS plant species being found within areas with more rainfall and higher temperatures. The impact of climate change on these trends is obvious between 2006 and 2018.
This research showed the trends and impact of climate change, supported by strong evidence acquired from actual field data collected by several experienced surveyors. The results also have important implications for future monitoring of vegetation distribution and the conservation of climate-sensitive species. These findings address a gap in the literature, by conducting a more comprehensive species-oriented review. Also, the unique methods of integration with spatially collected CBIS information could contribute to sustainable plant-species management in relation to critical climate data. Moreover, this methodology and the further integration of climate data can lead to the identification of plant- and habitat-suitability projections in healthy conditions.
Although this research has limitations, it also has strengths. Identifying significant trend and impact analyses based on concrete on-site datasets is highly valuable for maintaining natural habitats and providing guidance for decision makers regarding reactions to climate change. As the National Ecological Survey is an ongoing project, more ecological data will be collected going forward. These data can be highly implementable for demonstrating the impact of climate change. Future research analyzing the data to be gathered should accompany the project, and it is expected to be useful for sustainable forest management and future policy decisions. Hence, establishing effective frameworks for analyzing species and acting on climate change will be a key task for Korea’s wildlife conservation.
Author Contributions
Conceptualization, Y.S. and K.A.; Methodology, Y.S., E.S. and K.A.; Writing—original draft, Y.S. and K.A.; Supervision, S.-W.L. and K.A. All authors have read and agreed to the published version of the manuscript.
Funding
This research received no external funding.
Institutional Review Board Statement
Not applicable.
Informed Consent Statement
Not applicable.
Data Availability Statement
The data presented in this study are available on request from the corresponding author.
Acknowledgments
This research was supported by Korea Forest Service (Korea Forestry Promotion Institute) (FTIS 2021331A00-2223-AA01) and the National Research Foundation of Korea (NRF) grant funded by the Korea Government (MSIT) (No. NRF-2021R1F1A1059444).
Conflicts of Interest
The authors declare no conflict of interest.
References
- Zhao, D.; Wu, S.; Yin, Y.; Yin, Z.-Y. Vegetation Distribution on Tibetan Plateau under Climate Change Scenario. Reg. Environ. Chang. 2011, 11, 905–915. [Google Scholar] [CrossRef]
- Zhao, Y.; Deng, X.; Xiang, W.; Chen, L.; Ouyang, S. Predicting Potential Suitable Habitats of Chinese Fir under Current and Future Climatic Scenarios Based on Maxent Model. Ecol. Inform. 2021, 64, 101393. [Google Scholar] [CrossRef]
- Kumar, D.; Rawat, S.; Joshi, R. Predicting the Current and Future Suitable Habitat Distribution of the Medicinal Tree Oroxylum indicum (L.) Kurz in India. J. Appl. Res. Med. Aromat. Plants 2021, 23, 100309. [Google Scholar] [CrossRef]
- Kunwar, R.M.; Rimal, B.; Sharma, H.P.; Poudel, R.C.; Pyakurel, D.; Tiwari, A.; Magar, S.T.; Karki, G.; Bhandari, G.S.; Pandey, P.; et al. Distribution and Habitat Modeling of Dactylorhiza Hatagirea (D. Don) Soo, Paris Polyphylla Sm. and Taxus Species in Nepal Himalaya. J. Appl. Res. Med. Aromat. Plants 2021, 20, 100274. [Google Scholar] [CrossRef]
- Dirnböck, T.; Hobbs, R.J.; Lambeck, R.J.; Caccetta, P.A. Vegetation Distribution in Relation to Topographically Driven Processes in Southwestern Australia. Appl. Veg. Sci. 2002, 5, 147–158. [Google Scholar] [CrossRef]
- Shin, Y.; Kim, S.; Park, S.-R.; Yi, T.; Kim, C.; Lee, S.-W.; An, K. Identifying Key Environmental Factors for Paulownia Coreana Habitats: Implementing National On-Site Survey and Machine Learning Algorithms. Land 2022, 11, 578. [Google Scholar] [CrossRef]
- Calef, M.P.; David McGuire, A.; Epstein, H.E.; Scott Rupp, T.; Shugart, H.H. Analysis of Vegetation Distribution in Interior Alaska and Sensitivity to Climate Change Using a Logistic Regression Approach. J. Biogeogr. 2005, 32, 863–878. [Google Scholar] [CrossRef]
- Bachelet, D.; Neilson, R.P.; Lenihan, J.M.; Drapek, R.J. Climate Change Effects on Vegetation Distribution and Carbon Budget in the United States. Ecosystems 2001, 4, 164–185. [Google Scholar] [CrossRef]
- Ahas, R.; Aasa, A. The Effects of Climate Change on the Phenology of Selected Estonian Plant, Bird and Fish Populations. Int. J. Biometeorol. 2006, 51, 17–26. [Google Scholar] [CrossRef]
- Lenihan, J.M.; Drapek, R.; Bachelet, D.; Neilson, R.P. Climate change effects on vegetation distribution, carbon, and fire in california. Ecol. Appl. 2003, 13, 1667–1681. [Google Scholar] [CrossRef]
- Kelly, A.E.; Goulden, M.L. Rapid Shifts in Plant Distribution with Recent Climate Change. Proc. Natl. Acad. Sci. USA 2008, 105, 11823–11826. [Google Scholar] [CrossRef] [PubMed]
- De Groot, R.S.; Ketner, P.; Ovaa, A.H. Selection and Use of Bio-Indicators to Assess the Possible Effects of Climate Change in Europe. J. Biogeogr. 1995, 22, 935. [Google Scholar] [CrossRef]
- Kuldeep, S.; Prodyut, B. Lichen as a Bio-Indicator Tool for Assessment of Climate and Air Pollution Vulnerability: Review. Int. Res. J. Environ. Sci. 2015, 4, 107–117. [Google Scholar]
- Rumpff, L.; Coates, F.; Morgan, J.W. Biological Indicators of Climate Change: Evidence from Long-Term Flowering Records of Plants along the Victorian Coast, Australia. Aust. J. Bot. 2010, 58, 428. [Google Scholar] [CrossRef]
- Dahlgren, J.P.; Von Zeipel, H.; Ehrlén, J. Variation in Vegetative and Flowering Phenology in a Forest Herb Caused by Environmental Heterogeneity. Am. J. Bot. 2007, 94, 1570–1576. [Google Scholar] [CrossRef]
- Conlisk, E.; Castanha, C.; Germino, M.J.; Veblen, T.T.; Smith, J.M.; Kueppers, L.M. Declines in Low-elevation Subalpine Tree Populations Outpace Growth in High-elevation Populations with Warming. J. Ecol. 2017, 105, 1347–1357. [Google Scholar] [CrossRef]
- Kuo, C.-C.; Liu, Y.-C.; Su, Y.; Liu, H.-Y.; Lin, C.-T. Responses of Alpine Summit Vegetation under Climate Change in the Transition Zone between Subtropical and Tropical Humid Environment. Sci. Rep. 2022, 12, 13352. [Google Scholar] [CrossRef]
- Worrall, J.J.; Rehfeldt, G.E.; Hamann, A.; Hogg, E.H.; Marchetti, S.B.; Michaelian, M.; Gray, L.K. Recent Declines of Populus Tremuloides in North America Linked to Climate. For. Ecol. Manag. 2013, 299, 35–51. [Google Scholar] [CrossRef]
- Cai, Z.; Jönsson, P.; Jin, H.; Eklundh, L. Performance of Smoothing Methods for Reconstructing NDVI Time-Series and Estimating Vegetation Phenology from MODIS Data. Remote Sens. 2017, 9, 1271. [Google Scholar] [CrossRef]
- Li, J.; Fan, G.; He, Y. Predicting the Current and Future Distribution of Three Coptis Herbs in China under Climate Change Conditions, Using the MaxEnt Model and Chemical Analysis. Sci. Total Environ. 2020, 698, 134141. [Google Scholar] [CrossRef]
- Mahmoodi, S.; Heydari, M.; Ahmadi, K.; Khwarahm, N.R.; Karami, O.; Almasieh, K.; Naderi, B.; Bernard, P.; Mosavi, A. The Current and Future Potential Geographical Distribution of Nepeta Crispa Willd., an Endemic, Rare and Threatened Aromatic Plant of Iran: Implications for Ecological Conservation and Restoration. Ecol. Indic. 2022, 137, 108752. [Google Scholar] [CrossRef]
- Zhang, K.; Sun, L.; Tao, J. Impact of Climate Change on the Distribution of Euscaphis japonica (Staphyleaceae) Trees. Forests 2020, 11, 525. [Google Scholar] [CrossRef]
- Kang, W.; Minor, E.S.; Lee, D.; Park, C.-R. Predicting Impacts of Climate Change on Habitat Connectivity of Kalopanax Septemlobus in South Korea. Acta Oecol. 2016, 71, 31–38. [Google Scholar] [CrossRef]
- Koo, K.A.; Park, S.U.; Kong, W.-S.; Hong, S.; Jang, I.; Seo, C. Potential Climate Change Effects on Tree Distributions in the Korean Peninsula: Understanding Model & Climate Uncertainties. Ecol. Model. 2017, 353, 17–27. [Google Scholar] [CrossRef]
- Teutonico, D. Ggplot2 Essentials: Explore the Full Range of Ggplot2 Plotting Capabilities to Create Meaningful and Spectacular Graphs; Packt Publishing: Birmingham, UK; Mumbai, India, 2015; ISBN 978-1-78528-352-9. [Google Scholar]
- Choi, Y.; Lim, C.-H.; Chung, H.I.; Kim, Y.; Cho, H.J.; Hwang, J.; Kraxner, F.; Biging, G.S.; Lee, W.-K.; Chon, J.; et al. Forest Management Can Mitigate Negative Impacts of Climate and Land-Use Change on Plant Biodiversity: Insights from the Republic of Korea. J. Environ. Manag. 2021, 288, 112400. [Google Scholar] [CrossRef]
- Moon, T.H.; Chae, Y.; Lee, D.-S.; Kim, D.-H.; Kim, H. Analyzing Climate Change Impacts on Health, Energy, Water Resources, and Biodiversity Sectors for Effective Climate Change Policy in South Korea. Sci. Rep. 2021, 11, 18512. [Google Scholar] [CrossRef]
Disclaimer/Publisher’s Note: The statements, opinions and data contained in all publications are solely those of the individual author(s) and contributor(s) and not of MDPI and/or the editor(s). MDPI and/or the editor(s) disclaim responsibility for any injury to people or property resulting from any ideas, methods, instructions or products referred to in the content. |
© 2023 by the authors. Licensee MDPI, Basel, Switzerland. This article is an open access article distributed under the terms and conditions of the Creative Commons Attribution (CC BY) license (https://creativecommons.org/licenses/by/4.0/).