Article

Role of Digital Transformation on Digital Business Model Banks

1
School of Business, IPB University, Bogor 16151, Indonesia
2
Department of Economics, Faculty of Economics and Management, IPB University, Bogor 16680, Indonesia
3
Indonesia Financial Services Authority, Jakarta 10350, Indonesia
*
Author to whom correspondence should be addressed.
Sustainability 2023, 15(23), 16293; https://doi.org/10.3390/su152316293
Submission received: 1 October 2023 / Revised: 23 October 2023 / Accepted: 20 November 2023 / Published: 24 November 2023
(This article belongs to the Special Issue Experience Design and Digital Transformation in Business)

Abstract

:
Digital technology has been raising the competition between banks and other financial service providers, and encourages banks to undergo digital transformation and introduce innovation in their products and services. However, the high investment required cannot be ignored when undergoing the digital transformation. A few research studies have examined the digital transformation effects on bank’s financial performance. This research aims to examine the digital transformation’s effect on bank profitability, specifically on banks with digital business models. Using digital banks’ profitability as the object is the novelty of this study, whereas previous research on bank profitability focused solely on traditional banks. This research utilizes the Panel of Autoregressive Distributed Lag (ARDL) and the panel data from 2016 to February 2023 of the digital business model bank population in Indonesia, which consists of seven banks. The result of the analysis indicates the U-shape relationship between digital transformation and bank profitability, as the digital transformation significantly supports the bank’s profitability in the long run, while it causes profitability deterioration in the short run due to the huge IT investment. This study recommends that banks need to consider the cost of IT investment as well as the required time and optimum strategy in undergoing the digital transformation and achieving targeted profitability.

1. Introduction

The rapid development of digital transformation technology has brought the global community into the digital era. Advanced digital technologies (e.g., the Internet of Things, big data analytics, machine learning, artificial intelligence, and cloud computing) have changed social and industrial activities. Currently, digital transformation is becoming an inevitable reality. This phenomenon was accelerated by the COVID-19 pandemic, which has increased people’s online activities due to physical contact restrictions. The impact of the global pandemic has become an important trigger for industry, academics, regulators, and societies in many countries to consider digital transformation as the game changer in boosting sustainable economic growth. Digital transformation is happening massively and has become the power source for corporate management and development, even for micro–small–medium enterprises in various sectors such as manufacturing, transportation, health, education, and agriculture, as well as the economic and financial sectors.
The rapid development of digital economy activities requires banks to undergo digitalization to stay competitive and relevant in their industry, as digital technologies can improve the bank’s business values and propositions from the customer perspective. Digital transformation has become an important issue in the banking sector as it can enlarge customer outreach by servicing without physical branches, marketing differentiation from competitors, and for operational cost efficiency [1]. The banking sector should adjust its digital capabilities to compete with FinTech, because this new player influences the competitiveness and performance of the banking sector; thus, technology management will directly impact the bank’s performance [2]. The digital transformation, which is supported by technology-enabled innovation, also becomes a solution for leveraging financial inclusion for economic development in emerging countries [3].
Digital transformation is associated with technology investment to support productivity, but not all scholars and banks believe in its impact on business values. Existing researchers state that no definitive conclusions can be drawn from digital transformation’s effects on bank performance [4]. The findings argue that technology is not a driver of bank performance and mentions that there is a profitability paradox between technology investment and profitability, because the research did not empirically find a positive relationship between technology investment and bank profitability. This opinion is based on the argument that the use of technology by market participants is caused by competitive pressures in which technology is required to increase efficiency, but it has no impact on profitability [5,6,7].
The development of digital technology encourages banks to carry out a digital transformation in their service processes, as it makes customers consider that the bank is still relevant with the current conditions; thus, banks can then gain profits in their business. The use of digital technologies in organizations has been proven to support organizational performance, including operating and financial performance [8]. The motive for profit in banking’s digital transformation was also analyzed in a study which found banks that focused on digitalization and sustainability [9], even during the coronavirus disease 2019 (COVID-19) pandemic, were profitable, as these principles can enable operations and stimulate product, service, and business model innovation [10].
This study aims to examine the impact of digital transformation of Indonesia’s digital business model banks in the dimension of banks’ profitability and to identify the indicative duration speed of the adjustment in bank profitability due to the digital transformation shock. Most academic papers focus on the determinant of a bank’s profitability with their existing business model, without considering the impact of digital transformation. Hopefully, this study can suggest some recommendations for the banking industry and the policymakers who want to encourage digital transformation in Indonesia’s banking industry for an efficient and high-performance banking system that is able to support sustainable economic growth. Our study proposes that digital transformation supports the efficiency of bank operations and has a positive impact on bank profitability in the long run, after reducing the bank’s profit in the short run due to the high cost of digital transformation. This result was confirmed by another study that found that three times more money is spent on IT investment in the banking industry than in other industries as a whole [11].
The arrangement of the next parts is as follows: Section 2 is the literature review of the digital transformation and banking digital transformation, Section 3 provides data sources and secondary data process by using statistical methods, Section 4 elaborates on the results and discussion, Section 5 discusses the conclusions and recommendations, and Section 6 provides the limitations of this study and suggestions for future studies.

2. Literature Review

2.1. Digital Transformation

Digital transformation is an institutional-wide transformation led by digital technologies adoption [12,13,14]. Digital transformation is characterized by the highly intensive adoption of digital technology in achieving significant advancements and improvements in organizational performance and the organization’s position in the industry [15]. Digitalization, which uses cutting-edge digital technologies, intuitively improves the business process and generates a firm competitive advantage in the digital era, as it can deliver the expected services to the customers [12,16]. Digital transformation is not a simple matter of IT implementation as discussed in a general perception, whereas digital transformation is often related to the capabilities needed for optimum operations [17]. Nowadays, digital transformation involves more complex elements, namely vision reconstruction, processes, capabilities, organizational structure, and culture [18].
Digital transformation is recognized as an action to enhance an object by changing its essential structure with an emphasis on connecting information, systems and technology, communications, and the overall connectivity of digital technology [19]. Nowadays, as digital technology develops, the digital transformation’s definition has become specific. Digital transformation is defined as the implementation of current digital technologies, for example artificial intelligence, cloud, Internet of Things (IoT), and blockchain, to carry out significant changes in organization activities in providing customers high-value experiences, simplifying operations, or creating new business models [18]. Digital transformation is also related to new digital technologies such as big data analytics to improve technological capability and management efficiency from various dimensions of technology, information, and platforms to overcome corporate productivity problems [20].
Digital transformation is a process of advancing and enhancing operations, activities, skills, and competencies, to benefit from the transition to digital technology that has significantly influenced the society [21]. Digital transformation is known to encourage an excellent performance by conditioning organizational elements both inside and outside, thoroughly [22]. Digital transformation is marked by the massive adoption of technology in enabling the significant development and improvement of organizational performance and its position in the industry [13]. Many implications can be brought by digital transformation, as it can generate the efficiency and optimization of business process, support the potential streamlining process of business operations, encourage value creation and business growth, and, in the end, boost profits.
Digital transformation requires a new vision, developed processes, digital tech capabilities, digital leadership in the organization’s structure, and a digital mindset in the organization’s culture [18,23,24,25]. These requirements are significantly different prerequisites when adopting new technologies in the past, which also caused different benefits and costs and raised uncertainty regarding digital transformation’s effects on company performance. Digital transformation is associated with the actions made by firms to improve customer engagement, business operations, and business models with digital technologies [18,21]. The wide range of the digital transformation’s scope notifies the huge investment behind the digital transformation process, not only for IT infrastructure for digital technologies but also for the digital talent and digital innovation management expenses [26], as well as marketing expenses to encourage customer adoption in the digitalization process.
The main elements of digital transformation are data collection, data processing, and digital technology application for decision-making processes [27]. Digital transformation develops the organization’s capabilities of processing data and information by connecting the business process, management information systems, and supply chain data. The integrated process enables management decisions that can achieve accurate services supported by data penetration and intelligent comprehensive analysis. By undergoing a digital transformation, companies expect that they can reduce operational costs as they improve the efficiency of their business process, and they can create new business opportunities from their innovations [28].
Digital transformation is a single comprehensive variable that is difficult to measure [29], so it is understandable if the effect of digital transformations is also difficult to assess. That is why even though the digital transformation’s impact is important, only limited research has examined this issue [30]. Contrary to the academic field, industry is more focused on the digital transformation’s impact in terms of the financial performance of the companies by analyzing financial indicators such as market value, income, and profitability. Currently, there are no supporting results that can describe the correlation between digital transformation and financial performance [31]. This study provides a comprehensive analysis of digital transformation’s effects on the profitability of banks that have already transformed into a digital business model bank.

2.2. Banking Digital Transformation and Profitability

Initially, digital transformation was defined as organizational changes in terms of new investments in digital business models to improve the customer’s digital interactions at every single touch point related to the customer life cycle [32]. Digitalization in banking is determined as the employment of digital technology to facilitate banking transactions [33] and to minimize operational costs, as the digital transformation has a significant impact on bank operations. Digital transformation in the general concept of the banking industry involves the digitization of documents, designation, digital learning, video conferences, virtual and online trading, virtual shops, e-bank account statements, and online payments [34]. Banking digitalization provides many advantages for banks and customers as it can provide time and cost efficiency with fewer employees and standardize internal processes, as well as optimizing risk management, monitoring, and control, while also enabling banks to improve product and service quality. On the customers’ side, digital banking products and services enable them to save time in carrying out secure banking transactions [35,36].
Digital transformation focuses on improving operational processes instead of boosting growth, as digitalization will reduce operational costs and increase efficiency [37]. The positive relationship between banking’s digital transformation and banks’ efficiency improvement has been proven in some studies in China, although the IT investment impact on financial performance still needs further research [38]. Therefore, digitalization also requires a financial structure transformation [39]. Another empirical study in China also discussed that digital banking transformation improved the operational capabilities of commercial banks [40]. Banking digitalization provides many advantages for banks and customers [29]. Digital technologies enable banks to be more efficient in delivering service and operational costs; monitoring optimum performance, risk management, and control methods; and improving the quality of products and services. Digital transformation significantly decreases bank risk-taking, mainly in small- and medium-sized regional banks, while large and national banks perform no substantial reduction [41]. Digital transformation decreases the systemic risk of the banks as digital technology can help banks mitigate financial risk. The digital transformation that brings innovation and cost impact contributes to decreasing the systemic risk for the bank [42,43].
Customers using digital banking services can reduce the time between transactions and complete them securely. The main goal of digitization is to increase customer satisfaction, in terms of time and security to settle transactions, and to create profiles of potential clients needed in the future [44]. Digitalization has become one of the main sources for banks to increase profitability, differentiate themselves in the market, change the core business of banking, reduce costs, improve quality, and enable the development of new financial products. The digital concept in the banking industry includes services to customers through all channels and points of interaction supported by analytical and automated processes, which require product and service innovation, information technology, as well as organization and human resources [45]. The digital transformation in banks has two perspectives: on one side, the customer base is offered new digital products and services, and 24/7 banking transactions even without a physical banking presence; and on the other side, human resources, with their significant influences [2]. The bank’s IT capabilities to serve customers without the presence of physical banking has become evidence of the bank’s digital capabilities, which has been proven during the COVID-19 pandemic. The better the bank’s IT capabilities, the more online banking activities they can carry out, as is described by the increasing website traffic, internet use, deposits, and loans [46].
In practice, banks still find some problems in carrying out digital transformation, because some bankers think that digital transformation is about the flows of work and platforms, instead of focusing on customer experience [47]. Evaluation of the correlation between determinants and performance in Russian banks found that digital banks with more customers and transactions that communicate via digital channels show better performance [48]. The use of digital technologies will bring the simplification and optimization of banking operations, mitigating fraud, creating advanced personalized offerings based on customer requirements, as well as transforming the customers’ interaction model [49].
Research on the determinants of bank profitability has been carried out by many researchers (among others, [50,51]). In addition, there is research that analyzes the effect of efficiency and market power on the profitability of banks with sustainable business activities [52], as well as the level of banking competition and their impact on bank profitability [53]. Another study evaluates the interest rates of European Union countries as a determinant of profitability [54]. Other factors such as inflation, exchange rate, economic growth, bank size and capitalization, and bank products and services are acceptable as explanatory variables for interest margin and profitability. Macroeconomic conditions such as high inflation push up high interest rates and deteriorate bank profitability because of higher potential credit risk, while new loan disbursements also decrease. The entire research was conducted focusing on traditional banks, not digital banks.

3. Materials and Methods

3.1. Data Resources

Using secondary data from seven digital business model banks in Indonesia from January 2016 to February 2023, this research aims to assess the implication of the digital transformation on a bank’s profitability performance. The data consist of monthly financial performance reports and macroeconomic data from the bank’s website, the Indonesian Financial Services Authority (OJK), and Bank Indonesia (the central bank of Indonesia).
We use profit as the proxy for bank profitability as the dependent variable in our model, while for the independent variables, we use digital transformation, which is a proxy for operating expenses related to digital transformation such as IT infrastructure investment and outsourcing digital services cost, as well as human resources including tech talent expenses [14], and a specific banking cost is marketing/promotion expense for digital bank branding.
As a new initiative, digital transformation needs to introduce new IT infrastructure both software and hardware, as well as new applications using cutting-edge digital technologies and methodologies for big data analytics such as the internet of things, artificial intelligence, machine learning, natural language processing, and even robotics; additionally, the need for continuous development and maintenance as digital technologies develop from time to time is a consideration. This advanced digital technology is designed and operated by professional digital tech talent to support digital banking products and services. These professionals also become an important element in adopting digital transformation, as they are part of digital change management [55]. To increase customer adoption, banks should also have promotional campaigns to introduce their new digital products and services.
Other independent variables that we use as controlling variables, and have generally been used as control variables in many research studies regarding profitability, are Non-Performing Loan (NPL) or Non-Performing Financing (NPF). These describe the ratio (measured in percentage) of loan loss and potentially default loans compared to total loan exposure, the Capital Adequacy Ratio (CAR) as the ratio of a bank’s capital compared to the risks-weighted assets, which are measured as a percentage, the Loan to Deposit Ratio (LDR) or Financing to Deposit Ratio (FDR), which shows the liquidity level of the bank as described by the ratio (in percentage) of total loan exposure compare to total deposits, the Operational Cost to Operational Income (OC/OI) which describes the comparison of non-interest operating cost to non-interest operational income (measured as a percentage), Net Interest Margin (NIM) or Net Income (NI), which explain the ratio (percentage) of net interest income minus interest expense, compared to the total assets of the bank. Other independent variables are macroeconomic variables such as Growth Domestic Product (GDP) growth (percentage), inflation (percentage), and foreign exchange rate of USD/IDR (nominal unit).

3.2. Specification of Theoretical Model

The logical thinking behind the connection between digital transformation and bank profitability is implied from the hypothesis that the digital transformation is in line with the effort to achieve efficiency, which means lower operational costs. The relationship between digital transformation and bank profitability can be modeled in the form:
Profit = f (DT, V)
with Profit as the bank profitability measured by profit, DT representing digital transformation, and V describing other determining variables.

3.3. Specification of Empirical Model

Panel of Autoregressive Distributed Lag (Panel ARDL)

We estimate bank profitability as a function of digital transformation and other covariates. In assessing the linkage between digital transformation and bank profitability as other performance indicators and other macroeconomic variables, we elaborate V from Equation (1) to capture other variables of bank profitability and obtain Equation (2) as:
P r o f i t i t = γ 0 i + j = 1 a Γ i j P r o f i t i , t j + j = 0 b γ 1 , i j X 1 , i , t j + + j = 0 b γ 9 , i j X 9 , i , t j + ϵ i t
whereas:
Profitit: Profit (Rp)γ0: Constanta
X1: NPL of Digital Bank (%) Γ: Coefficient of lag dependent variable
X2: CAR of Digital Bank (%)γ1.9: Coefficient of independent variable
X3: LDR of Digital Bank (%)ϵ: Error term
X4: NIM of Digital Bank (%)t: Time
X5: OC/OI of Digital Bank (%) j: Lag of time
X6: Digital Transformation (Ln Bank Expenses related to Digital Transformation)i: Digital Bank
X7: GDP growth (%)
X8: Inflation (%)
X9: Exchange Rate USD/IDR (%)
The Panel of Autoregressive Distributed Lag (ARDL) model [56,57,58], is employed to respectively determine the relationship between digital transformation and bank profitability. The Panel ARDL technique was used to simultaneously define the short-run and long-run relationship, along with the presence of nonlinearity, without the problem of non-stationarity between several objects. In examining the existence of a long-run relationship, due to the limited object of digital banks and the time series of monthly data, estimating each bank’s empirical equation is not optimal and it will be better to use a panel estimation to estimate time series and cross-section data. The panel increases the observations’ total number and variation. Furthermore, estimation from a panel reduces the noise from the time-series estimation of individual data, and it will lead to a more reliable inference.
This empirical approach is started by identifying the integration order of the data, which is crucial in estimating the ARDL model, which has no-cointegration variables, either integrated at the level I(0) or at most integrated at first difference I(1). The Panel of ARDL-bound testing allows us to consider the I(0) and I(1) variables together, while the second difference I(2) variable should be eliminated, as this variable will cause a failure in robustness results. The next step is testing the unit root of the panel series group by using the IPS and LLC, before performing the main estimation to check non-stationary variables, by employing ADF–Fisher and PP–Fisher as baseline framework. The null hypothesis is tested to determine that there is no co-integration between all independent variables, against the existence of co-integration for the alternative hypothesis:
H0: 
γ1 = γ2 = γ3 = γ4 = γ5 = γ6 = γ7 = γ8 = γ9 = 0.
Against
H1: 
At least one of the gammas is not zero
The F-statistics value from the Wald test was then compared with critical values from Pesaran [56]. The null hypothesis results fail to be rejected if the calculated F-statistics value is below the lower-bound critical values. If the calculated F-statistic value falls between the lower-bound and upper-bound critical values, the result is inconclusive. If the calculated F-statistics value is above the upper-bound critical values, then the null hypothesis is rejected, and it means there is no existence of a long-run relationship. If the long-run relationship between variables exists, then it needs to select the optimal lag length with the help of the Schwarz Bayesian Criterion (SBC) or Akaike Information Criterion (AIC) standard criteria. The coefficients of the long-run and short-run then can be predicted.
After confirming the integration order, the next step is testing the long-run panel cointegration between profit and independent variables by conducting the Pedroni tests [59,60,61]. The Pedroni test enables panel-specific cointegrating vectors and heterogeneity. This test is according to the model of panel data for y dependent variable of I(1), and tests the null hypothesis of no cointegration compared with the alternative hypothesis of cointegration, with the following equation:
yit = x′itβi + z′itτi + eit
whereas for each panel I, the covariates I(1) series in xit, and the tests need the covariates not to be integrated amongst themselves.
After carrying out tests of unit root and cointegration, the panel of ARDL is estimated. Panel ARDL distinguishes coefficients of short-run and long-run and reliable on short sample periods. The model specifications of the Panel ARDL relationship function between variables are in Equation (3) as:
P r o f i t i t = γ 0 i + j = 1 a 1 Λ i j P r o f i t i , t j + j = 0 b 1 λ 1 , i j Δ X 1 , i , t j + + j = 0 b 1 λ 9 , i j Δ X 9 , i , t j + Μ i j P r o f i t i , t j + μ 1 , i j X 1 , t j + + μ 9 , i j X 9 , t j + ϵ i t
with ∆ is first difference of variable. Λ ,   λ 1.11 are short-run coefficients, and Μ ,   μ 1.9 are long-run coefficients. After determining the short-run relationship between the dependent variable and the regressor, we can define the formula as follows:
P r o f i t i t = γ 0 i + j = 1 a 1 Λ i j P r o f i t i , t j + j = 0 b 1 λ 1 , i j Δ X 1 , i , t j + + j = 0 b 1 λ 9 , i j Δ X 9 , i , t j + ϕ i E C T i , t 1 + ϵ i t
where ϕ i is the ECT coefficient as the speed of adjustment in each period to achieve long-run equilibrium. We test the null hypothesis (H0) of no long-run relationship against the alternative hypothesis of the existence of a long-run relationship.
H2: 
λ1 = λ2 = λ3 = λ4 = λ5 = λ6 = λ7 = λ8 = λ9 = 0
H3: 
At least one of the lambdas is not zero

3.4. Empirical Study of Monetary Expansion and Its Effects on Bank Performance

In the period of the COVID-19 pandemic in 2020–2021, which gave rise to global financial crises, monetary authorities around the globe implemented the monetary expansion policy. Although the Central Bank of Indonesia as a monetary regulator had implemented the Quantitative Easing (QE) policy to reduce market perceptions of tail risk [62] for economic recovery and financial stability, the QE with burden sharing scheme (along with the Ministry of Finance) did not directly affect digital banks.
There was a time lag for the QE money to reach out to digital banks as the QE initially entered the state-owned bank as the government primary bank, then went to the big private banks, as the primary corporate banks, and finally flowed to third-layer banks such as digital banks as the retail transaction banks. The delayed transmission channel meant that the QE did not directly and significantly affect the financial performance of digital business model banks in Indonesia, nor did the positive international spillover from the Federal Reserve’s QE policy [63,64]. Another factor that caused the insignificant impact of QE and international spillover is that these digital banks are only the minority in the Indonesian banking system, so only a small amount of financial assets could be impacted. Therefore, we think the factor that significantly affects the bank’s performance is the high digital transformation cost, so profitability cannot be achieved directly after the digital transformation.

4. Results

4.1. Panel Unit Root and Cointegration Test

A digital bank referred to in this study is a bank that conducts a digital business model in providing services and products to its customers. Currently in Indonesia, banks with a digital business model are defined as banks that have transformed from traditional banks that operate a common operational business model into banks that run a digital business model. Historically, before undergoing a digital transformation, the profitability of all population banks in this study (seven banks) had been at a low level. This low performance became one of the reasons why the book value of these banks was relatively low, and made these banks become the target of strategic investors, including the acquisition of the banks, who then transformed them to be digital banks, mostly in 2019. Intuitively, after the digital transformation, banks can achieve high efficiency and then high profitability.
A low level of banks’ efficiency causes low bank profitability and even negative profitability after the digital transformation, ranging from 0.1% to −14.75% in 2021 and from −5.2% to 3.55% in 2022. Figure 1 shows the trend of the Return on Assets (ROA) ratio of seven digital business model banks.
In the real situation, right away after undergoing the digital transformation, the efficiency ratio of the banks shows a high level of inefficiency (low-level efficiency), as can be seen in Figure 2. For the proxy of efficiency, we use the Operational Cost to Operational Income (OC/OI) ratio. The low level of efficiency is caused by the high cost of ther digital transformation, such as for digital technology infrastructure, tech talent—including human resources expenses, promotion—corporate branding expenses, and corporate culture transformation, etc.
Therefore, this research was conducted to find out the implications of the digital transformation on digital business model banks’ profitability in Indonesia’s banking sector. This research also fills the literature gap to conclude whether digital transformation is one of the determinants of a digital bank’s profitability. Based on our knowledge, this is the only research that analyzes the effects of digital transformation on digital bank profitability within the Panel ARDL framework.
Table 1 shows the operational definition of variables used in this study. The descriptive statistics in Table 2 performs the variables at a natural level. Some variables such as NPL, CAR, GDP growth, and forex, show much volatility, especially during the COVID-19 pandemic. The correlation among the independent variables is minimal and there is no multi-collinearity problem in the models.
The unit root test uses the IPS. LLC, ADF, and PP are shown in Table 3. In the LLC test, the parameters tested are similar for all the panels, while in the IPS test the parameters vary for each panel. The IPS test tends to be more flexible than the LLC test and usually as the average of ADF statistics. The unit root test describes that some variables are stationary at levels while others are stationary at the first difference. Both stationary tests employ constant and trend or employ constant and without trend condition. The result of the unit root shows that aside from Profit, NPL, and GDP growth, which are stationary at the level, other variables are stationary at the first difference. This means the Panel ARDL is the suitable model for the study as the integration among variables exists both at I(0) and I(1).
The next step is to determine the order of the vector autoregression (VAR), which describes the number of lags to be used. Table 4 shows the optimum lags are automatically selected based on the Akaike Information Criterion (AIC). Model selection is chosen by the smallest value of AIC. From Table 3, we choose ARDL (5, 5, 5, 5, 5, 5, 5, 5, 5, 5) with the corresponding value AIC 49.84460.
The bound test result for cointegration is reported in Table 5. Using the Johansen Fisher Panel Cointegration test, the table indicates that the models’ F-statistic is greater than the corresponding 1% significance level upper limit which means cointegration exists and is significant, both from the max-eigen test and from the trace test. It describes that the null hypothesis of the bound test for the model can be rejected, meaning that there is a long-term relationship for each model.
Given the strong support of the first difference stationarity in all the variables and across all panels, the second stage of the analysis is to test for cointegration between the dependent variable, profit, and the regressors. By using the Pedroni residual-based cointegration tests, we test the hypothesis of no cointegration in all nine panels (Digital Transformation, NPL, CAR, LDR, NIM, Operational Cost/Operational Income, GDP growth, Inflation, Forex). Table 6 presents the cointegration tests that reject the null hypothesis of no cointegration in the nine panels, which means that the dependent variable has a long-run relationship with the explanatory variables for all nine panels and indicates that the estimates suggest reliable short-run and long-run results. The estimates show that in the long-run, digital transformation and other independent variables are statistically significant and have a positive relationship with profit.

4.2. Panel ARDL Estimation

After validating the cointegration test, the next step is Pooled Mean Group (PMG) estimation to estimate the panel ARDL regression. The suitable lag length is chosen by applying AIC lag selection criteria and insignificant variables are ignored. Table 7 presents the long-run ARDL panel regression of the digital transformation and other independent variables to the profit for the full panel of 7 banks and for the full sample period, January 2016–February 2023. The results show that almost all variables, including digital transformation, significantly have a positive effect on bank profitability.
Table 8 shows that the error correction term coefficient (ECTt−1), which is represented by Cointeq (−1), has a corresponding coefficient estimate of −0.914, describing that about 91.41% of any movements into disequilibrium are corrected within 1 month. The ECT coefficient shows the significant and negative values, which indicates the existence of a stable long-run relationship between the dependent variable and the regressors. The explanatory variables’ coefficients are aligned with banking theory and intuition. The ratio of NPL, CAR, NIM, Operational Cost to Operational Income, GDP growth, and foreign exchange rate significantly impact the banks’ profitability with a 1% significance level, and NPL, Operational Cost to Operational Income, and forex, have a negative relationship with the profit over the longer term, while CAR, NIM, and GDP have a positive relationship with the profit over the longer term [65]. Meanwhile, LDR and Digital Transformation (DT) have a relationship with the profit over the longer term at a 5% significance level, whereas LDR has a negative relationship with profit as the larger loan exposure compared to deposits increases the potential credit risk and loan provision, while DT has a positive relationship with the profit because it can boost bank efficiency [66,67].
The negative association of bank-specific factors with bank profitability such as NPL [68] and Operational Cost/Operational Income [69], as well as the macroeconomic factor of the real exchange rate, is because these variables directly influence the profit by their transmission channel. NPL needs banks to provide loan-loss provisions to absorb the loan losses of NPL and as the mitigation of further potential credit risk. The loan provision required decreases the profit as the operational cost increases because of additional loan provision. As the operational cost increases, the ratio of Operational Cost to Operational Income increases. Foreign exchange rate volatility also determines the bank’s profitability as it can trigger NPL because of its impact on the debtor business, which affects the payment capability of the debtor. Variable CAR supports the bank’s profitability as it provides capital for the bank to enlarge its loan exposure [70]. The more capital the bank has, the larger loan exposure and other expansion can be achieved, while variable NIM contributes to the profit from the interest income of the loan exposure. The macroeconomic variable of GDP growth describes the growth of the economy and financial system, which influence the financial transactions through the banking industry and contribute to bank profitability [66,71,72,73,74,75,76].
PMG estimation illustrates that even though DT (digital transformation) has an insignificant impact on the profit in the short run, it has a negative coefficient, which means there is a negative relationship between DT and the profit in the short run as the digital transformation needs high cost or investment; initially, the cost will reduce the profit, but afterward it will support profit (see the long-run estimation in Table 7). Other variables such as CAR, NIM, GDP growth, and forex have insignificant impacts on profit as well. The insignificant impact from the variables is aligned with the transmission process of these variables, which need more time to have a significant impact on the profit.
Meanwhile, NPL, LDR, Operational Cost to Operational Income (OC/OI), and inflation have significant impacts in the short run. NPL refers to default loans because borrowers fail to pay their obligations. The presence of NPLs in the loan portfolio of a bank can indeed generate a negative impact on its profitability. NPL can be affected by aggressive loan disbursement, which is indicated by high LDR. The more aggressive the loan expansion is compared to deposits from customers, the higher the LDR will be. Another variable, OC/OI, represents the efficiency of the bank operation. The higher the OC/OI describes the higher inefficiency due to the higher operational cost over the operational income. The higher cost-to-income ratio hurts bank profitability. Likewise, rising inflation will reduce the level of the real value of money which hurts profits.
According to a survey conducted by McKinsey in 2020 on global industrial companies, 92% of company leaders surveyed stated that their business models would not survive if they did not carry out digital transformation to grow their competitive advantage [77]. Nonetheless, not all companies in the survey are convinced of the business value of digital transformation, given the high cost and time required to achieve the expected performance impact. The research found that IT investment influences banking efficiency, but there is a time lag from carrying out digital transformation to achieving the targeted efficiency [78].
Another study analyzed the systematic correlation between the dimensions of digital transformation and the performance of existing financial service providers [79]. Based on the 83 samples of financial service providers being analyzed, digital configurations can be identified at various levels of company performance that show digital evolution configurations. The study also compared the correlation of digital transformation and the profitability between digital banks, fin-tech, and the four major American digital technology companies (Google, Apple, Facebook, and Amazon), in achieving efficiency in those tech–finance companies.

4.3. Impulse Response

As a complement to the findings, impulse responses from the regression models are gleaned. We analyze how digital transformation shocks are responded to by the various measures of bank profitability. We use non-interest operating expenses, specifically general expenses that are dominated by: IT infrastructure cost; human resources/labor expenses, which include tech talent in carrying out the digital transformation; and promotional expenses, such as digital transformation proxy, because there is a significant increase of non-interest operating expenses for all banks in this research in 2019, 2020, and 2021 (see Figure 3).
Based on Figure 3, the data show that all the digital banks have a high cost of investment in implementing digital transformation. The cost of digital transformation significantly affects the bank’s profitability. Therefore, the profitability of all banks significantly decreases, as described in Figure 4.
Figure 4 shows the response of bank profitability measured by profit to shocks in bank digital transformation. It is described that the negative response of profitability to digital transformation in the early period begins to rise after the third period. Intuitively, the increasing cost of digital transformation will decrease the profitability of the banks, but afterward, the digital transformation will improve efficiency and will increase the customer base as the banks’ competitiveness increases. The declining profitability in the short time, followed by increasing profitability afterward forms a U-shape graph. This graph describes a U-shape relationship between digital transformation cost and profitability. The greater the digital transformation costs, the smaller the bank’s profit, but after the lowest point, the profitability will go up because of the efficiency improvement due to the digital transformation.
The cost of IT investment for digital technology, rising management and integration, tech-talent expenses, and promotion expenses reduce the banks’ profits, and it will take more time for banks to achieve marginal revenues that outweigh the marginal costs, at which point banks obtain profits. Therefore, we propose that there is a U-shaped relationship between digital transformation and bank profitability, and this kind of relationship answers the dilemma of the economic values paradox of digital transformation in the academic field and practical banking sectors.

5. Discussion

Aligned with the development of Indonesia’s financial system and digital economy, according to the Indonesia Financial Services Authority, or Otoritas Jasa Keuangan (OJK), three main aspects encourage banking digital transformation in Indonesia: namely, digital opportunities, digital behavior, and digital transactions [
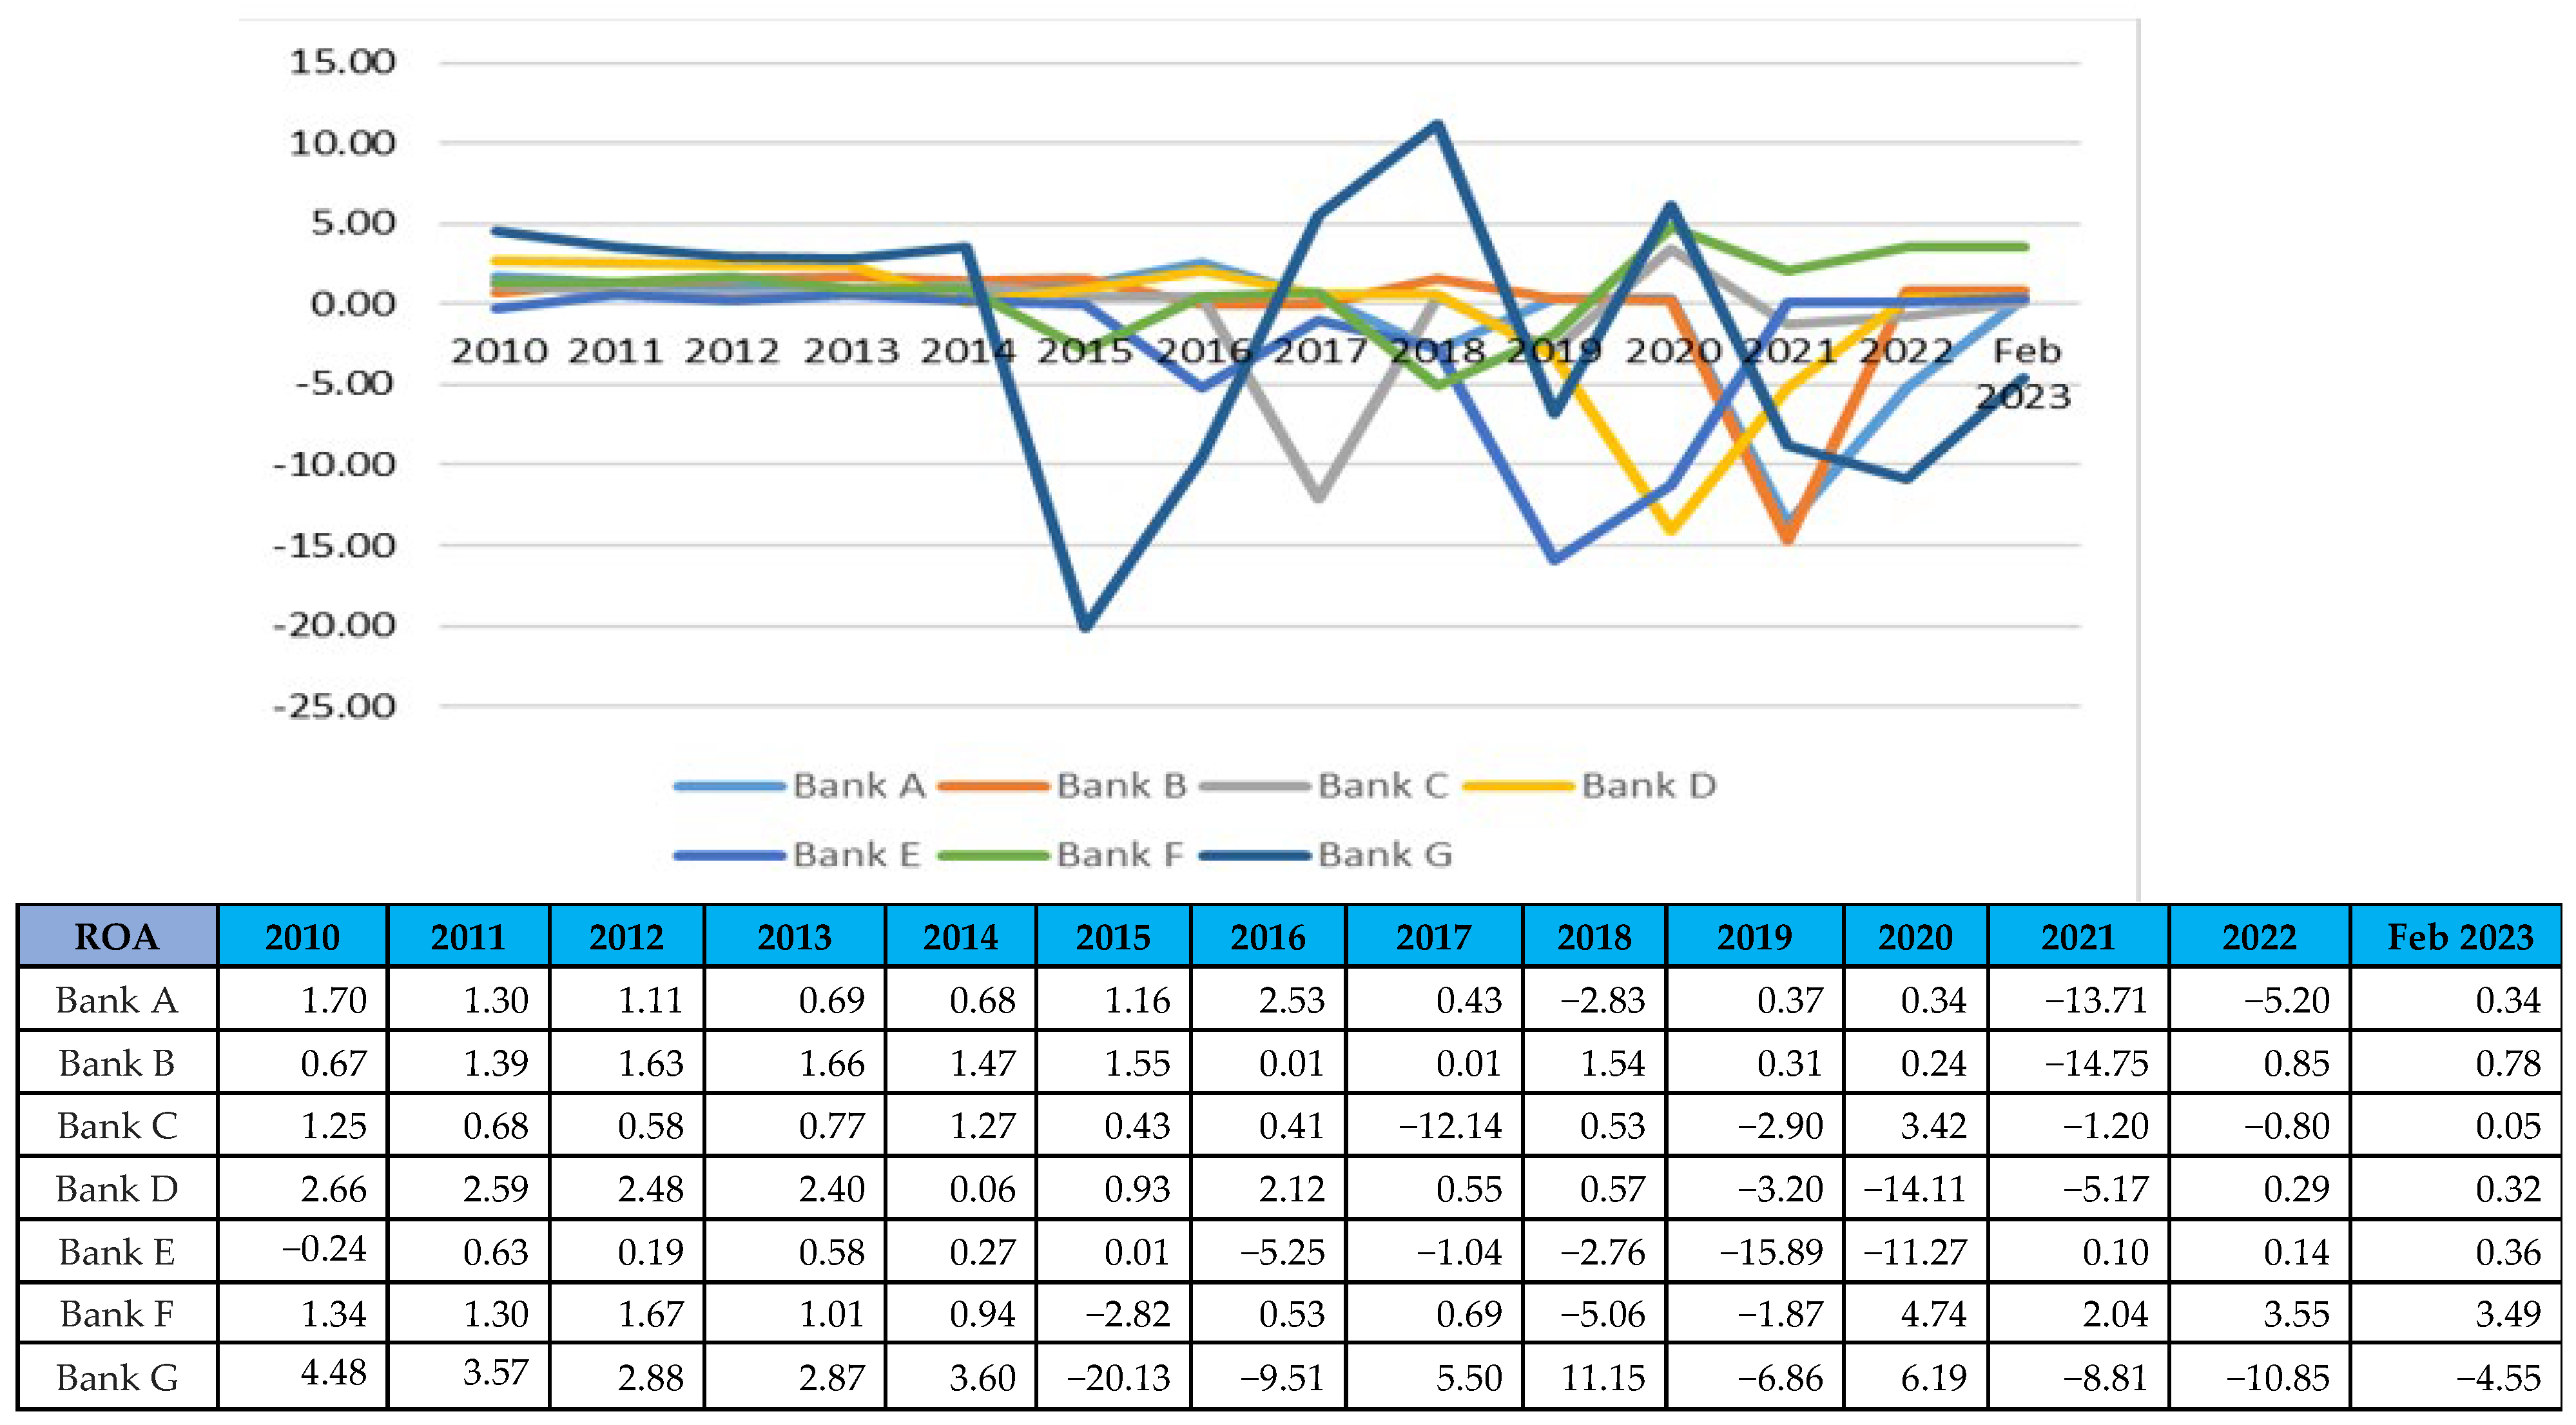
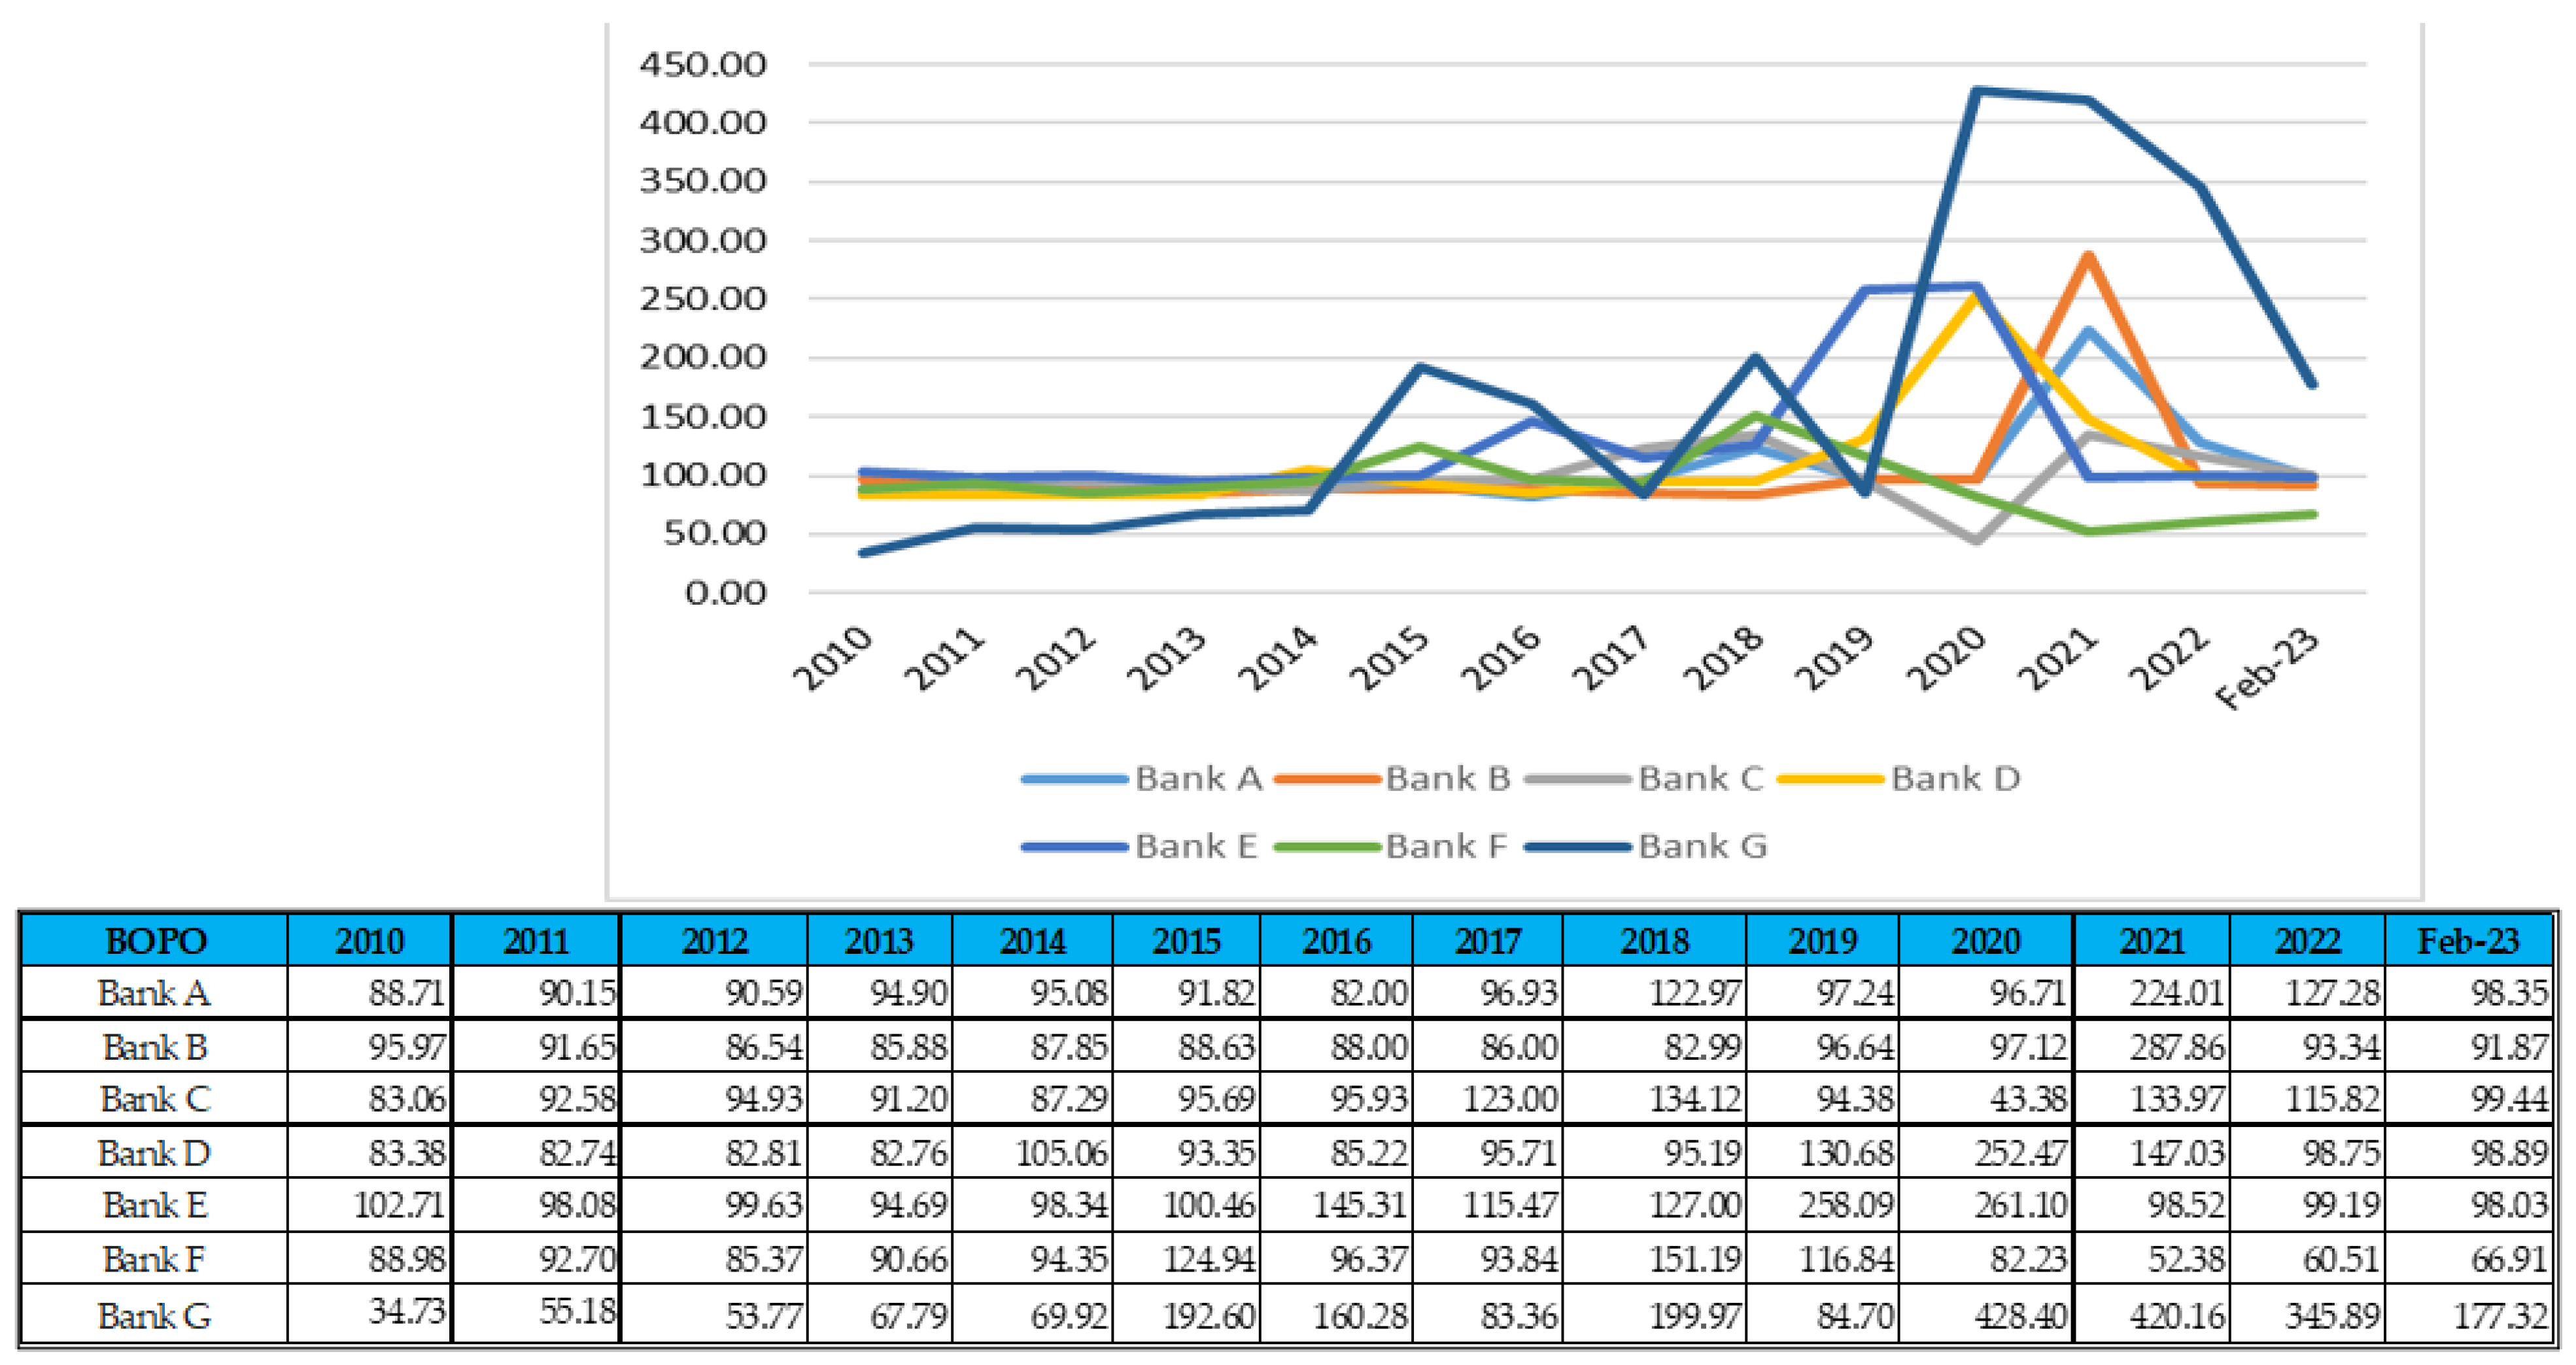
80]. Digital opportunities arise with the huge potential population in Indonesia and their digital behavior, which includes massive use of smartphones including the e-commerce applications, as well as using digital transactions for payment settlements. However, the digital transformation of banks in Indonesia into digital banks has not yet shown the maximum profitability performance, as described by the high inefficiency with a high level of OC/OI and low level of Return on Assets (ROA), even causing negative ROA. The low level of performance is perhaps because of the economic scale of these digital banks, as all of them are small banks. A study on commercial bank digital transformation in Vietnam found that digital transformation increases bank performance, but it depends on the bank scale. Bank performance will receive a bigger positive impact if the bank has a larger asset size [81,82].
The low level of profitability after digital transformation confirms that technology is not the sole driver of bank performance. There is a profitability paradox between technology investment and profitability, as there were no empirical studies on the positive relationship between technology investment and bank profitability at the beginning of the digital transformation [4]. As time goes by, the massive usage and development of digital technology has currently brought a positive impact on organizational performance, after several time lag phases [4,7,83,84]. However, digital transformation is not only about using new technology, but also includes strategic transformation for bank organizational changes [10,30] to be more efficient and profitable as the benefits outweigh the cost.
Banks and other financial institutions are affected by digital transformation in three business dimensions: value creation, value proposition, and customer interaction [85,86]. The impact on the value creation model (VCM) is captured by the creation process of products and services, which includes all processes conducted by the banks in generating a unique value for the customer, in terms of advantages of product/services, risk management, added value, security, or information [85]. Obtaining advantages such as efficiency and effectiveness needs a re-engineering of process-based bank operation, as the identical cycle of business needs a distinctive organization structure [87].
The impact on the value proposition model (VPM) is captured by the digital transformation effect on the creation of products and services, which includes the improvement of products and services, the novelty of the products and services, or revenue model changes [85,88,89]. This aspect requires a concrete outcome of the distinct line of business serving diverse segments of customers. Banks might analyze the operational performance and profitability by using big data analytics to generate new products and services.
The last one, impact on the customer interaction model (CIM) describes the quality and substance of customer communication in banks, for example the comprehensive design of customer interaction through different kinds of channels, the automation of inclusive communication, and digital forms of data analytics [85], which are shown by the concrete interaction with customers in terms of sales, service, and marketing purposes. That is why marketing and promotion become an important aspect of the banking sector, as they can support corporate and product/services branding. Consequently, the promotional cost in bank digital transformation is expensive.
To connect those three dimensions in a systematic interlinkage, the bank needs relevant IT resources (hardware, applications, database, data warehouse, and data analytics) to support business functions properly. IT resources include core systems and cross-functional systems as technological drivers to support banking operations [90]. Many operational activities in digital banks are driven by digital technologies and data analytics, such as the decision-making process for customers’ applications, risk management, fraud detection, and improving compliance [91]. Other studies regarding business agility also found IT as the most influencing factor on business agility in the era of industry 4.0, while other factors such as operational and human resource management, firm and transformational performance, organizational culture and creativity, marketing, knowledge management and learning, dynamic capabilities, and strategic transformation, also play important roles [92]. Another key driver in bank digital transformation is digital strategies [93,94,95], which also includes strategic technological partnerships for enhancing business models and increasing the bank’s competitiveness among financial service providers [96,97].
When implementing digital transformation, the operational cost will significantly increase, given the high cost required for digital infrastructure, professional management and tech talent, and promotional costs. After the digital transformation intensity decreases to a low level and the advantages arise, the digital technology adoption will support the business growth, improve the bank’s competitiveness, and increase bank operational efficiency. Then, afterwards, the marginal revenue will exceed the marginal cost. The complexity of digital transformation leads to financial performance uncertainty, but digital transformation plays a key role in bank profitability in the digital era as it can boost business growth through digital marketing by using big data analytics [31,77,98,99], supports product and service innovation by developing data-driven personalized customization products and services [100], and transforms bank business models into digital ones [16,17,101].
Digital transformation in banking activities can improve business operations by reducing financial transaction costs as data collaboration and accurate algorithms support precise decision making in products and services, increasing human resources’ productivity through optimal synergy between units/departments and optimal organizational structure, improving operational efficiency by automation and robotics, or artificial intelligence in analyzing consumer behavior, and optimizing the value chain in delivering products and services as well as in improving marketing capabilities [24]. Digital transformation’s impact on banks’ and other financial service providers’ performance also shows a significant and positive long-term effect [102], as well as on productivity [103] and organizational agility [104]. A similar positive relationship between digital transformation and community bank profitability is also shown by another study [105]. Digitalization in the banking sector is very important to maintain bank performance in competing with other sectors, such as the telecommunication sector, which can provide financial services through mobile money in their product [106].
This paper conducts a comprehensive analysis of digital transformation’s impact on digital bank profitability, specifically in the long-run perspective. The analysis is devoted to studies on the implication of digital transformation in the context of banks with digital business models. The existing digital transformation literature generally discusses digital transformation’s effect on the manufacturing industry and its organizational or financial performance, or about determinants of profitability on the traditional bank, while the largest portion of research concerns the influence of certain digital technologies on institutions [107,108]. Currently, understanding digital transformation involves understanding a combination of multiple digital innovations affecting the organization, rather than the impact of the implementation of a single digital technology [12]. To the best of our knowledge, this work is the first study that clarifies the effect of digital transformation on digital business model bank profitability, suggesting significant recommendations for study on banking digital transformation. The state of the art of this research is to observe the effect of digital technology applications and other related aspects in digital transformation, on the profitability of digital banks.
This study finds that digital transformation has a valuable effect on banks’ profitability despite the huge IT investment required. In the long run, the profit generated by the business growth and efficiency in business processes outweighs the digital operation with the brand-new digital IT infrastructure cost and new tech talent and organization. The result of this study finding confirms a long-held perspective on the information system’s advantages, because IT cannot directly optimize the operation process, so it needs more time to achieve the expected objectives [7,109]. We further specify the limitation of digital transformation’s impact on bank profitability by examining long-term effects, as the positive impact does not arise until a certain level of intensity of transformation. The relationship curve between digital transformation and ROA describes that digital transformation does not always imply financial performance, because of the huge amount of costs required. However, as transformation internalizes, more financial advantages will arise as the compensation of the costs.
Different from previous studies [4,5,6,7,30], our study finds that digital transformation has a significant impact and strongly supports the digital bank’s profitability for a long time. Our results provide empirical evidence for digital transformation toward financial consequences [110,111], suggesting that the level of digital transformation is the important key to implementing digital transformation. Intuitively, the U-shaped relationship explains the controversy on digital transformation’s impact on a bank’s financial performance as discussed in in the previous research. This finding aligns with the statement that digital technologies’ economic value can be strongly realized after institutions significantly transform their business and organization [112]. Another study on systemically important banks in China also demonstrates an inverted U-shaped pattern regarding the effect of financial technology in banking on the bank’s financial risks. It shows that in the beginning, financial risk increases, but afterward it declines alongside the technology development, although the responses of the banks are comparatively slow [113].
Initially, digital transformation causes a deterioration in a bank’s financial performance as indicated by decreasing ROA and ROE [114]. After suffering high costs and a negative impact at the beginning of digital transformation, banks will achieve a positive impact on profitability in a longer time than it takes for operational processes to see a positive impact. This finding confirms the existence of time lag for the implication of digital transformation on firm performance, as also mentioned in another study that analyzes the effects on operational performance and financial performance differently [115], as well as the study on the impact of IT value input on economic benefits for the firm [116]. The variable of digital performance will affect the time lag in achieving operational performance and financial performance by one year and three years, respectively [23], while another study of IT’s impact on organizational performance states that the strong impact of IT investment will arise in 2 to 3 years after the investment [4].
The increasing trend of digital transformation has evolved and combined with sustainability issues such as green credit. Banks’ digital transformation generates some advantages, namely scaling up the green loan and increasing the digitization level of bank management, enabling the more effective growth of green loans [117]. Based on Chinese banking’s digital transformation, it is also found that innovation and bank financial technology applications support bank loan growth and effectively control credit risk and insolvency risk but increase liquidity risks [27].
The empirical support for our finding, based on our analysis of the latest data from the website of the digital banks, we found that there is improvement in profitability (by using proxy of ROA and ROE) and efficiency (by using proxy Operational Cost over Operational Income), increase loan growth but credit risk which using proxy of Non-Performing Loan) is declining, and liquidity risk (by using Loan to Deposits Ratio) is well-maintained. Currently, new and increasing digital transformation trends in Indonesia’s banking sector also describe a tight rivalry among banks that provide digital banking services. Conventional banks tend to acquire smaller and limited activities banks, and then transform them into digital banks. Another way is for fintech or big tech to set up a new stand-alone digital bank.
The network for digital business ecosystems including MSMEs is very crucial for digital banks’ strategy in their initial process, even though these banks can obtain expected and durable sources of financing as well as attract depositors compared with fintech lenders. The basic component of digital ecosystems involves: (i) data access and sharing, (ii) useful and persistent data verification, and (iii) data feeds for decision-making process algorithms [118]. Data are a very important raw material in the digital finance sector, and the capability to obtain, save, and use data appropriately is as valuable as embracing complicated algorithms that are used to select, clean, and serve customers with relevant products and services.
The algorithms that are added with the use of Artificial Intelligence are the basis of credit risk assessment, for example in valuing a borrower’s repayment capacity. These tools pass the filtering phase and enable setting the parameters as well as the terms and conditions of the loan, including calibrating the borrower’s risk by applying automated credit scoring. But, on top of all the sophisticated digital technologies, there are newly emerging digital-related risks that must be considered, as the banking sector has vulnerabilities in operational risk related to digital technology such as cyber threats, online fraud, data privacy, and fast-moving technologies.

6. Conclusions

This research analyzed the implication of the digital transformation on digital business model bank profitability in Indonesia. Previous research documented the determinants of bank profitability, specifically focusing on traditional banks. We examine the relationship between digital transformation and digital bank profitability by using profit as the proxy of bank profitability. We use other independent variables such as NPL, NIM, CAR, LDR, OC/OI, GDP growth, inflation, and forex to test these variables’ relationship to the profit.
The results show that in the long run, digital transformation (DT) has a significant supportive effect on bank profitability, as well as bank-specific factors like NIM and CAR and macroeconomic variables like GDP growth. Other variables, like NPL, cost-to-income ratio, LDR, and exchange rate, have significant negative effects on bank profitability. In the short-run, based on the analysis, it is concluded that digital transformation and NPL, LDR, Operational Cost to Operational Income (OC/OI), and inflation have significant impacts in the short run, while other variables, namely CAR, NIM, GDP growth, and forex, insignificantly affect the profitability of digital banks, as the digital transformation needs more time for adoption, and the relationship between digital transformation and profitability showed a negative relationship as the huge amount of investment for digital transformation reduced bank profitability.
Therefore, it is recommended that digital banks have an optimal strategy to implement the digital transformation to efficiently operate and digitally deliver their products and services, which will enable customers’ adoption of digital banking services and increase the bank’s customer base. Also, banks should consider the cost of IT investment and the required time for undergoing the digital transformation, as well as consider business models designed for optimal customer adoption.

7. Managerial Implications

In a financial system and economic environment with the spreading out of the spirit of digitalization in every area of the economy, finding innovative digital technological services and products is the most important action to be carried out by banks to better retain their customers [119,120,121,122,123,124,125,126]. The digital innovation will lead banks to find a new and relevant business model with digitalization in banking operations (digital transformation). Therefore, the digital transformation strategy is crucial in minimizing time lag for the implications of digital transformation on digital bank financial performance.
The economic value of digital transformation could become strongly visible until digital banks significantly change their business model and organization. Initially, a digital bank’s financial performance tends to be negative due to the high cost of the digital transformation. Digital banks’ management and regulators need to focus on minimizing the negative performance and shortening the negative performance period, although it is understandable that a positive impact on profitability needs more time to be seen than that on operational efficiency.
Maintaining a long-term perspective also becomes a strategic issue for both digital bank management and financial sector authority. In the beginning, the digital transformation requires banks to spend considerable investment on IT expenses and tech talent. However, in the medium and long term, the digital transformation leads to improved bank efficiency and operational capabilities with reduced operational costs; in the end, the efficiency will improve the bank’s financial performance.

8. Limitation and Future Research

This study has some limitations that can guide future research. First, the sample is drawn from digital banks in Indonesia, which are currently still a limited number, and does not involve digital banks in other countries. Therefore, future research should expand to include samples from other countries’ experiences. Second, the period for the post-digital transformation is a relatively short time; a more precise analysis could be achieved if we had a longer period after the digital transformation. Future research can explore more digital banks and longer periods after digital transformation to obtain accurate predictions of the time lag between the digital transformation and the achievement of profitability.
As this study focuses on the financial performance impact of the digital transformation, the suggestion for upcoming research can also expand on operating performance in the context of efficiency, or important aspects that influence the competitiveness of digital banks, as digital banking is a new field that is still limited in what has been explored. Further research can also utilize digital transformation indicators such as digital banking user growth (even though not all banks disclose their digital banking users in their publication reports), digital capability, and digital maturity.

Author Contributions

Conceptualization, R.S.; methodology, R.S.; software, R.S.; formal analysis, R.S.; resources, R.S.; data curation, R.S.; writing—original draft preparation, R.S.; writing—review and editing, R.S., H.S., N.Z. and T.; visualization, R.S.; supervision, R.S., H.S., N.Z. and T. All authors have read and agreed to the published version of the manuscript.

Funding

This research received partial funding from IPB University—Indonesia.

Institutional Review Board Statement

Not applicable.

Informed Consent Statement

Not applicable.

Data Availability Statement

Data is not publicly available, though the data may be made available on request from the corresponding author.

Conflicts of Interest

The authors declare no conflict of interest.

References

  1. Kitsios, F.; Giatsidis, I.; Kamariotou, M. Digital Transformation and Strategy in the Banking Sector: Evaluating the Acceptance Rate of E-Services. J. Open Innov. Technol. Mark. Complex. 2021, 7, 204. [Google Scholar] [CrossRef]
  2. Dwivedi, R.; Alrasheedi, M.; Dwivedi, P.; Starešinić, B. Leveraging financial inclusion through technology-enabled services innovation: A case of economic development in India. Int. J. E-Serv. Mob. Appl. 2022, 14, 1–13. [Google Scholar] [CrossRef]
  3. Dwivedi, P.; Alabdooli, J.I.; Dwivedi, R. Role of FinTech adoption for competitiveness and performance of the bank: A study of the banking industry in UAE. Int. J. Glob. Bus. Compet. 2021, 16, 130–138. [Google Scholar] [CrossRef]
  4. Beccalli, E. Does IT investment improve bank performance? Evidence from Europe. J. Bank. Financ. 2009, 31, 2205–2230. [Google Scholar] [CrossRef]
  5. Brynjolfsson, E.; Hitt, L.M. Paradox lost? Firm-level evidence on the returns to information systems spending. Manag. Sci. 1996, 42, 541–558. [Google Scholar] [CrossRef]
  6. Carr, N.G. IT Doesn’t Matter. Harv. Bus. Rev. 2003, 81, 41–49. [Google Scholar] [CrossRef] [PubMed]
  7. Aral, S.; Weill, P. IT Assets, Organizational Capabilities, and Firm Performance: Do resource Allocations and Organizational Differences Explain Performance Variation? Organ. Sci. 2007, 18, 763–780. [Google Scholar] [CrossRef]
  8. Melville, N.; Kraemer, K.; Gurbaxani, V.; Ew, M. Technology information and organizational performance: An integrative model of its business value. MIS Q. 2004, 28, 283–322. [Google Scholar] [CrossRef]
  9. Stefanovic, N.; Barjaktarovic, L.; Bataev, A. Digitainability and financial performance: Evidence from the Serbian banking sector. Sustainability 2021, 13, 13461. [Google Scholar] [CrossRef]
  10. Hanelt, A.; Bohnsack, R.; Marz, D.; Marante, C.A. A systematic review of the literature on digital transformation: Insights and implications for strategy and organizational change. J. Manag. Stud. 2021, 58, 1160–1197. [Google Scholar] [CrossRef]
  11. Gartner. Gartner Says Worldwide Enterprise IT Spending is Forecast to Grow 2.5 Per Cent in 2013; PRESSE BOX; Gartner UK Ltd.: Gartner, UK, 2013; Available online: https://www.gartner.com/en/newsroom/press-releases/2014-04-02-gartner-says-worldwide-it-spending-on-pace-to-grow-3-percent-in-2014 (accessed on 16 June 2023).
  12. Bharadwaj, A.; El Sawy, O.A.; Pavlou, P.A.; Venkatraman, N. Digital business strategy: Toward a next generation of insights. MIS Q. 2013, 37, 471–482. [Google Scholar] [CrossRef]
  13. Yoo, Y.; Boland, R.J.; Lyytinen, K.; Majchrzak, A. Organizing for innovation in the digitized world. Organ. Sci. 2012, 23, 1398–1408. [Google Scholar] [CrossRef]
  14. Hinings, B.; Gegenhuber, T.; Greenwood, R. Digital innovation and transformation: An institutional perspective. Inf. Organ. 2018, 28, 52–61. [Google Scholar] [CrossRef]
  15. Dahlstrom, P.; Erikson, L.; Khanna, S.; Meffert, J. From Disrupted to Disruptor: Reinventing Your Business by Transforming the Core; McKinsey: Chicago, IL, USA, 2017; Available online: https://www.mckinsey.com/~/media/mckinsey/business%20functions/mckinsey%20digital/our%20insights/digital%20reinvention/digital%20reinvention.ashx (accessed on 17 June 2023).
  16. Svahn, F.; Mathiassen, L.; Lindgren, R. Embracing digital innovation in incumbent firms: How Volvo Cars managed competing concerns. MIS Q. 2017, 41, 239–253. [Google Scholar] [CrossRef]
  17. Kane, G.C.; Philips, A.; Copulsky, J.; Garth, A. How Digital Leadership Is Different. MIT Sloan Manag. Rev. 2019, 60, 34–39. [Google Scholar]
  18. Warner, K.; Wäger, M. Building dynamic capabilities for digital transformation: An ongoing process of strategic renewal. Long. Range Plan. 2019, 52, 326–349. [Google Scholar] [CrossRef]
  19. Vial, G. Understanding digital transformation: A review and a research agenda. J. Strateg. Inf. Syst. 2019, 28, 118–144. [Google Scholar] [CrossRef]
  20. Li, F. The digital transformation of business models in the creative industries: A holistic framework and emerging trends. Technovation 2020, 92–93, 102012. [Google Scholar] [CrossRef]
  21. Westerman, G.; Bonnet, D. Revamping your business through digital transformation. MIT Sloan Manag. Rev. 2015, 56, 10–13. [Google Scholar]
  22. Ismail, M.H.; Khater, M.; Zaki, M. Digital Business Transformation and Strategy: What Do We Know So Far? Working Paper; Cambridge Service Alliance; University of Cambridge: Cambridge, UK, 2018. [Google Scholar]
  23. Fitzgerald, M. Embracing Digital Technology: A New Strategic Imperative. MIT Sloan Rev. 2014, 55, 1. [Google Scholar]
  24. Hess, T.; Chanias, S. Understanding digital transformation strategy formation: Insight from Europe’s automotive industry. In Proceedings of the Pacis Conference Proceedings, Munich, Germany, 23 June 2016. [Google Scholar]
  25. Gurbaxani, V.; Dunkle, D. Gearing up for successful digital transformation. MIS Q. 2019, 18, 209–220. [Google Scholar] [CrossRef]
  26. Nambisan, S.; Lyytinen, K.; Majchrzak, A.; Song, M. Digital innovation management: Reinventing innovation management research in a digital world. MIS Q. 2017, 41, 223–238. [Google Scholar] [CrossRef]
  27. Wu, X.; Jin, T.; Yang, K.; Qi, H. The impact of bank Fintech on commercial banks’ risk-taking in China. Int. Rev. Financ. Anal. 2023, 90, 102944. [Google Scholar] [CrossRef]
  28. Nambisan, S.; Wright, M.; Feldman, M. The digital transformation of innovation and entrepreneurship: Progress, challenges, and key themes. Res. Policy 2019, 48, 103773. [Google Scholar] [CrossRef]
  29. Guo, L.; Xu, L. The Effects of Digital Transformation on Firm Performance: Evidence from China’s Manufacturing Sector. Sustainability 2021, 13, 12844. [Google Scholar] [CrossRef]
  30. Kohli, R.; Melville, N.P. Digital innovation: A review and synthesis. Inf. Syst. J. 2019, 29, 200–223. [Google Scholar] [CrossRef]
  31. Fernández-Rovira, C.; Álvarez, V.; Molleví, G.; Nicolas-Sans, N. The digital transformation of business. Towards Datafication Relatsh. Cust. Technol. Forecast. Soc. Chang. 2021, 162, 120339. [Google Scholar] [CrossRef]
  32. Bell, R. Digital Transformation; IBM Global Business Services; IBM Institute for Business Value: Somers, NY, USA, 2011. [Google Scholar]
  33. Bhutani, S.; Paliwal, Y. Digitalization: A step towards sustainable development. Int. J. Sustain. Dev. 2015, 8, 11–24. [Google Scholar]
  34. Yip, A.W.; Bocken, N.M. Sustainable business model archetypes for the banking industry. J. Clean. Prod. 2018, 174, 150–169. [Google Scholar] [CrossRef]
  35. Sloboda, L.; Dunas, N.; Limański, A. Contemporary challenges and risks of retail banking development in Ukraine. Banks Bank System. 2018, 13, 88–97. [Google Scholar] [CrossRef]
  36. Cantoni, F.; Rossignoli, C. New Distribution Models for Financial Services: The Italian Banks’ Approach to the online Trading Development. J. Electron. Commer. Res. 2000, 1, 60–66. [Google Scholar]
  37. Björkdahl, J. Strategies for digitalization in manufacturing firms. Calif. Manag. Rev. 2020, 62, 17–36. [Google Scholar] [CrossRef]
  38. Zuo, L.; Strauss, J.; Zuo, L. The digitalization transformation of commercial banks and its impact on sustainable efficiency improvement through investment in science and technology. Sustainability 2021, 13, 11028. [Google Scholar] [CrossRef]
  39. Yoo, Y.; Henfridsson, O.; Lyytinen, K. The new organizing logic of digital innovation: An agenda for information systems research. Inf. Syst. Res. 2010, 21, 724–735. [Google Scholar] [CrossRef]
  40. Zhu, Y.; Jin, S. COVID-19, Digital Transformation of Banks, and Operational Capabilities of Commercial Banks. Sustainability 2023, 15, 8783. [Google Scholar] [CrossRef]
  41. Zhenyun, C.; Li, H.; Tianbo, W.; Junxian, W. How digital transformation affects bank risk: Evidence from listed Chinese banks. Financ. Res. Lett. 2023, 58, 104319. [Google Scholar]
  42. Yao, T.; Song, L. Can digital transformation reduce bank systemic risk? Empirical evidence from listed banks in China. Econ. Change Restruct. 2023. [Google Scholar] [CrossRef]
  43. Deng, L.; Lv, Y.; Liu, Y.; Zhao, Y. Impact of fintech on bank risk-taking: Evidence from China. Risks 2021, 9, 99. [Google Scholar] [CrossRef]
  44. Valenduc, G.; Vendramin, P. Digitalization, between disruption and evolution. Transfer 2017, 23, 121–134. [Google Scholar] [CrossRef]
  45. Bareisis, Z.; Latimore, D. Defining a Digital Financial Institution: What “Digital” Means in Banking. 2014. Available online: https://www.celent.com/insights/268657967 (accessed on 17 June 2023).
  46. Kwan, A.; Lin, C.; Pursiainen, V.; Tai, M. Stress Testing Banks’ Digital Capabilities: Evidence from the COVID-19 Pandemic. J. Financ. Quant. Anal. 2021, forthcoming. [Google Scholar] [CrossRef]
  47. Indriasari, E.; Lumban Gaol, F.; Matsuo, T. Digital banking transformation: Application of artificial intelligence and big data analytics for leveraging customer experience in the Indonesian banking sector. In Business Computer Science, Proceedings of the 8th International Congress on Advances Applied Informatics, Toyama, Japan, 7–11 July 2019; IEEE: New York, NY, USA, 2019. [Google Scholar]
  48. Koroleva, E.; Kudryavtseva, T. Factors influencing digital bank performance. In Proceedings of the 2018 International Conference on Digital Science; Springer International Publishing: Cham, Switzerland, 2020; pp. 325–333. [Google Scholar] [CrossRef]
  49. Artemenko, D.A.; Zenchenko, S.V. Digital technologies in the financial sector: Evolution and major development trends in Russia and abroad. Digit. Technol. Financ. Theory Pract. 2021, 25, 90–101. [Google Scholar] [CrossRef]
  50. Singh, D. Bank specific and macroeconomic determinants of bank profitability: The Indian evidence. Paradigm 2010, 14, 53–64. [Google Scholar] [CrossRef]
  51. Seenaiah, K.; Rath, B.N.; Samantaraya, A. Determinants of bank profitability in the post-reform period: Evidence from India. Glob. Bus. Rev. 2015, 16, 82–92. [Google Scholar] [CrossRef]
  52. Olmo, B.T.; Saiz, M.C.; Azofra, S.S. Sustainable banking, market power, and efficiency: Effects on banks’ profitability and risk. Sustainability 2021, 13, 1298. [Google Scholar] [CrossRef]
  53. Rakshit, B. Does bank competition necessarily contribute to higher profits? The case of Indian banking. Asian Econ. Lett. 2022, 3. [Google Scholar] [CrossRef]
  54. Abreu, M.; Mendes, V. Commercial Bank Interest Margins and Profitability: Evidence for Some EU Countries; Pan-European Conference Jointly Organised by the IEFS-UK & University of Macedonia Economic & Social Sciences: Thessaloniki, Greece, 2001; pp. 17–20. [Google Scholar]
  55. Ahmed, F.; Qin, Y.; Aduamoah, M. Employee readiness for acceptance of decision support systems as a new technology in E-business environments; A proposed research agenda. In Proceedings of the 7th International Conference on Industrial Technology and Management, ICITM 2018, Oxford, UK, 7–9 March 2018. [Google Scholar]
  56. Pesaran, M.H.; Shin, Y. An Autoregressive Distributed Lag Modeling Approach to Cointegration Analysis; Department of Applied Economics, University of Cambridge: Cambridge, UK, 1995; p. 9514. [Google Scholar]
  57. Pesaran, M.H.; Shin, Y.; Smith, R.J. Pooled mean group estimation of dynamic heterogeneous panels. J. Am. Stat. Assoc. 1999, 94, 621–634. [Google Scholar] [CrossRef]
  58. Pesaran, M.H.; Shin, Y.; Smith, R.J. Bounds testing approaches to the analysis of level relationships. J. Appl. Econom. 2001, 16, 289–326. [Google Scholar] [CrossRef]
  59. Pedroni, P. Fully modified OLS for heterogeneous cointegrated panels and the case of purchasing power parity. Manuscr. Dep. Econ. Indiana Univ. 1996, 5, 1–45. [Google Scholar]
  60. Pedroni, P. Critical values for cointegration tests in heterogeneous panels with multiple regressors. Oxf. Bull. Econ. Stat. 1999, 61, 653–700. [Google Scholar] [CrossRef]
  61. Pedroni, P. Panel cointegration, asymptotic and finite sample properties of pooled time series tests with an application to the PPP hypothesis. Econom. Theory 2004, 20, 597–625. [Google Scholar] [CrossRef]
  62. Hattori, M.; Schrimpf, A.; Sushko, V. The Response of Tail Risk Perceptions to Unconventional Monetary Policy. Am. Econ. J. Macroecon. 2016, 8, 111–136. [Google Scholar] [CrossRef]
  63. Cortes, G.S.; Gao, G.P.; Silva, F.B.; Song, Z. Unconventional Monetary Policy and Disaster Risk: Evidence from the Subprime and COVID–19 Crises. J. Int. Money Financ. 2022, 122, 102543. [Google Scholar] [CrossRef]
  64. Hartley, J.S.; Rebucci, A.; Jimenez, D. An Event Study of COVID-19 Central Bank Quantitative Easing in Advanced and Emerging Economies. NBER Working Paper n.27339. Adv. Econom. 2021, forthcoming. [Google Scholar] [CrossRef]
  65. Said, M.; Ali, H. An analysis on the factors affecting profitability level of Sharia banking in Indonesia. Banks Bank. Syst. 2016, 11, 28–36. [Google Scholar] [CrossRef]
  66. Qehaja-Keka, V.; Skender, A.; Aliu, M. Bank profitability determinants: Evidence from Kosovo and Albania. J. Lib. Int. Aff. 2023, 9, 1857–9760. [Google Scholar] [CrossRef]
  67. Yang, S.; Li, Z.; Ma, Y.; Chen, X. Does electronic banking improve bank performance? evidence in China. Int. J. Econ. Financ. 2018, 10, 82–84. [Google Scholar] [CrossRef]
  68. Boahene, S.H.; Dasah, J.; Agyei, S.K. Credit Risk and profitability of selected banks in Ghana. Res. J. Financ. Account. 2012, 3, 6–14. [Google Scholar]
  69. Yasin, M.A. Impact of Internet banking on financial performance: Empirical evidence from Ethiopia Banks. Res. J. Financ. Account. 2018, 9, 1–8. [Google Scholar]
  70. Adelopo, I.; Lloydking, R.; Tauringana, V. Determinants of bank profitability before, during, and after the financial crisis. Int. J. Manag. Financ. 2018, 14, 378–398. [Google Scholar] [CrossRef]
  71. Al-Matari, E.M. The determinants of bank profitability of GCC: The role of bank liquidity as a moderating variable—Further analysis. Int. J. Financ. Econ. 2021, 28, 1423–1435. [Google Scholar] [CrossRef]
  72. El Shaarani, H. Determinants of Islamic Banks Profitability in MENA Region Before and During the COVID-19 Pandemic Period. Transformation in Banking, Finance and Regulation. In Islamic Accounting and Finance; World Scientific: London, UK, 2023; pp. 623–652. [Google Scholar]
  73. O’Connell, M. Bank-specific, industry-specific and macroeconomic determinants of bank profitability: Evidence from the UK. Stud. Econ. Financ. 2023, 40, 155–174. [Google Scholar] [CrossRef]
  74. Smolina, E.; Markovskaya, E.; Krupnov, Y. Determinants of profitability of commercial banks. Aquaculture. E3S Web Conf. 2023, 381, 02013. [Google Scholar] [CrossRef]
  75. Durguti, E.A. Challenges of Banking Profitability in Eurozone Countries: Analysis of Specific and Macroeconomic Factors. Naše Gospod./Our Econ. 2020, 66, 1–10. [Google Scholar] [CrossRef]
  76. Ercegovac, R.; Klinac, I.; Zdiliric, I. Bank specific determinants of EU bank profitability after 2007 financial crisis. Manag. J. Contemp. Manag. Issues 2020, 25, 89–102. [Google Scholar] [CrossRef]
  77. McKinsey. How Six Companies Are Using Technology and Data to Transform Themselves; McKinsey & Company: Chicago, IL, USA, 2020. [Google Scholar]
  78. Kriebel, J.; Debener, J. The Effect of Digital Transformation on Bank Performance. Economics. Monetary Economics: Financial System Institution. 2021. [Google Scholar]
  79. Dehnert, M. Sustaining the current or pursuing the new: Incumbent digital transformation strategies in the financial service industry: A configurational perspective on firm performance. Bus. Res. 2020, 13, 1071–1113. [Google Scholar] [CrossRef]
  80. Indonesia Financial Services Authority; OJK Virtual Innovation Day; Otoritas Jasa Keuangan (OJK): Jakarta, Indonesia, 2021.
  81. Do, T.D.; Ha Thi Pham, H.A.; Thalassinos, E.I.; Anh Le, H. The Impact of Digital Transformation on Performance: Evidence from Vietnamese Commercial Banks. J. Risk Financ. Manag. 2022, 15, 21. [Google Scholar] [CrossRef]
  82. Nguyen, Q.T.T.; Ho, L.T.H.; Nguyen, D.T. Digitalization and bank profitability: Evidence from an emerging country. Int. J. Bank. Mark. 2023. [Google Scholar] [CrossRef]
  83. Devaraj, S.; Kohli, R. Performance impacts of information technology: Is actual usage the missing link? Management. Science 2003, 49, 273–289. [Google Scholar] [CrossRef]
  84. Raguseo, E.; Vitari, C. Investments in big data analytics and firm performance: An empirical investigation of direct and mediating effects. Int. J. Prod. Res. 2018, 56, 5206–5221. [Google Scholar] [CrossRef]
  85. Pousttchi, K. Digital Transformation, eds. Norbert Gronau, Jörg Becker, Elmar, J., Sinz, Leena Suhl, and Jan Marco Leimeister. Enzyklopädie der Wirtschaftsinformatik; Potsdam, Germany. 2020. Available online: https://wi-lex.de/index.php/lexikon/technologische-und-methodische-grundlagen/informatik-grundlagen/digitalisierung/digitale-transformation/ (accessed on 4 November 2020).
  86. Pousttchi, K.; Alexander, G. Surrounded by middlemen—How multi-sided platforms change the insurance industry. Electron. Mark. 2019, 29, 609–629. [Google Scholar] [CrossRef]
  87. Hammer, M.; James, C. Reengineering the Corporation: A Manifesto for Business Revolution; Harper Business: New York, NY, USA, 1993. [Google Scholar]
  88. Skalen, P.; Gummerus, J.; Von Koskull, C.; Magnusson, P.R. Exploring value propositions and service innovation: A service-dominant logic study. J. Acad. Mark. Sci. 2015, 43, 137–158. [Google Scholar] [CrossRef]
  89. Teece, D.J. Business models, business strategy and innovation. Long. Range Plan. 2010, 43, 172–194. [Google Scholar] [CrossRef]
  90. Sun, Y.; Shi, Y.; Zhang, Z. Finance big data: Management, analysis, and applications. Int. J. Electron. Commer. 2019, 23, 9–11. [Google Scholar] [CrossRef]
  91. Yang, S.O.; Hsu, C.; Sarker, S.; Lee, A.S. Enabling effective operational risk management in a financial institution: An action research study. J. Manag. Inf. Syst. 2017, 34, 727–753. [Google Scholar] [CrossRef]
  92. Setiawati, R.; Eve, J.; Syavira, A.; Ricardianto, P.; Endri, N. The role of Information Technology in Business Agility: Systematic Literature Review. J. Gen. Manag. 2022, 23, 144–149. [Google Scholar] [CrossRef]
  93. Constantiou, I.D.; Kallinikos, J. New games, new rules: Big data and the changing context of strategy. J. Inf. Technol. 2015, 30, 44–57. [Google Scholar] [CrossRef]
  94. Matt, C.; Hess, T.; Benlian, A. Digital transformation strategies. Bus. Inf. Syst. Eng. 2015, 57, 339–343. [Google Scholar] [CrossRef]
  95. Seddon, P.B.; Constantinidis, D.; Tamm, T.; Dod, H. How does business analytics contribute to business value? Inf. Syst. J. 2017, 27, 237–269. [Google Scholar] [CrossRef]
  96. Al-Debei, M.M.; Avison, D. Developing a unified framework of the business model concept. Eur. J. Inf. Syst. 2010, 19, 359–376. [Google Scholar] [CrossRef]
  97. Osterwalder, A.; Pigneur, Y. Business Model Generation: A Handbook for Visionaries, Game Changers, and Challengers; Wiley: New York, NY, USA, 2013. [Google Scholar]
  98. Erevelles, S.; Fukawa, N.; Swayne, L. Big data consumer analytics and the transformation of marketing. J. Bus. Res. 2016, 69, 897–904. [Google Scholar] [CrossRef]
  99. Suoniemi, S.; Meyer-Waarden, L.; Munzel, A.; Zablah, A.R.; Straub, D. Big Data and Firm Performance: The Roles of Market-Directed Capabilities and Business Strategy. Inf. Manag. 2020, 57, 103365. [Google Scholar] [CrossRef]
  100. Porter, M.E.; Heppelmann, J.E. How smart, connected products are transforming competition. Harv. Bus. Review. 2014, 92, 64–88. [Google Scholar]
  101. Liu, D.Y.; Chen, S.W.; Chou, T.C. Resource fit in digital transformation: Lessons learned from the CBC bank global e-banking project. Manag. Decis. 2011, 49, 1728–1742. [Google Scholar] [CrossRef]
  102. Scott, S.V.; Reenen, J.M.V.; Zachariadis, M. The long-term effect of digital innovation on bank performance: An empirical study of SWIFT adoption in financial services. Res. Policy 2017, 46, 984–1004. [Google Scholar] [CrossRef]
  103. Bertoni, F.; Croce, A. The productivity of European life insurers: Best-practice adoption vs. innovation. Geneva Pap. Risk Insur.-Issues Pract. 2011, 36, 165–185. [Google Scholar] [CrossRef]
  104. Ravichandran, T. Exploring the relationships between IT competence, innovation capacity, and organizational agility. J. Strateg. Inf. Syst. 2018, 27, 22–42. [Google Scholar] [CrossRef]
  105. DeYoung, R.; Lang, W.W.; Nolle, D.L. How the Internet affects output and performance at community banks. J. Bank. Financ. 2007, 31, 1033–1060. [Google Scholar] [CrossRef]
  106. Kulu, E.; Opoku, A.; Gbolonyo, E.; Kodwo, M.A.T. Mobile money transactions and banking sector performance in Ghana. Heliyon 2022, 8, e10761. [Google Scholar] [CrossRef]
  107. Dalenogare, L.S.; Benitez, G.B.; Ayala, N.F.; Frank, A.G. The expected contribution of Industry 4.0 technologies for industrial performance. International Journal Production Economics. Int. J. Prod. Econ. 2018, 204, 383–394. [Google Scholar] [CrossRef]
  108. Zhu, K.; Kraemer, K.L. Post-adoption variations in usage and value of e-business by organizations: Cross-country evidence from the retail industry. Inf. Syst. Res. 2005, 16, 61–84. [Google Scholar] [CrossRef]
  109. Fichman, R.G. Going beyond the dominant paradigm for information technology innovation research: Emerging concepts and methods. J. Assoc. Inf. Syst. 2004, 5, 1–43. [Google Scholar] [CrossRef]
  110. Melrose, C.; Leeder, N.; Immerman, D. The State of Industrial Digital Transformation. 2021. Available online: https://www.ptc.com/en/resources/iiot/white-paper/state-of-industrial-digital-transformation (accessed on 1 October 2023).
  111. Martin, J.F. Unlocking Success in Digital Transformations. 2018. Available online: https://www.mckinsey.com/businessfunctions/people-and-organizational-performance/our-insights/unlocking-success-in-digital-transformations (accessed on 1 October 2023).
  112. Deng, L.; Song, H.; Yang, Y.F.; Tong, H.; Guo, L. China Enterprise Digital Transformation Index. 2021. Available online: http://www.clii.com.cn/lhrh/hyxx/202110/P020211013111850.pdf (accessed on 1 October 2023).
  113. Chen, B.; Yang, X.; Ma, Z. Fintech and Financial Risks of Systemically Important Commercial Banks in China: An Inverted U-Shaped Relationship. Sustainability 2022, 14, 5912. [Google Scholar] [CrossRef]
  114. Lan Nguyen, T.-H.; Hung Nguyen, V.; Anh Nguyen, P.; Nguyen, D.V. How does digital transformation impact bank performance? Cogent Econ. Financ. 2023, 11, 2217582. [Google Scholar] [CrossRef]
  115. Mahmood, M.A.; Mann, G.J. Information technology investments and organizational productivity and performance: An empirical investigation. J. Organ. Comput. Electron. Commer. 2005, 15, 185–202. [Google Scholar] [CrossRef]
  116. Kohli, R.; Grover, V. Business Value of IT: An Essay on Expanding Research Directions to Keep up with the Times. J. Assoc. Inf. Syst. 2008, 9, 23–39. [Google Scholar] [CrossRef]
  117. Shang, X.; Niu, H. Does the digital transformation of banks affect green credit? Financ. Res. Lett. 2023, 58, 104394. [Google Scholar] [CrossRef]
  118. Habir, M.; Negara, S.D. The Digital Transformation of Indonesia’s Banking Sector: Current Trends and Future Prospects. In Perspective; ISEAS Yusof Ishak Institute: Singapore, 2023; Volume 78, ISSN 2335-6677. [Google Scholar]
  119. Kitsios, F.; Kamariotou, M. Open Data Hackathons: An Innovative Strategy to Enhance Entrepreneurial Intention. Int. J. Innov. Sci. 2018, 10, 519–538. [Google Scholar] [CrossRef]
  120. Kitsios, F.; Kamariotou, M. Service innovation process digitization: Areas for exploitation and exploration. J. Hosp. Tour. Technol. 2021, 12, 4–18. [Google Scholar] [CrossRef]
  121. Kitsios, F.; Kamariotou, M. Critical success factors in service innovation strategies: An annotated bibliography on NSD. In Proceedings of the British Academy of Management (BAM) Conference, Newcastle, UK, 6–8 September 2016. [Google Scholar]
  122. Kitsios, F.; Kamariotou, M.; Talias, M. Corporate Sustainability Strategies and Decision Support Methods: A Bibliometric Analysis. Sustainability 2020, 12, 521. [Google Scholar] [CrossRef]
  123. Kamariotou, M.; Kitsios, F. Critical Factors of Strategic Information Systems Planning Phases in SMEs. In Information Systems, EMCIS 2018, Lecture Notes in Business Information Processing; Themistocleous, M., Rupino da Cunha, P., Eds.; Springer: Cham, Switzerland, 2019; Volume 341, pp. 503–517. [Google Scholar]
  124. Kitsios, F.; Kamariotou, M. Artificial Intelligence and Business Strategy towards Digital Transformation: A Research Agenda. Sustainability 2021, 13, 2025. [Google Scholar] [CrossRef]
  125. Mitroulis, D.; Kitsios, F. Using multicriteria decision analysis to evaluate the effect of digital transformation on organizational performance: Evidence from Greek tourism SMEs. Int. J. Decis. Support. Syst. 2019, 4, 143–158. [Google Scholar] [CrossRef]
  126. Mitroulis, D.; Kitsios, F. Evaluating digital transformation strategies: A MCDA analysis of Greek tourism SMEs. In Proceedings of the 14th European Conference on Innovation and Entrepreneurship (ECIE19), Kalamata, Greece, 19–20 September 2019. [Google Scholar]
Figure 1. Trend of return on assets in seven digital business model banks. Source: Indonesian FSA, 2023.
Sustainability 15 16293 g001
Figure 2. The trend of Operational Cost to Operational Income Ratio in seven digital business model banks. Source: Indonesian FSA, 2023.
Sustainability 15 16293 g002
Figure 3. Non-interest operating expenses (IT expense, HR expense, promotional and general expense).
Sustainability 15 16293 g003
Figure 4. Response of profit to digital transformation.
Sustainability 15 16293 g004
Table 1. Operational definitions, indicators, and measurement data.
VariablesDefinitionUnitsSource
ProfitabilityBank ProfitRpIndonesian FSA
Non-Performing Loan (NPL)/Non-Performing Financing (NPF)Non-performing loans/total number of loans%Indonesian FSA
Capital Adequacy Ratio (CAR)(Tier 1 capital + tier 2 capital)/risk-weighted assets%Indonesian FSA
Loan to Deposit Ratio (LDR)/Financing to Deposit Ratio (FDR)Total Loans/Total Deposit%Indonesian FSA
Operational Cost to Operational Income (OC/OI)Operational Cost/Operational Income%Indonesian FSA
Digital TransformationIT infrastructure investment and outsourcing digital services cost + human resource including tech-talent expensesLn (Rp)Indonesian FSA
Net Interest Margin (NIM)Net interest income/Average InterestEarnings Assets%Indonesian FSA
Growth Domestic Product (GDP) growthGrowth Domestic Product Growth Indonesia%Central Bank of Indonesia
InflationConsumer Price Index (CPI) Inflation%Central Bank of Indonesia
ForexThe exchange rate of the dollar against the rupiahRp/USDCentral Bank of Indonesia
Table 2. Descriptive statistics.
ProfitNPLCARLDRNIMOC/OIDTGDP GrowthInflationForex
Mean−7.98 × 1094.2798.835579.634.50115.8423.293.923.1114,141.55
Median5.51 × 1083.2628.8591.014.5696.9523.255.043.1914,184.52
Maximum1.70 × 101146.551165.50435,246.8020.95420.5526.675.425.9515,867.43
Minimum−1.52 × 10120.009.230.00−12.2326.7920.24−2.271.3213,017.24
Std. Dev.8.28 × 10105.97169.4343,670.593.9856.081.082.311.12661.09
Skewness−14.02764.423.138.81−0.712.420.31−1.840.330.32
Kurtosis232.555926.8513.6281.999.1810.252.654.812.832.57
Jarque–Bera1,341,53216,224.683811.53164,289.901010.561902.1212.99420.2711.5515.10
Probability0000000.0000.000.00
Sum−4.80 × 10122572.7659,492.693,358,9372710.1869,732.8613,949.622359.471870.198,513,212
Sum Sq. Dev.4.12 × 102421,420.717,251,7971.15 × 10129501.791,889,989693.763205.62753.072.63 × 108
Observation602602602602602602599602602602
Raw Data Source: Indonesia’s FSA and Bank Indonesia.
Table 3. Unit root test results.
I(0) (Level)I(1) (First Difference)
LLCIPSADFPPLLCIPSADFPP
Profit−4.68 ***−6.06 ***68.85 ***187.33 ***
NPL−0.92 ***−1.55 *23.11 **33.69 ***−10.06 ***−14.79 ***186.25 ***151.02 ***
CAR−0.88−1.7821.4127.88−11.67 ***−13.45 ***179.69 ***148.60 ***
LDR−0.50−2.59 ***38.73 ***70.25 ***−10.99 ***−14.91 ***182.94 ***158.30 ***
NIM4.083.207.317.91−7.69 ***−9.23 ***112.83 ***214.64 ***
OC/OI0.46−1.5820.1136.57 ***−6.78 ***−12.80 ***168.70 ***156.70 ***
GDP growth−2.52 ***−2.98 ***29.46 ***11.60−8.48 ***−7.74 ***87.68 ***67.53 ***
Inflation2.511.404.325.106.11−6.45 ***69.34 ***235.87 ***
Forex rate−0.820.955.5110.31−13.28 ***−15.90 ***214.92 ***128.94 ***
LLC: Levin, Lin and Chu; IPS: Im, Pesaran, and Shin W-stat; ADF: Augmented Dickey–Fuller—Fisher Chi-square; PP: Philip–Peron–Fisher Chi-square; (*) significant at 10%; (**) significant at 5%; and (***) significant at 1%.
Table 4. Lag length selection.
ModelLogLAICSpecification
1−13,736.3233350.38005ARDL (1, 1, 1, 1, 1, 1, 1, 1, 1, 1)
2−13,670.4288250.36950ARDL (1, 2, 2, 2, 2, 2, 2, 2, 2, 2)
3−13,597.7516950.33425ARDL (1, 3, 3, 3, 3, 3, 3, 3, 3, 3)
4−13,483.8570950.14884ARDL (1, 4, 4, 4, 4, 4, 4, 4, 4, 4)
5−13,398.8034550.06850ARDL (1, 5, 5, 5, 5, 5, 5, 5, 5, 5)
6−13,730.9791750.38608ARDL (2, 1, 1, 1, 1, 1, 1, 1, 1, 1)
7−13,659.7938750.35626ARDL (2, 2, 2, 2, 2, 2, 2, 2, 2, 2)
8−13,587.2073750.32134ARDL (2, 3, 3, 3, 3, 3, 3, 3, 3, 3)
9−13,476.1277350.14619ARDL (2, 4, 4, 4, 4, 4, 4, 4, 4, 4)
10−13,389.4692850.06000ARDL (2, 5, 5, 5, 5, 5, 5, 5, 5, 5)
11−13,721.5415550.37720ARDL (3, 1, 1, 1, 1, 1, 1, 1, 1, 1)
12−13,658.9272950.37861ARDL (3, 2, 2, 2, 2, 2, 2, 2, 2, 2)
13−13,579.7761650.31977ARDL (3, 3, 3, 3, 3, 3, 3, 3, 3, 3)
14−13,460.4215450.11447ARDL (3, 4, 4, 4, 4, 4, 4, 4, 4, 4)
15−13,371.8755550.02141ARDL (3, 5, 5, 5, 5, 5, 5, 5, 5, 5)
16−13,715.4383150.38047ARDL (4, 1, 1, 1, 1, 1, 1, 1, 1, 1)
17−13,655.4145950.39131ARDL (4, 2, 2, 2, 2, 2, 2, 2, 2, 2)
18−13,558.1333450.26642ARDL (4, 3, 3, 3, 3, 3, 3, 3, 3, 3)
19−13,473.9420950.18922ARDL (4, 4, 4, 4, 4, 4, 4, 4, 4, 4)
20−13,345.3036849.95010ARDL (4, 5, 5, 5, 5, 5, 5, 5, 5, 5)
21−13,703.4954350.36246ARDL (5, 1, 1, 1, 1, 1, 1, 1, 1, 1)
22−13,632.0640150.33175ARDL (5, 2, 2, 2, 2, 2, 2, 2, 2, 2)
23−13,535.7970650.21055ARDL (5, 3, 3, 3, 3, 3, 3, 3, 3, 3)
24−13,443.788850.10488ARDL (5, 4, 4, 4, 4, 4, 4, 4, 4, 4)
25−13,309.3415649.84460ARDL (5, 5, 5, 5, 5, 5, 5, 5, 5, 5)
Table 5. Cointegration Test.
Johansen Fisher Panel Cointegration Test
Fisher Stat. from trace test)Fisher Stat. (from max-eigen test)
310.3 ***137.8 ***
The null hypothesis is no cointegration; (***) represent statistical significance at the 1% levels, respectively (null hypothesis rejected).
Table 6. Results of Pedroni residual cointegration test.
Alternative Hypothesis: Common AR Coefs.
(Within-Dimension)
Alternative Hypothesis: Individual AR Coefs.
(Between-Dimension)
Panel v-StatisticPanel rho-StatisticPanel PP-StatisticPanel ADF-StatisticGroup rho-StatisticGroup PP-StatisticGroup ADF-Statistic
Profit—NPL−0.17−26.29 ***−14.22 ***−10.33 ***−25.57 ***−16.26 ***−10.78 ***
Profit—CAR−0.51−28.36 ***−15.53 ***−10.76 ***−25.63 ***−16.90 ***−11.19 ***
Profit—LDR−1.01−25.44 ***−13.87 ***−11.29 ***−26.44 ***−16.66 ***−10.84 ***
Profit—NIM0.42−22.42 ***−12.81 ***−8.71 ***−24.73 ***−16.12 ***−10.28 ***
Profit—OC/OI−0.31−23.78 ***−13.60 ***−10.81 ***−25.03 ***−20.58 ***−13.44 ***
Profit–GDP Growth−0.21−26.90 ***−14.86 ***−10.98 ***−24.47 ***−16.01 ***−10.97 ***
Profit—inflation−1.08−24.39 ***−13.64 ***−10.23 ***−24.87 ***−15.89 ***−10.57 ***
Profit—Forex rate−0.07−28.66 ***−15.26 ***−9.68 ***−24.62 ***−15.50 ***−9.64 ***
Profit—DT−0.54−29.70 ***−16.21 ***−10.55 ***−24.93 ***−16.23 ***−10.69 ***
The null hypothesis is no cointegration. (***) represent statistical significance at the 1% level.
Table 7. Long-run ARDL panel regression.
Dependent Variable: ProfitCoefficient
NPL−5.40 × 10⁸ (1.90 × 10⁸) ***
CAR40,756,308 (5,928,499) ***
LDR−103,456.5 (44,573.73) **
NIM5.33 × 108 (2.04 × 10⁸) ***
OC/OI−1.36 × 108 (31,413,124) ***
DT3.78 × 109 (1.83 × 10⁹) **
GDP Growth3.43 × 109 (4.55 × 10⁸) ***
Inflation5.90 × 108 (3.85 × 10⁸)
Foreign exchange rate−1,514,491 (495,313.2) ***
Notes: (***) and (**) represent statistical significance at the 1% and 5% levels, respectively. ( ) represents standard errors.
Table 8. Short-run ARDL panel regression.
Dependent Variable: ProfitCoefficientDependent Variable: ProfitCoefficient
COINTEQ01−0.914 (0.426) **COVID−1.00 × 10¹⁰ (7.67 × 10⁹)
C−6.41 × 10¹⁰ (2.98 × 10¹⁰) **D(OC/OI)−1.69 × 109 (9.67 × 10⁸) *
D(PROFIT(−1))0.096 (0.367)D(OC/OI(−1))−7.3 × 107 (1.39 × 10⁸)
D(PROFIT(−2))0.158 (0.371)D(OC/OI(−2))1.67 × 108 (2.43 × 10⁸)
D(PROFIT(−3))0.096 (0.265)D(OC/OI(−3))−3.50 × 108 (1.76 × 10⁸) **
D(PROFIT(−4))0.087 (0.191)D(OC/OI(−4))−6.12 × 108 (6.66 × 10⁸)
D(NPL)2.77 × 10⁹ (2.78 × 10⁹)D(DT)−3.25 × 10⁹ (7.82 × 10⁹)
D(NPL(−1))−1.16 × 10⁹ (2.34 × 10⁹)D(DT(−1))−3.75 × 10⁸ (6.46 × 10⁹)
D(NPL(−2))−2.28 × 10⁹ (1.26 × 10⁹) *D(DT(−2))−6.97 × 10⁹ (7.22 × 10⁹)
D(NPL(−3))2.21 × 10⁹ (2.08 × 10⁹)D(DT(−3))−8.52 × 10⁸ (5.83 × 10⁹)
D(NPL(−4))1.05 × 10¹⁰ (1.14 × 10¹⁰)D(DT(−4))−5.58 × 10⁸ (5.49 × 10⁹)
D(CAR)1.04 × 10⁹ (7.45 × 10⁸)D(GDP GROWTH)1.02 × 10¹⁰ (1.07 × 10¹⁰)
D(CAR(−1))3.47 × 10⁸ (2.62 × 10⁸)D(GDP GROWTH(−1))−1.47 × 10⁹ (9.65 × 10⁹)
D(CAR(−2))−1.03 × 10⁹ (7.03 × 10⁸)D(GDP GROWTH(−2))−5.29 × 10⁹ (9.92 × 10⁹)
D(CAR(−3))1.51 × 10⁸ (4.56 × 10⁸)D(GDP GROWTH(−3))−1.46 × 10¹⁰ (2.78 × 10¹⁰)
D(CAR(−4))9.19 × 10⁸ (8.42 × 10⁸)D(GDP GROWTH(−4))9.45 × 10⁹ (1.89 × 10¹⁰)
D(LDR)−5.57 × 10⁸ (4.13 × 10⁸)D(INFLATION)−1.01 × 10⁹ (6.60 × 10⁹)
D(LDR(−1))−8.00 × 10⁸ (4.81 × 10⁸) *D(INFLATION(−1))4.68 × 10⁹ (3.46 × 10⁹)
D(LDR(−2))−1.19 × 10⁸ (5.92 × 10⁸)D(INFLATION(−2))1.90 × 10⁹ (5.20 × 10⁹)
D(LDR(−3))6.93 × 10⁸ (6.77 × 10⁸)D(INFLATION(−3))−2.49 × 10⁹ (6.16 × 10⁹)
D(LDR(−4))−5.04 × 10⁸ (7.85 × 10⁸)D(INFLATION(−4))−1.30 × 10¹⁰ (7.35 × 10⁹) *
D(NIM)−1.12 × 10⁹ (2.74 × 10⁹)D(FOREX)7,650,278 (6,181,782)
D(NIM(−1))−4.78 × 10⁹ (1.13 × 10¹⁰)D(FOREX(−1))800,552.4 (6,704,772)
D(NIM(−2))2.22 × 10⁹ (6.49 × 10⁹)D(FOREX(−2))7,204,262 (5,938,625)
D(NIM(−3))−1.31 × 10¹⁰ (8.82 × 10⁹)D(FOREX(−3))−8,082,895 (8,392,114)
D(NIM(−4))−6.56 × 10⁸ (8.50 × 10⁹)D(FOREX(−4))−1 × 10⁷ (13,524,080)
Notes: (**) and (*) represent statistical significance at the 5%, and 10% levels, respectively. ( ) represents standard errors.
Disclaimer/Publisher’s Note: The statements, opinions and data contained in all publications are solely those of the individual author(s) and contributor(s) and not of MDPI and/or the editor(s). MDPI and/or the editor(s) disclaim responsibility for any injury to people or property resulting from any ideas, methods, instructions or products referred to in the content.

