


Sustainability Assessment of Coffee Silverskin Waste Management in the Metropolitan City of Naples (Italy): A Life Cycle Perspective

 ,
, 
 and
and
Abstract
:1. Introduction
2. Materials and Methods
2.1. Life Cycle Assessment (LCA)
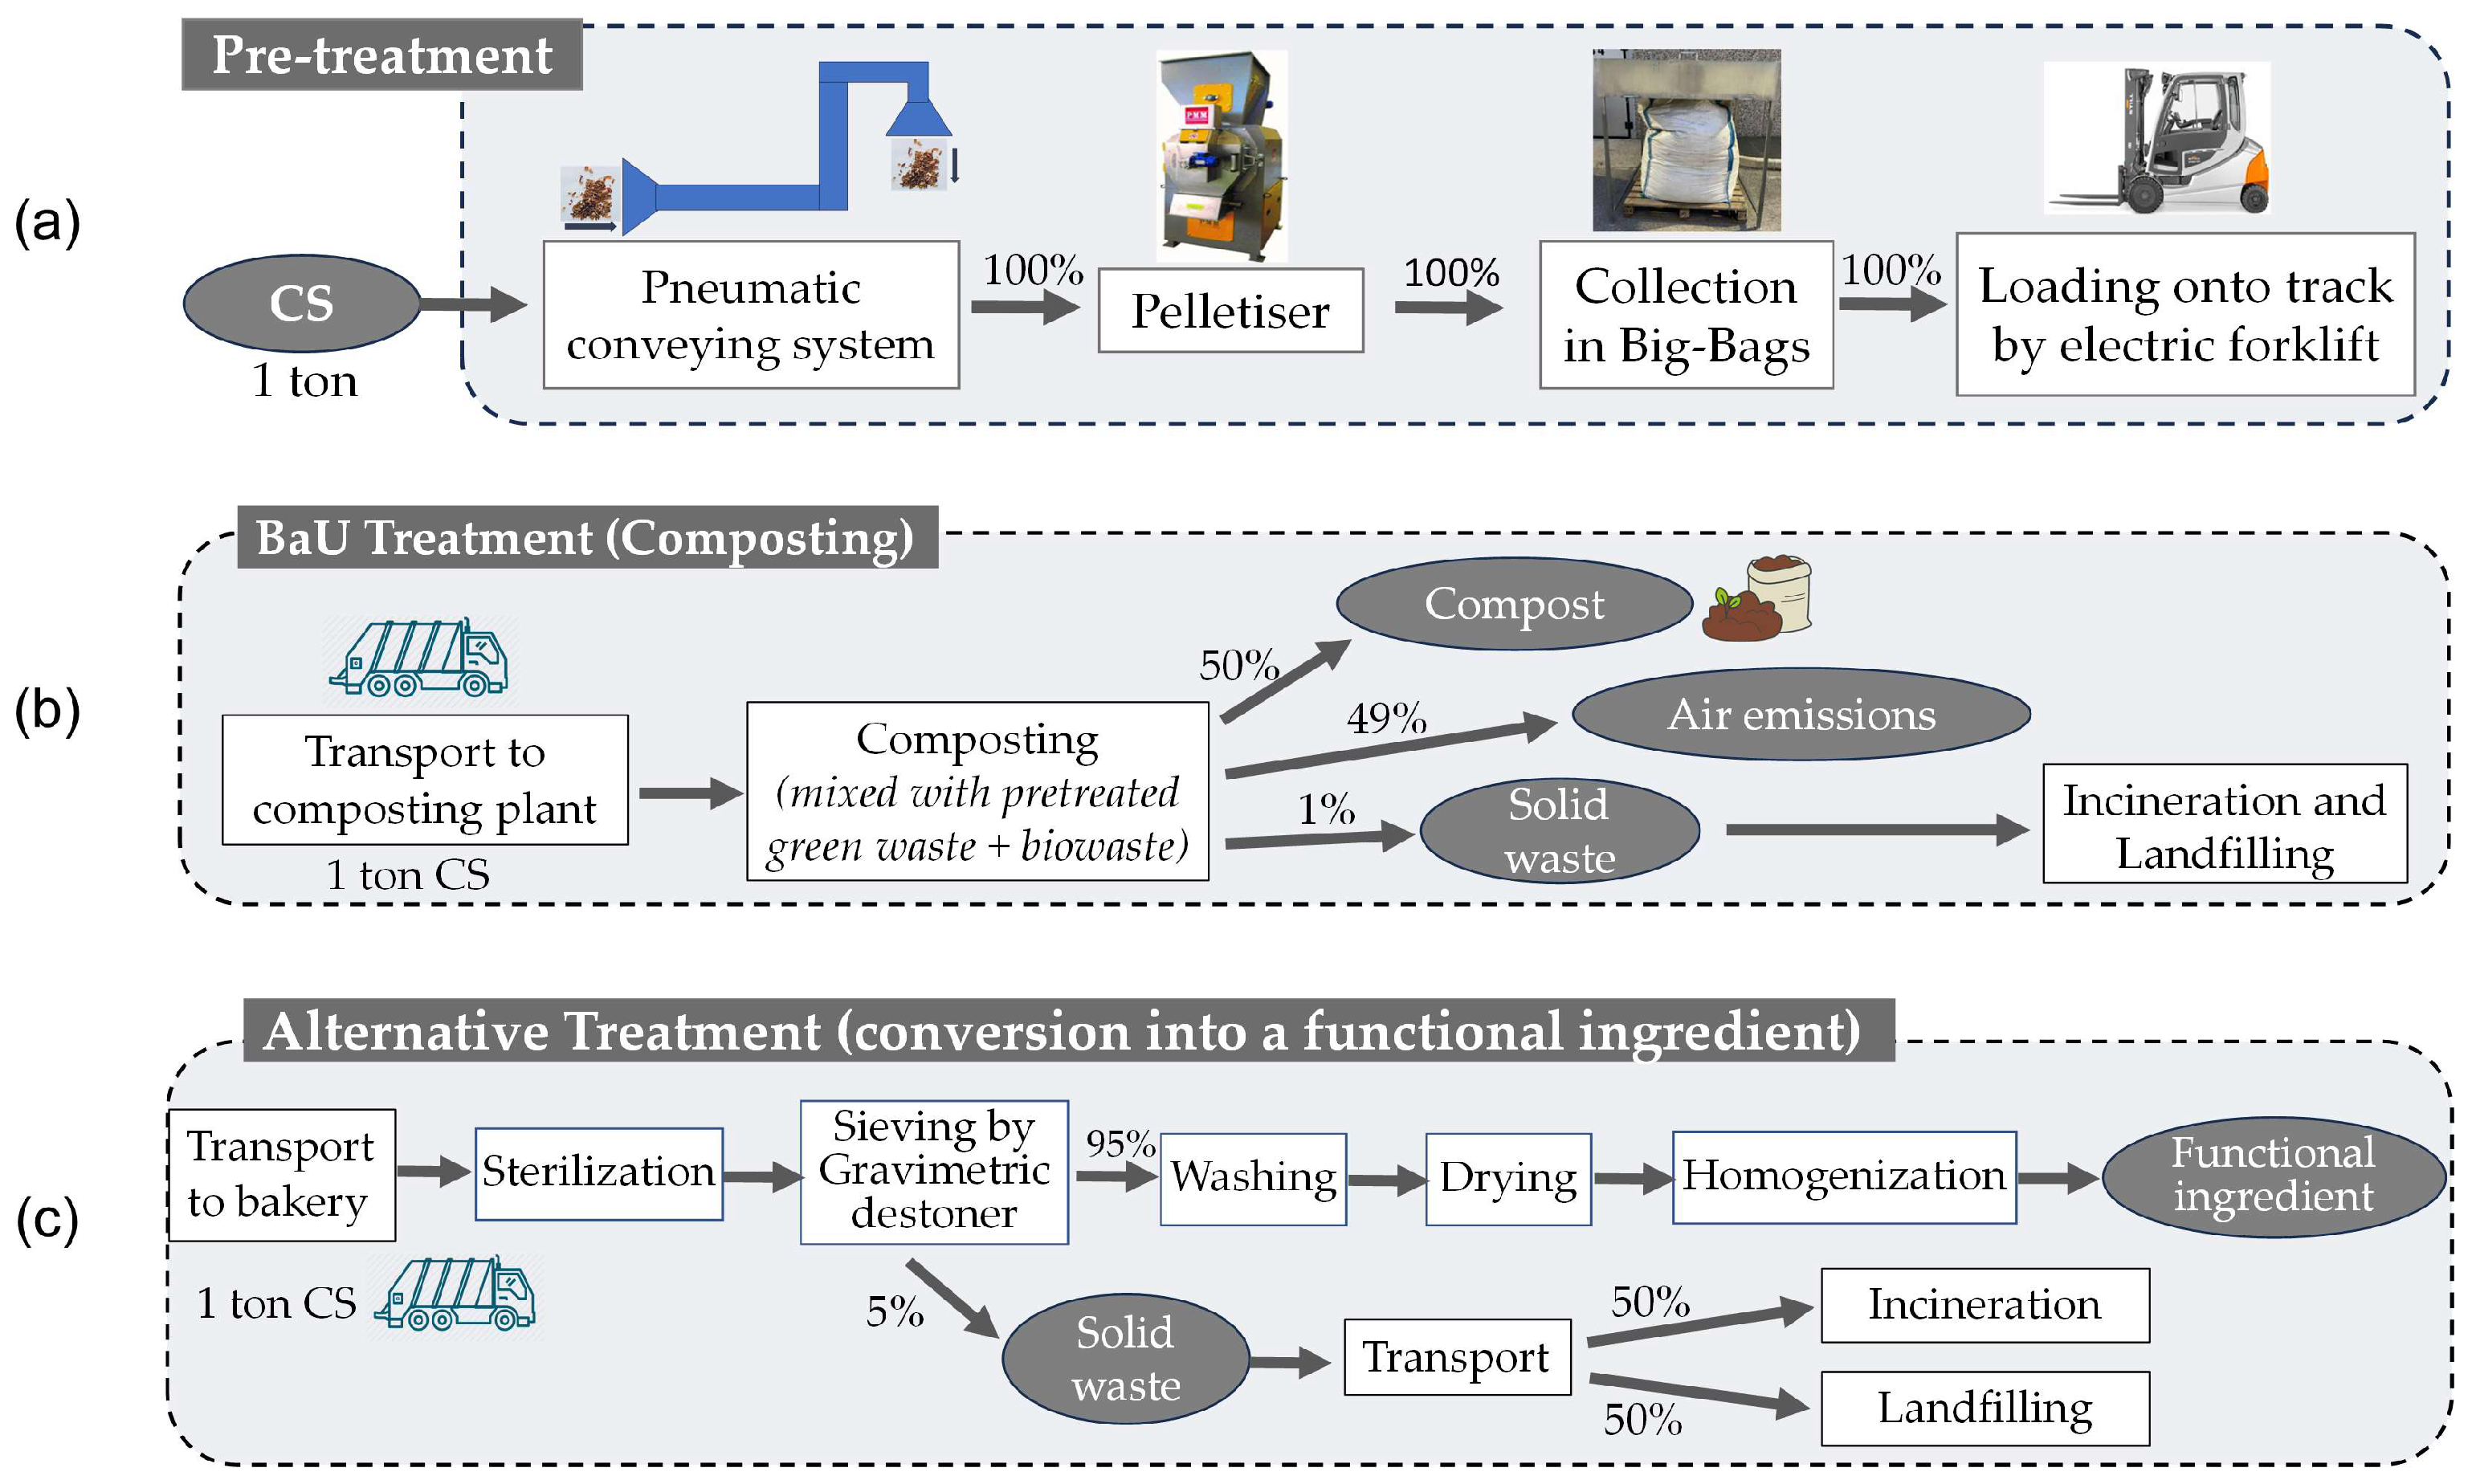
2.1.1. Goal and Scope Definition
BaU Scenario
Alternative Scenario
2.1.2. Life Cycle Inventory (LCI)

| BaU scenario | |||
| Pre-treatment | |||
| Inputs | Unit | Amount | References 1 |
| Coffee Silverskin (CS) | ton | 1.00 × 100 | |
| Pneumatic conveying system | [70,71], A | ||
| Steel | kg | 3.00 × 10⁻² | |
| Steel working | kg | 3.00 × 10⁻² | |
| Aluminium | kg | 3.00 × 10⁻² | |
| Aluminium working | kg | 3.00 × 10⁻² | |
| Electricity, medium voltage {IT} | kWh | 3.00 × 100 | |
| Pelletizer | P, A, [77] | ||
| Steel | kg | 2.20 × 10⁻¹ | |
| Steel working | kg | 2.20 × 10⁻¹ | |
| Iron | kg | 1.00 × 10⁻¹ | |
| Iron working | kg | 1.00 × 10⁻¹ | |
| Electricity, medium voltage {IT} | kWh | 1.00 × 10² | |
| Tap water | ton | 8.00 × 10⁻³ | P |
| Big Bags | [72], P | ||
| Polypropylene, granulate | kg | 3.60 × 100 | |
| Polypropylene Injection moulding | kg | 3.60 × 100 | |
| Scaffold for Big Bag | [73], A | ||
| Steel | kg | 1.30 × 10⁻¹ | |
| Steel working | kg | 1.30 × 10⁻¹ | |
| Electric Forklift | [74], P, A | ||
| Steel | kg | 7.80 × 10⁻¹ | |
| Steel working | kg | 7.80 × 10⁻¹ | |
| Aluminium | kg | 9.00 × 10⁻² | |
| Aluminium working | kg | 9.00 × 10⁻² | |
| Battery cell, Li-ion | kg | 2.90 × 10⁻¹ | |
| Electricity, medium voltage {IT} | kWh | 8.52 × 100 | |
| Outputs | |||
| Coffee Silverskin (CS) | ton | 1.00 × 100 | |
| Treatment (Composting) | |||
| Inputs | Unit | Amount | References 1 |
| Coffee Silverskin (CS) | ton | 1.00 × 100 | |
| Transport | tkm | 1.34 × 10² | |
| Composting | ton | 1.00 × 100 | EcoInvent v.3.8 |
| Outputs | |||
| Compost | kg | 5.00 × 10² | |
| Avoided Products | |||
| Synthetic N fertilizer | kg | 6.00 × 100 | [75] |
| Synthetic K fertilizer (as K2O) | kg | 3.50 × 100 | [75] |
| Synthetic P fertilizer (as P2O5) | kg | 2.50 × 100 | [75] |
| Alternative scenario | |||
| Pre-treatment | |||
| Inputs 2 | Unit | Amount | References 1 |
| Big Bags | [72], P | ||
| Polypropylene, granulate | kg | 1.80 × 10⁻¹ | |
| Polypropylene Injection molding | kg | 1.80 × 10⁻¹ | |
| Treatment (transformation into a functional ingredient) | |||
| Inputs | |||
| Coffee Silverskin (CS) | ton | 1.00 × 100 | |
| Transport to the Bakery | tkm | 2.80 × 10² | |
| Sterilizer | [78] | ||
| Steel | kg | 5.07 × 100 | |
| Steel working | kg | 5.07 × 100 | |
| Electricity, medium voltage {IT} | kWh | 8.20 × 10² | |
| Gravimetric destoner | [79] | ||
| Steel | kg | 7.00 × 10⁻² | |
| Steel working | kg | 7.00 × 10⁻² | |
| Electricity, medium voltage {IT} | kWh | 2.67 × 100 | |
| Waste transport | tkm | 7.85 × 100 | |
| Plastic basin | [80] | ||
| PolyEthylene (PE) | kg | 5.00 × 10⁻² | |
| PE working (injection moulding) | kg | 5.00 × 10⁻² | |
| Tap water | ton | 9.50 × 10⁻¹ | A |
| Professional oven | p | 7.53 × 10⁻⁵ | EcoInvent v3.8 |
| Electricity, medium voltage {IT} | kWh | 2.69 × 10² | |
| Homogenizer | [81], P | ||
| Steel | kg | 2.60 × 10⁻¹ | |
| Steel working | kg | 2.60 × 10⁻¹ | |
| Electricity, medium voltage {IT} | kWh | 8.55 × 100 | |
| Outputs | |||
| Functional ingredient | ton | 9.50 × 10⁻¹ | |
| Solid waste | A | ||
| Incineration | ton | 2.50 × 10⁻² | |
| Landfill | ton | 2.50 × 10⁻² | |
| Wastewater | ton | 9.50 × 10⁻¹ | A |
| Avoided Products | |||
| Wheat flour | ton | 9.50 × 10⁻¹⁰ | |
2.1.3. Life Cycle Impact Assessment (LCIA)
2.2. Life Cycle Costing (LCC)
- The cost estimate of the pneumatic conveying system was made assuming a purchase cost of 1000 €, a 15-year lifetime, and a productivity of 20 tons of CS per year.
- Maintenance costs were always considered equal to 3% of the purchase cost.
- Personnel costs were calculated considering a net salary of 1400 €/month, as indicated by the coffee company, and assuming a gross cost equal to 210% of the net one [92], 168 working hours per month (40 h a week) [93], and 1.58 h (95 min) of total work for managing 1 ton of CS, with 1.42 h (85.2 min) allocated to handling the big bags with the electric forklift.
- The increase in the cost of baked products following enrichment with CS was considered equal to 20% (preliminary estimate provided by the bakery testing the valorization of CS as a functional ingredient on a pilot scale).
3. Results
3.1. Life Cycle Assessment
3.1.1. BaU Scenario
3.1.2. Alternative Scenario
3.2. Life Cycle Costing
3.2.1. Internal Costs
3.2.2. External Costs (Externalities)
4. Discussion
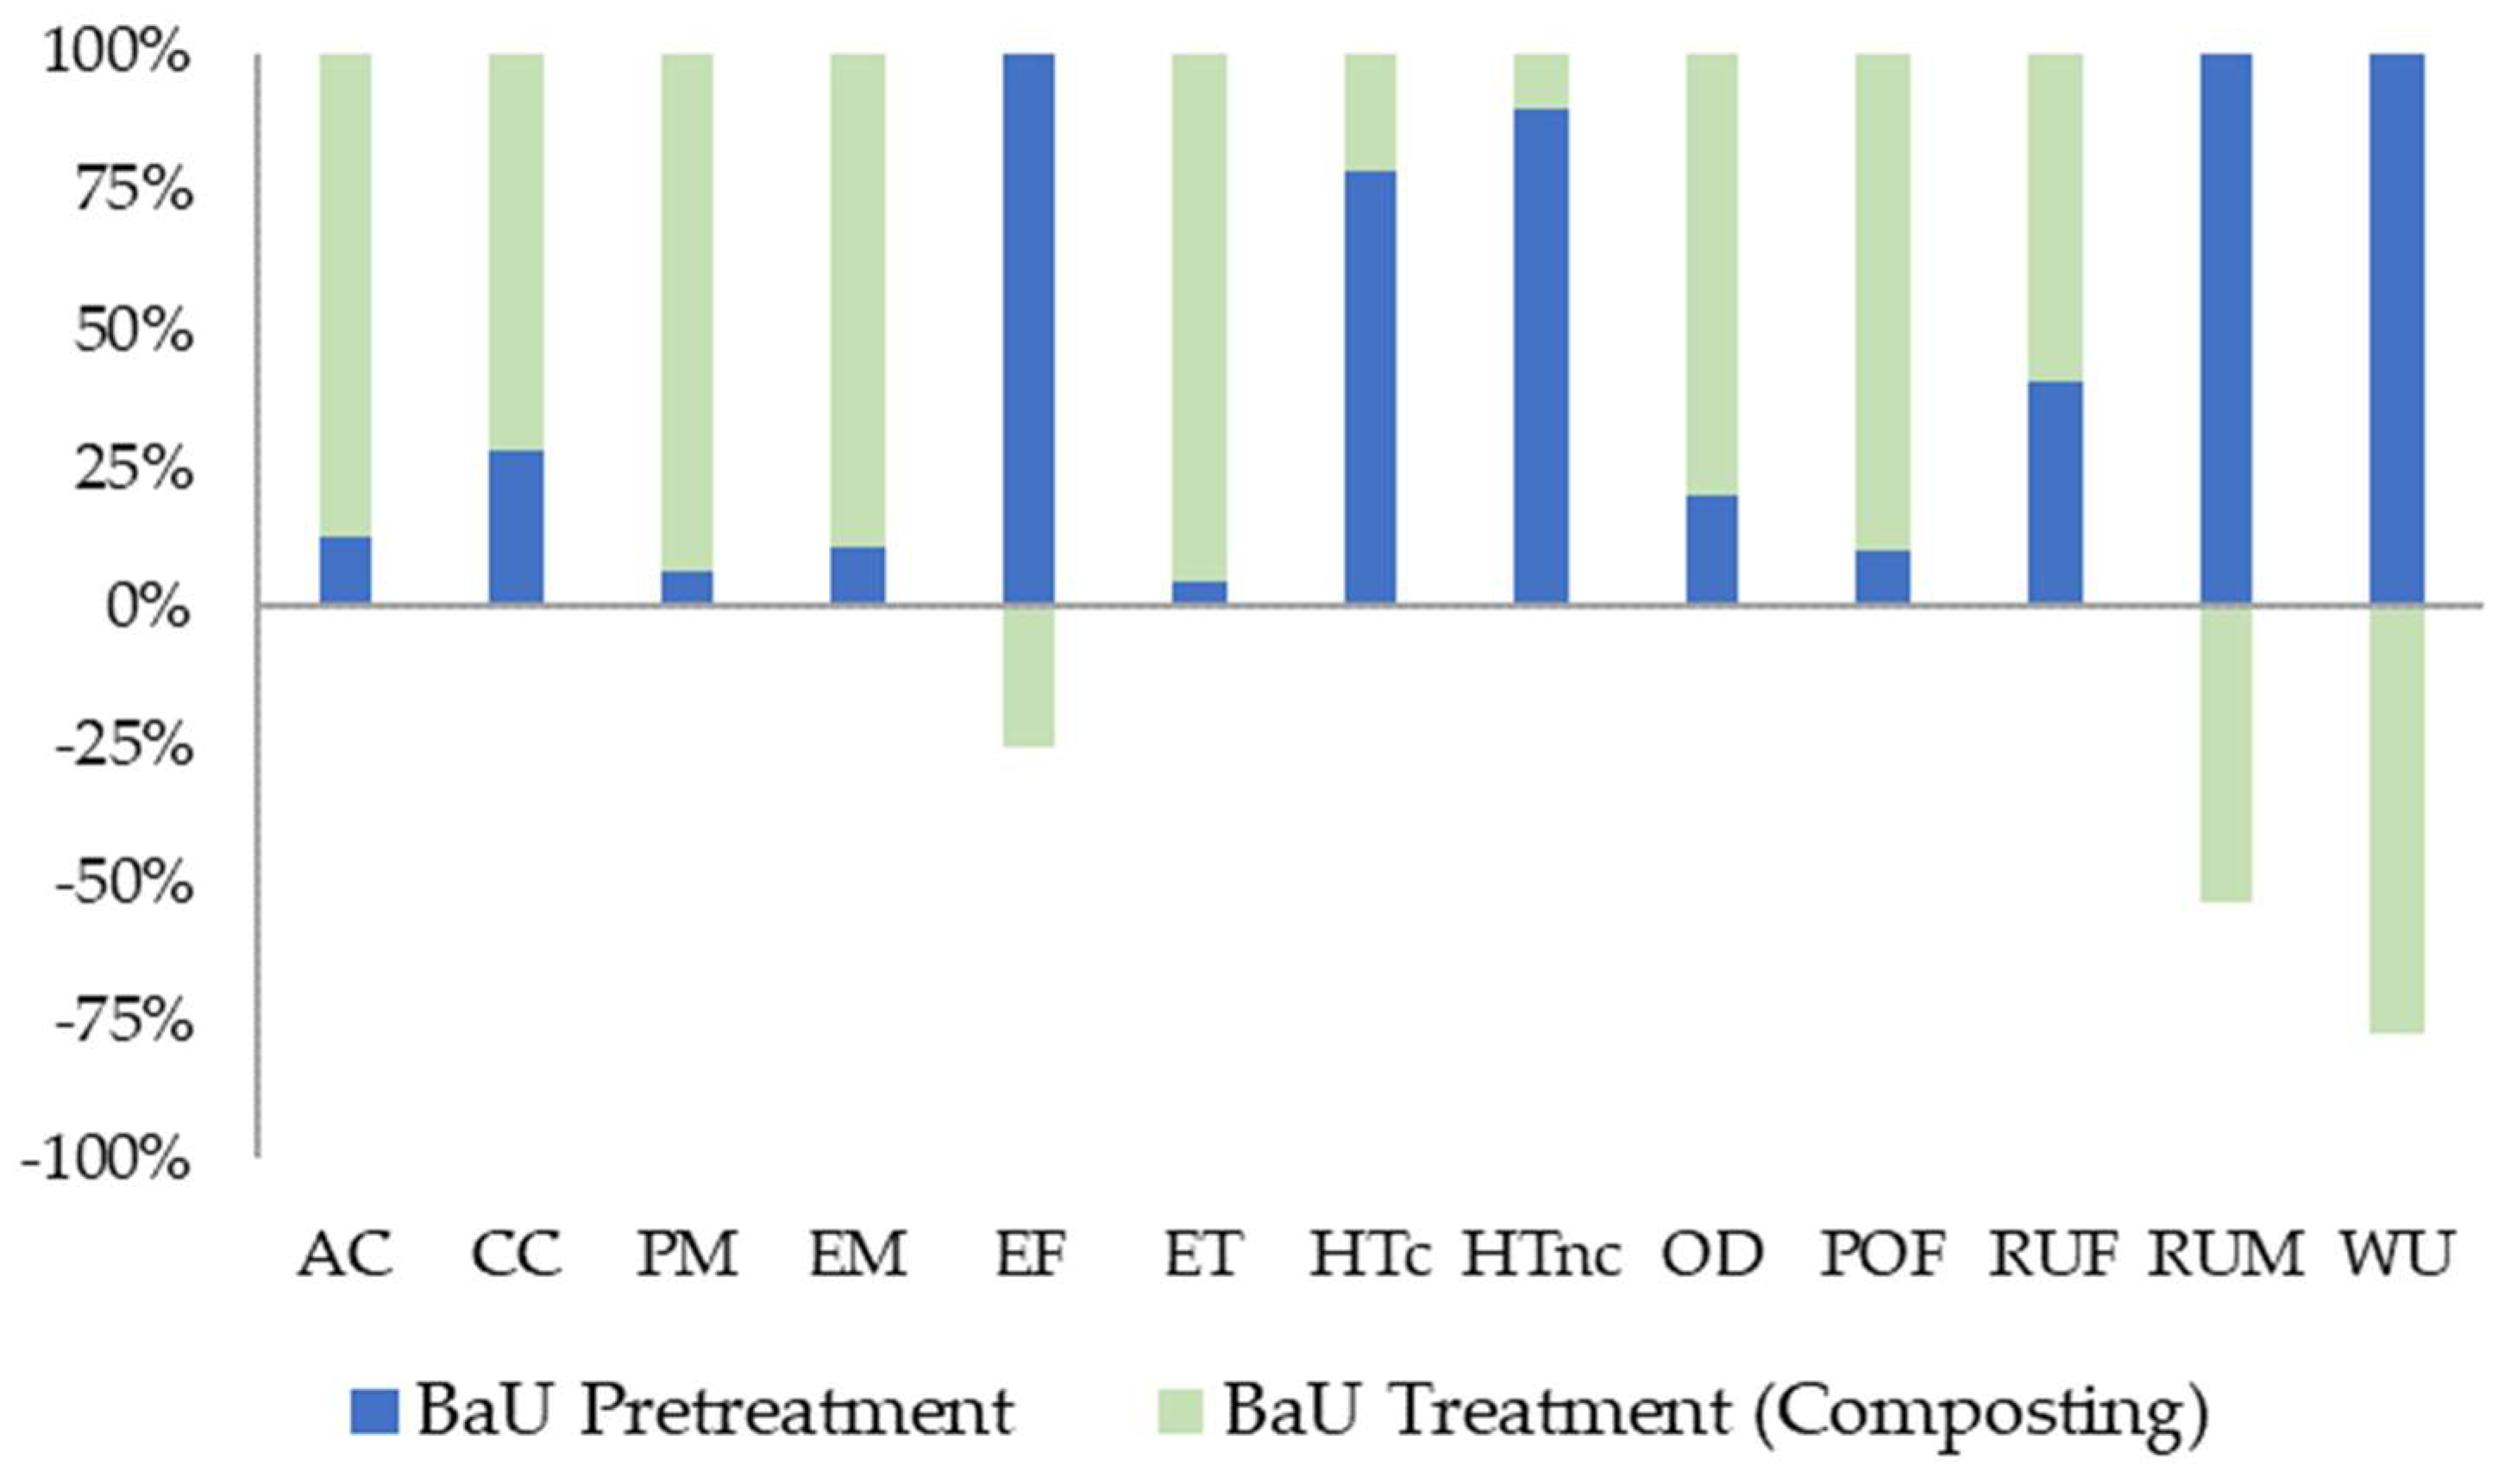
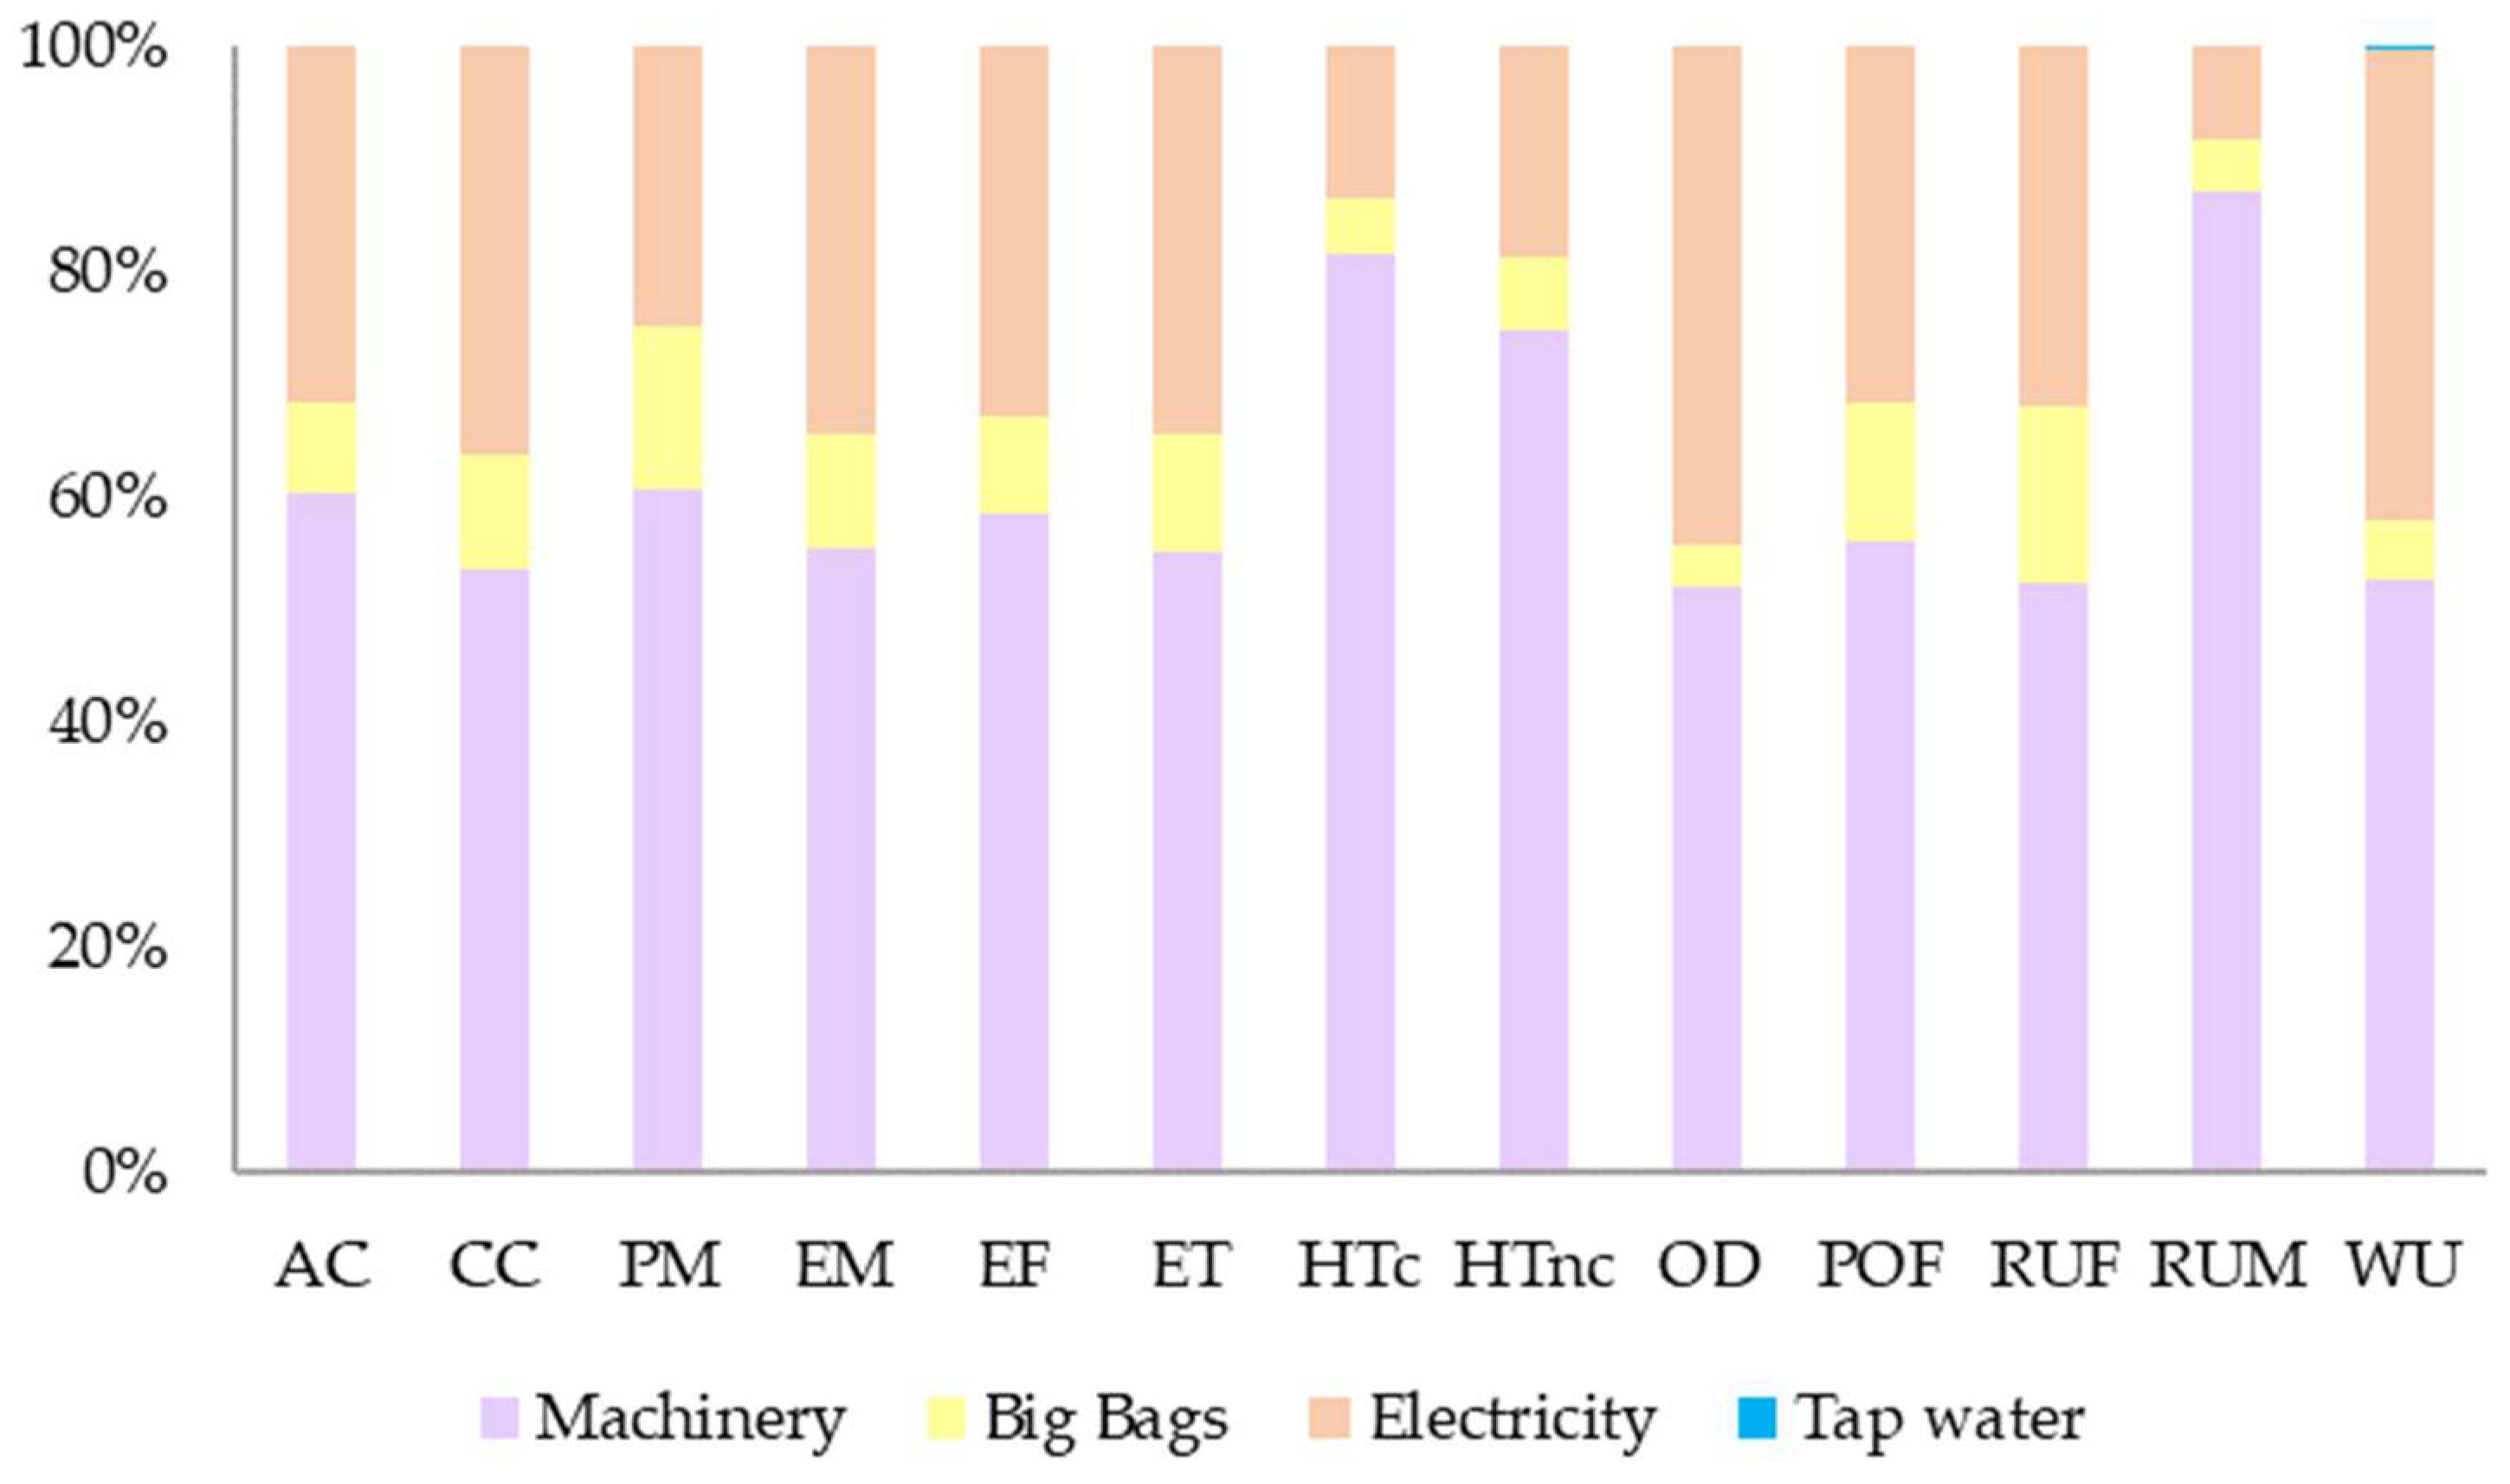
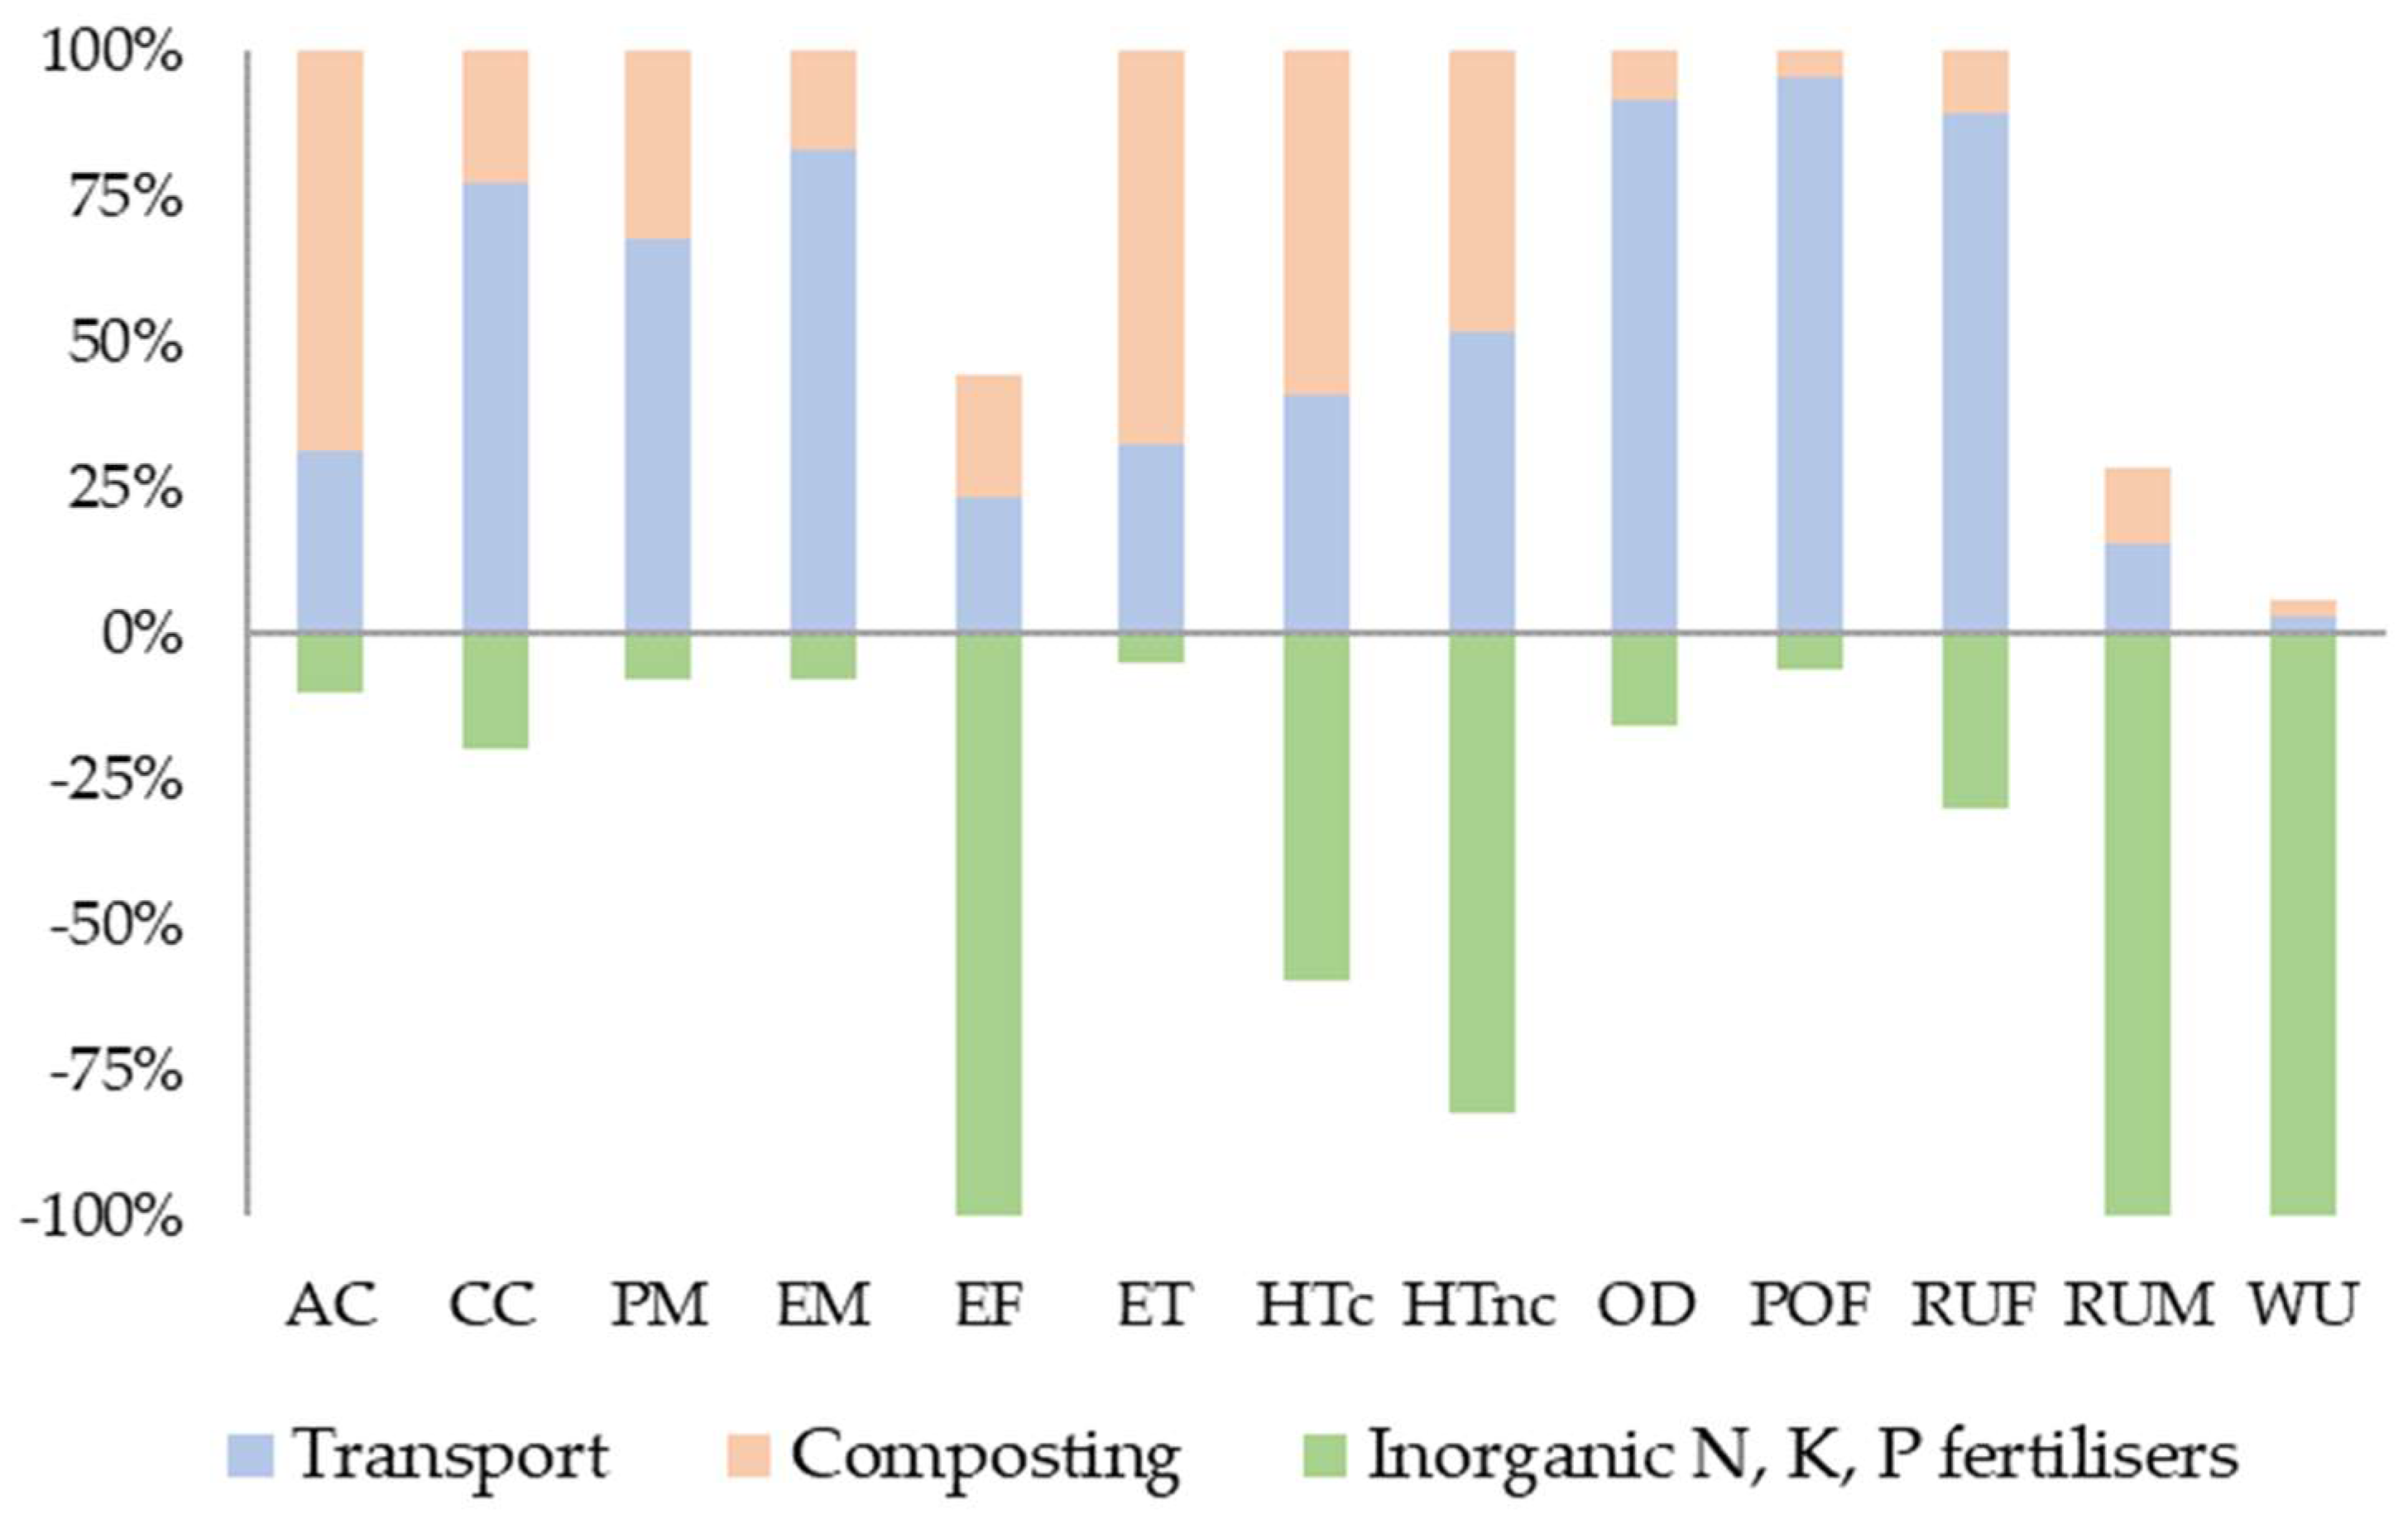
4.1. Discussion of Results from Life Cycle Assessment (LCA)
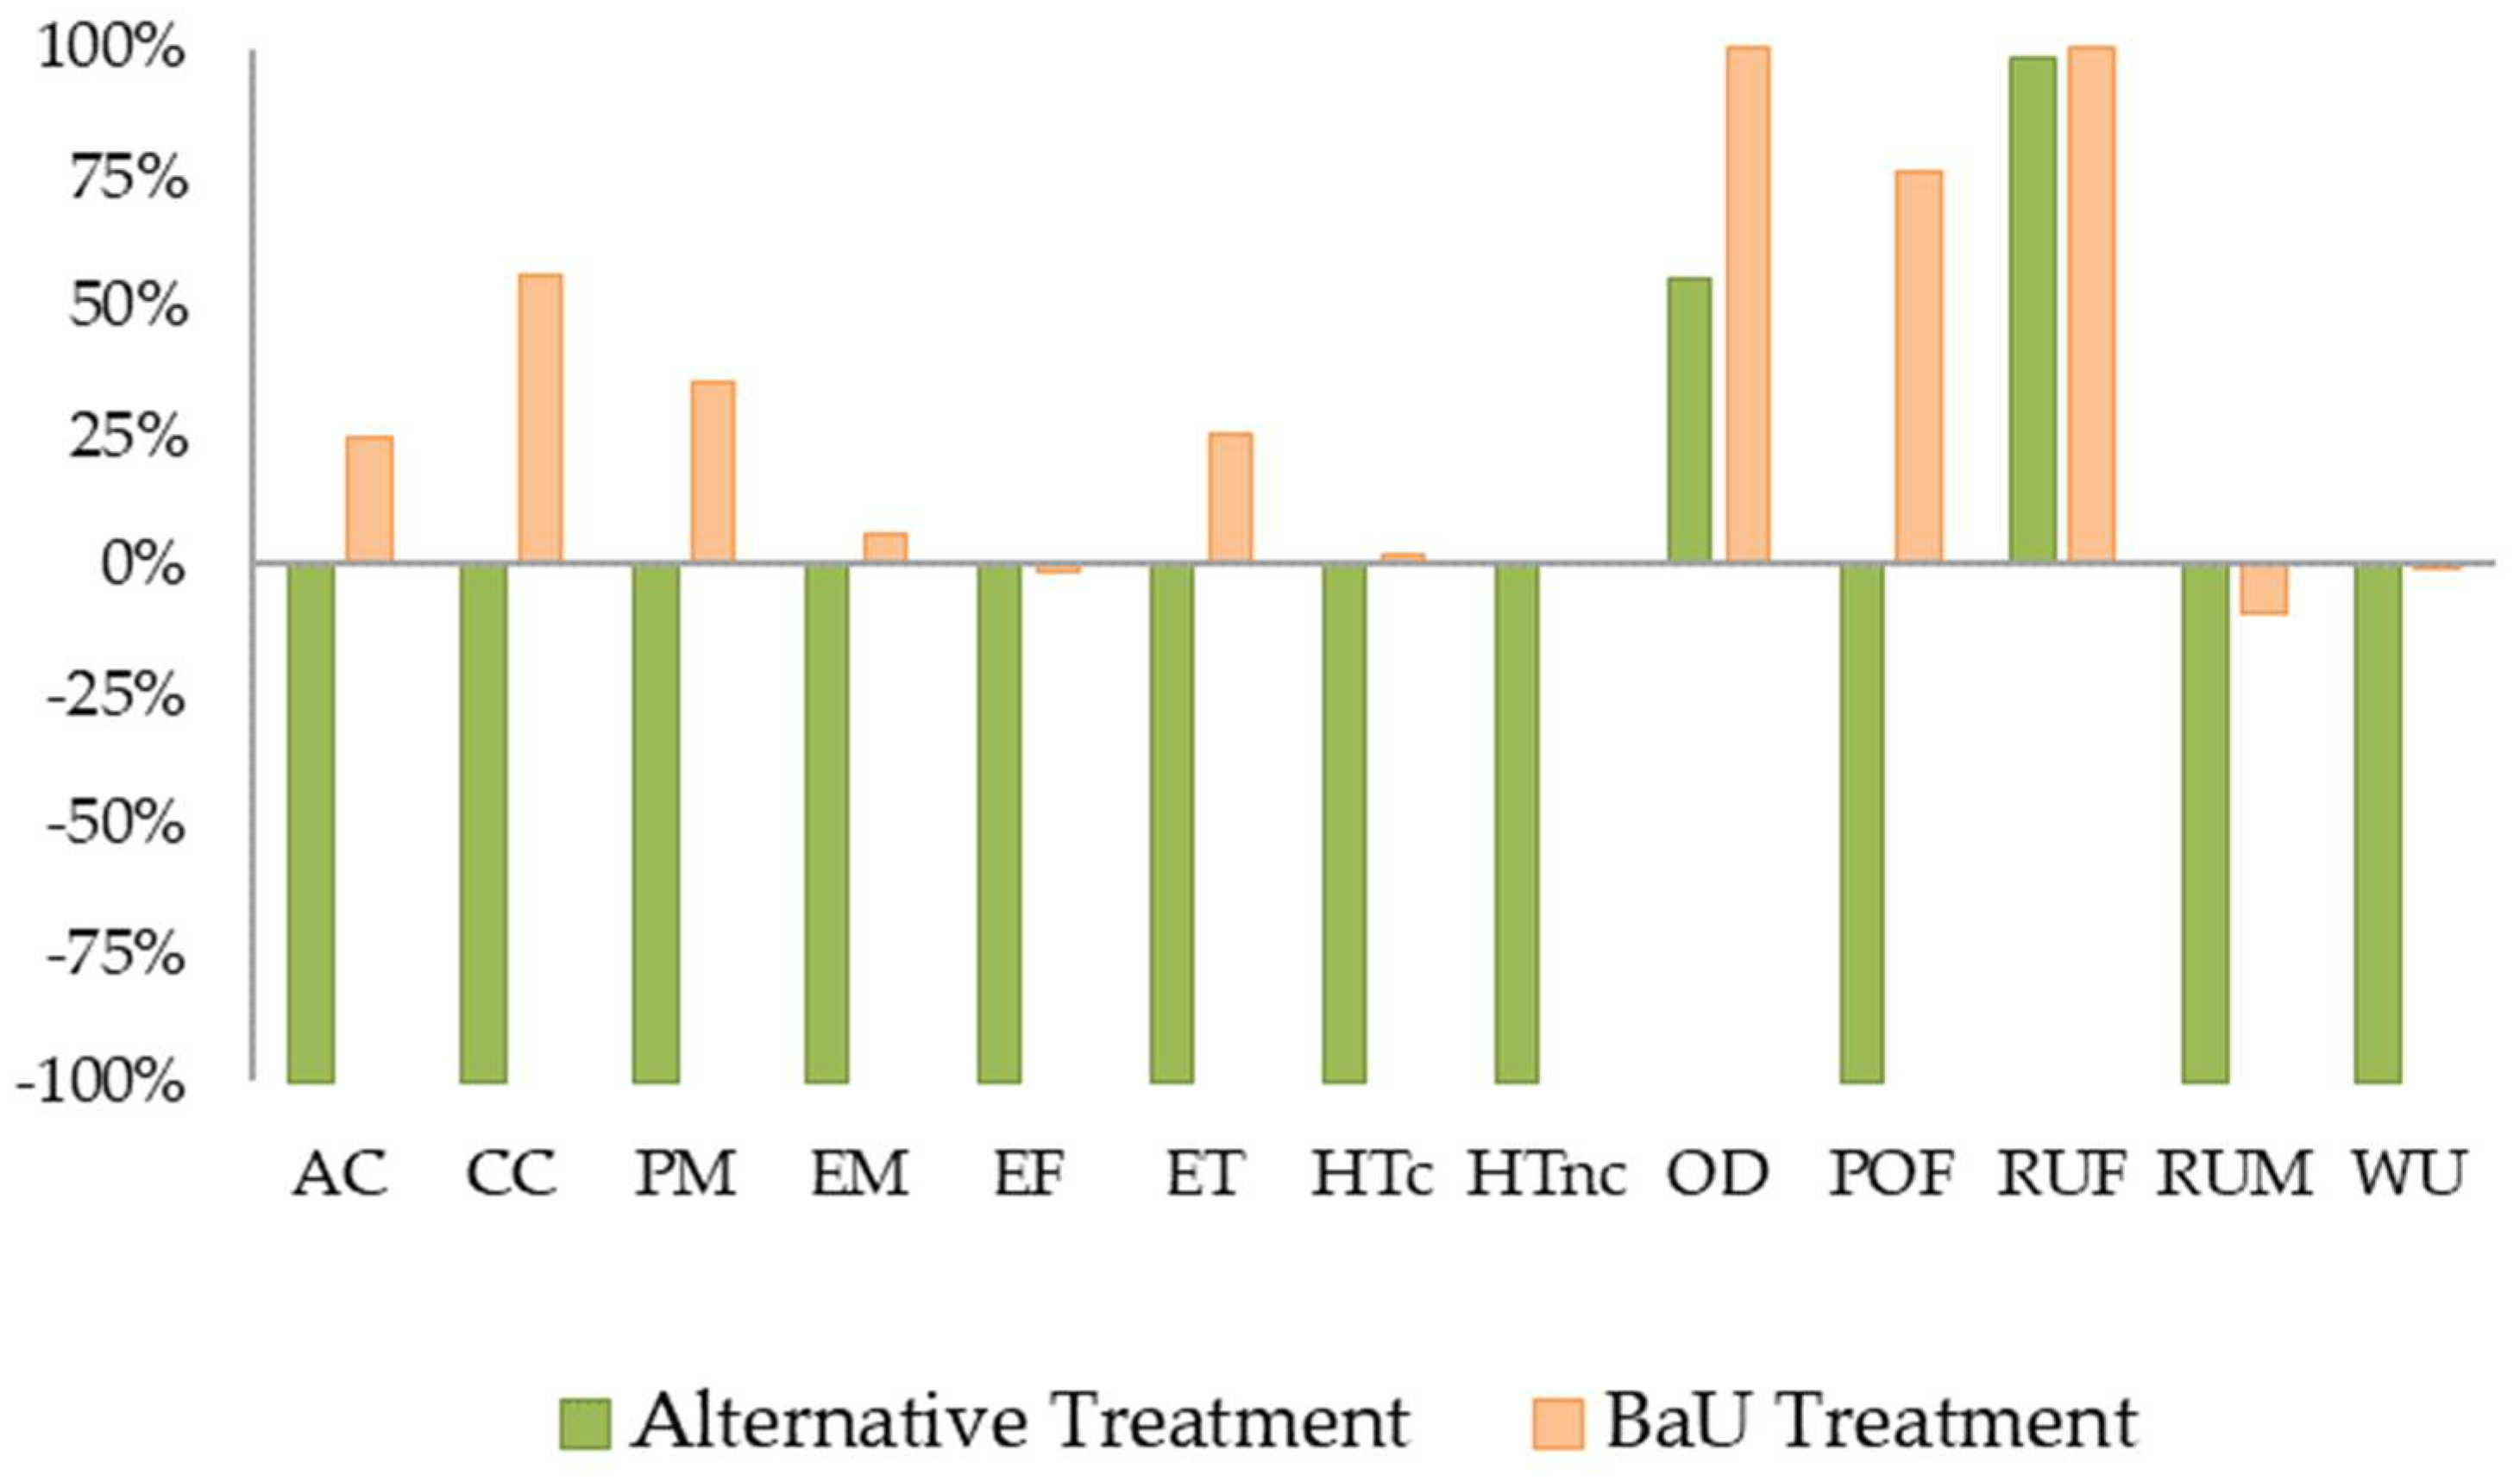
Comparisons between the BaU and Alternative Scenarios
4.2. Discussion of Results from Life Cycle Costing (LCC)
4.3. General Considerations Based on LCT Results
5. Conclusions
Supplementary Materials
Author Contributions
Funding
Institutional Review Board Statement
Informed Consent Statement
Data Availability Statement
Acknowledgments
Conflicts of Interest
Abbreviations:
| Acronym | Definition |
| AC | Acidification |
| AR | Abiotic Resources |
| ARPAC | Campania Regional Agency for the Protection of the Environment |
| AW | Access to Water |
| BaU | Business as Usual |
| BD | Biodiversity |
| CBE | Circular Bioeconomy |
| CC | Climate Change |
| CE | Circular Economy |
| cLCC | conventional LCC |
| CS | Coffee Silverskin |
| EC | European Commission |
| EF | Eutrophication Freshwater |
| eLCC | environmental LCC |
| ELU | Environmental Load Unit |
| EM | Eutrophication Marine |
| EPS | Environmental Priority Strategies |
| ES | Ecosystem Services |
| ET | Eutrophication, Terrestrial |
| EU | European Union |
| FU | Functional Unit |
| HH | Human Health |
| HTc | Human toxicity, cancer |
| HTnc | Human toxicity, non-cancer |
| ILCD | International Reference Life Cycle Data System |
| LCA | Life Cycle Assessment |
| LCC | Life Cycle Costing |
| LCI | Life Cycle Inventory |
| LCIA | Life Cycle Impact Assessment |
| LCT | Life Cycle Thinking |
| MCN | Metropolitan City of Naples |
| OD | Ozone depletion |
| OECD | Organization for Economic Cooperation and Development |
| OFMSW | Organic Fraction of Municipal Solid Waste |
| PEF | Product Environmental Footprint |
| PM | Particulate matter |
| POF | Photochemical ozone formation |
| RUF | Resource use, fossils |
| RUM | Resource use, minerals and metals |
| WU | Water use |
References
- Directive (EU) 2018/851 of the European Parliament and of the Council of 30 May 2018 Amending Directive 2008/98/EC on Waste. Available online: https://eur-lex.europa.eu/eli/dir/2018/851/oj (accessed on 31 October 2023).
- ARPAC. (Schiller Park, IL, USA). ARPAC Database on Organic Fraction from Metropolitan City of Naples, 2019. Personal communication, 2019. [Google Scholar]
- Gottstein, V.; Bernhardt, M.; Dilger, E.; Keller, J.; Breitling-Utzmann, C.M.; Schwarz, S.; Kuballa, T.; Lachenmeier, D.W.; Bunzel, M. Coffee Silver Skin: Chemical Characterization with Special Consideration of Dietary Fiber and Heat-Induced Contaminants. Foods 2021, 10, 1705. [Google Scholar] [CrossRef] [PubMed]
- Regione Campania. Monitoraggio Dell’attuazione del Piano Regionale per la Gestione dei Rifiuti Urbani della Campania; Gruppo di Lavoro per il Supporto Operativo Nelle Attività di cui al Programma di Misure per il Monitoraggio del PRGRU Nominato con DD n. 311 del 03.08.17 e ss.mm.ii; Regione Campania. 2020. Available online: https://regione.campania.it/assets/documents/report-monitoraggio-prgru-al-30-12-2020-1.pdf (accessed on 31 October 2023).
- ISPRA. Rapporto Rifiuti Urbani—Edizione 2020; ISPRA-Istituto Superiore per la Protezione e la Ricerca Ambientale Via Vitaliano Brancati: Roma, Italy, 2020. Available online: isprambiente.gov.it/files2020/pubblicazioni/rapporti/rapportorifiutiurbani_ed-2020_n-331-1.pdf (accessed on 18 October 2023).
- ISPRA Catasto Rifiuti. Available online: https://www.catasto-rifiuti.isprambiente.it/index.php?pg=ru (accessed on 31 October 2023).
- Ghosh, S.K.; Di Maria, F. A Comparative Study of Issues, Challenges and Strategies of Bio-Waste Management in India and Italy. Detritus 2018, 1, 8–17. [Google Scholar] [CrossRef]
- Circular Economy; ReGenerate. The Case for Purpose-Driven Business. Available online: https://www.re-generate.org/the-case-for-purpose-driven-business (accessed on 23 October 2023).
- Circular Bioeconomy. Knowledge Guide: The Circular Bioeconomy. Available online: https://www.cifor.org/wp-content/uploads/2021/03/Flyer%20-%20Knowledge%20Guide_Circular%20Bioeconomy-v4.pdf (accessed on 23 October 2023).
- Demichelis, F.; Piovano, F.; Fiore, S. Biowaste Management in Italy: Challenges and Perspectives. Sustainability 2019, 11, 4213. [Google Scholar] [CrossRef]
- Taffuri, A.; Sciullo, A.; Diemer, A.; Nedelciu, C.E. Integrating Circular Bioeconomy and Urban Dynamics to Define an Innovative Management of Bio-Waste: The Study Case of Turin. Sustainability 2021, 13, 6224. [Google Scholar] [CrossRef]
- Donner, M.; Gohier, R.; de Vries, H. A New Circular Business Model Typology for Creating Value from Agro-Waste. Sci. Total Environ. 2020, 716, 137065. [Google Scholar] [CrossRef]
- FAO. Assessing the Contribution of Bioeconomy to Countries’ Economy; FAO: Rome, Italy, 2018. [Google Scholar]
- Stegmann, P.; Londo, M.; Junginger, M. The Circular Bioeconomy: Its Elements and Role in European Bioeconomy Clusters. Resour. Conserv. Recycl. X 2020, 6, 100029. [Google Scholar] [CrossRef]
- European Commission; Directorate-General for Research and Innovation. A Sustainable Bioeconomy for Europe: Strengthening the Connection between Economy, Society and the Environment. Updated Bioeconomy Strategy. 2018. Available online: https://www.ewi-vlaanderen.be/sites/default/files/2023-01/A%20sustainable.pdf (accessed on 31 October 2023).
- Bhatia, S.K.; Joo, H.-S.; Yang, Y.-H. Biowaste-to-Bioenergy Using Biological Methods—A Mini-Review. Energy Convers. Manag. 2018, 177, 640–660. [Google Scholar] [CrossRef]
- Mak, T.M.W.; Xiong, X.; Tsang, D.C.W.; Yu, I.K.M.; Poon, C.S. Sustainable Food Waste Management towards Circular Bioeconomy: Policy Review, Limitations and Opportunities. Bioresour. Technol. 2020, 297, 122497. [Google Scholar] [CrossRef]
- Bastein, A.; Verstraeten-Jochemsen, J.; Rietveld, E.; Hauck, M.; Frijters, E.; Klijn, O.; Driessen, B. Circular Amsterdam. A Vision and Action Agenda for the City and Metropolitan Area; TNO identifier: 534672; TNO: Delft, The Netherlands, 2016. [Google Scholar]
- Arya, S.S.; Venkatram, R.; More, P.R.; Vijayan, P. The Wastes of Coffee Bean Processing for Utilization in Food: A Review. J. Food Sci. Technol. 2022, 59, 429–444. [Google Scholar] [CrossRef]
- Mussatto, S.I.; Machado, E.M.S.; Carneiro, L.M.; Teixeira, J.A. Sugars Metabolism and Ethanol Production by Different Yeast Strains from Coffee Industry Wastes Hydrolysates. Appl. Energy 2012, 92, 763–768. [Google Scholar] [CrossRef]
- Procentese, A.; Raganati, F.; Navarini, L.; Olivieri, G.; Russo, M.E.; Marzocchella, A. Coffee Silverskin as a Renewable Resource to Produce Butanol and Isopropanol. Chem Eng. Trans 2018, 64, 139–144. [Google Scholar]
- Niglio, S.; Procentese, A.; Russo, M.E.; Sannia, G.; Marzocchella, A. Investigation of Enzymatic Hydrolysis of Coffee Silverskin Aimed at the Production of Butanol and Succinic Acid by Fermentative Processes. BioEnergy Res. 2019, 12, 312–324. [Google Scholar] [CrossRef]
- Zuorro, A.; Lavecchia, R. Spent Coffee Grounds as a Valuable Source of Phenolic Compounds and Bioenergy. J. Clean. Prod. 2012, 34, 49–56. [Google Scholar] [CrossRef]
- Zuorro, A.; Di Battista, A.; Lavecchia, R. Magnetically Modified Coffee Silverskin for the Removal of Xenobiotics from Wastewater. Chem. Eng. Trans. 2013, 35, 1375–1380. [Google Scholar]
- Abdi, D.D.; Monazzam, M.; Taban, E.; Putra, A.; Golbabaei, F.; Khadem, M. Sound Absorption Performance of Natural Fiber Composite from Chrome Shave and Coffee Silver Skin. Appl. Acoust. 2021, 182, 108264. [Google Scholar] [CrossRef]
- Machado, E.M.S.; Rodriguez-Jasso, R.M.; Teixeira, J.A.; Mussatto, S.I. Growth of Fungal Strains on Coffee Industry Residues with Removal of Polyphenolic Compounds. Biochem. Eng. J. 2012, 60, 87–90. [Google Scholar] [CrossRef]
- Overturf, E.; Pezzutto, S.; Boschiero, M.; Ravasio, N.; Monegato, A. The Circo (Circular Coffee) Project: A Case Study on Valorization of Coffee Silverskin in the Context of Circular Economy in Italy. Sustainability 2021, 13, 9069. [Google Scholar] [CrossRef]
- Ismail, S.A.A.; El-Anany, A.M.; Ali, R.F.M. Regeneration of Used Frying Palm Oil with Coffee Silverskin (CS), CS Ash (CSA) and Nanoparticles of CS (NCS). J. Oleo Sci. 2017, 66, 897–905. [Google Scholar] [CrossRef]
- Bessada, S.M.F.; Alves, R.C.; Oliveira, M.B.P.P. Coffee Silverskin: A Review on Potential Cosmetic Applications. Cosmetics 2018, 5, 5. [Google Scholar] [CrossRef]
- Iriondo-DeHond, A.; Martorell, P.; Genovés, S.; Ramón, D.; Stamatakis, K.; Fresno, M.; Molina, A.; del Castillo, M. Coffee Silverskin Extract Protects against Accelerated Aging Caused by Oxidative Agents. Molecules 2016, 21, 721. [Google Scholar] [CrossRef]
- Rodrigues, F.; Palmeira-de-Oliveira, A.; das Neves, J.; Sarmento, B.; Amaral, M.H.; Oliveira, M.B.P.P. Coffee Silverskin: A Possible Valuable Cosmetic Ingredient. Pharm. Biol. 2015, 53, 386–394. [Google Scholar] [CrossRef] [PubMed]
- Rodrigues, F.; Alves, A.C.; Nunes, C.; Sarmento, B.; Amaral, M.H.; Reis, S.; Oliveira, M.B.P.P. Permeation of Topically Applied Caffeine from a Food by—Product in Cosmetic Formulations: Is Nanoscale in Vitro Approach an Option? Int. J. Pharm. 2016, 513, 496–503. [Google Scholar] [CrossRef] [PubMed]
- Hejna, A. Potential Applications of By-Products from the Coffee Industry in Polymer Technology—Current State and Perspectives. Waste Manag. 2021, 121, 296–330. [Google Scholar] [CrossRef] [PubMed]
- Borrelli, R.C.; Esposito, F.; Napolitano, A.; Ritieni, A.; Fogliano, V. Characterization of a New Potential Functional Ingredient: Coffee Silverskin. J. Agric. Food Chem. 2004, 52, 1338–1343. [Google Scholar] [CrossRef] [PubMed]
- Lachenmeier, D.W.; Schwarz, S.; Rieke-Zapp, J.; Cantergiani, E.; Rawel, H.; Martín-Cabrejas, M.A.; Martuscelli, M.; Gottstein, V.; Angeloni, S. Coffee By-Products as Sustainable Novel Foods: Report of the 2nd International Electronic Conference on Foods—“Future Foods and Food Technologies for a Sustainable World. ” Foods 2022, 11, 3. [Google Scholar] [CrossRef]
- Lorbeer, L.; Schwarz, S.; Franke, H.; Lachenmeier, D.W. Toxicological Assessment of Roasted Coffee Silver Skin (Testa of Coffea Sp.) as Novel Food Ingredient. Molecules 2022, 27, 6839. [Google Scholar] [CrossRef] [PubMed]
- Nolasco, A.; Squillante, J.; Esposito, F.; Velotto, S.; Romano, R.; Aponte, M.; Giarra, A.; Toscanesi, M.; Montella, E.; Cirillo, T. Coffee Silverskin: Chemical and Biological Risk Assessment and Health Profile for Its Potential Use in Functional Foods. Foods 2022, 11, 2834. [Google Scholar] [CrossRef]
- Nolasco, A.; Squillante, J.; Velotto, S.; D’Auria, G.; Ferranti, P.; Mamone, G.; Errico, M.E.; Avolio, R.; Castaldo, R.; Cirillo, T.; et al. Valorization of Coffee Industry Wastes: Comprehensive Physicochemical Characterization of Coffee Silverskin and Multipurpose Recycling Applications. J. Clean. Prod. 2022, 370, 133520. [Google Scholar] [CrossRef]
- Ballesteros, L.F.; Teixeira, J.A.; Mussatto, S.I. Chemical, Functional, and Structural Properties of Spent Coffee Grounds and Coffee Silverskin. Food Bioprocess Technol. 2014, 7, 3493–3503. [Google Scholar] [CrossRef]
- Bresciani, L.; Calani, L.; Bruni, R.; Brighenti, F.; Del Rio, D. Phenolic Composition, Caffeine Content and Antioxidant Capacity of Coffee Silverskin. Food Res. Int. 2014, 61, 196–201. [Google Scholar] [CrossRef]
- Martuscelli, M.; Esposito, L.; Mastrocola, D. The Role of Coffee Silver Skin against Oxidative Phenomena in Newly Formulated Chicken Meat Burgers after Cooking. Foods 2021, 10, 1833. [Google Scholar] [CrossRef]
- Mussatto, S.I.; Machado, E.M.S.; Martins, S.; Teixeira, J.A. Production, Composition, and Application of Coffee and Its Industrial Residues. Food Bioprocess Technol. 2011, 4, 661–672. [Google Scholar] [CrossRef]
- Pourfarzad, A.; Mahdavian-Mehr, H.; Sedaghat, N. Coffee Silverskin as a Source of Dietary Fiber in Bread-Making: Optimization of Chemical Treatment Using Response Surface Methodology. LWT Food Sci. Technol. 2013, 50, 599–606. [Google Scholar] [CrossRef]
- Garcia-Serna, E.; Martinez-Saez, N.; Mesias, M.; Morales, F.; Castillo, M. Use of Coffee Silverskin and Stevia to Improve the Formulation of Biscuits. Pol. J. Food Nutr. Sci. 2014, 64, 243–251. [Google Scholar] [CrossRef]
- Del Castillo, M.D.; Fernandez-Gomez, B.; Martinez-Saez, N.; Iriondo-DeHond, A.; Martirosyan, D.M.; Mesa, M.D. Coffee Silverskin Extract for Aging and Chronic Diseases. In Functional Foods for Chronic Diseases; Martirosyan, D.M., Ed.; CreateSpace Independent Publishing Platform: Scotts Valley, CA, USA, 2016; pp. 386–409. [Google Scholar]
- Martinez-Saez, N.; Ullate, M.; Martin-Cabrejas, M.A.; Martorell, P.; Genovés, S.; Ramon, D.; del Castillo, M.D. A Novel Antioxidant Beverage for Body Weight Control Based on Coffee Silverskin. Food Chem. 2014, 150, 227–234. [Google Scholar] [CrossRef] [PubMed]
- SilverBread. Available online: https://www.silverbread.it/ (accessed on 27 October 2023).
- Germany. Consultation on the Determination of the Status of a Novel Food under Article 4 (2) of Regulation (EU) 2015/2283; Ref. Ares(2022)4778355—30/06/2022 2022. Available online: https://food.ec.europa.eu/system/files/2022-06/novel-food_consult-status_2022-4778355.pdf (accessed on 27 October 2023).
- EFSA—European Food Safety Authority Novel Food. Available online: https://www.efsa.europa.eu/en/topics/topic/novel-food (accessed on 30 October 2023).
- European Parliament and Council of the European Union. Commission Regulation (EC) No 1881/2006 of 19 December 2006 Setting Maximum Levels for Certain Contaminants in Foodstuffs; The Publications Office of the European Union (L’Office des publications de l’Union européenne, or OPOCE): Luxembourg, 2006; pp. 5–24. Available online: https://eur-lex.europa.eu/LexUriServ/LexUriServ.do?uri=OJ:L:2006:364:0005:0024:EN:PDF (accessed on 31 October 2023).
- Narita, Y.; Inouye, K. Review on Utilization and Composition of Coffee Silverskin. Food Res. Int. 2014, 61, 16–22. [Google Scholar] [CrossRef]
- Toschi, T.G.; Cardenia, V.; Bonaga, G.; Mandrioli, M.; Rodriguez-Estrada, M.T. Coffee Silverskin: Characterization, Possible Uses, and Safety Aspects. J. Agric. Food Chem. 2014, 62, 10836–10844. [Google Scholar] [CrossRef]
- Iriondo-DeHond, A.; Haza, A.I.; Ávalos, A.; del Castillo, M.D.; Morales, P. Validation of Coffee Silverskin Extract as a Food Ingredient by the Analysis of Cytotoxicity and Genotoxicity. Food Res. Int. 2017, 100, 791–797. [Google Scholar] [CrossRef]
- Beltrán-Medina, E.A.; Guatemala-Morales, G.M.; Padilla-Camberos, E.; Corona-González, R.I.; Mondragón-Cortez, P.M.; Arriola-Guevara, E. Evaluation of the Use of a Coffee Industry By-Product in a Cereal-Based Extruded Food Product. Foods 2020, 9, 1008. [Google Scholar] [CrossRef]
- Martuscelli, M.; Esposito, L.; Di Mattia, C.; Ricci, A.; Mastrocola, D. Characterization of Coffee Silver Skin as Potential Food-Safe Ingredient. Foods 2021, 10, 1367. [Google Scholar] [CrossRef]
- Nzekoue, F.K.; Borsetta, G.; Navarini, L.; Abouelenein, D.; Xiao, J.; Sagratini, G.; Vittori, S.; Caprioli, G.; Angeloni, S. Coffee Silverskin: Characterization of B-Vitamins, Macronutrients, Minerals and Phytosterols. Food Chem. 2022, 372, 131188. [Google Scholar] [CrossRef]
- European Parliament and Council of the European Union. Commission Regulation (EU) 2021/1323 of 10 August 2021 Amending Regulation (EC) No 1881/2006 as Regards Maximum Levels of Cadmium in Certain Foodstuffs; European Parliament and Council of the European Union: Washington, DC, USA, 2021; pp. 13–18. [Google Scholar]
- European Parliament and Council of the European Union. Commission Regulation (EU) 2021/1317 of 9 August 2021 Amending Regulation (EC) No 1881/2006 as Regards Maximum Levels of Lead in Certain Foodstuffs; European Parliament and Council of the European Union: Washington, DC, USA, 2021; pp. 1–4. [Google Scholar]
- EFSA Panel on Contaminants in the Food Chain (CONTAM). Scientific Opinion on the Risk for Public Health Related to the Presence of Mercury and Methylmercury in Food. EFSA J. 2012, 10, 2985. [Google Scholar] [CrossRef]
- SETAC (Society of Environmental Toxicology and Chemistry); Consoli, F. Guidelines for Life-Cycle Assessment: A “Code of Practice”; Society of Environmental Toxicology and Chemistry (SETAC): Pensacola, FL, USA, 1993. [Google Scholar]
- ISO 14040:2006; Environmental Management—Life Cycle Assessment—Principles and Framework. ISO: Geneva, Switzerland, 2006.
- ISO 14044:2006; Environmental Management Life Cycle Assessment—Requirements and Guidelines. ISO: Geneva, Switzerland, 2006.
- Zampori, L.; Pant, R. Suggestions for Updating the Product Environmental Footprint (PEF) Method; EUR 29682 EN, Publications Office of the European Union: Luxembourg, 2019; Available online: https://publications.jrc.ec.europa.eu/repository/handle/JRC115959 (accessed on 31 October 2023)ISBN 978-92-76-00654-1.
- European Commission; Joint Research Centre; Institute for Environment and Sustainability. International Reference Life Cycle Data System (ILCD) Handbook General Guide for Life Cycle Assessment; Detailed Guidance; European Commission; Joint Research Centre: Brussels, Belgium, 2010; ISBN 978-92-79-19092-6. [Google Scholar]
- Ekvall, T.; Finnveden, G. The Application of Life Cycle Assessment to Integrated Solid Waste Management: Part 2—Perspectives on energy and material recovery from paper. Process Saf. Environ. Prot. 2000, 78, 288–294. [Google Scholar] [CrossRef]
- Clift, R.; Doig, A.; Finnveden, G. The Application of Life Cycle Assessment to Integrated Solid Waste Management: Part 1—Methodology. Process Saf. Environ. Prot. 2000, 78, 279–287. [Google Scholar] [CrossRef]
- Ekvall, T.; Assefa, G.; Björklund, A.; Eriksson, O.; Finnveden, G. What Life-Cycle Assessment Does and Does Not Do in Assessments of Waste Management. Waste Manag. 2007, 27, 989–996. [Google Scholar] [CrossRef]
- Nakatani, J. Life Cycle Inventory Analysis of Recycling: Mathematical and Graphical Frameworks. Sustainability 2014, 6, 6158–6169. [Google Scholar] [CrossRef]
- Olofsson, J.; Börjesson, P. Residual Biomass as Resource—Life-Cycle Environmental Impact of Wastes in Circular Resource Systems. J. Clean. Prod. 2018, 196, 997–1006. [Google Scholar] [CrossRef]
- Pneumatic Conveyor Systems. Available online: https://www.pneumaticconveyingsolutions.com/ (accessed on 23 October 2023).
- Vibration Equipment. Available online: http://www.vibratingscreen.cc/vacuum_conveyor.html?gclid=CjwKCAiA0cyfBhBREiwAAtStHMzYrq2yNtFeRpVgum_MAHxT1AtsuJgK5uLTBCXT86BkZ (accessed on 23 October 2023).
- Big-Bag. MyPallets Website Big-Bag. Available online: https://www.mypalletsonline.com/en/bulk-bag-food-grade/408-bulk-bag-large-capacity-leakproof-97x97x215-1250-kg.html (accessed on 23 October 2023).
- Scaffold. Rollawaycontainer.com Scaffold. Available online: https://www.rollawaycontainer.it/porta-big-bag-acciaio-smontabile-1070-1070-1350.html (accessed on 23 October 2023).
- Electric Forklift RX 60-25 (Plus) Li-Ion. Available online: https://www.still.it/carrelli/carrelli-nuovi/carrelli-elevatori-elettrici/rx-60-25-35-t.html (accessed on 2 November 2023).
- Gilbert, J.; Siebert, S. ECN data REPORT 2022 Compost and Digestate for a Circular Bioeconomy; European Compost Network ECN e.V: Bochum, Germany, 2022. [Google Scholar]
- Regione Campania-Assessorato all’Ambiente Direzione Generale Ciclo Integrato delle Acque e dei Rifiuti Valutazioni Autorizzazioni Ambientali (Department of the Environment General Directorate Integrated Water and Waste Cycle Assessments Environmental Authorizations). Proposta Di Aggiornamento Del Piano Regionale per La Gestione Dei Rifiuti Speciali (PRGRS) Della Regione Campania—CUP: 8566. 2022. Available online: https://www.regione.campania.it/assets/documents/01-proposta-di-aggiornamento-prgrs.pdf (accessed on 31 October 2023).
- Pelletizer CUS 30. Available online: http://millersrl.it/de/produkte/macchine-e-impianti-pellet/cus-30.html (accessed on 2 November 2023).
- Sterilizer Giotto (Omas). Available online: https://omasindustries.com/pulitura/sterilizzatore-intensivo-per-il-grano-giotto (accessed on 2 November 2023).
- Gravimetric Destoner Ariosto (Omas). Available online: https://omasindustries.com/en/cleaning (accessed on 2 November 2023).
- Basin Plastic Basin. Available online: https://www.amazon.it/CURVER-227931-Bacinella-Quadrata-plastica/dp/B01END1A6C (accessed on 2 November 2023).
- Homogenizer Homogenizer. Available online: https://www.pennati.it/en/blade-mills-model-803/ (accessed on 2 November 2023).
- Andreasi Bassi, S.; Biganzoli, F.; Ferrara, N.; Amadei, A.; Valente, A.; Sala, S.; Ardente, F. Updated Characterisation and Normalisation Factors for the Environmental Footprint 3.1 Method; European Commission. Joint Research Centre: Brussels, Belgium, 2023; ISBN 978-92-76-99069-7. [Google Scholar]
- Fazio, S.; Biganzioli, F.; De Laurentiis, V.; Zampori, L.; Sala, S.; Diaconu, E. Supporting Information to the Characterisation Factors of Recommended EF Life Cycle Impact Assessment Methods; Publications Office of the European Union: Luxembourg, 2018; ISBN 978-92-79-98584-3. [Google Scholar] [CrossRef]
- White, G.; Ostwald, P. Life Cycle Costing. Manag. Account. 1976, 15, 39–42. [Google Scholar]
- Bagg, M. Save Cash and Energy Costs via an LCC Model. World Pumps 2013, 2013, 26–27. [Google Scholar] [CrossRef]
- Cheng Hin, J.N.; Zmeureanu, R. Optimization of a Residential Solar Combisystem for Minimum Life Cycle Cost, Energy Use and Exergy Destroyed. Sol. Energy 2014, 100, 102–113. [Google Scholar] [CrossRef]
- Bierer, A.; Götze, U.; Meynerts, L.; Sygulla, R. Integrating Life Cycle Costing and Life Cycle Assessment Using Extended Material Flow Cost Accounting. J. Clean. Prod. 2015, 108, 1289–1301. [Google Scholar] [CrossRef]
- Stern, N.H. The Economics of Climate Change: The Stern Review; Cambridge University Press: Cambridge, UK, 2006. [Google Scholar]
- ARERA. Autorità di Regolazione per Energia Reti e Ambiente Prezzi Finali Dell’energia Elettrica per i Consumatori Industriali. Available online: https://www.arera.it/it/dati/eepcfr2.htm (accessed on 6 November 2023).
- Pelletizer—Agrieuro Pelletizer Cost Estimate. Available online: https://www.agrieuro.com/pellettatrice-monofase-hp-3-ceccato-olindo-per-produzione-in-casa-del-pellet-da-riscaldamento-p-7615.html (accessed on 6 November 2023).
- Ente Idrico Campano Tariffa di fornitura di Acqua all’ingrosso Gestore Acqua Campania SpA. 2021. Available online: https://www.enteidricocampano.it/wp-content/uploads/2021/04/Delibera-n.-8-del-26.02.2021-AcquaCampania-SpA.pdf (accessed on 6 November 2023).
- APG Consulting, S.r.l. Busta Paga: Quanto Costa E Com’è Composta. Available online: https://apgconsulting.it/busta-paga-quanto-costa-e-come-composta/#:~:text=Generalmente%2C%20in%20Italia%2C%20il%20coefficiente,dovr%C3%A0%20spendere%202%2C10%E2%82%AC (accessed on 31 October 2023).
- Ricci, N. Ore Di Lavoro: Ecco Come Cambia Il Netto in Busta Paga. Available online: https://www.pmi.it/economia/lavoro/368292/calcolo-ore-lavoro-stipendio-netto.html (accessed on 6 November 2023).
- CIC Il Mercato Del Compost. Available online: https://www.compost.it/il-compost-e-il-marchio-compost-di-qualita-cic/il-mercato-del-compost/ (accessed on 6 November 2023).
- Medina-Salgado, M.S.; García-Muiña, F.E.; Cucchi, M.; Settembre-Blundo, D. Adaptive Life Cycle Costing (LCC) Modeling and Applying to Italy Ceramic Tile Manufacturing Sector: Its Implication of Open Innovation. J. Open Innov. Technol. Mark. Complex. 2021, 7, 101. [Google Scholar] [CrossRef]
- EPS Environmental Priority Strategies in Product Design (EPS). Available online: https://www.ivl.se/english/ivl/our-offer/our-focus-areas/consumption-and-production/environmental-priority-strategies-eps.html (accessed on 31 October 2023).
- Baumann, H.; Tillman, A.M. The Hitch Hiker’s Guide to LCA: An Orientation in Life Cycle Assessment Methodology and Application; Studentlitteratur: Lund, Sweden, 2004; ISBN 91-44-02364-2. [Google Scholar]
- Gestore Servizi Energetici–GSE. Rapporto Statistico-Solare Fotovoltaico 2019. 2020. Available online: https://www.gse.it/documenti_site/Documenti%20GSE/Rapporti%20statistici/Solare%20Fotovoltaico%20-%20Rapporto%20Statistico%202019.pdf (accessed on 23 October 2023).
- Picca, G.; Plaza, C.; Madejón, E.; Panettieri, M. Compositing of Coffee Silverskin with Carbon Rich Materials Leads to High Quality Soil Amendments. Waste Biomass Valorization 2023, 14, 297–307. [Google Scholar] [CrossRef]
- Giannetti, V.; Livi, G. Agriregionieuropa Numero Speciale—Agricalabriaeuropa n. 2, Nov. 2021. 2021. Available online: https://agriregionieuropa.univpm.it/it/content/article/31/58/limpegno-contro-lo-spreco-alimentare-unopportunita-di-cambiamento-la (accessed on 31 October 2023).
- Bedoić, R.; Ćosić, B.; Duić, N. Technical Potential and Geographic Distribution of Agricultural Residues, Co-Products and by-Products in the European Union. Sci. Total Environ. 2019, 686, 568–579. [Google Scholar] [CrossRef]
- Circular Economy: Definition, Importance and Benefits. News European Parliament, Economy, 24-05-2023. Available online: https://www.europarl.europa.eu/news/en/headlines/economy/20151201STO05603/circular-economy-definition-importance-and-benefits (accessed on 31 October 2023).
- World Economic Forum; Buchholz, K. This Is How Wheat Shortages Are Creating a Food Security Risk. Available online: https://www.weforum.org/agenda/2022/04/most-vulnerable-countries-wheat-shortages/ (accessed on 5 November 2023).
- World Economic Forum; Ritchie, H. How Could the War in Ukraine Impact Global Food Supplies? Available online: https://www.weforum.org/agenda/2022/03/how-could-the-war-in-ukraine-impact-global-food-supplies (accessed on 5 November 2023).
- Bourne, J.K., Jr. Global Food Crisis Looms as Fertilizer Supplies Dwindle. Publisher: National Geographic. 2022. Available online: https://www.nationalgeographic.com/environment/article/global-food-crisis-looms-as-fertilizer-supplies-dwindle (accessed on 5 November 2023).
- Stucchi, A. Cause e Conseguenze Del Blocco Del Grano in Ucraina. Geopolitica.info. Available online: https://www.geopolitica.info/cause-conseguenze-blocco-grano-ucraina/ (accessed on 5 November 2023).
- COM/2018/673 final: Communication from the Commission to the European Parliament, the Council, the European Economic and Social Committee and the Committee of the Regions—A sustainable Bioeconomy for Europe: Strengthening the connection between economy, society, and the environment. Available online: https://www.eumonitor.eu/9353000/1/j9vvik7m1c3gyxp/vksiobho2zt1 (accessed on 31 October 2023).
- Regulation (EU) 2015/2283 of the European Parliament and of the Council of 25 November 2015 on novel foods, amending Regulation (EU) No 1169/2011 of the European Parliament and of the Council and repealing Regulation (EC) No 258/97 of the European Parliament and of the Council and Commission Regulation (EC) No 1852/2001. Off. J. Eur. Union. 2015, 327, 1–22.


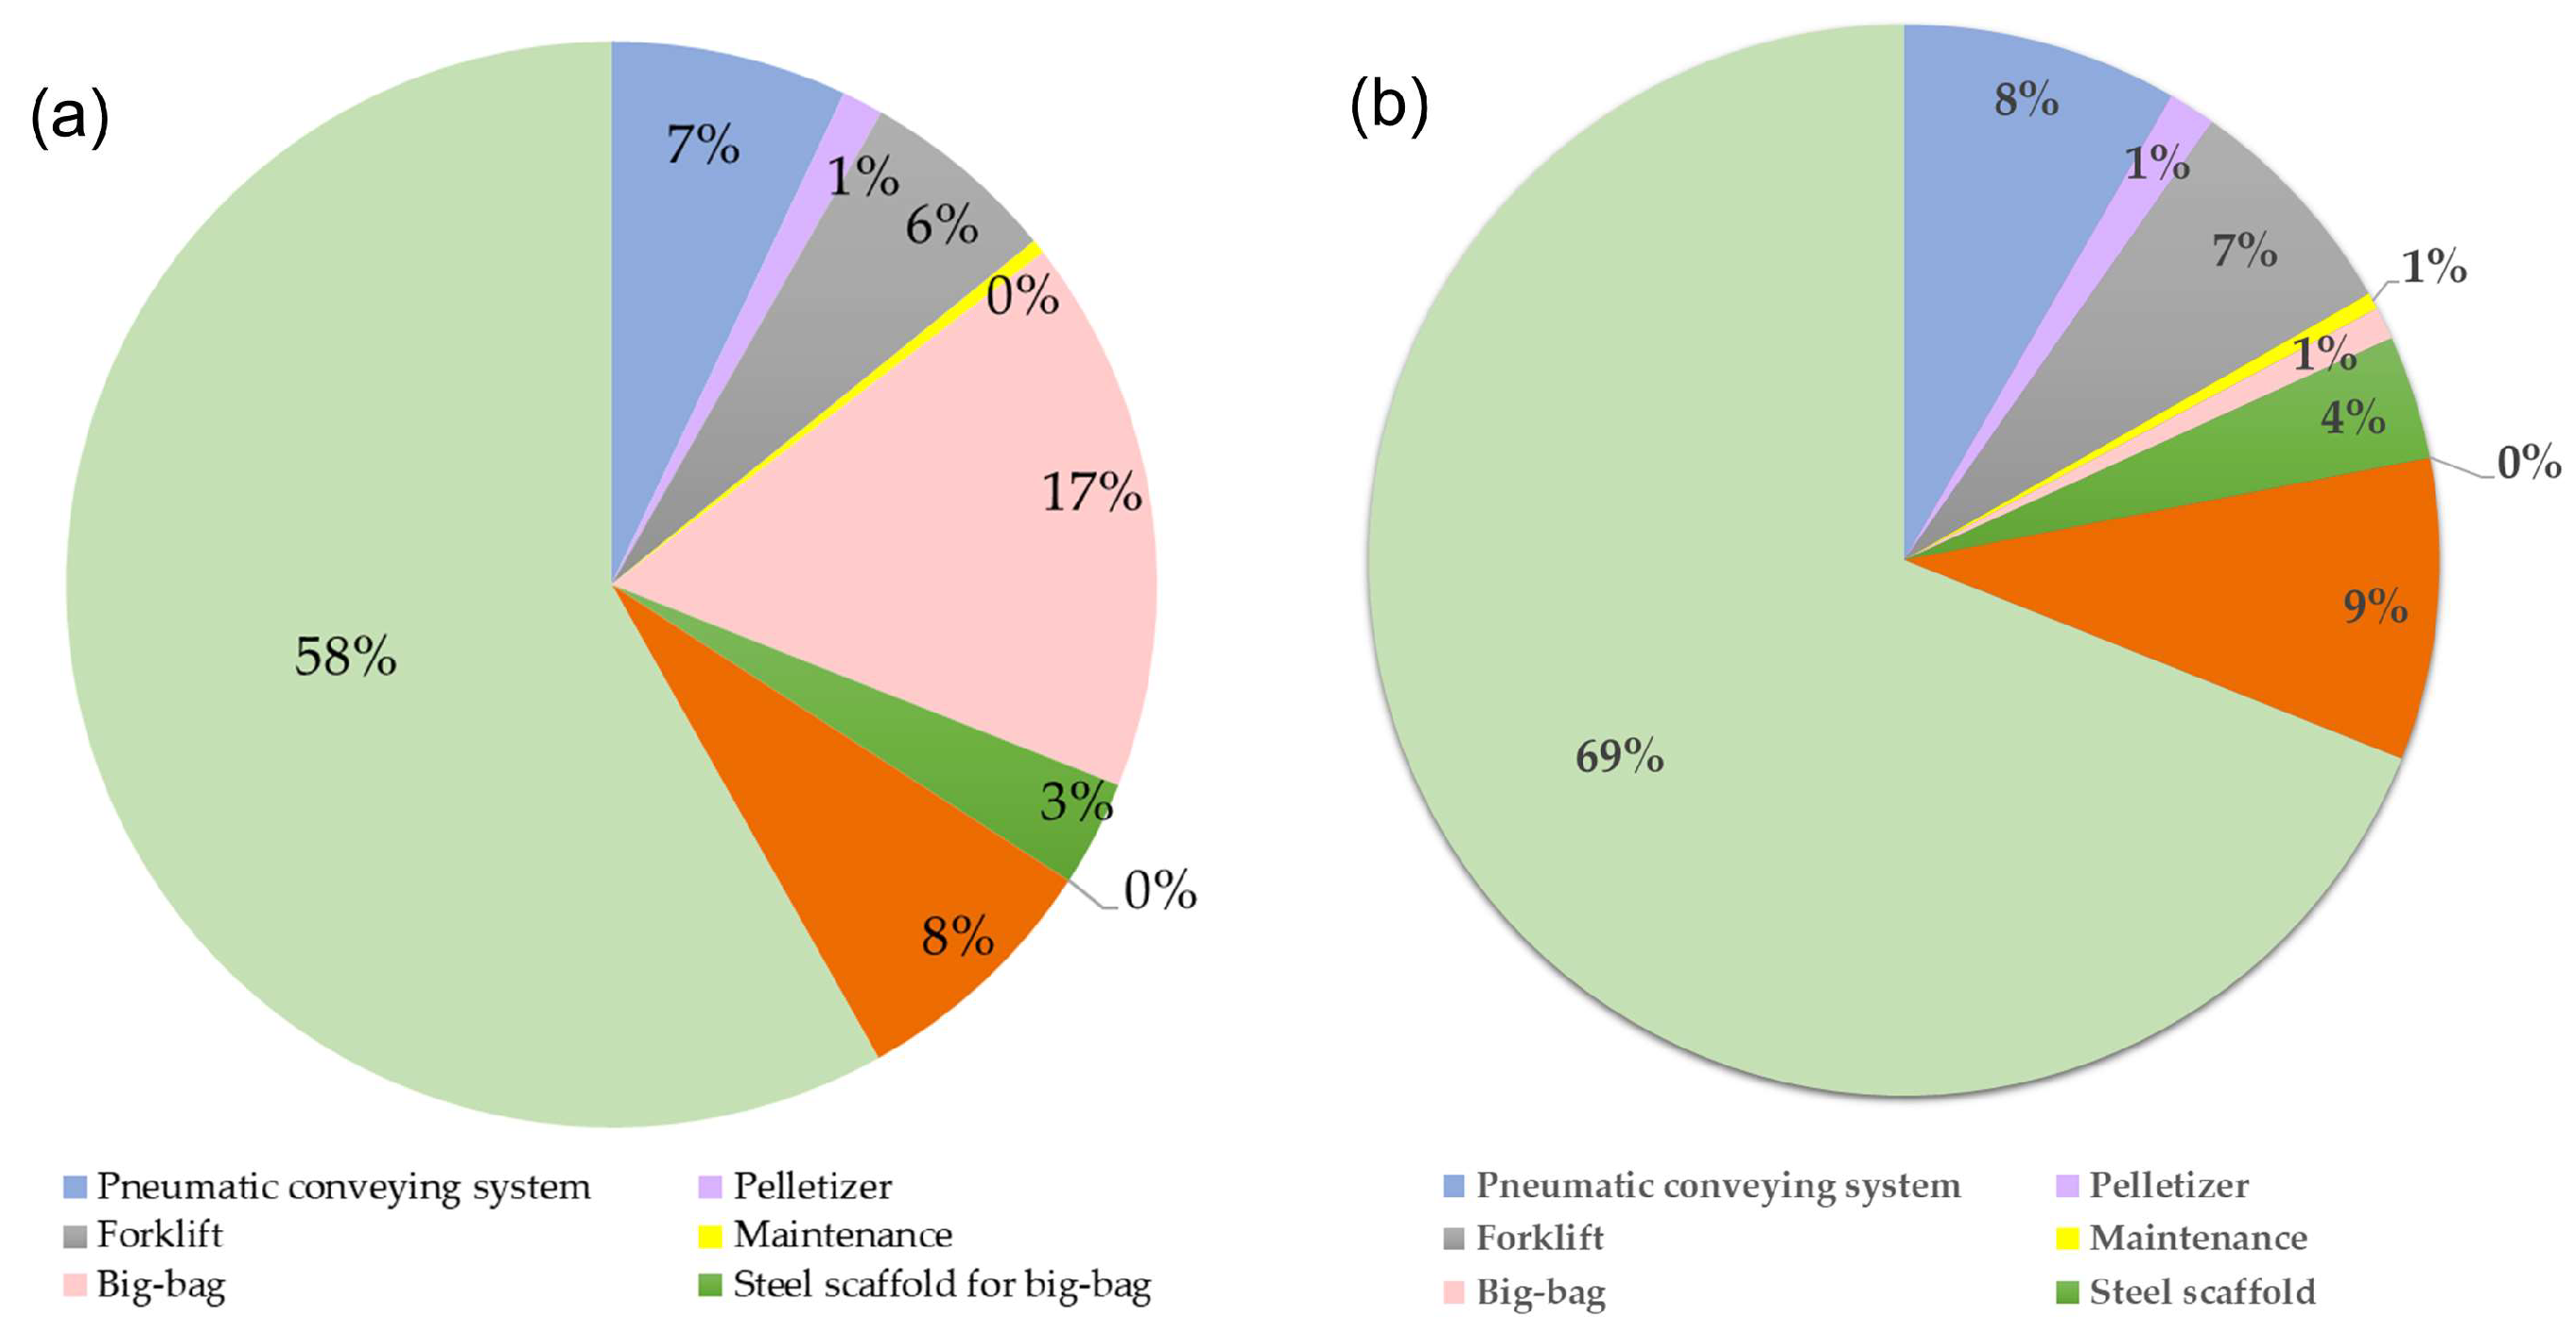


| Item | Internal Cost (€) | Reference 1 |
|---|---|---|
| Pre-treatment | ||
| Pneumatic conveying system | A, [89] | |
| Machinery (purchase) | 3.33 | |
| Electricity | 0.10 | |
| Maintenance | 0.10 | |
| Pelletizer | [89,90] | |
| Machinery (purchase) | 0.58 | |
| Electricity | 3.27 | |
| Maintenance | 0.02 | |
| Water | 0.00145 | [91] |
| Big bag for CS collection | 7.85 | P |
| Steel scaffold for big bag | 1.50 | [73] |
| Electric forklift | P, [89] | |
| Machinery (purchase) | 2.79 | |
| Electricity | 0.28 | |
| Maintenance | 0.08 | |
| Personnel | 27.65 | P, [92,93] |
| Total cost for BaU Pre-Treatment | 47.55 | |
| Treatment (disposal through composting) | ||
| Disposal of CS through the public service for composting | 400.00 | P |
| Total cost for BaU Treatment | 400.00 | |
| Composting Plant | ||
|---|---|---|
| Item | Internal Cost (€) | Reference |
| Composting of 1 ton of CS [2] | 91.50 | [2] |
| Selling price of 0.5 ton of compost [94] | −3.00 | [94] |
| Net INTERNAL COSTS for the Composting plant | 88.5 | |
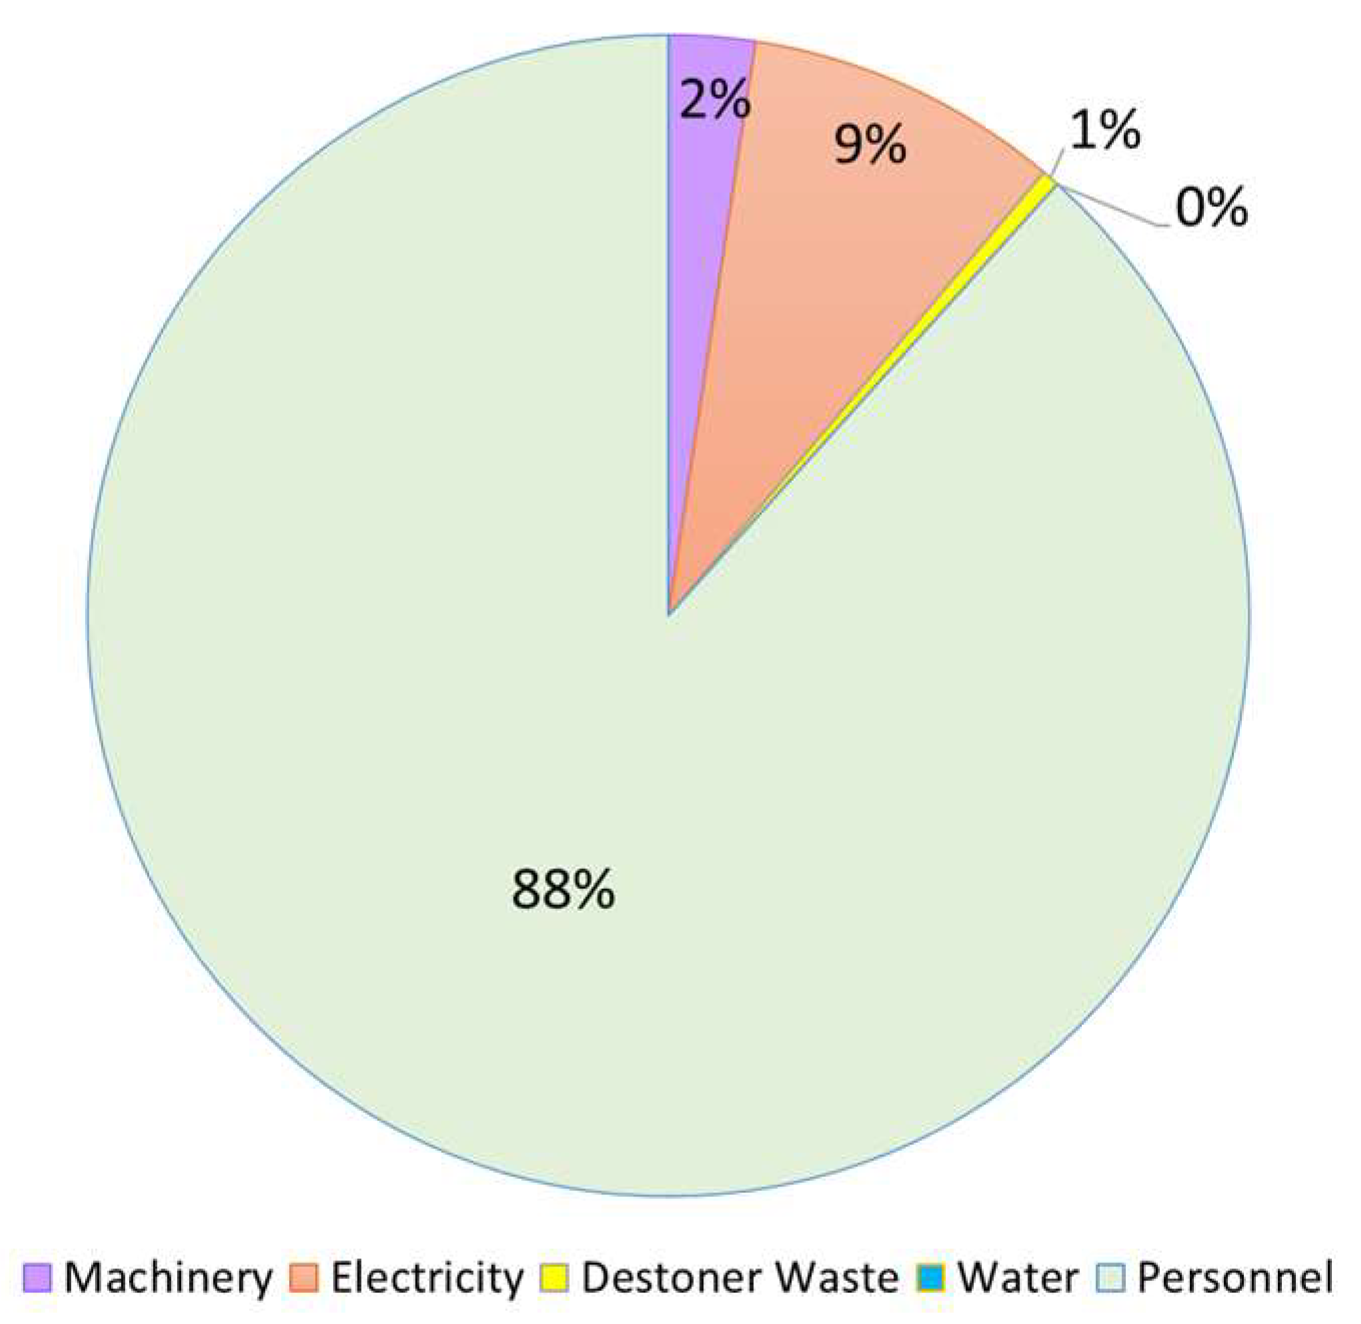
| Item | Internal Cost (€) | Reference 1 |
|---|---|---|
| Coffee company | ||
| Pre-treatment (as in Table 2, excluding big bags) | 39.70 | |
| Big bag for CS collection | 0.39 | P |
| Analyses | 80.00 | P |
| Transport to the bakery | 70.00 | P |
| Total cost for coffee company | 190.09 | |
| Bakery | ||
| Analyses | 80.00 | P |
| Sterilizer | 2.67 | A, [89] |
| Sterilizer Electricity | 268.39 | |
| Destoner | 1.16 | P, [89] |
| Destoner Electricity | 0.87 | |
| Destoner Waste | 20.00 | |
| Basin | 0.50 | A, [91] |
| Water | 0.18 | |
| Oven | 9.71 | P, [89] |
| Oven Electricity | 88.10 | |
| Homogenizer | 3.96 | P, [89] |
| Homogenizer Electricity | 2.80 | |
| Maintenance | 0.52 | A |
| Personnel | 3622.80 | P, [92,93] |
| Total cost for bakery | 4101.66 | |
| Savings on the purchase of wheat flour | −1330.00 | P |
| Additional revenues | 30,400.00 | P |
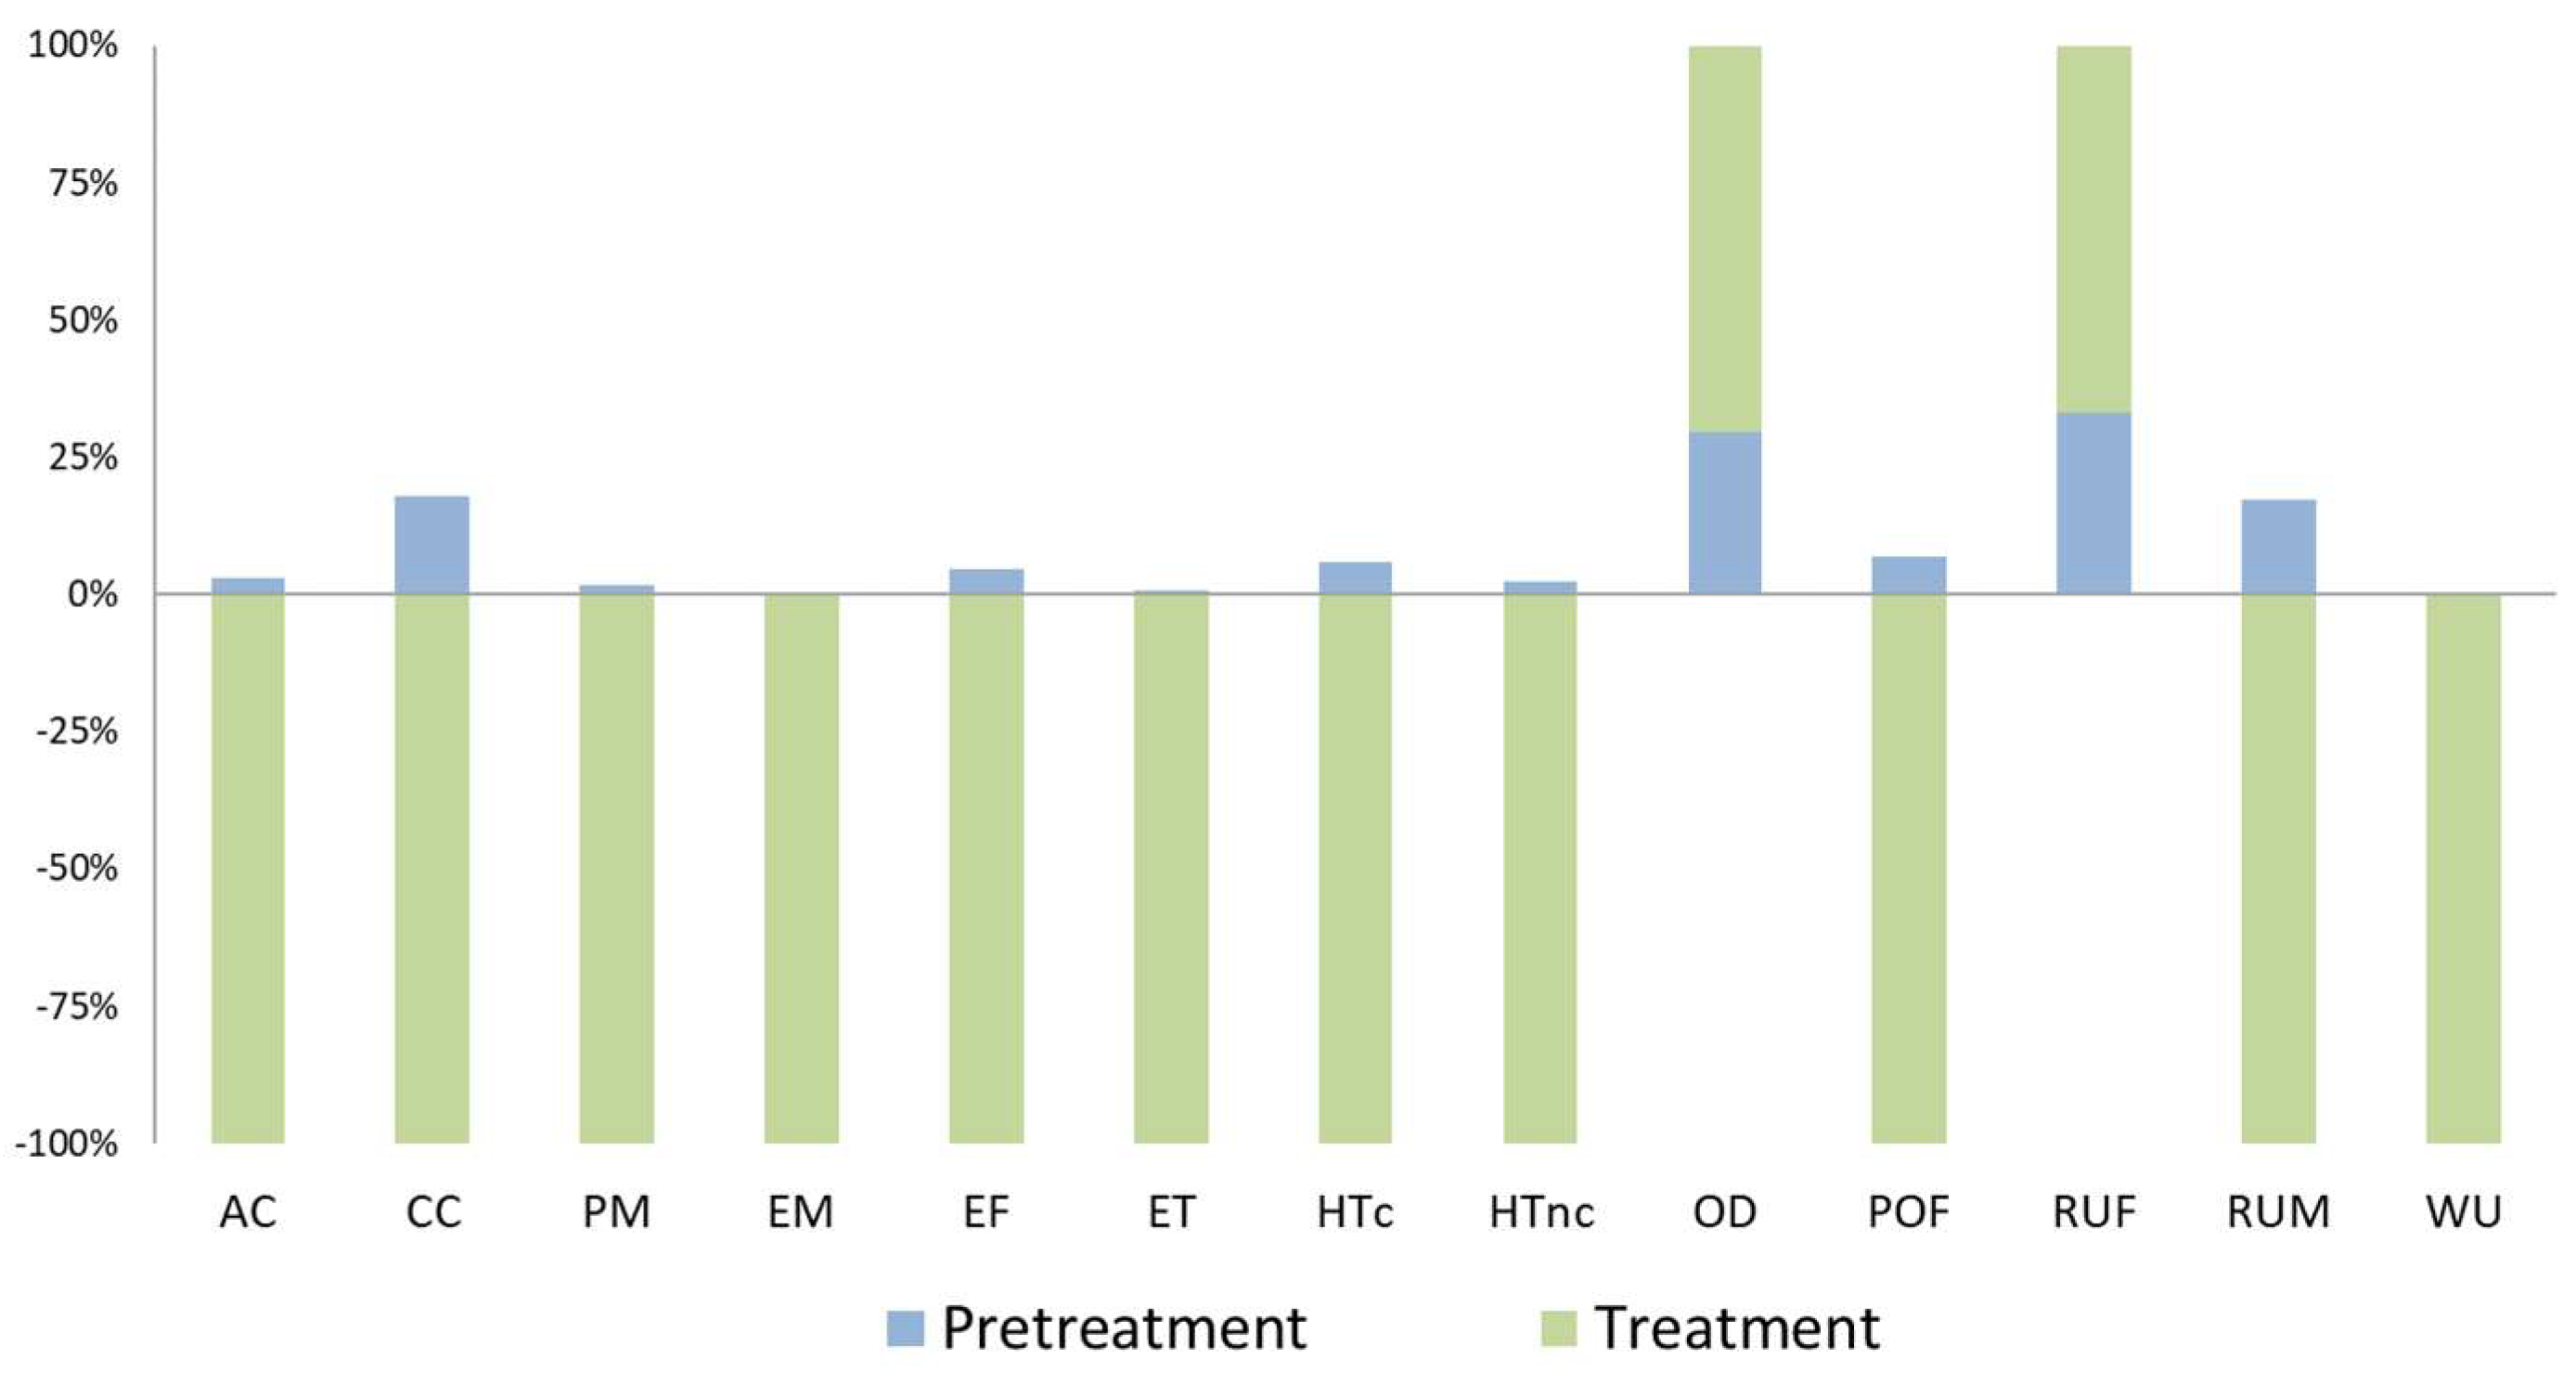
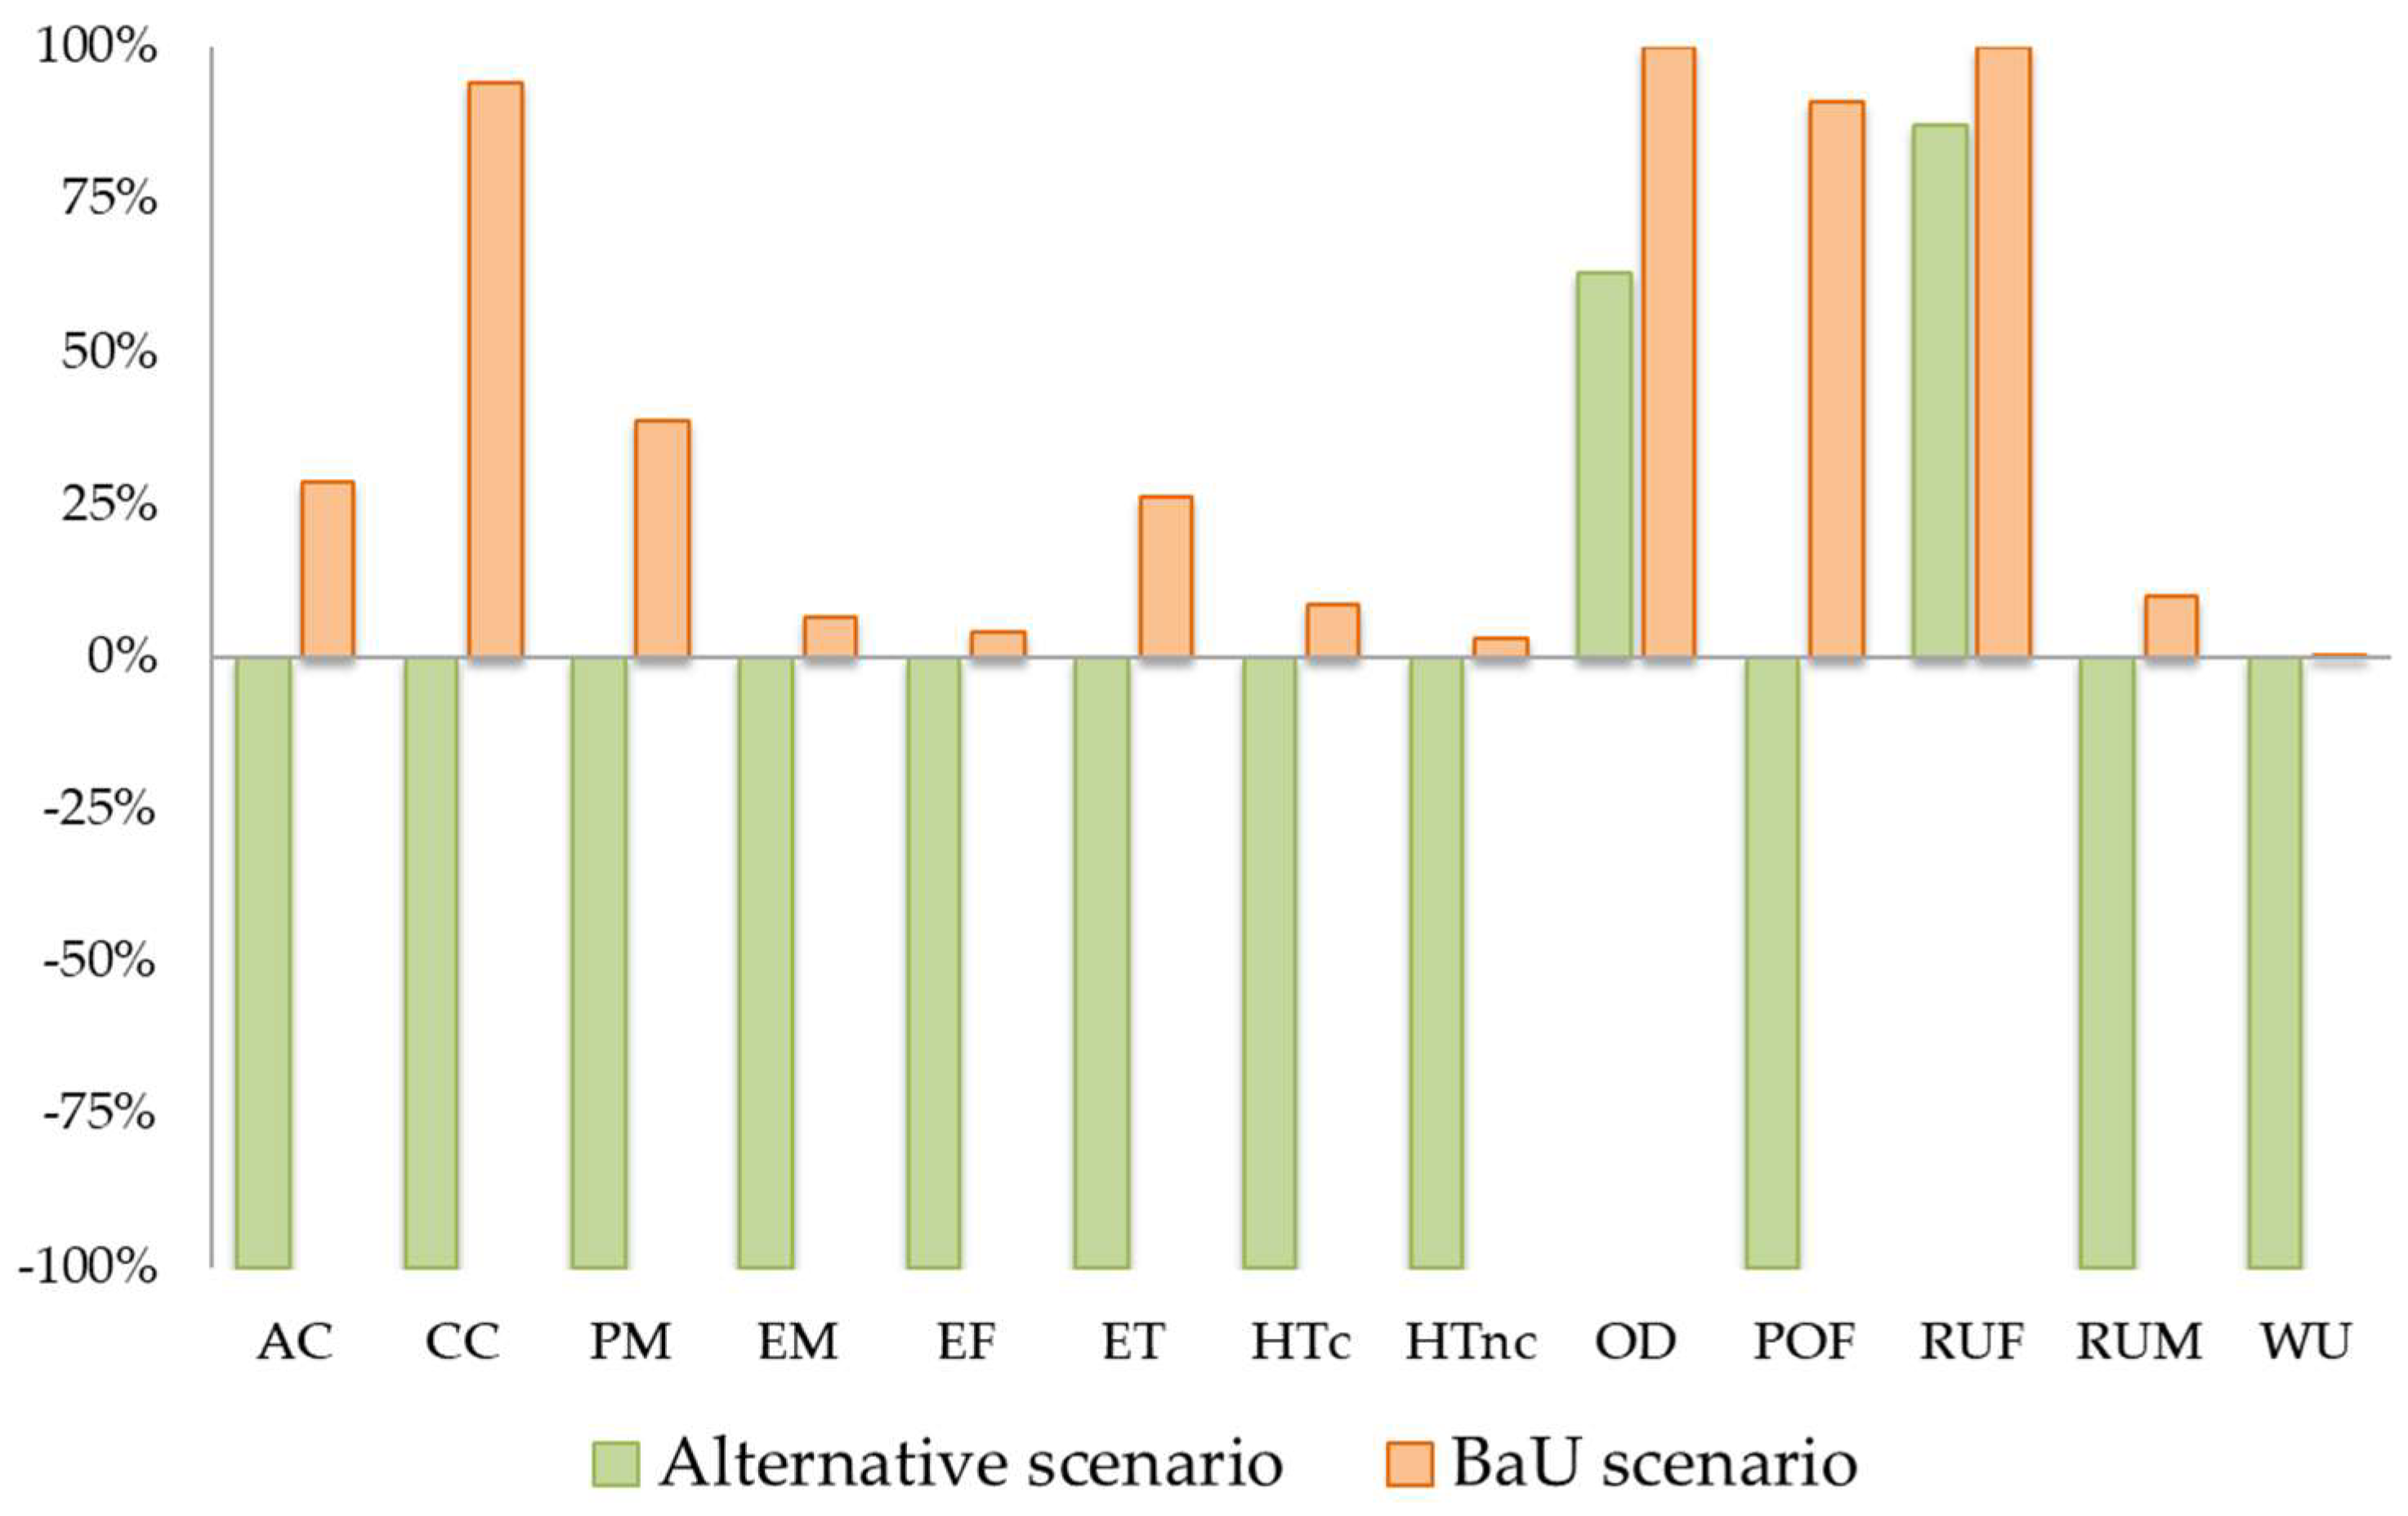
| Impact Category | Unit | Total 1 | Pre-Treatment | Treatment |
|---|---|---|---|---|
| Acidification | mol H+ eq. 2 | 3.29 × 100 | 4.12 × 10⁻¹ | 3.61 × 100 |
| Climate change | kg CO2 eq. 3 | 2.36 × 10² | 6.61 × 101 | 2.78 × 10² |
| Particulate matter | disease inc. 4 | 3.41 × 10⁻⁵ | 2.15 × 10⁻⁶ | 3.68 × 10⁻⁵ |
| Eutrophication, marine | kg N eq. 5 | 5.32 × 10⁻¹ | 5.71 × 10⁻² | 5.75 × 10⁻¹ |
| Eutrophication, freshwater | kg P eq. 5 | 1.68 × 10⁻² | 2.26 × 10⁻² | 2.72 × 10⁻² |
| Eutrophication, terrestrial | mol N eq. 6 | 1.43 × 101 | 5.90 × 10⁻¹ | 1.50 × 101 |
| Human toxicity, cancer | CTUh 7 | 8.63 × 10⁻⁸ | 6.76 × 10⁻⁸ | 1.14 × 10⁻⁷ |
| Human toxicity, non-cancer | CTUh 7 | 1.09 × 10⁻⁶ | 9.76 × 10⁻⁷ | 1.63 × 10⁻⁶ |
| Ozone depletion | kg CFC11 eq. 8 | 4.11 × 10⁻⁵ | 8.22 × 10⁻⁶ | 4.74 × 10⁻⁵ |
| Photochemical ozone formation | kg NMVOC eq. 9 | 1.81 × 100 | 1.83 × 10⁻¹ | 1.91 × 100 |
| Resource use, fossils | MJ | 2.86 × 10³ | 1.16 × 10³ | 3.61 × 10³ |
| Resource use, minerals and metals | kg Sb eq. 10 | 5.27 × 10⁻⁴ | 1.13 × 10⁻³ | 1.37 × 10⁻³ |
| Water use | m3 depriv. 11 | 1.17 × 101 | 5.10 × 101 | 5.35 × 101 |
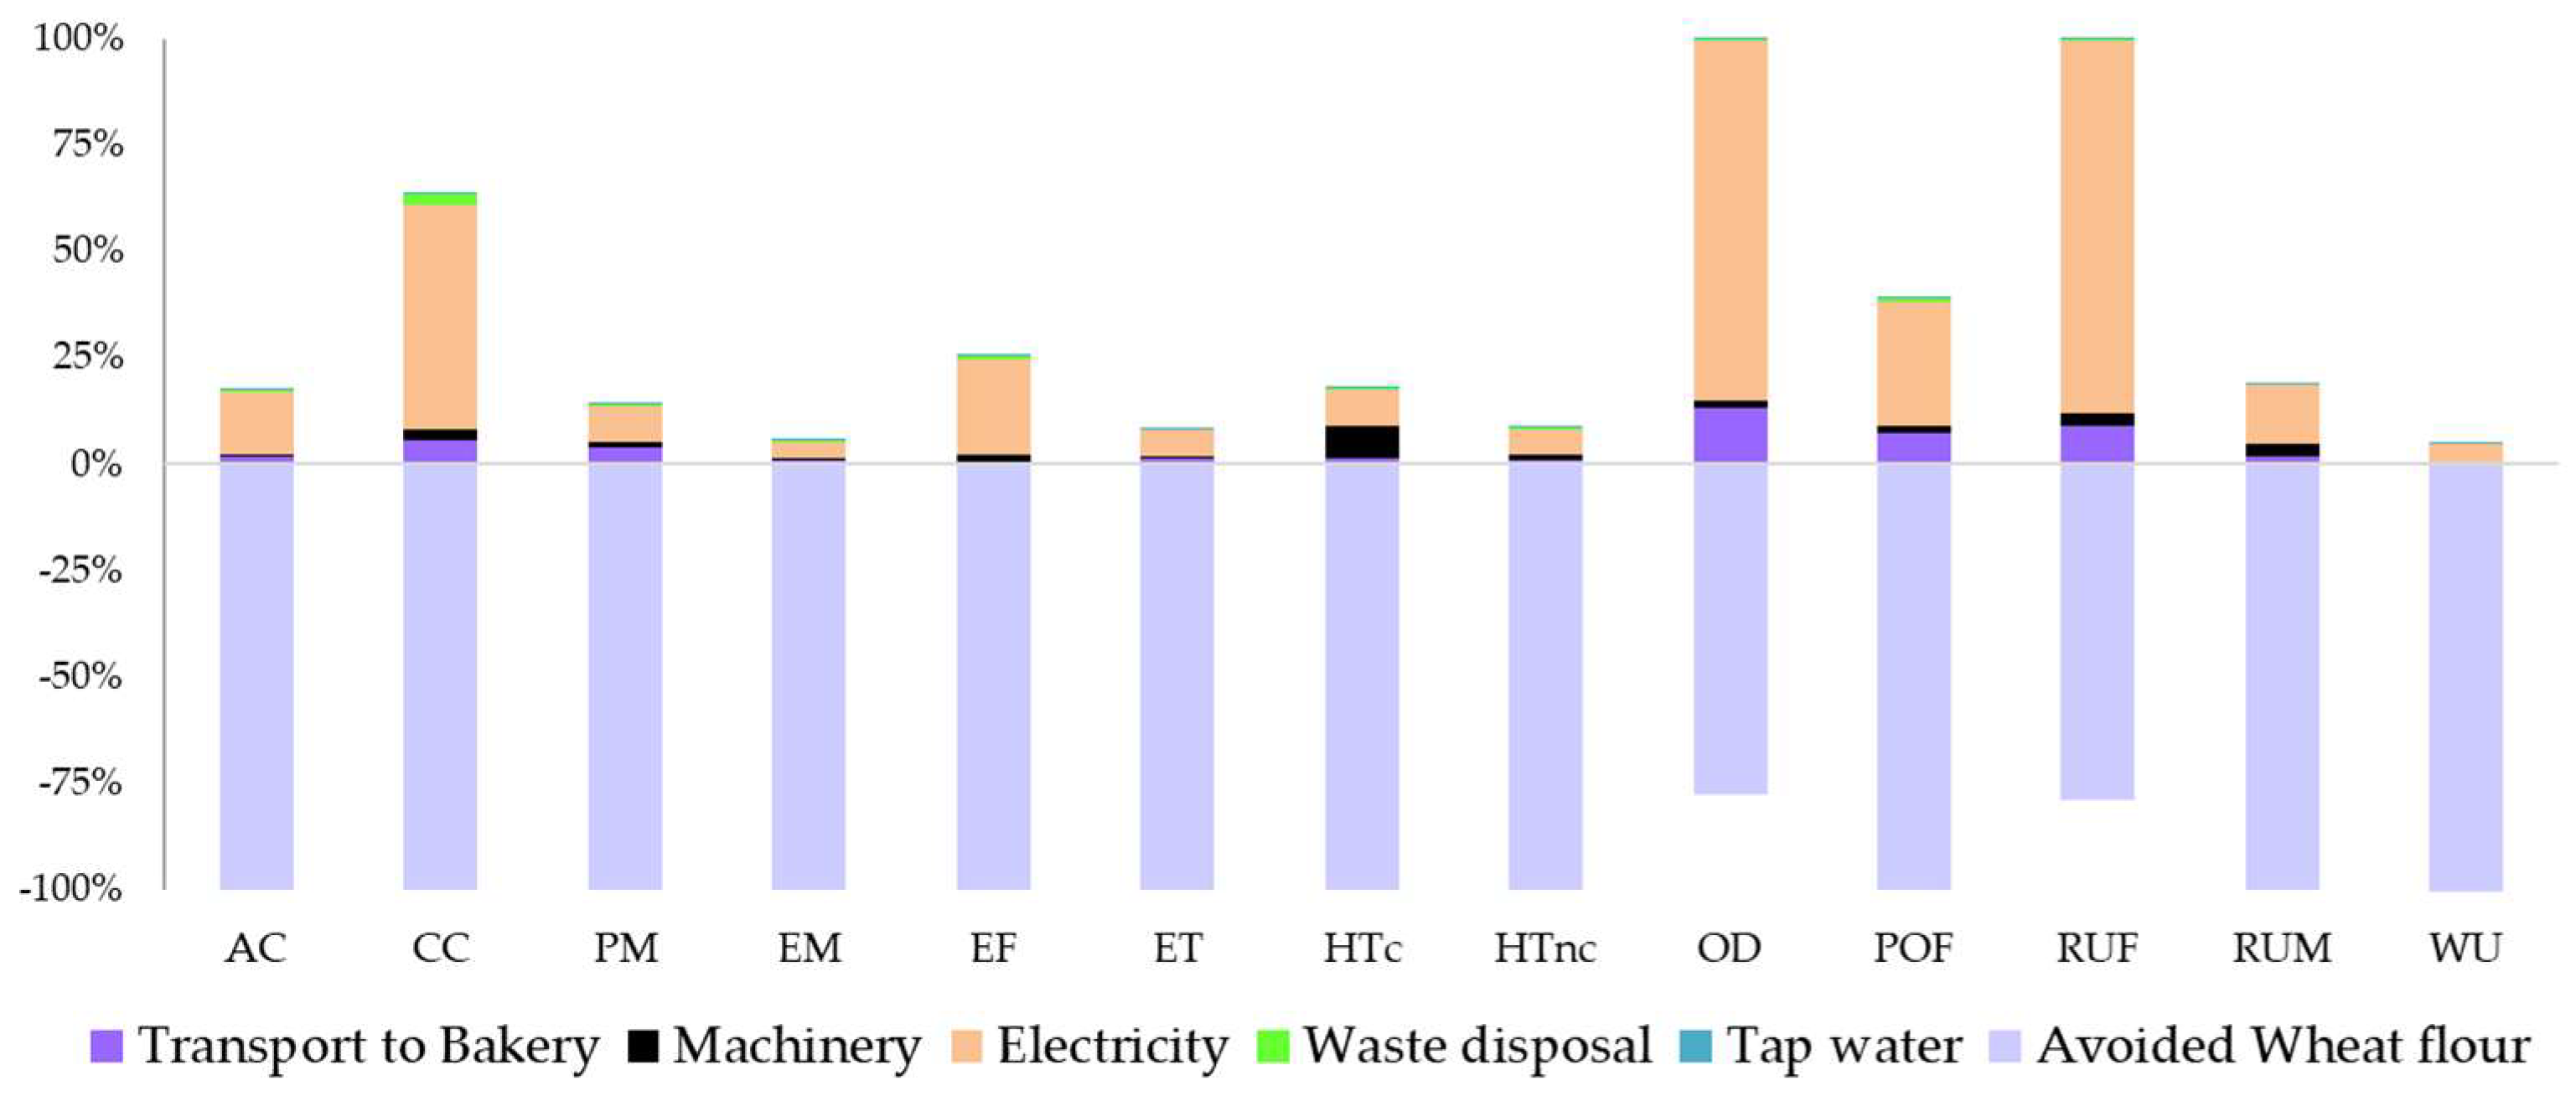
| Impact Category | Unit | Total 1 | Pre-treatment | Treatment |
|---|---|---|---|---|
| Acidification | mol H+ eq. 2 | −1.14 × 101 | 3.59 × 10⁻¹ | 2.47 × 10⁻³ |
| Climate change | kg CO2 eq. 3 | −2.50 × 10² | 5.41 × 101 | 5.30 × 10⁻¹ |
| Particulate matter | disease inc. 4 | −8.81 × 10⁻⁵ | 1.67 × 10⁻⁶ | 1.46 × 10⁻⁸ |
| Eutrophication, marine | kg N eq. 5 | −8.21 × 100 | 4.70 × 10⁻² | 5.01 × 10⁻⁴ |
| Eutrophication, freshwater | kg P eq. 5 | −3.96 × 10⁻¹ | 1.94 × 10⁻² | 1.42 × 10⁻⁴ |
| Eutrophication, terrestrial | mol N eq. 6 | −5.41 × 101 | 4.86 × 10⁻¹ | 4.79 × 10⁻³ |
| Human toxicity, cancer | CTUh 7 | −1.00 × 10⁻⁶ | 6.37 × 10⁻⁸ | 2.35 × 10⁻¹⁰ |
| Human toxicity, non-cancer | CTUh 7 | −3.61 × 10⁻⁵ | 8.95 × 10⁻⁷ | 3.49 × 10⁻⁹ |
| Ozone depletion | kg CFC11 eq. 8 | 2.59 × 10⁻⁵ | 7.68 × 10⁻⁶ | 8.15 × 10⁻⁸ |
| Photochemical ozone formation | kg NMVOC eq. 9 | −1.99 × 100 | 1.45 × 10⁻¹ | 1.36 × 10⁻³ |
| Resource use, fossils | MJ | 2.50 × 10³ | 8.33 × 10² | 7.93 × 100 |
| Resource use, minerals and metals | kg Sb eq. 10 | −5.18 × 10⁻³ | 1.08 × 10⁻³ | 1.45 × 10⁻⁶ |
| Water use | m3 depriv. 11 | −7.92 × 10³ | 4.63 × 101 | 4.12 × 10⁻¹ |
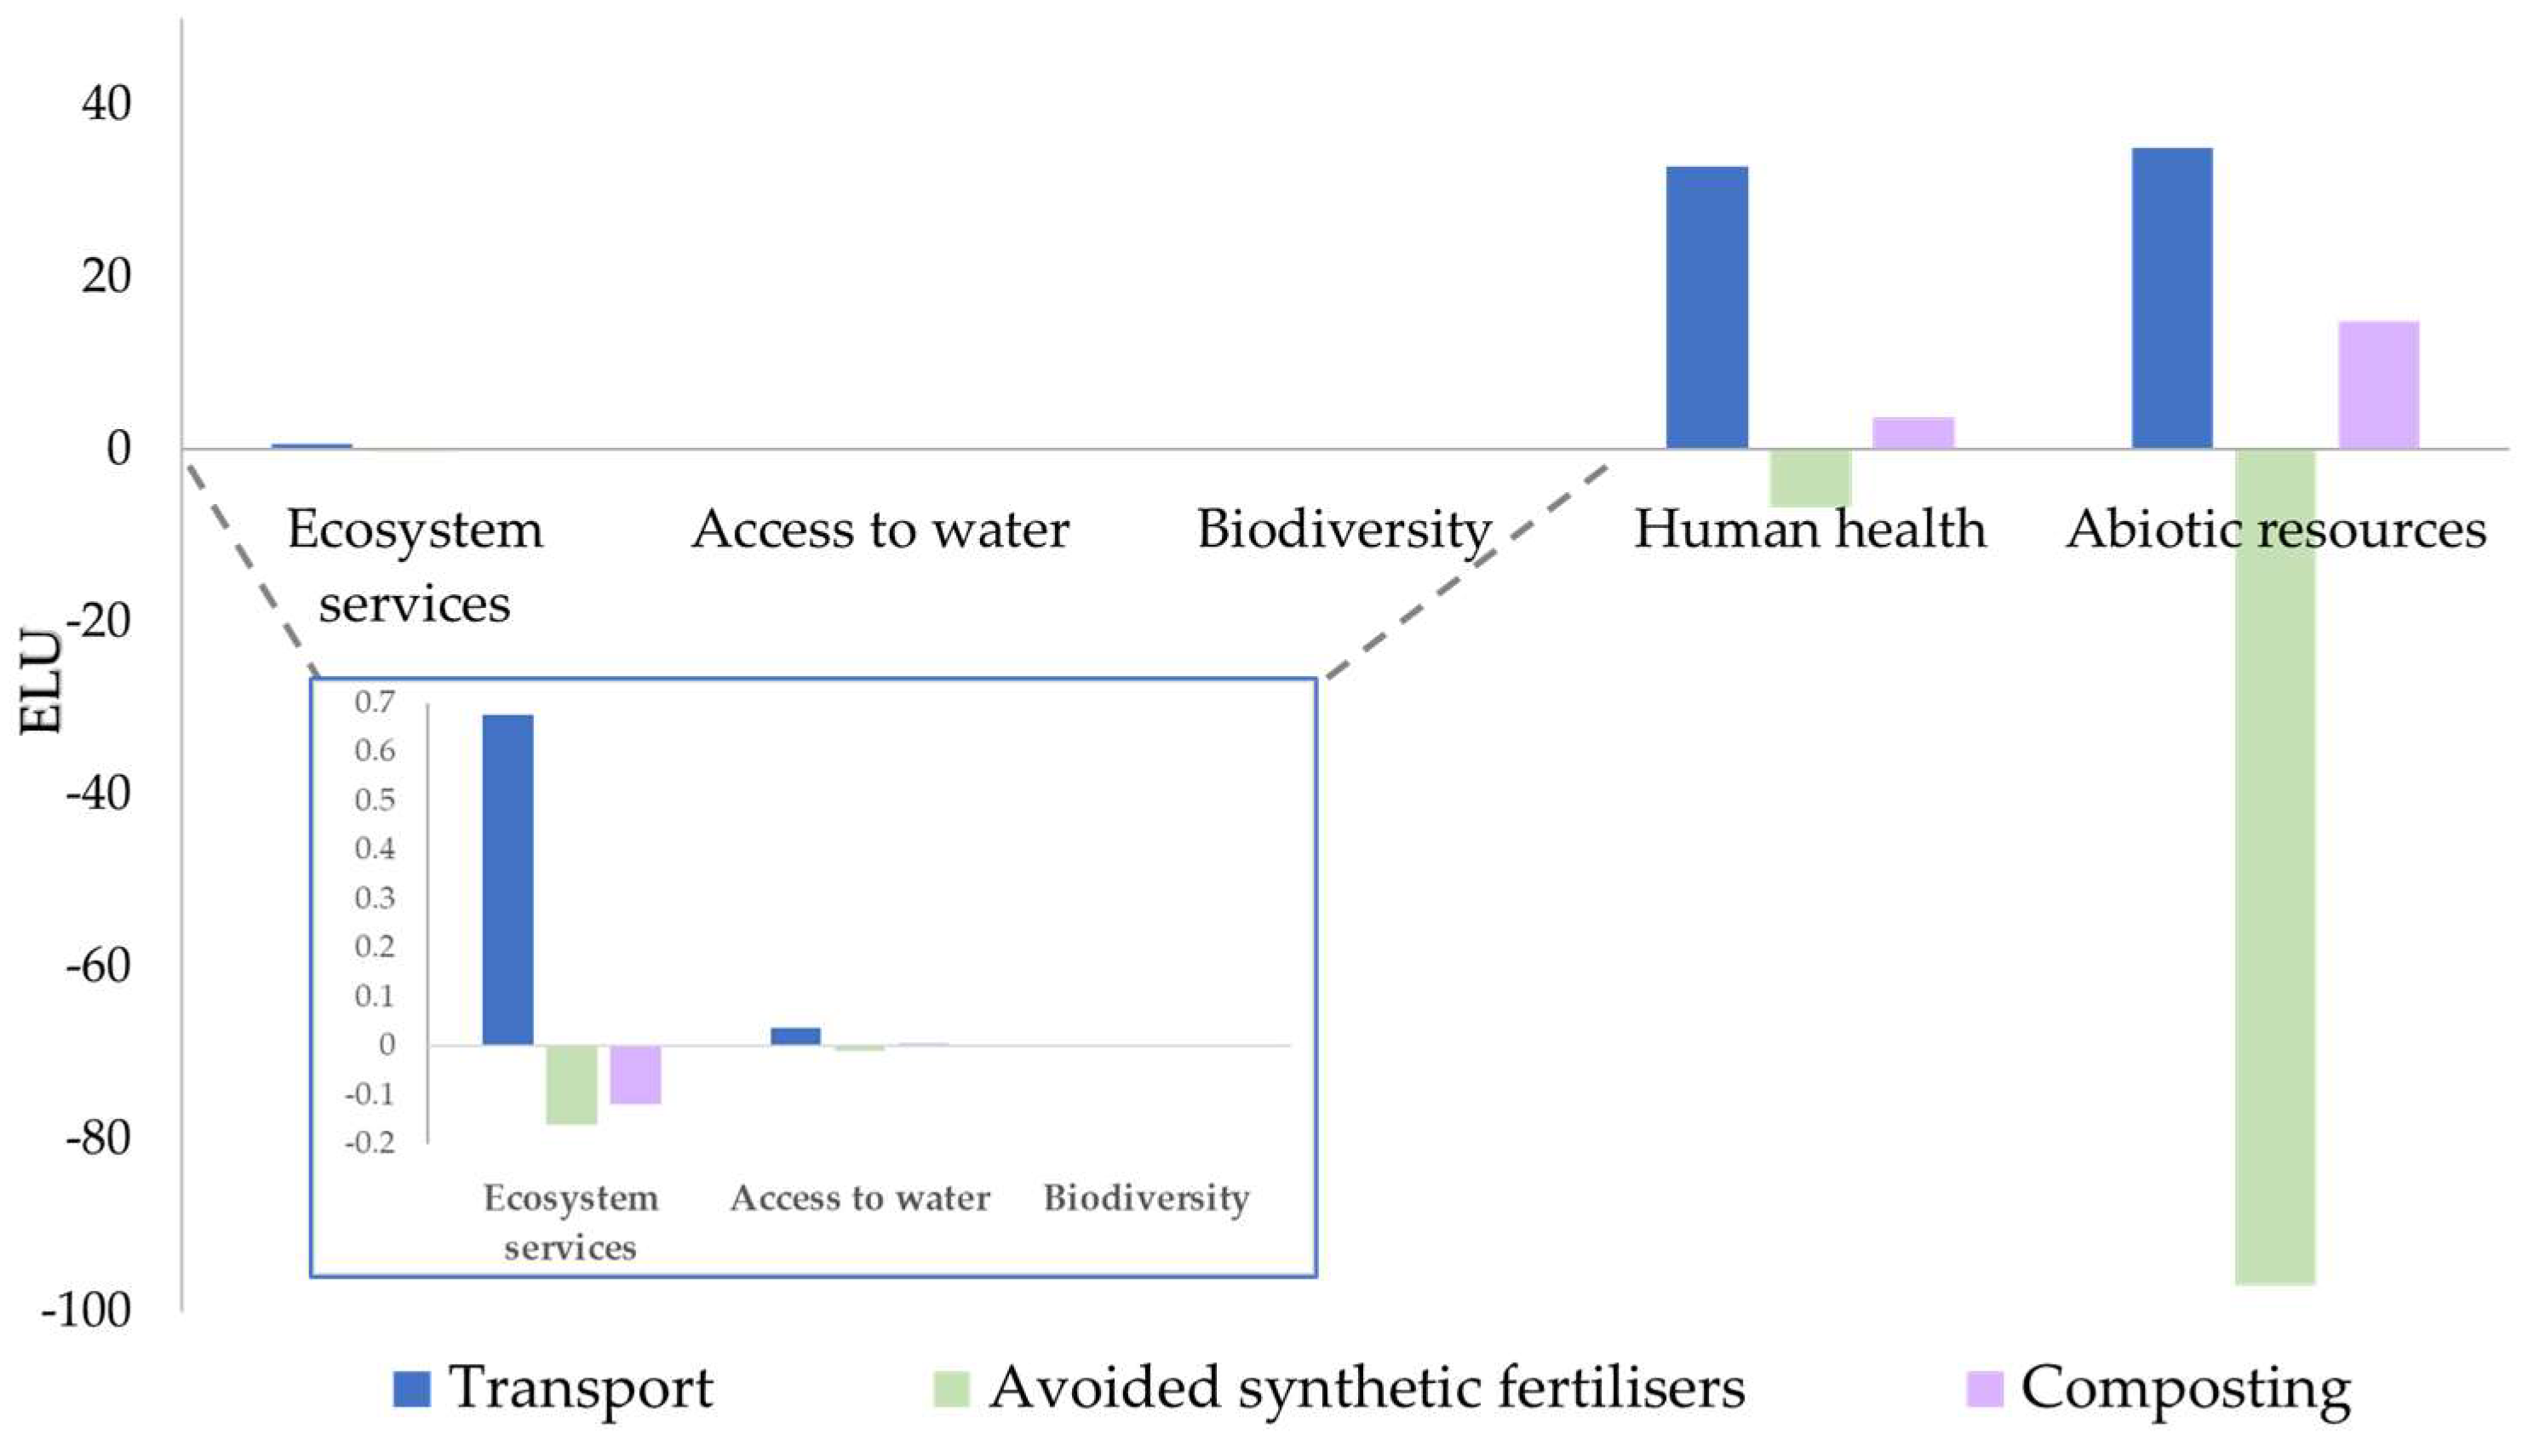
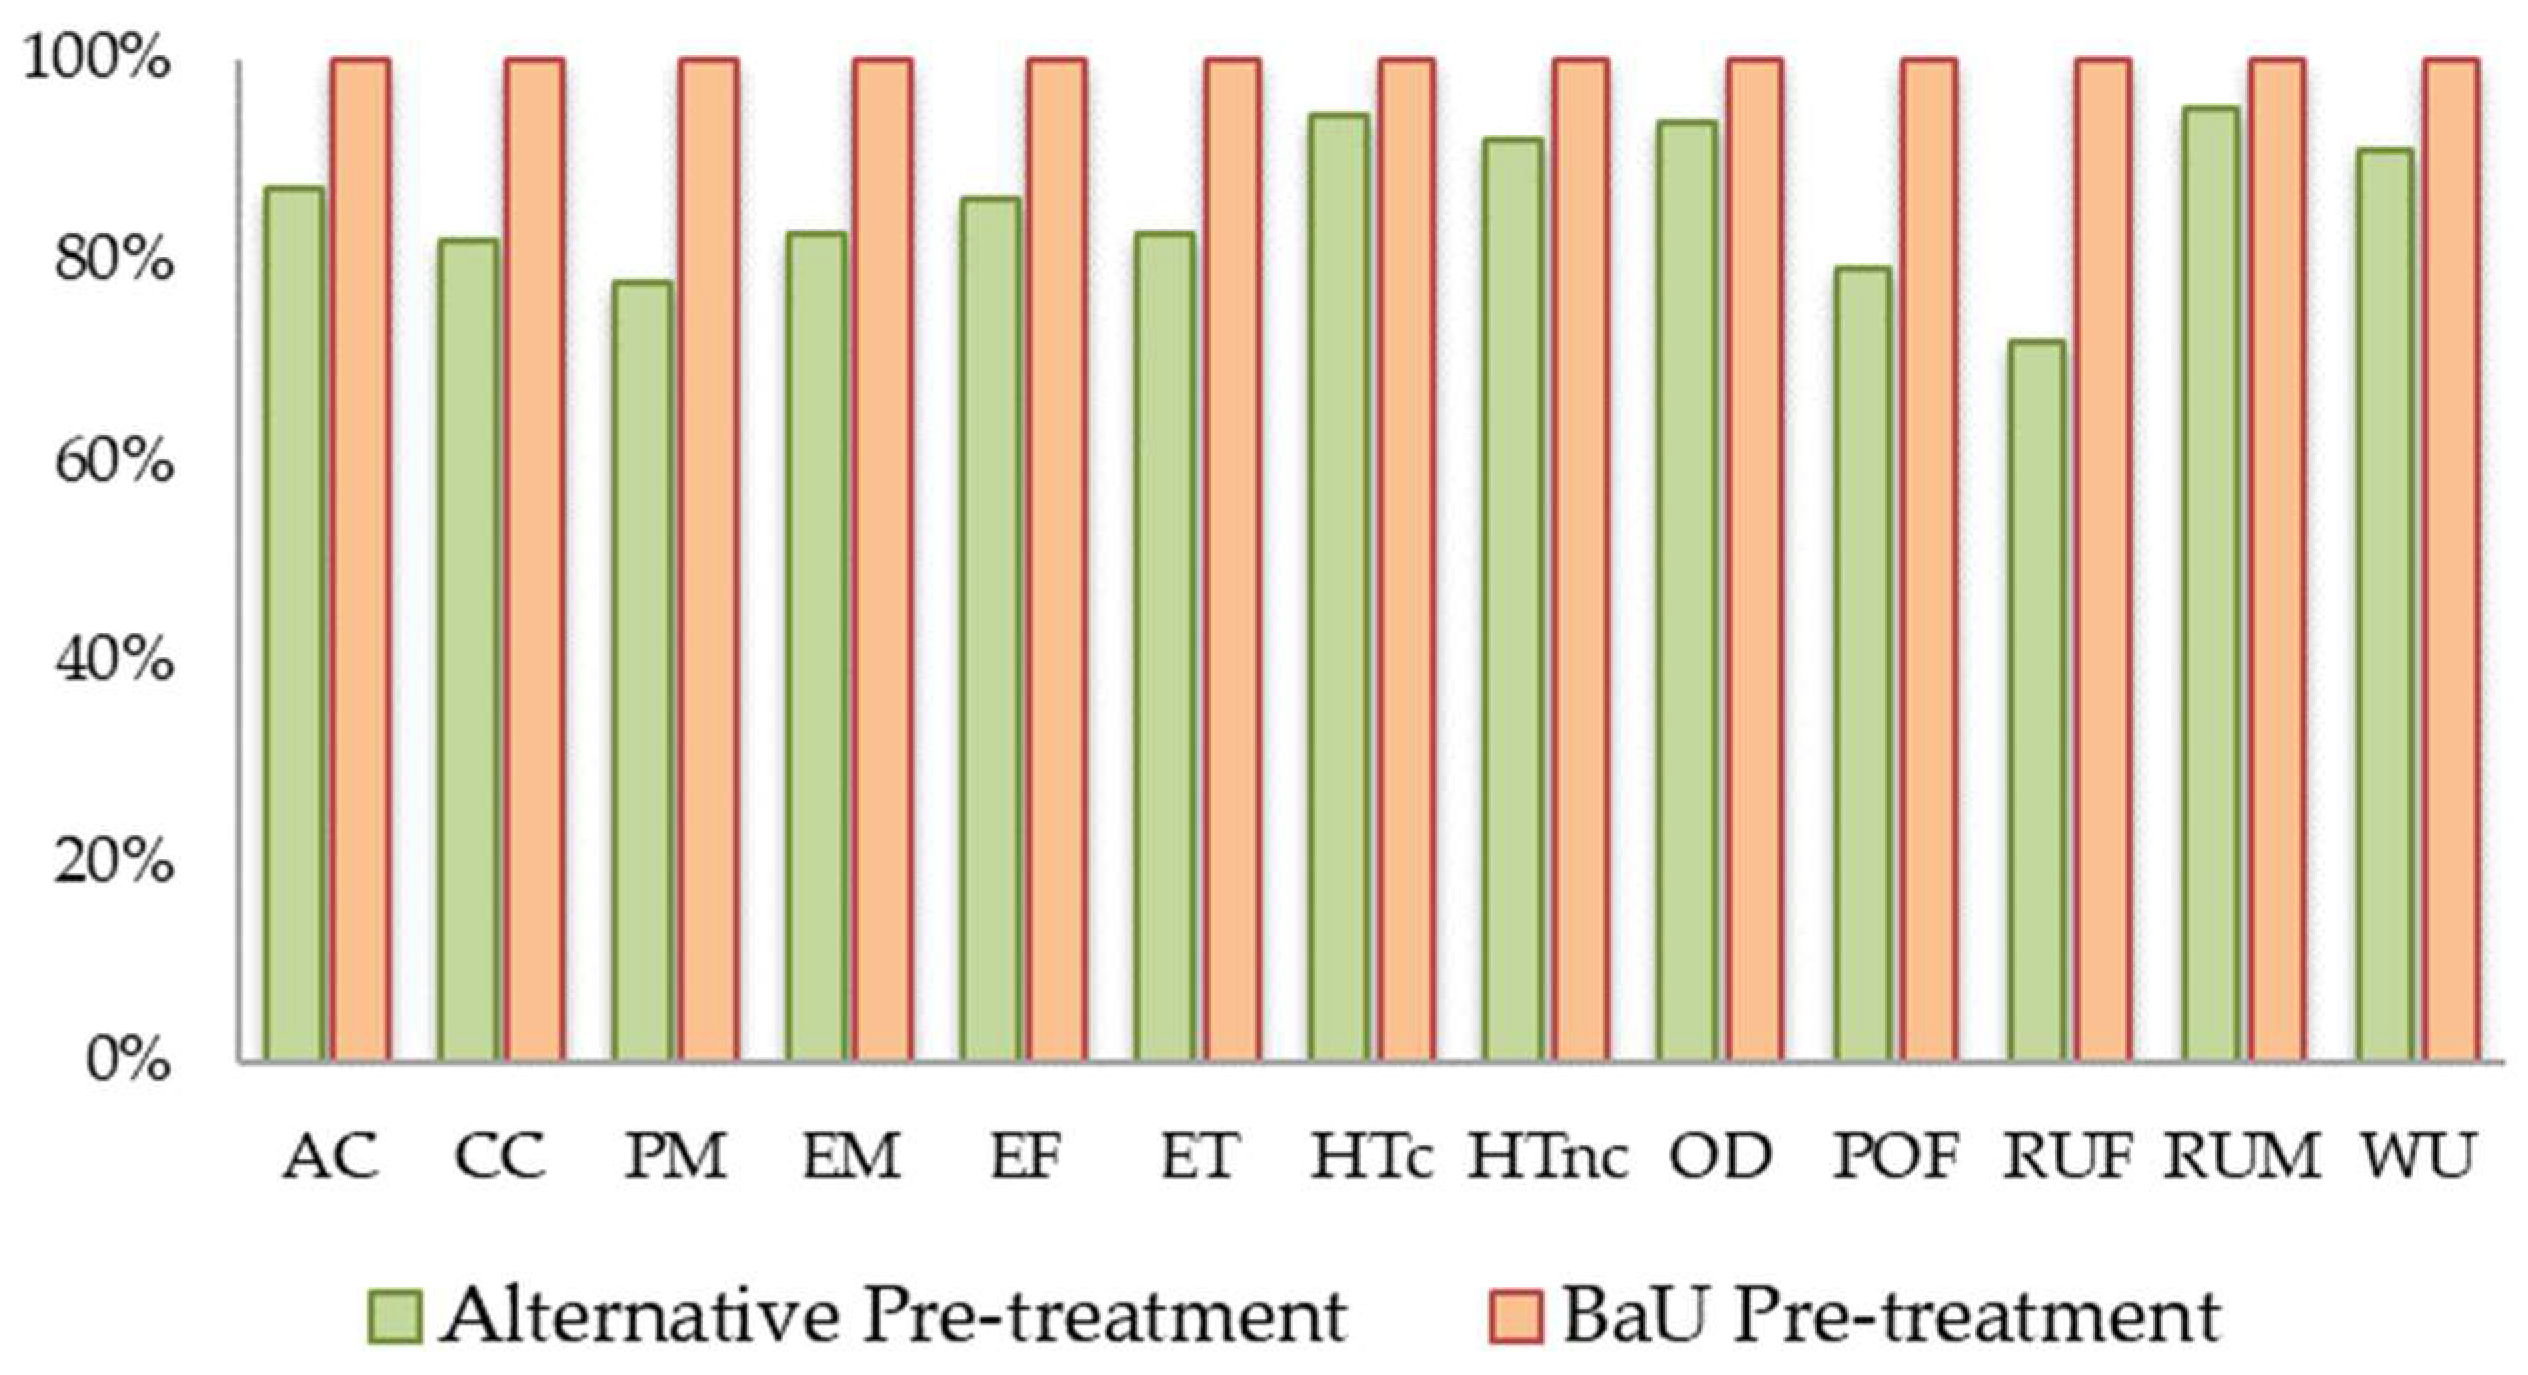
| Safeguard Subject | Unit 1 | Total | Pre-Treatment | Treatment (Composting) |
|---|---|---|---|---|
| Ecosystem services | ELU | 6.57 × 10⁻¹ | 2.60 × 10⁻¹ | 3.98 × 10⁻¹ |
| Access to water | ELU | 4.84 × 10⁻² | 1.58 × 10⁻² | 3.26 × 10⁻² |
| Biodiversity | ELU | 4.14 × 10⁻³ | 8.61 × 10⁻⁴ | 3.27 × 10⁻³ |
| Human health | ELU | 4.13 × 101 | 1.14 × 101 | 2.99 × 101 |
| Abiotic resources | ELU | 1.14 × 10² | 1.61 × 10² | −4.70 × 101 |
| Total | ELU | 1.56 × 10² | 1.72 × 10² | −1.66 × 101 |
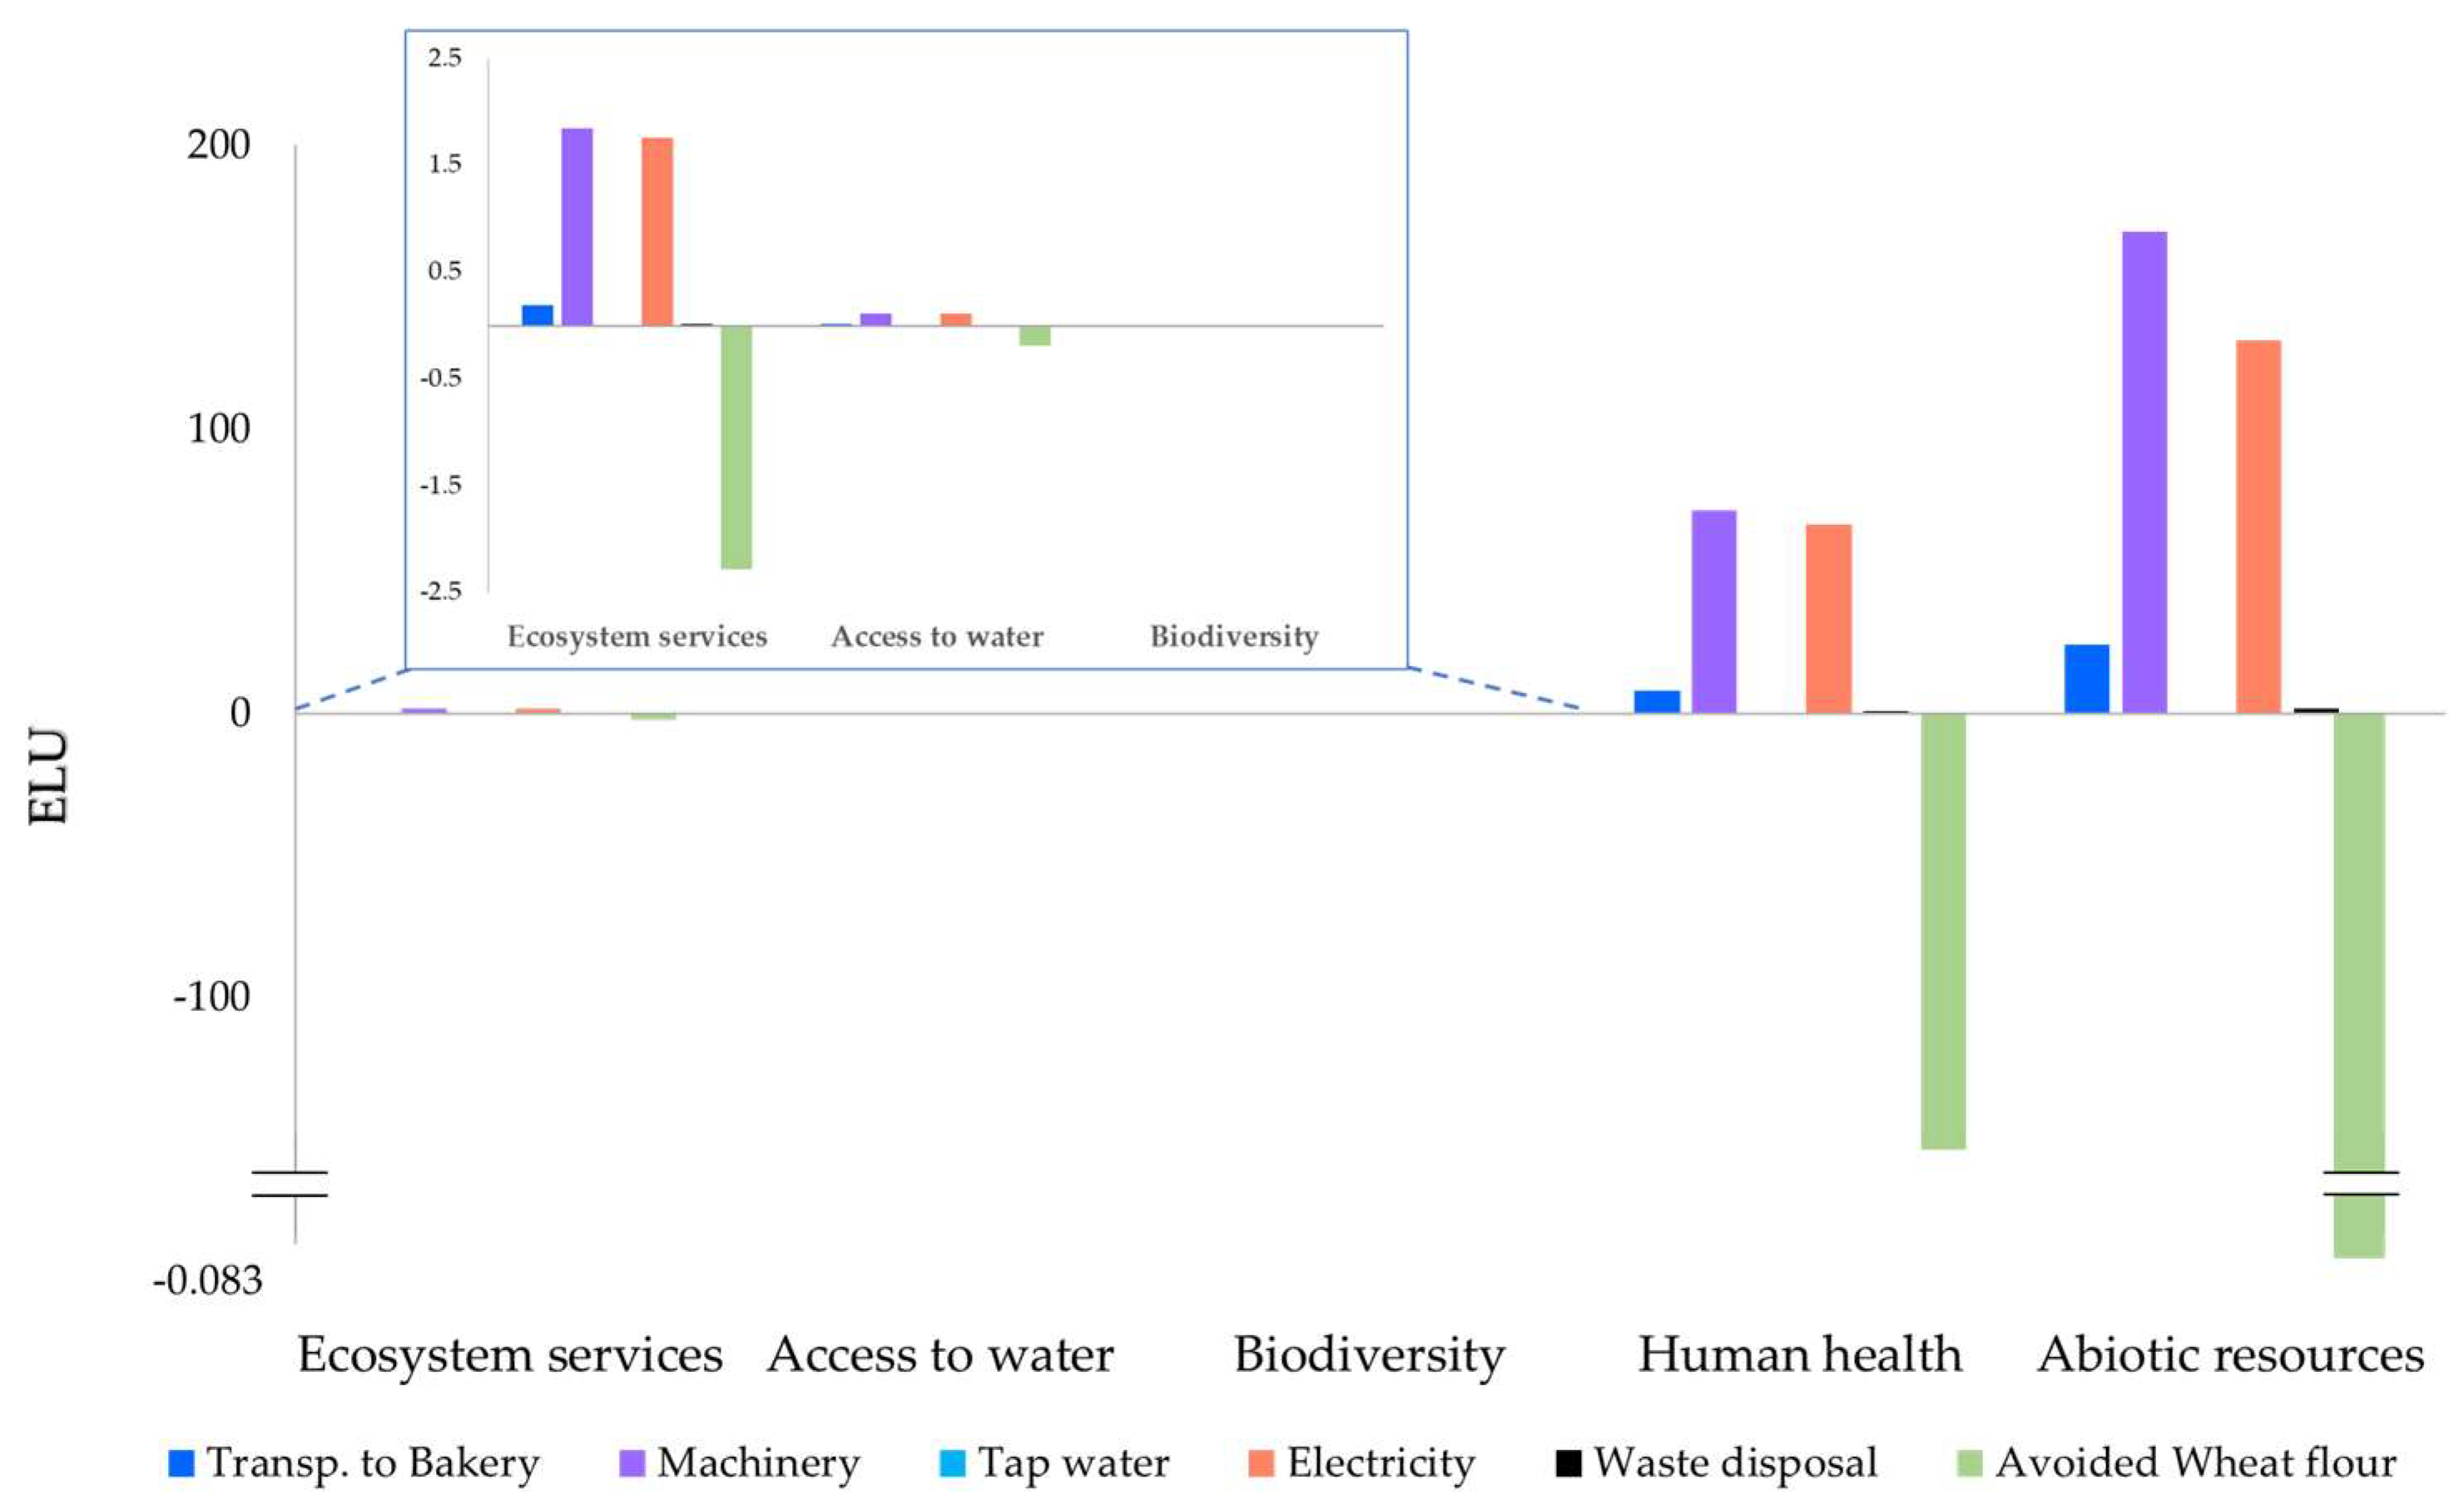
| Safeguard Subject | Unit 1 | Total | Pre-Treatment | Treatment |
|---|---|---|---|---|
| Ecosystem services | ELU | −2.90 × 10⁻² | 2.13 × 10⁻¹ | −2.42 × 10⁻¹ |
| Access to water | ELU | −5.69 × 10⁻² | 1.30 × 10⁻² | −6.99 × 10⁻² |
| Biodiversity | ELU | −1.05 × 10⁻² | 7.10 × 10⁻⁴ | −1.13 × 10⁻² |
| Human health | ELU | 1.29 × 10⁻² | 1.72 × 10⁻³ | 1.12 × 10⁻² |
| Abiotic resources | ELU | −6.43 × 101 | 9.09 × 100 | −7.34 × 101 |
| Total | ELU | −5.46 × 10² | 1.63 × 10² | −7.09 × 10² |
| Category | Unit | BaU 1 | Alternative 1 |
|---|---|---|---|
| Net INTERNAL costs | €/ton | −447.6 | −199.1 |
| Net EXTERNAL costs | €/ton | −155.8 | 545.8 |
| Total | €/ton | −603.4 | 346.7 |
Disclaimer/Publisher’s Note: The statements, opinions and data contained in all publications are solely those of the individual author(s) and contributor(s) and not of MDPI and/or the editor(s). MDPI and/or the editor(s) disclaim responsibility for any injury to people or property resulting from any ideas, methods, instructions or products referred to in the content. |
© 2023 by the authors. Licensee MDPI, Basel, Switzerland. This article is an open access article distributed under the terms and conditions of the Creative Commons Attribution (CC BY) license (https://creativecommons.org/licenses/by/4.0/).
Share and Cite
Ansanelli, G.; Fiorentino, G.; Chifari, R.; Meisterl, K.; Leccisi, E.; Zucaro, A. Sustainability Assessment of Coffee Silverskin Waste Management in the Metropolitan City of Naples (Italy): A Life Cycle Perspective. Sustainability 2023, 15, 16281. https://doi.org/10.3390/su152316281
Ansanelli G, Fiorentino G, Chifari R, Meisterl K, Leccisi E, Zucaro A. Sustainability Assessment of Coffee Silverskin Waste Management in the Metropolitan City of Naples (Italy): A Life Cycle Perspective. Sustainability. 2023; 15(23):16281. https://doi.org/10.3390/su152316281
Chicago/Turabian StyleAnsanelli, Giuliana, Gabriella Fiorentino, Rosaria Chifari, Karin Meisterl, Enrica Leccisi, and Amalia Zucaro. 2023. "Sustainability Assessment of Coffee Silverskin Waste Management in the Metropolitan City of Naples (Italy): A Life Cycle Perspective" Sustainability 15, no. 23: 16281. https://doi.org/10.3390/su152316281
APA StyleAnsanelli, G., Fiorentino, G., Chifari, R., Meisterl, K., Leccisi, E., & Zucaro, A. (2023). Sustainability Assessment of Coffee Silverskin Waste Management in the Metropolitan City of Naples (Italy): A Life Cycle Perspective. Sustainability, 15(23), 16281. https://doi.org/10.3390/su152316281