Article

Effect of Phosphorus Application on Eggplant Cadmium Accumulation and Soil Cadmium Morphology

College of Resources and Environment, Shanxi Agricultural University, Jinzhong 030801, China
*
Author to whom correspondence should be addressed.
Sustainability 2023, 15(23), 16236; https://doi.org/10.3390/su152316236
Submission received: 26 September 2023 / Revised: 7 November 2023 / Accepted: 21 November 2023 / Published: 23 November 2023

Abstract

:
Soil cadmium (Cd) contamination affects human health, and the application of phosphorus (P) fertilizer can inhibit the toxic effects of Cd; however, the effects of different P fertilizers on Cd accumulation in calcareous soils are unknown. To address this point, this paper used a pot experiment with four P fertilizer types (monoammonium phosphate (MAP), superphosphate (SSP), diammonium phosphate (DAP), and dicalcium phosphate (DCP)) and four P fertilizer levels (0, 0.15, 0.25, and 0.35 g kg−1, P per kg of soil). The effects of P application on the biomass of eggplant, Cd content, bioconcentration factors, translocation factor, yield quality, and soil Cd morphology changes in a Cd-contaminated environment were explored. Applying 0.35 g kg−1 of DCP significantly increased eggplant biomass while reducing Cd accumulation, concentration, and transport within eggplants under Cd contamination. The P fertilizer changed the distribution of soil Cd morphology. A redundancy analysis identified Cd content in the residual and Fe/Mn oxides-bound states as the primary factors influencing Cd levels in plants. In summary, the application of 0.35 g kg−1 DCP proved most efficient in mitigating Cd accumulation in eggplants under Cd-induced stress conditions.

1. Introduction

Heavy metals exhibit high toxicity, persistence, and irreversibility [1]. According to the 2014 China Soil Pollution Survey, they typically constitute the primary harmful elements in soil, with cadmium (Cd) accounting for 7.0% of the main pollutants [2]. As a toxic heavy metal, Cd has a strong migratory capacity in the soil environment and is easily absorbed by plant roots and transported to aboveground parts, leading to plant growth restrictions; once it enters the human body through the food chain, it poses a serious threat to human health [3]. In recent years, inappropriate social production activities, including mining and the indiscriminate use of chemical fertilizers and pesticides containing toxic heavy metals, have aggravated the issue of soil Cd pollution. This has resulted in widespread Cd contamination in cropland [4]. Extensive research has been conducted to develop an effective remediation strategy for reducing soil Cd toxicity [5,6]. Nevertheless, most studies have focused on acidic soils or hydroponic experiments [7,8], with limited attention given to calcareous soils, although Cd contamination can occur in certain calcareous soils [9,10]. Calcareous soil, which constitutes over 30% of the earth’s surface, is prevalent in arid or semi-arid regions [11], and exhibits the characteristics of slightly alkaline soil, including elevated pH levels and calcium carbonate content, in contrast to acidic soil. Notably, Cd in calcareous soil has a low solubility, facilitating its absorption by plants [12]. Consequently, there is a pressing need to investigate Cd-contaminated calcareous soils.
Cd can interact directly with P and be adsorbed directly by P, or indirectly through PO43−, etc. It can also indirectly affect Cd effectiveness by improving soil properties [13,14,15]. Dissociated cations from phosphate fertilizers compete with Cd for soil adsorption sites, and some anions can also compete with Cd, affecting the Cd content in the active state [16]. Nevertheless, there are inconsistent findings as to whether P inhibits Cd uptake in crops. Research has demonstrated that the application of monoammonium phosphate (MAP) substantially enhances wheat growth and yield, while simultaneously reducing Cd accumulation in both straw and grain [17]. Superphosphate (SSP) decreases Cd mobility in alkaline soil and mitigates Cd accumulation in lettuce [18]. Conversely, the application of sodium hydrogen phosphate has been demonstrated to elevate the Cd content in rice roots, from 72.13 to 112.78 mg kg−1, thus fostering Cd accumulation in rice plants [19]. The application of SSP enhances Cd accumulation in acidic soil and elevates the Cd concentration in wheat [20]. The relationship between P and Cd is intricate, with various types of P fertilizers exerting different effects, due to their distinct compositions and properties. Moreover, differing P fertilizer concentrations influence Cd uptake and accumulation in crops, with varying Cd impacts.
Previous research has primarily examined the impact of individual P fertilizers on Cd uptake, translocation, and accumulation in plants. Few studies have comparatively investigated the influence of multiple P fertilizers on soil plant interactions regarding Cd. Consequently, we selected four distinct types and levels of P fertilizers to investigate their potential in mitigating Cd contamination. Eggplant is a lycopene-rich vegetable widely cultivated in China, with a palatable taste, that promotes human health. However, eggplant is susceptible to Cd accumulation, and there is limited research on Cd accumulation in eggplant crops. Therefore, this study assessed the effects of different P fertilizers on soil eggplant Cd contamination, using eggplant as a focal species and to identify P fertilizers that are effective in mitigating or reducing Cd bioavailability. This study tests the following hypotheses: (1) the application of P fertilizer has the potential to enhance eggplant biomass and yield in calcareous soils contaminated with Cd; (2) the application of P fertilizers can reduce Cd levels in eggplants cultivated in contaminated environments, and this effect is enhanced with higher fertilizer application rates; and (3) P fertilizers can alter the distribution of Cd morphology in calcareous soils.

2. Materials and Methods

2.1. Modeling of Cd Contamination Soil

The test soil, found in the cultivated layer of Beizhang Village, Taigu District, Jinzhong City, Shanxi Province (37°25′ N, 112°33′ E), was calcareous brown loam with a loess substrate. Tilled soil layers, of 0–20 cm depth, were collected using an in situ soil auger, plant fragments were removed, and air-dried samples were passed through a 2 mm sieve and set aside. Pure CdCl2 2.5 H2O was used as a Cd source to simulate Cd-contaminated soil by adding a solution with a Cd content of 5 mg kg−1 (this level of Cd was chosen based on previous research, which demonstrated a significant decrease in plant fertility indexes and inhibited plant growth at this Cd concentration [21]), alternating wet and dry conditions three times, equilibrating at room temperature for 2 months and air-drying again, passing through a 20-mesh sieve, and setting aside [22]. The soil had the following physical and chemical properties: pH 8.05, organic matter 17.68 g kg−1, total nitrogen (N) 0.76 g kg−1, total P 0.82 g kg−1, alkali-hydrolyzable N 75.57 mg kg−1, available P 13.24 mg kg−1, available potassium (K) 145.37 mg kg−1, and total Cd 0.21 mg kg−1.

2.2. Experimental Design

There were four types of P fertilizers in the experiment: monoammonium phosphate (MAP), superphosphate (SSP), diammonium phosphate (DAP), and dicalcium phosphate (DCP), as well as four levels of P application of 0, 0.15, 0.25, and 0.35 g kg−1 (in terms of the P content per kg of soil), which were denoted by P0, P1, P2, and P3, respectively. To eliminate potential sources of interference, analytically pure reagents were exclusively used for the P fertilizers in the experiment. All were purchased from Tianjin Komeo Chemical Reagent Co. (Tianjin, China). The experiment followed a two-factor completely randomized design. Each plastic pot, 32 cm in diameter and 30 cm in depth, held 10.0 kg of pre-equilibrated Cd-contaminated soil, enriched with varying types and levels of P fertilizers. This resulted in 13 treatments, each replicated three times, totaling 39 pots. To ensure an adequate supply of major elements other than P, N and K fertilizers were applied to each treatment, with N fertilizer supplemented with urea to 0.2 g kg−1 and K fertilizer supplemented with K2O to 0.15 g kg−1. The soil was well mixed in each plastic pot, and water was added until the soil moisture content was 20%, before the pots were balanced for 15 d at the experimental base of Shanxi Agricultural University [23] (Table 1).
After sufficiently watering and leaving for 1 d, on 25 June 2022, the planting of eggplant seedlings was carried out. The eggplants were grown from Thistle Nong Ermin eggplant seeds purchased in local markets. Seedlings with 2–3 leaves were grown, using the conventional method of seed soaking and germination. In each of the 13 treatments in a total of 39 pots, two eggplants seedlings were planted, and watering was carried out at regular intervals daily to maintain the moisture content of the soil at about 70% of the field capacity, and the plants were provided with good protection against relevant pests and diseases. Sixty-five days after planting the eggplant seedlings, soil samples were collected at the maturity stage and samples of various parts of the plants were taken, and the relevant indexes measured.

2.3. Measurement Methods

The harvested plant samples were rinsed three times with 1.0% dilute acid (HCl) and then dried at 80 °C for 72 h. The biomass of each part was determined.
The Cd content was analyzed following Zhang’s method using acid digestion (3:1 HNO3:H2O2) and a graphite furnace atomic absorption spectrometer (ZEEnit 650, Analytik Jena, Germany) [24].
Soluble sugars in eggplant were determined using anthrone–sulfuric acid colorimetry [25], soluble proteins were analyzed using Coomassie brilliant blue G-250 [26], and vitamin C was determined using a titrimetric method [27].
The chemical morphology of the soil was determined with the five-step sequential method designed by Li, using Tessier [28]. The Cd content in the exchange state (Cd–E) was the supernatant obtained from the soil sample extracted with 20 mL of 0.1 M acetic acid solution for 16 h (pH 5.0); the Cd content in the carbonate-bound state (Cd–C) was the supernatant obtained from the soil sample extracted with 20 mL of 0.5 M NH2OH–HCl solution for 16 h (pH 1.5). The Cd content in the Fe/Mn oxides-bound state (Cd–Fe/Mn) was the supernatant obtained after shaking with 20 mL of 8.8 M H2O2 for 16 h; Cd content in the organically bound state (Cd–O) was the supernatant obtained after shaking with 20 mL of 1.0 M NH4OAc for 16 h; and Cd content in the residual state (Cd–R) was the residue in the remaining supernatant. The Cd concentrations in both the supernatant and residual states were determined using a ZEEnit 650 graphite furnace atomic absorption spectrometer.

2.4. Calculations and Statistical Analysis

Pearson analysis was used to investigate the correlations between Cd content in each part of the eggplant and soil Cd morphology distribution. Under different P fertilizer treatments, redundancy analysis (RDA) was performed using a redundancy matrix with soil Cd morphology distribution as the explanatory variable and Cd content in each part of the eggplant as the response variable. Data were processed using Excel 2010, SPSS 23 for one-way analysis of variance (ANOVA) (Duncan, p < 0.05), and Origin 2022 software for plotting. Bioconcentration factors (BCF) and the translocation factor (TF) were calculated [29]:
BCF = Metal plant   tissues Metal soil
where Metal plant tissues represents Cd concentrations in roots, stems, and leaves and Metal soil is Cd in soil (both in mg kg−1),
TF aerial root = Metal aerial Metal roots
where Metal aerial represents the Cd concentration in stems and leaves and Metal roots is Cd in roots (both in mg kg−1).

3. Results

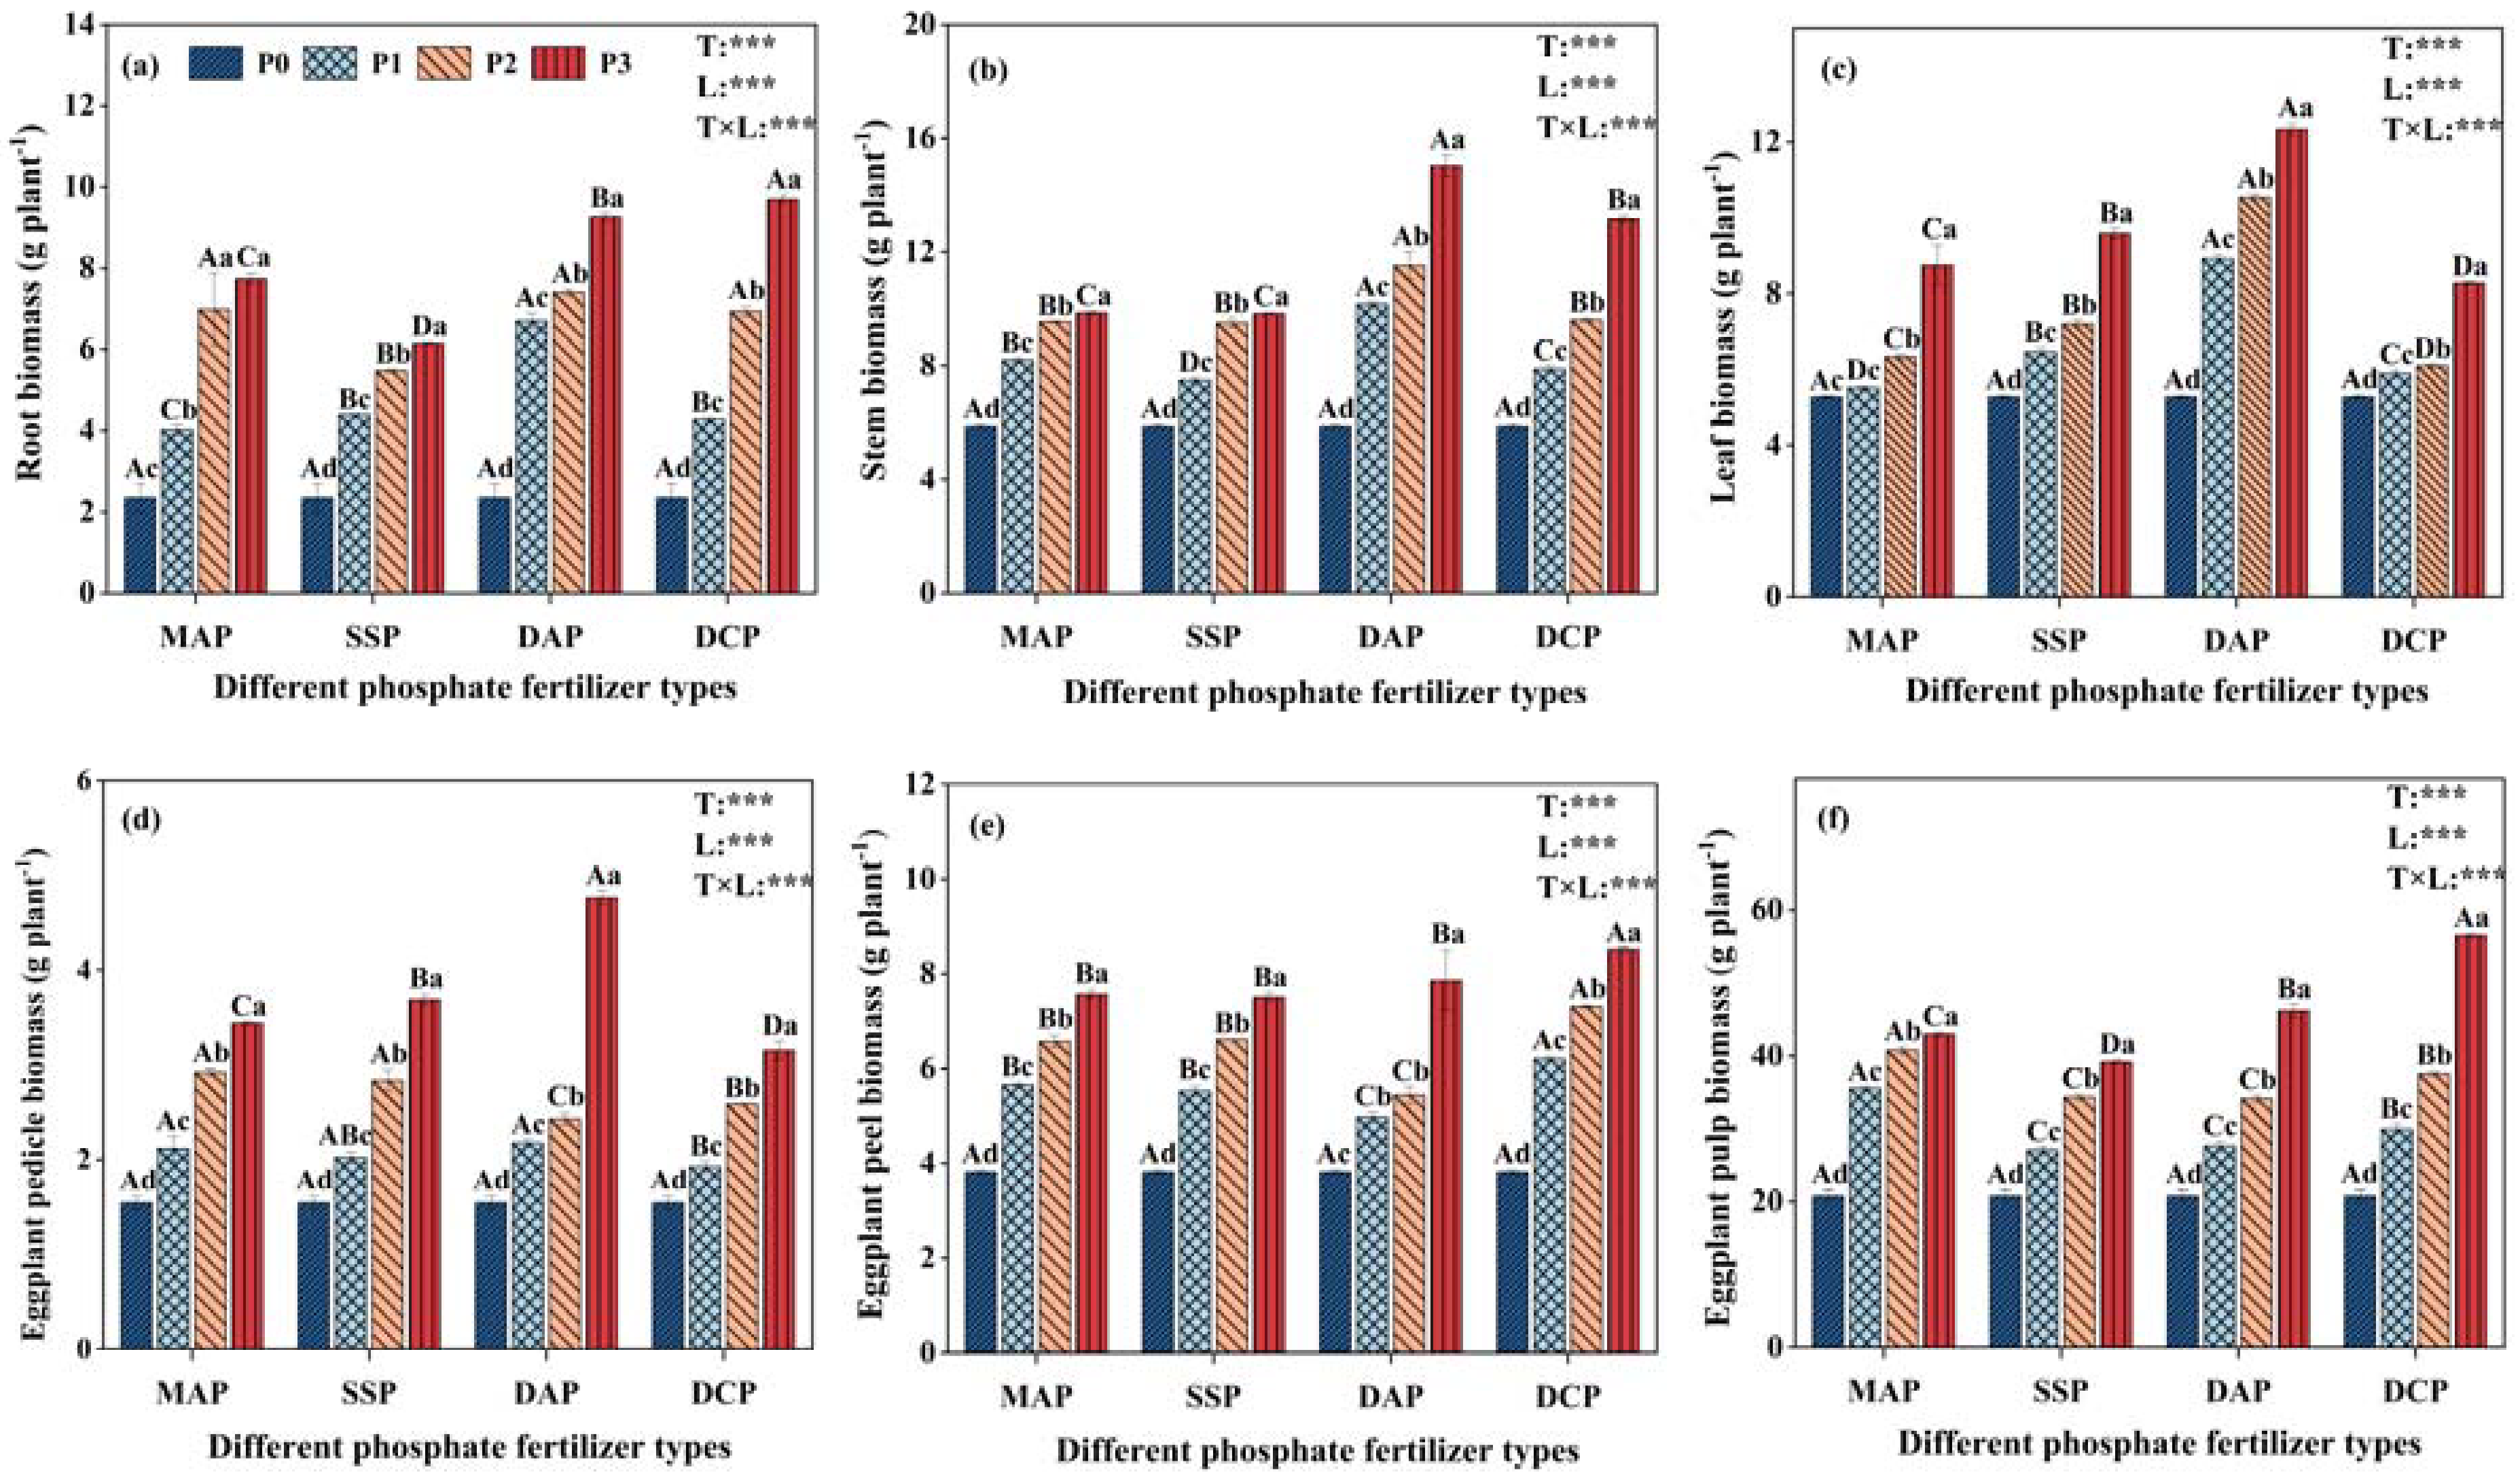
3.1. Eggplant Biomass

A two-way ANOVA revealed highly significant (p < 0.001) effects of P fertilizer type, P fertilizer level, and their interaction on eggplant biomass under Cd stress (Figure 1). In the presence of Cd contamination, various types and levels of P fertilizers exhibited a consistent trend of increasing the biomasses of all parts of eggplant. Furthermore, as the level of P application increased, the biomass of all eggplant parts gradually rose, reaching a peak at level P3. The application of DCP notably increased the biomass of eggplant roots, peel, and pulp, with significant increases of 314.2%, 23.2%, and 171.5%, respectively, for P3 compared to P0. Conversely, DAP application led to the most substantial increases in stem, leaf, and pedicel biomass, with significant increases of 156.0%, 133.7%, and 207.3%, respectively, for P3 compared to P0.

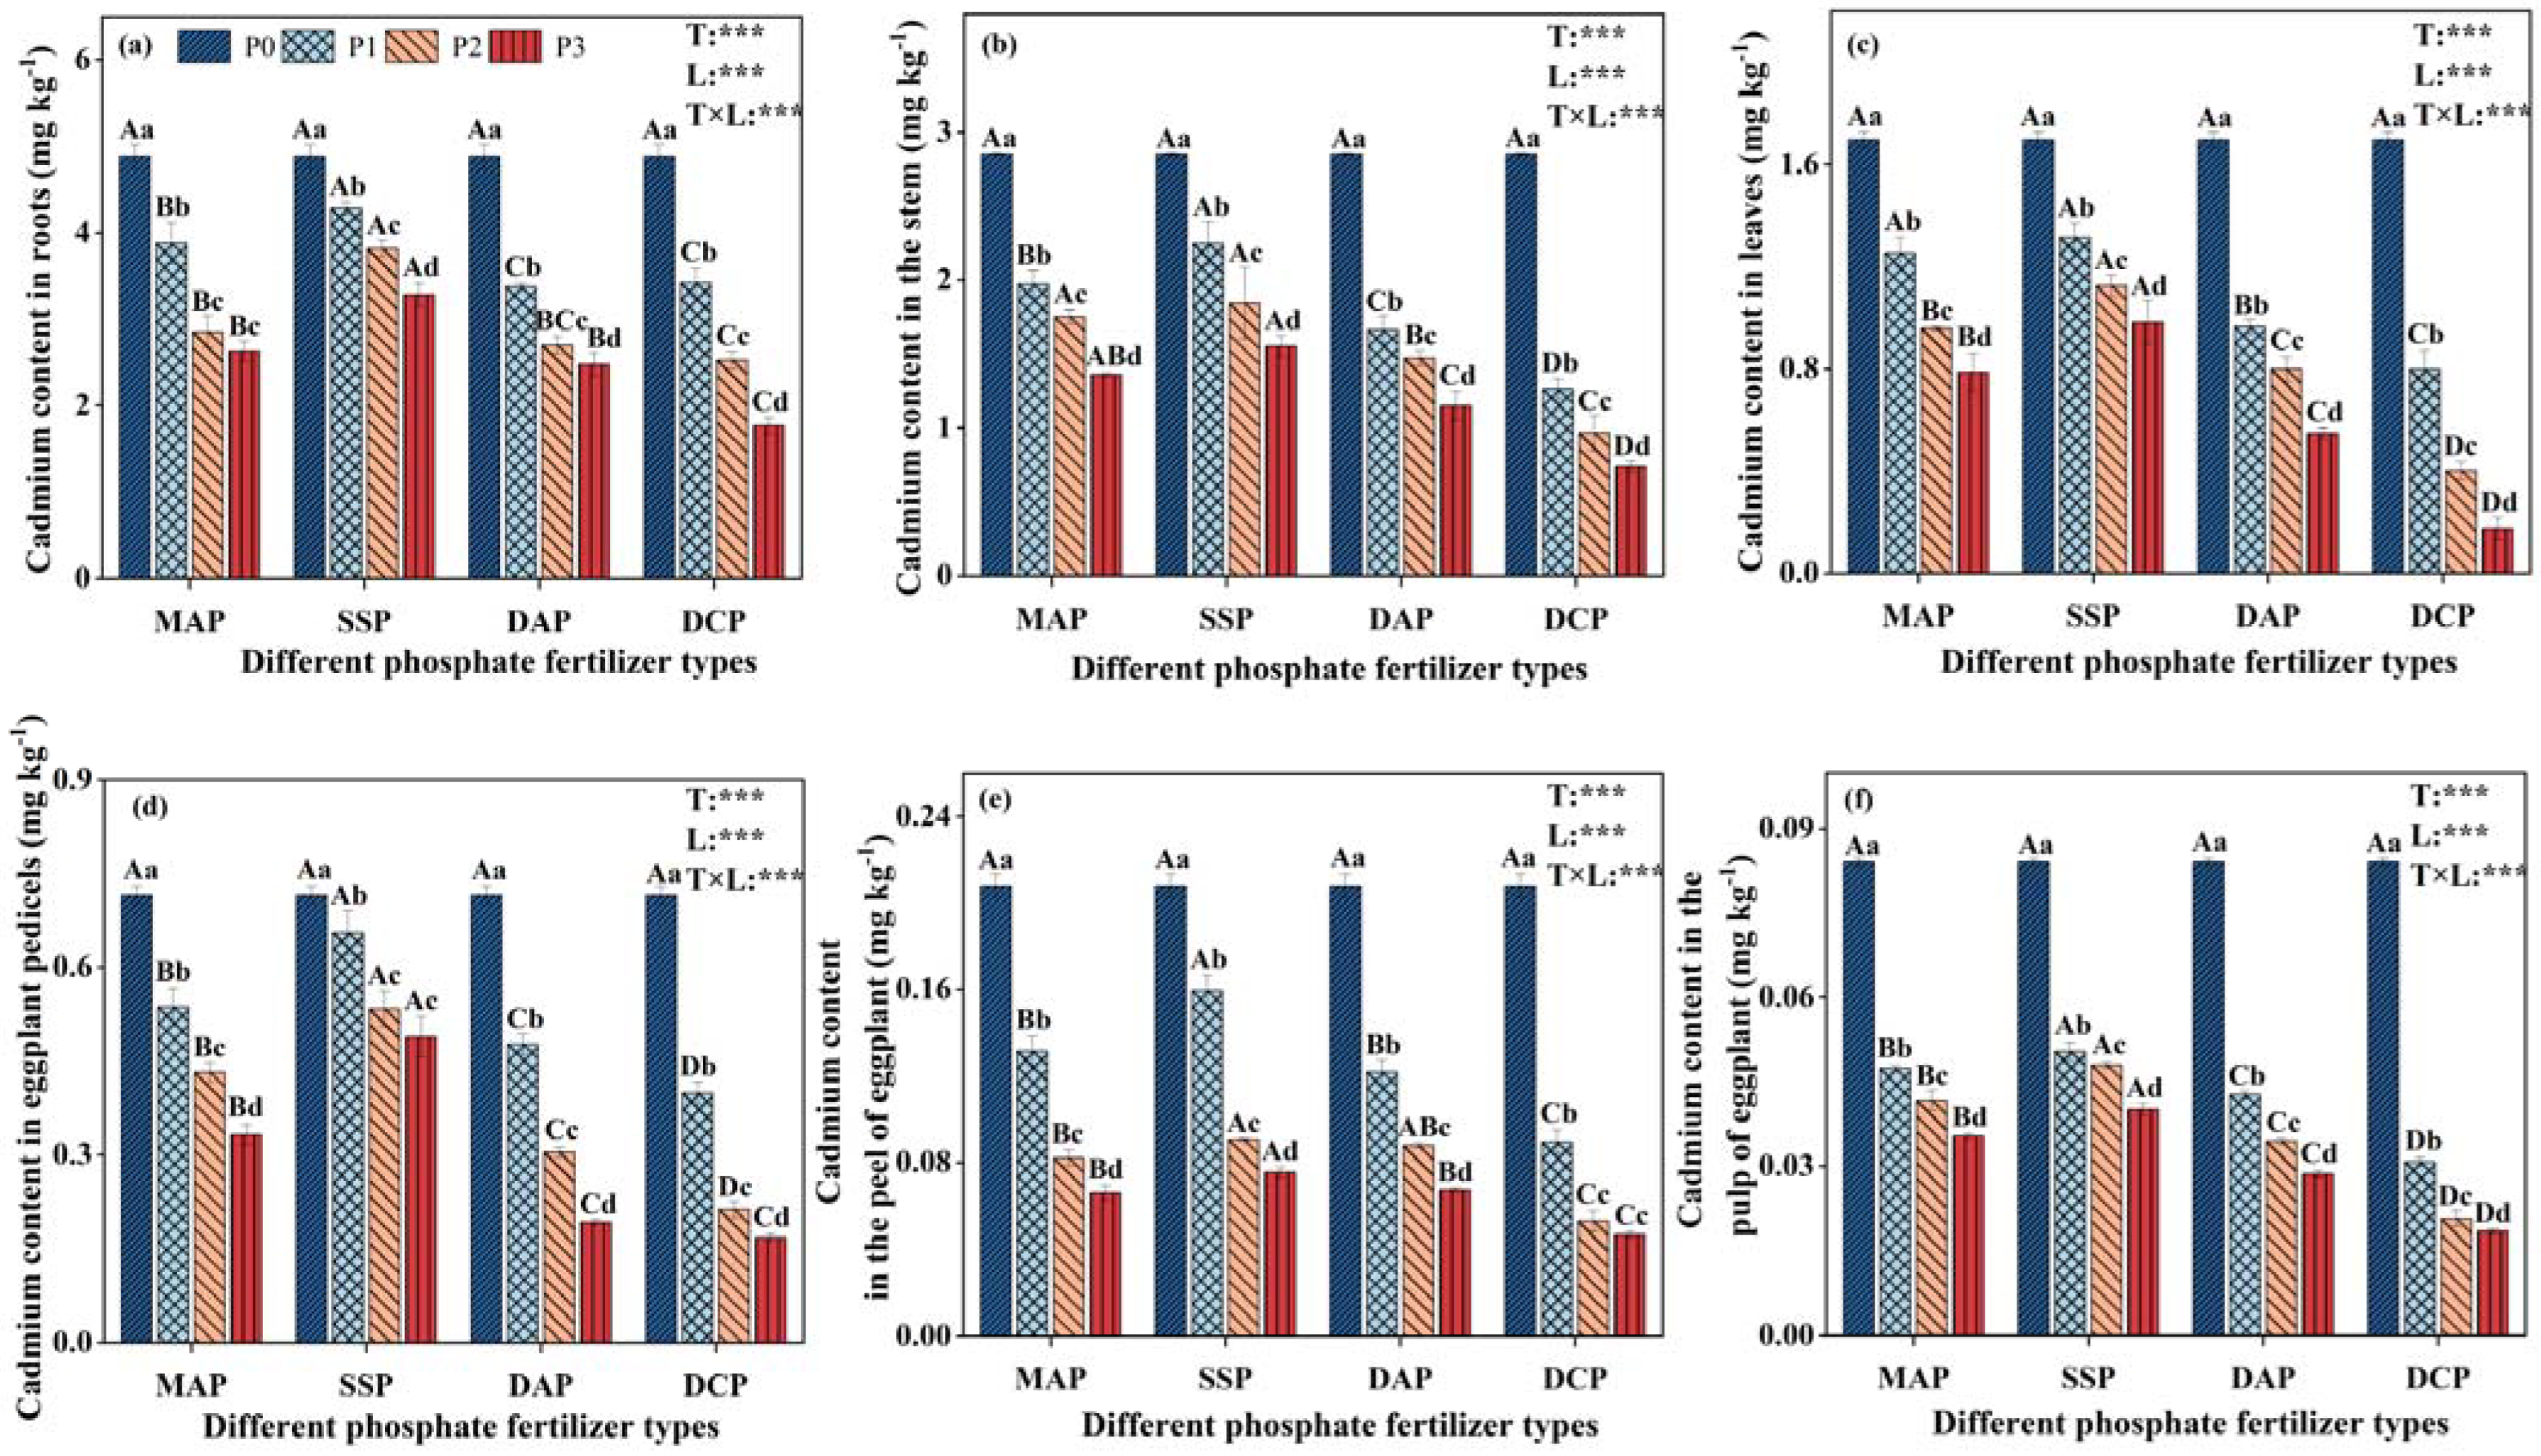
3.2. Cd Content in Eggplant

The two-way ANOVA demonstrated significant effects (p < 0.001) of P fertilizer type, P fertilizer level, and their interaction on Cd content in all eggplant parts under Cd stress (Figure 2). Under Cd contamination (P0), Cd contents in eggplant roots, stems, leaves, pedicels, peel, and pulp were high. Applying various P fertilizers reduced Cd content in all plant parts, in the following order: roots > stems > leaves > pedicels > peel > pulp. In the same P fertilizer type, with the gradual increase in P fertilizer level, the Cd content in all plant parts gradually decreased, and the Cd content reached a minimum at the P3 level. At the same P fertilizer level, the reduction in Cd content across all plant parts for different P fertilizer types followed this order: DCP > DAP > MAP > SSP. At the P3 level, DCP application reduced Cd content in eggplant roots, stems, leaves, pedicels, peel, and pulp by 46.2%, 52.5%, 82.2%, 65.6%, 38.0%, and 53.9%, respectively, compared to SSP. The P fertilizer gradually reduced the distribution of Cd content in plants, especially in pulp, which were all below the limits (<0.05 mg kg−1) set by the Chinese National Food Safety Standard GB 2762-2022 (China) [30].

3.3. BCFs and TFs

A two-way ANOVA revealed significant effects of P fertilizer type, P fertilizer level, and their interaction on the BCFs and TFs in different parts of the eggplant under Cd stress (p < 0.001). Higher BCFs were observed for roots, stems, leaves, and pulp for a Cd-contaminated environment (P0), especially for roots (Table 2). At a consistent P fertilizer level, the various P fertilizers led to a reduction in BCFs for roots, stems, leaves, and pulp, with the order being DCP > DAP > MAP > SSP. Specifically, the use of DCP resulted in the lowest BCFs, while the use of SSP yielded the highest BCFs. Under Cd contamination, the gradual increase in P application level for the same type of P application decreased the BCFs and weakened the concentration ability, and the effect was most obvious under DCP. Application of DCP reduced BCF roots, BCF stems, BCF leaves, and BCF pulp by 41.2%, 57.9%, 83.2%, and 64.3%, respectively, for P3 compared with P0. In a Cd-contaminated environment, the order was TF stem/root > TF leaf/root > TF pulp/root, indicating that the transport of Cd content from roots to aboveground parts mainly accumulated in the stem (Table 3). Various P fertilizer levels exhibited a general pattern of initially increasing and subsequently decreasing the TF in each part of the eggplant. Notably, DCP application resulted in the most significant reductions in TF stem/root, TF leaf/root, and TF pulp/root.

3.4. Eggplant Yield and Quality

A two-way ANOVA revealed significant effects of P fertilizer type and level on eggplant fruit yield, soluble protein, and vitamin C under Cd stress (p < 0.001). However, the interaction between P fertilizer type and level did not significantly affect soluble sugars (Figure 3). Eggplant fruit yield was initially low in a Cd-contaminated environment (P0) but showed significant increases with the application of various types and levels of P fertilizers. Specifically, at the P3 level, the yield increased significantly by 111.9%, 76.5%, 114.2%, and 152.2% for MAP, SSP, DAP, and DCP, respectively, compared to P0, with the highest yield occurring with DCP application (Figure 3a). The application of P fertilizer improved the fruit quality, compared to P0. The soluble sugar, soluble protein, and vitamin C contents showed the order of DCP > DAP > SSP > MAP for the different P fertilizer types. The DCP showed the greatest enhancement of quality indexes of eggplant at the P3 level, with vitamin C content reaching 6.59 mg 100 g−1.

3.5. Soil Cd Morphology Distribution

The effect of various P fertilizers on soil Cd morphology under Cd stress are shown in Figure 4 and Table 4. The five Cd morphologies in a Cd-contaminated environment (P0) showed the order of Cd– > Cd–C > Cd–Fe/Mn > Cd–O > Cd–R. Moreover, Cd–E, Cd–C, and Cd–Fe/Mn accounted for 86.99% of soil Cd morphology. For the Cd-contaminated environment, increasing levels of applied P fertilizers showed a decreasing trend in Cd–E and Cd–C for the four different P fertilizers, and an increasing trend in Cd–Fe/Mn, Cd–O, and Cd–R, which was most obvious for DCP. In comparison to P0, DCP at the P3 level led to a decrease of 76.1% in Cd–E and 74.8% in Cd–C, while Cd–Fe/Mn, Cd–O, and Cd–R increased by 34.3%, 109.7%, and 123.6%, respectively.
The application of different P fertilizers altered the soil Cd morphology distribution in Cd-contaminated environments (Table 4). At the P0 level, the distribution of soil Cd morphology followed the order of Cd–E > Cd–C > Cd–Fe/Mn > Cd–O > Cd–R. At the P1 level, MAP, SSP, and DAP exhibited the following Cd distribution pattern: Cd–E > Cd–Fe/Mn > Cd–C > Cd–O > Cd–R. In contrast, DCP resulted in an increase in Cd–Fe/Mn that surpassed Cd–E. At the P2 and P3 levels, there was a shift in the distribution ratio of soil Cd morphology. The MAP, SSP, and DAP at the P2 level exhibited Cd–Fe/Mn > Cd–E > Cd–C > Cd–O > Cd–R, whereas in the case of DCP, Cd–O increased and surpassed Cd–C. For the P3 level, the soil Cd morphology in MAP and SSP was in the order of Cd–Fe/Mn > Cd–O ≥ Cd–E > Cd–C > Cd–R, whereas in DAP, it was Cd–Fe/Mn > Cd–O ≥ Cd–E > Cd–R > Cd–C. For DCP, the order was Cd–Fe/Mn > Cd–O ≥ Cd–R > Cd–E > Cd–C.

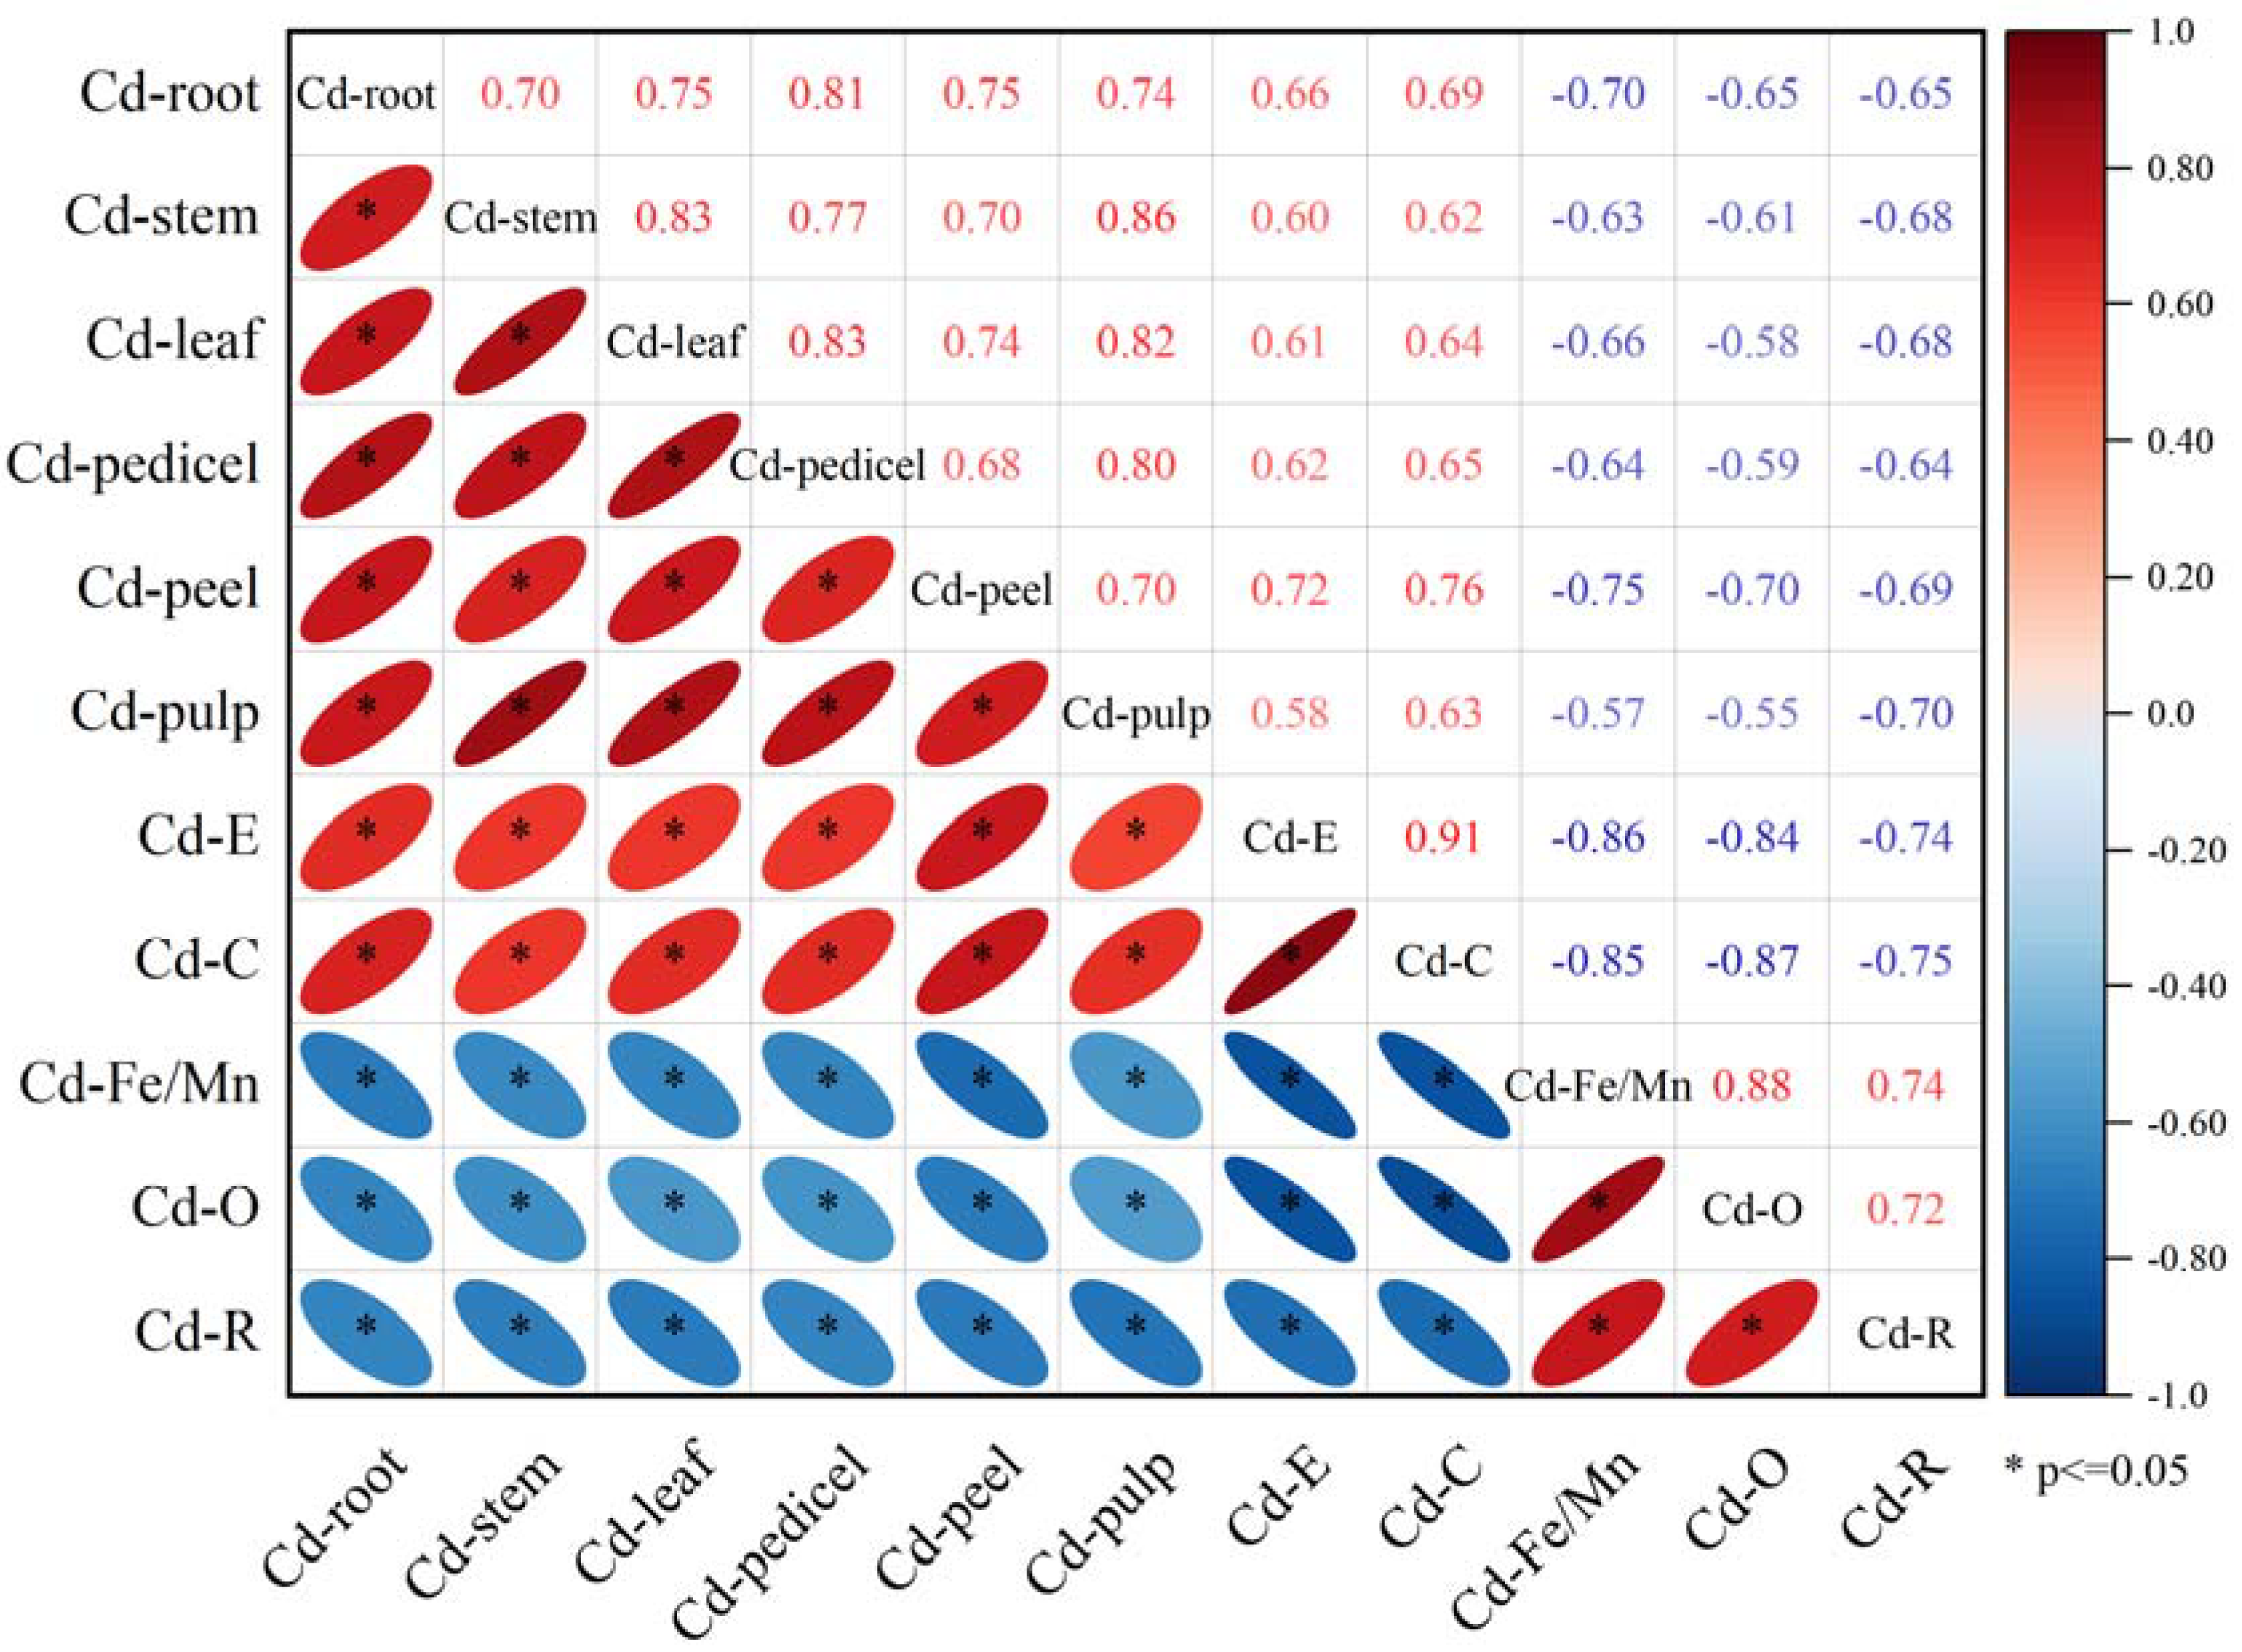
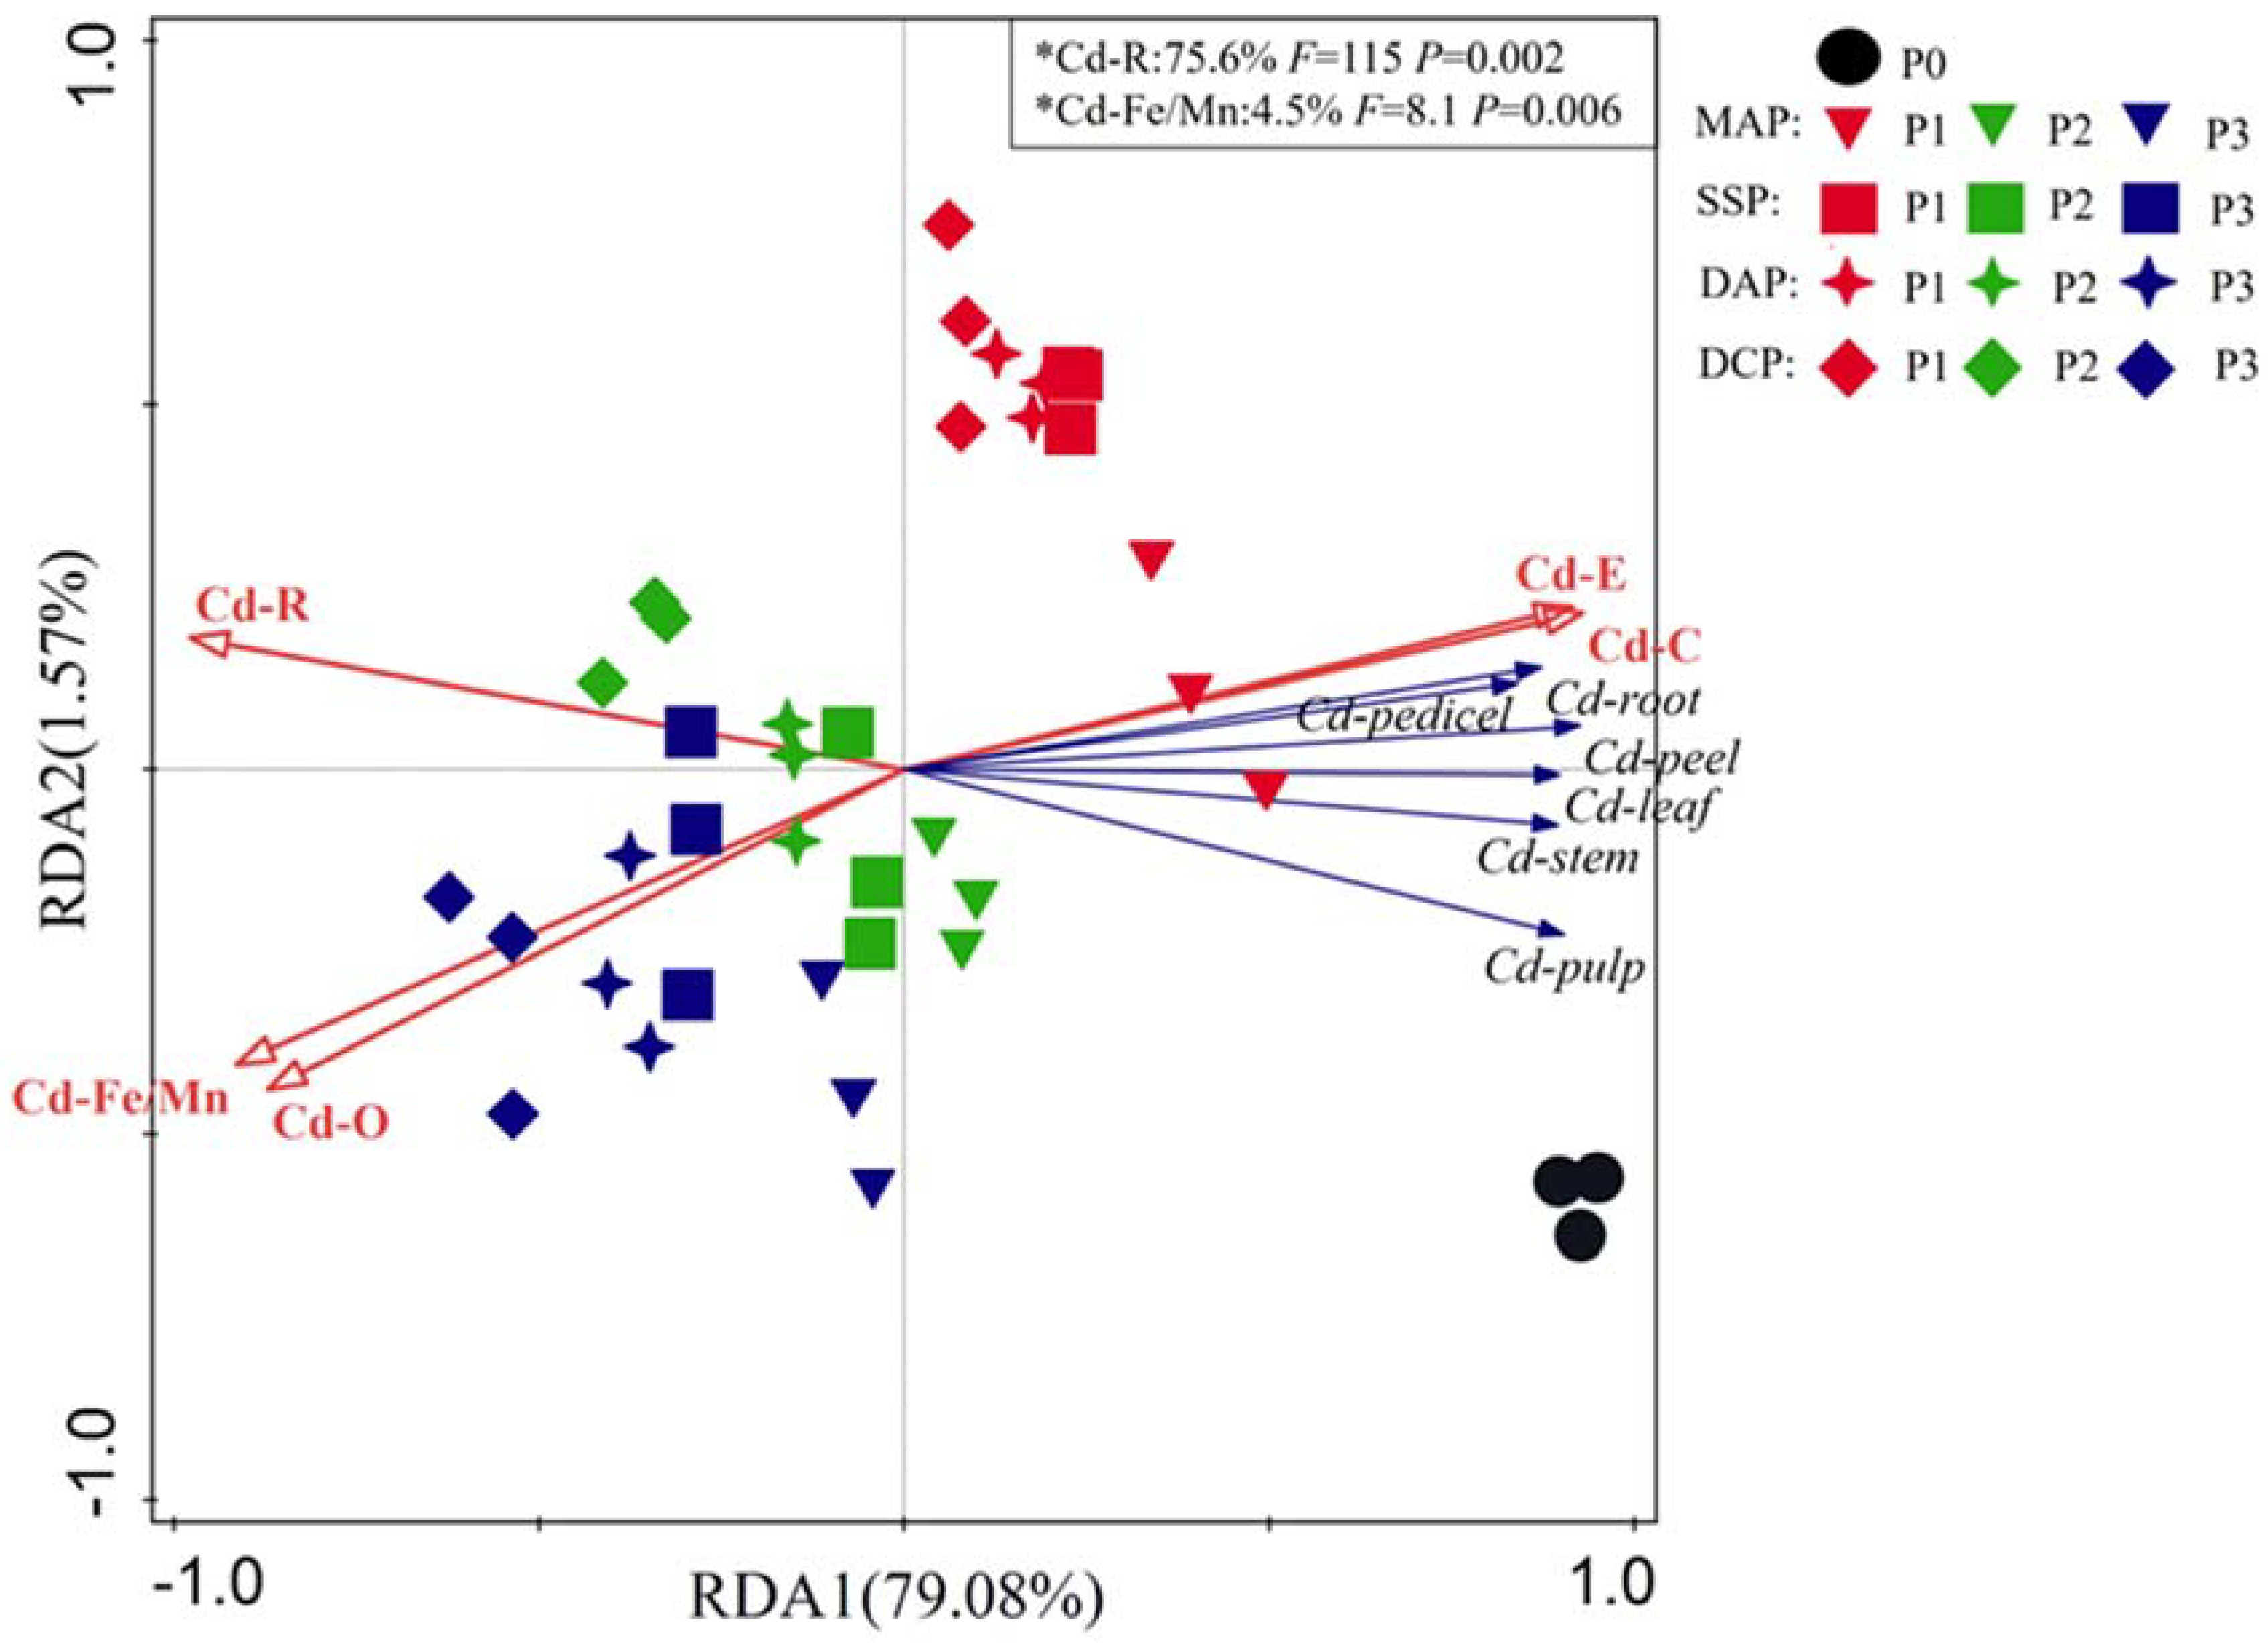
3.6. Correlation Analysis between Soil Cd Morphology and Eggplant Parts

The correlations between soil Cd morphology and Cd content in various parts of the eggplant are illustrated in Figure 5. There were significant correlations (p ≤ 0.05) between soil Cd morphology and Cd content in all parts of the eggplant. Specifically, Cd–E and Cd–C showed positive correlations with Cd content for all parts of the eggplant, while Cd–Fe/Mn, Cd–O, and Cd–R exhibited significant negative correlations with Cd content in these parts.
The factors affecting Cd content in eggplant were further explored using RDA (Figure 6), in which the first and second axes accounted for 79.08% and 1.57% of the total variation, respectively. In addition, significant differences in Cd content and soil Cd morphology were observed among different plant parts between the P1 and the P2 and P3 levels. Importantly, Cd–R and Cd–Fe/Mn had significant effects on Cd content of each plant part (p < 0.05).

4. Discussion

In this experiment, four different types of P fertilizers and four levels of P application were employed to assess their impact on Cd accumulation and soil Cd morphology in eggplants growing in a Cd-contaminated environment. Both the type and level of P fertilizer had significant (p < 0.005) effects on eggplant biomass, Cd content, BCFs, TFs, yield quality, and soil Cd morphology. The positive effects of different P fertilizers on eggplant were more pronounced at higher levels of P application and the most pronounced effect was for 0.35 g kg−1 P fertilizer. Among the various P fertilizer types, DAP and DCP application had the most pronounced impact on enhancing biomass in all plant parts, while SSP and MAP had a lesser effect (Figure 1). P plays a crucial role in multiple metabolic processes and promotes the growth of plant biomass [31]. Liu et al. [32] reported that the combination of biochar and a high concentration of phosphate fertilizer not only increased pasture biomass but also reduced Cd concentration, ensuring pasture safety standards. In another study by Ma et al. [33], DAP application increased rice spike length by 59%. P fertilizer increases the biomass of all parts of the eggplant and reduces the bioavailability of Cd in the soil, resulting in a lower Cd concentration per unit of biomass of the eggplant and lower Cd content in all plant parts. In this experiment, the Cd content in all parts of eggplant was most reduced by DCP application and least effectively reduced by SSP (Figure 2). The application of different types of P fertilizers resulted in Cd levels in the pulp that were below the food safety standard limits. The BCFs and TFs signify a plant’s capacity to absorb and accumulate heavy metals. Following P fertilizer application, the BCF decreased, while the TF exhibited an initial increase followed by a decrease. The application of DCP significantly reduced the bioconcentration and transport capacity of eggplant for Cd (p < 0.005), and Cd uptake and accumulation in all plant parts were reduced (Table 2 and Table 3). As observed by Chtouki et al., P nutrition minimizes Cd uptake and translocation in plant tissues [34,35,36]. Soluble sugars, proteins, and vitamin C are vital nutrients for eggplants, and essential for regulating plant metabolism, growth, and development [37]. P fertilizer can enhance protein synthesis, cell growth, and improve fruit quality indicators [38]. The levels of soluble sugars, proteins, and vitamin C in eggplant significantly increased with P application (Figure 3). Tian et al. demonstrated that applying 52.4 kg of P resulted in the highest oil and protein yields in oilseed rape seeds [39]. The P fertilizer alleviated Cd-induced stress and enhanced eggplant yield quality, with DCP application having the greatest significant effect on fruit quality.
In this study, various P fertilizers were applied. The phosphate ions (PO43−) in these fertilizers raise the soil’s negative charge, improving Cd adsorption to the soil, and forming Cd3(PO4)2 precipitates with Cd2+ [40]. This reduces Cd toxicity in the soil, diminishes Cd accumulation in plants, and enhances plant growth [8,41]. During the transport of Cd2+ from the soil to aboveground through plant roots, insoluble phosphate precipitates develop in root cell walls and vesicles. These precipitates impede Cd transport to protoplasts and xylem, further restricting Cd movement and concentration within plant tissues [42,43]. Both MAP and DAP containing NH4+, H2PO42−, and PO43− form Cd(NH4)2PO4 and CdNH4PO4 precipitates in the presence of Cd2+ in the soil for a long period, which reduces Cd content in eggplant [44]. However, the soil in this study was alkaline and contained large amounts of metal cations such as Mn2+, Mg2+, and Na+. These ions can bind to NH4+ and reduce the Cd2+ adsorption sites occupied by active ions in MAP and DAP. This weakens the beneficial effects on Cd contamination of MAP and DAP applied in this study. The aqueous solution of SSP is inherently acidic; however, upon application, it undergoes a neutralization reaction with the calcareous soil in this study, which diminishes its effectiveness in Cd limitation. Consequently, the role of SSP in this study was not prominent. In contrast, DCP is an alkaline phosphate fertilizer that shows an enhanced performance when used in calcareous soils. Research has demonstrated a significant negative correlation between pH and the efficacy of Cd. Higher soil pH levels result in reduced Cd effectiveness and diminished Cd toxicity [45,46]. In calcareous soil with pH 8.05, DCP led to reduced Cd effectiveness, decreased Cd toxicity, increased biomass, and lowered Cd content. The impact of applying DCP was particularly pronounced in this study. He et al. elevated soil pH with lime application, which alleviated soil acidification and reduced problems associated with Cd contamination [47], consistent with our findings.
Soil heavy metal forms are frequently employed to evaluate the mobility and bioavailability of these elements. Among the various forms of soil Cd, Cd–E exhibits the highest bioactivity and toxicity. The application of P fertilizer in this study decreased the toxicity of Cd–E. The Cd–C, Cd–Fe/Mn, and Cd–O represent potentially bioavailable states, while Cd–R is a stable but bio-unavailable form in the environment. The decrease in Cd–C and the increase in Cd–Fe/Mn, Cd–O, and Cd–R in this study (Figure 4) suggest that P fertilizer application facilitated the conversion of soil Cd morphology from an active to an inactive state, rendering it a more stable, less toxic, and less readily available form for plant absorption. The toxic effect of Cd depends not only on its total content, but also on its specific morphology in the soil and its proportion [48]. The percentages of Cd–E and Cd–C decreased, while the proportion of Cd–R in the distribution of soil Cd morphology steadily rose, transitioning to an unavailable state (Table 4). Yao et al. showed that Cd–E and Cd–C in soil samples were significantly reduced by the application of slow-release phosphate fertilizer, and this reduction indicates enhanced stability of heavy metals [49]. Correlation analysis and RDA (Figure 5 and Figure 6) offered further evidence that the application of P fertilizer converted bioavailable Cd into a form that plants could not access, thereby reducing the toxic effects of Cd on plants [50]. In this study, among the various types and levels of P fertilizer, DCP induced the most substantial shift in soil Cd morphology toward inaccessible forms (p < 0.005).
In summary, this study showed that applying P fertilizer effectively reduced the harmful effects of Cd, with DCP demonstrating the highest efficacy in inhibiting Cd contamination in eggplants, compared to other P fertilizer types.

5. Conclusions

Applying various types and levels of P fertilizers increased eggplant biomass while decreasing Cd content in all parts of the eggplant, particularly in fruit pulp, to levels below the food safety standard limit (GB 2762-2022, China). Both the BCF and TF in eggplants decreased, enhancing the quality of eggplant fruit, and elevating the levels of soluble sugar, soluble starch, and vitamin C. The P fertilization decreased soil Cd–E and Cd–C and increased Cd–Fe/Mn, Cd–O, and Cd–R, which shifted soil Cd morphology to an unavailable state. The main factors affecting Cd content in all parts of the eggplant were Cd–R and Cd–Fe/Mn (p < 0.005).
Among the four P fertilizers, application of 0.35 g kg−1 DCP was the most effective in reducing Cd contamination, improving the quality of eggplant yield, inhibiting bioconcentration and translocation of Cd2+ to aboveground parts, and transforming soil Cd morphology to an inactive state. The findings of this study have significant implications for eggplant cultivation in Cd-contaminated calcareous soils and the judicious use of P fertilizers.

Author Contributions

Methodology and writing—original draft, Q.M.; methodology, project administration, writing—review and editing, funding acquisition, and supervision, W.F.; writing—review and editing, F.L. and G.W.; formal analysis, X.D. All authors have read and agreed to the published version of the manuscript.

Funding

This work was supported by the National Natural Science Foundation of China (NSFC) Joint Fund (U1710255–4) and Academic Recovery Research of Shanxi Agricultural University (2020xshf20).

Institutional Review Board Statement

Not applicable.

Informed Consent Statement

Not applicable.

Data Availability Statement

All data involved in this study are presented in the form of figures and tables in the manuscript.

Conflicts of Interest

The authors declare no conflict of interest.

References

  1. Hu, B.; Shao, S.; Ni, H.; Fu, Z.; Hu, L.; Zhou, Y.; Min, X.; She, S.; Chen, S.; Huang, M.; et al. Current status, spatial features, health risks, and potential driving factors of soil heavy metal pollution in China at province level. Environ. Pollut. 2020, 266, 114961. [Google Scholar] [CrossRef] [PubMed]
  2. Teng, Y.; Wu, J.; Lu, S.; Wang, Y.; Jiao, X.; Song, L. Soil and soil environmental quality monitoring in China: A review. Environ. Int. 2014, 69, 177–199. [Google Scholar] [CrossRef] [PubMed]
  3. Han, C.; Wang, M.; Ren, Y.; Zhang, L.; Ji, Y.; Zhu, W.; Song, Y.; He, J. Characterization of pruned tea branch biochar and the mechanisms underlying its adsorption for cadmium in aqueous solution. RSC Adv. 2021, 11, 26832–26843. [Google Scholar] [CrossRef] [PubMed]
  4. Song, Y.; Wang, J.-Q.; Chen, X.-J.; Yu, S.-Z.; Ban, R.-L.; Yang, X.; Zhang, X.; Han, Y. Study the effects of dry-wet cycles and cadmium pollution on the mechanical properties and microstructure of red clay. Environ. Pollut. 2022, 302, 119037. [Google Scholar] [CrossRef]
  5. Huang, K.; Sun, X.; Sun, J.; Guo, Y.; Hu, X.; Hu, C.; Tan, Q. The role of phosphorus speciation of biochar in reducing available Cd and phytoavailability in mining area soil: Effect and mechanism. Sci. Total Environ. 2023, 894, 164868. [Google Scholar] [CrossRef] [PubMed]
  6. Zhao, Y.; Zhang, C.; Wang, C.; Huang, Y.; Liu, Z. Increasing phosphate inhibits cadmium uptake in plants and promotes synthesis of amino acids in grains of rice. Environ. Pollut. 2020, 257, 113496. [Google Scholar] [CrossRef]
  7. Dai, M.; Lu, H.; Liu, W.; Jia, H.; Hong, H.; Liu, J.; Yan, C. Phosphorus mediation of cadmium stress in two mangrove seedlings Avicennia marina and Kandelia obovata differing in cadmium accumulation. Ecotoxicol. Environ. Saf. 2017, 139, 272–279. [Google Scholar] [CrossRef]
  8. Jia, H.; Hou, D.; O’Connor, D.; Pan, S.; Zhu, J.; Bolan, N.S.; Mulder, J. Exogenous phosphorus treatment facilitates chelation-mediated cadmium detoxification in perennial ryegrass (Lolium perenne L.). J. Hazard. Mater. 2020, 389, 121849. [Google Scholar] [CrossRef]
  9. Zhang, S.; Song, J.; Wu, L.; Chen, Z. Worldwide cadmium accumulation in soybean grains and feasibility of food production on contaminated calcareous soils. Environ. Pollut. 2021, 269, 116153. [Google Scholar] [CrossRef]
  10. Ma, S.; Nan, Z.; Hu, Y.; Chen, S.; Yang, X.; Su, J. Phosphorus supply level is more important than wheat variety in safe utilization of cadmium-contaminated calcareous soil. J. Hazard. Mater. 2022, 424, 127224. [Google Scholar] [CrossRef]
  11. Chevallier, T.; Cournac, L.; Hamdi, S.; Gallali, T.; Bernoux, M. Temperature dependence of CO2 emissions rates and isotopic signature from a calcareous soil. J. Arid Environ. 2016, 135, 132–139. [Google Scholar] [CrossRef]
  12. Ning, X.; Wang, S.; Long, S.; Dong, Y.; Li, L.; Nan, Z. Temporal distribution and accumulation pattern of cadmium and arsenic in the actual field calcareous soil-maize system, northwest China. Sci. Total Environ. 2023, 870, 162012. [Google Scholar] [CrossRef] [PubMed]
  13. Gao, R.; Hu, H.; Fu, Q.; Li, Z.; Xing, Z.; Ali, U.; Zhu, J.; Liu, Y. Remediation of Pb, Cd, and Cu contaminated soil by co-pyrolysis biochar derived from rape straw and orthophosphate: Speciation transformation, risk evaluation and mechanism inquiry. Sci. Total Environ. 2020, 730, 139119. [Google Scholar] [CrossRef]
  14. Zhang, H.; Ke, S.; Xia, M.; Bi, X.; Shao, J.; Zhang, S.; Chen, H. Effects of phosphorous precursors and speciation on reducing bioavailability of heavy metal in paddy soil by engineered biochars. Environ. Pollut. 2021, 285, 117459. [Google Scholar] [CrossRef]
  15. Niño-Savala, A.G.; Zhuang, Z.; Ma, X.; Fangmeier, A.; Li, H.; Tang, A.; Liu, X. Cadmium pollution from phosphate fertilizers in arable soils and crops: An overview. Front. Agric. Sci. Eng. 2019, 6, 419–430. [Google Scholar] [CrossRef]
  16. Hamid, Y.; Tang, L.; Sohail, M.I.; Cao, X.; Hussain, B.; Aziz, M.Z.; Usman, M.; He, Z.-L.; Yang, X. An explanation of soil amendments to reduce cadmium phytoavailability and transfer to food chain. Sci. Total Environ. 2019, 660, 80–96. [Google Scholar] [CrossRef] [PubMed]
  17. Qayyum, M.F.; Rehman, M.Z.U.; Ali, S.; Rizwan, M.; Naeem, A.; Maqsood, M.A.; Khalid, H.; Rinklebe, J.; Ok, Y.S. Residual effects of monoammonium phosphate, gypsum and elemental sulfur on cadmium phytoavailability and translocation from soil to wheat in an effluent irrigated field. Chemosphere 2017, 174, 515–523. [Google Scholar] [CrossRef] [PubMed]
  18. Azzi, V.; Kanso, A.; Kazpard, V.; Kobeissi, A.; Lartiges, B.; El Samrani, A. Lactuca sativa growth in compacted and non-compacted semi-arid alkaline soil under phosphate fertilizer treatment and cadmium contamination. Soil Tillage Res. 2017, 165, 1–10. [Google Scholar] [CrossRef]
  19. Jiaofeng, G.; Yang, H.; Peng, Z.; Bohan, L.; Hang, Z. Increasing phosphorus inhibits the retention and prevention of cadmium by iron plaque and promotes cadmium accumulation in rice plants. Chemosphere 2022, 307, 135642. [Google Scholar] [CrossRef]
  20. Wiggenhauser, M.; Bigalke, M.; Imseng, M.; Keller, A.; Rehkämper, M.; Wilcke, W.; Frossard, E. Using isotopes to trace freshly applied cadmium through mineral phosphorus fertilization in soil-fertilizer-plant systems. Sci. Total Environ. 2019, 648, 779–786. [Google Scholar] [CrossRef]
  21. Xu, X.; Xia, L.; Zhu, W.; Zhang, Z.; Huang, Q.; Chen, W. Role of Penicillium chrysogenum XJ-1 in the Detoxification and Bioremediation of Cadmium. Front. Microbiol. 2015, 6, 1422. [Google Scholar] [CrossRef] [PubMed]
  22. Guo, Y.; Li, X.; Liang, L.; Lin, Z.; Su, X.; Zhang, W. Immobilization of cadmium in contaminated soils using sulfidated nanoscale zero-valent iron: Effectiveness and remediation mechanism. J. Hazard. Mater. 2021, 420, 126605. [Google Scholar] [CrossRef] [PubMed]
  23. Douglas, R.K.; Nawar, S.; Cipullo, S.; Alamar, M.C.; Coulon, F.; Mouazen, A.M. Evaluation of vis-NIR reflectance spectroscopy sensitivity to weathering for enhanced assessment of oil contaminated soils. Sci. Total Environ. 2018, 626, 1108–1120. [Google Scholar] [CrossRef]
  24. Zhang, S.; Chen, H.; He, D.; He, X.; Yan, Y.; Wu, K.; Wei, H. Effects of Exogenous Organic Acids on Cd Tolerance Mechanism of Salix variegata Franch. Under Cd Stress. Front. Plant Sci. 2020, 11, 594352. [Google Scholar] [CrossRef] [PubMed]
  25. Bartolozzi, F.; Bertazza, G.; Bassi, D.; Cristoferi, G. Simultaneous determination of soluble sugars and organic acids as their trimethylsilyl derivatives in apricot fruits by gas-liquid chromatography. J. Chromatogr. A 1997, 758, 99–107. [Google Scholar] [CrossRef]
  26. Pierce, J.; Suelter, C.H. An evaluation of the Coomassie brilliant blue G-250 dye-binding method for quantitative protein determination. Anal. Biochem. 1977, 81, 478–480. [Google Scholar] [CrossRef] [PubMed]
  27. Barakat, M.Z.; Shehab, S.K.; Darwish, N.; El-Zoheiry, E. A new titrimetric method for the determination of vitamin C. Anal. Biochem. 1973, 53, 245–251. [Google Scholar] [CrossRef]
  28. Li, X.; Coles, B.J.; Ramsey, M.H.; Thornton, I. Sequential extraction of soils for multielement analysis by ICP-AES. Chem. Geol. 1995, 124, 109–123. [Google Scholar] [CrossRef]
  29. Marchiol, L.; Assolari, S.; Sacco, P.; Zerbi, G. Phytoextraction of heavy metals by canola (Brassica napus) and radish (Raphanus sativus) grown on multicontaminated soil. Environ. Pollut. 2004, 132, 21–27. [Google Scholar] [CrossRef]
  30. GB2762-2022; National Food Safety Standards—Limit of Pollutants in Food. Standardization Administration of the People’s Republic of China: Beijing, China, 2022.
  31. Suleman, M.; Ashraf, M.; Raza, Q.-U.-A.; Bashir, M.A.; Rahman, S.U.; Aon, M.; Ali, S.; Shahzad, S.M.; Khalid, M.U.; Raza, H.M.; et al. Determining the Cadmium Accumulation in Maize (Zea mays L.) and Soil Influenced by Phosphoric Fertilizers in Two Different Textured Soils. Land 2022, 11, 1313. [Google Scholar] [CrossRef]
  32. Liu, M.; Zhao, Z.; Chen, L.; Wang, L.; Ji, L.; Xiao, Y. Influences of arbuscular mycorrhizae, phosphorus fertilizer and biochar on alfalfa growth, nutrient status and cadmium uptake. Ecotoxicol. Environ. Saf. 2020, 196, 110537. [Google Scholar] [CrossRef] [PubMed]
  33. Ma, J.; Zia Ur Rehman, M.; Saleem, M.H.; Adrees, M.; Rizwan, M.; Javed, A.; Rafique, M.; Qayyum, M.F.; Ali, S. Effect of phosphorus sources on growth and cadmium accumulation in wheat under different soil moisture levels. Environ. Pollut. 2022, 311, 119977. [Google Scholar] [CrossRef] [PubMed]
  34. Vanderschueren, R.; Argüello, D.; Blommaert, H.; Montalvo, D.; Barraza, F.; Maurice, L.; Schreck, E.; Schulin, R.; Lewis, C.; Vazquez, J.L.; et al. Mitigating the level of cadmium in cacao products: Reviewing the transfer of cadmium from soil to chocolate bar. Sci. Total Environ. 2021, 781, 146779. [Google Scholar] [CrossRef]
  35. Chtouki, M.; Naciri, R.; Soulaimani, A.; Zeroual, Y.; El Gharous, M.; Oukarroum, A. Effect of Cadmium and Phosphorus Interaction on Tomato: Chlorophyll a Fluorescence, Plant Growth, and Cadmium Translocation. Water Air Soil Pollut. 2021, 232, 84. [Google Scholar] [CrossRef]
  36. Jiang, H.M.; Yang, J.C.; Zhang, J.F. Effects of external phosphorus on the cell ultrastructure and the chlorophyll content of maize under cadmium and zinc stress. Environ. Pollut. 2007, 147, 750–756. [Google Scholar] [CrossRef] [PubMed]
  37. Mishra, B.S.; Sharma, M.; Laxmi, A. Role of sugar and auxin crosstalk in plant growth and development. Physiol. Plant. 2022, 174, e13546. [Google Scholar] [CrossRef] [PubMed]
  38. Wu, S.; Li, M.; Zhang, C.; Tan, Q.; Yang, X.; Sun, X.; Pan, Z.; Deng, X.; Hu, C. Effects of phosphorus on fruit soluble sugar and citric acid accumulations in citrus. Plant Physiol. Biochem. 2021, 160, 73–81. [Google Scholar] [CrossRef]
  39. Tian, C.; Zhou, X.; Liu, Q.; Peng, J.; Zhang, Z.; Song, H.; Ding, Z.; Zhran, M.A.; Eissa, M.A.; Kheir, A.M.S.; et al. Increasing yield, quality and profitability of winter oilseed rape (Brassica napus) under combinations of nutrient levels in fertilizer and planting density. Crop Pasture Sci. 2020, 71, 1010–1019. [Google Scholar] [CrossRef]
  40. Maqbool, A.; Rizwan, M.; Yasmeen, T.; Arif, M.S.; Hussain, A.; Mansha, A.; Ali, S.; Alshaya, H.; Okla, M.K. Phosphorus Fertilizers Enhance the Phytoextraction of Cadmium through Solanum nigrum L. Plants 2022, 11, 236. [Google Scholar] [CrossRef]
  41. Wang, Y.; Peng, X.; Lai, L.; Li, H.; Zhang, X.; Chen, H.; Xie, L. Phosphorus fertilization regimes and rates alter Cd extractability in rhizospheric soils and uptake in maize (Zea mays L.). Chemosphere 2022, 298, 134288. [Google Scholar] [CrossRef]
  42. Guo, F.; Ding, C.; Zhou, Z.; Huang, G.; Wang, X. Effects of combined amendments on crop yield and cadmium uptake in two cadmium contaminated soils under rice-wheat rotation. Ecotoxicol. Environ. Saf. 2018, 148, 303–310. [Google Scholar] [CrossRef] [PubMed]
  43. Hou, R.; Wang, L.; O’Connor, D.; Rinklebe, J.; Hou, D. Natural field freeze-thaw process leads to different performances of soil amendments towards Cd immobilization and enrichment. Sci. Total Environ. 2022, 831, 154880. [Google Scholar] [CrossRef] [PubMed]
  44. Andrew Ofudje, E.; Sodiya, E.F.; Olanrele, O.S.; Akinwunmi, F. Adsorption of Cd2+ onto apatite surface: Equilibrium, kinetics and thermodynamic studies. Heliyon 2023, 9, e12971. [Google Scholar] [CrossRef] [PubMed]
  45. He, L.-L.; Huang, D.-Y.; Zhang, Q.; Zhu, H.-H.; Xu, C.; Li, B.; Zhu, Q.-H. Meta-analysis of the effects of liming on soil pH and cadmium accumulation in crops. Ecotoxicol. Environ. Saf. 2021, 223, 112621. [Google Scholar] [CrossRef] [PubMed]
  46. Zhang, Q.; Zhang, L.; Liu, T.; Liu, B.; Huang, D.; Zhu, Q.; Xu, C. The influence of liming on cadmium accumulation in rice grains via iron-reducing bacteria. Sci. Total Environ. 2018, 645, 109–118. [Google Scholar] [CrossRef] [PubMed]
  47. Zheng, H.; Wang, M.; Chen, S.; Li, S.; Lei, X. Sulfur application modifies cadmium availability and transfer in the soil-rice system under unstable pe+pH conditions. Ecotoxicol. Environ. Saf. 2019, 184, 109641. [Google Scholar] [CrossRef] [PubMed]
  48. Huang, J.H.; Shetaya, W.H.; Osterwalder, S. Determination of (Bio)-available mercury in soils: A review. Environ. Pollut. 2020, 263, 114323. [Google Scholar] [CrossRef] [PubMed]
  49. Yao, W.-B.; Huang, L.; Zhao, F.-P.; Yang, Z.-H.; Liu, Y.; Su, C.-Q. Effective remediation of cadmium and lead contaminated soils by a novel slow-release phosphate amendment. J. Cent. South Univ. 2022, 29, 1185–1196. [Google Scholar] [CrossRef]
  50. Tu, C.; Zheng, C.R.; Chen, H.M. Effect of applying chemical fertilizers on forms of lead and cadmium in red soil. Chemosphere 2000, 41, 133–138. [Google Scholar] [CrossRef]
Figure 1. Effect of application of different P fertilizers on biomass of various parts of eggplant under cadmium pollution; (a): root biomass; (b): stem biomass; (c): leaf biomass; (d): eggplant pedicle biomass; (e): eggplant peel biomass; and (f): eggplant pulp biomass. Treatments MAP, SSP, DAP, and DCP denote the application of phosphate fertilizer types monoammonium phosphate, superphosphate, diammonium phosphate, and dicalcium phosphate, respectively; and treatments P0, P1, P2, and P3 denote the application of phosphate fertilizer levels of 0, 0.15, 0.25, and 0.35 mg kg−1, respectively. Upper case letters (A, B, C, D) denote significant differences between different P fertilizer types with the same P fertilizer level, and lower case letters (a, b, c, d) denote significant differences between different P fertilizer levels with the same P fertilizer type. The T and L in each column indicate two-way ANOVA significance levels for P fertilizer type and level. ***, p < 0.01.
Sustainability 15 16236 g001
Figure 2. Effect of application of different P fertilizers on cadmium content in various parts of eggplant under cadmium pollution (a): Cd content in roots; (b): Cd content in stems; (c): Cd content in leaves; (d): Cd content in pedicels; (e): Cd content in peel; and (f): Cd content in pulp. Treatments MAP, SSP, DAP, and DCP denote the application of phosphate fertilizer types monoammonium phosphate, superphosphate, diammonium phosphate, and dicalcium phosphate, respectively; and treatments P0, P1, P2, and P3 denote the application of phosphorus fertilizer levels of 0, 0.15, 0.25, and 0.35 mg kg−1, respectively. Upper case letters (A, B, C, D) denote significant differences between different P fertilizer types with the same P fertilizer level, and lower case letters (a, b, c, d) denote significant differences between different P fertilizer levels with the same P fertilizer type. The T and L in each column indicate two-way ANOVA significance levels for P fertilizer type and level. ***, p < 0.01.
Sustainability 15 16236 g002
Figure 3. Yield and quality indicators of eggplant fruits (a): eggplant yield; (b): soluble sugar; (c): soluble protein; and (d): vitamin C. Treatments MAP, SSP, DAP, and DCP denote the application of phosphate fertilizer types monoammonium phosphate, superphosphate, diammonium phosphate, and dicalcium phosphate, respectively; and treatments P0, P1, P2, and P3 denote the application of phosphate fertilizer levels of 0, 0.15, 0.25, and 0.35 mg kg−1, respectively. Upper case letters (A, B, C, and D) denote significant differences between different P fertilizer types with the same P fertilizer level, and lower case letters (a, b, c, and d) denote significant differences between different P fertilizer levels with the same P fertilizer type. The T and L in each column indicate two-way ANOVA significance levels for P fertilizer type and level. ***, p < 0.01; **, p < 0.05; ns, non-significant.
Sustainability 15 16236 g003
Figure 4. Soil Cd morphology at maturity. The five soil classifications were Cd–E: Cd content in the exchangeable state; Cd–C: Cd content in the carbonate-bound state; Cd–Fe/Mn: Cd content in the Fe–Mn oxide-bound state; Cd–O: Cd content in the organic-bound state; and Cd–R: Cd content in the residual state. Treatments MAP, SSP, DAP, and DCP indicate the application of phosphate fertilizer types monoammonium phosphate, superphosphate, diammonium phosphate, and dicalcium phosphate, respectively. P0, P1, P2, and P3 in the graphs denote the application of phosphate fertilizer levels of 0, 0.15, 0.25, and 0.35 mg kg−1. The T and L in each grading denote the two-way ANOVA significance levels for P fertilizer type and level. ***, p < 0.01.
Sustainability 15 16236 g004
Figure 5. Correlation between soil Cd morphology and Cd content in parts of the eggplants. Cd–E: Cd content in the exchangeable state; Cd–C: Cd content in the carbonate-bound state; Cd–Fe/Mn: Cd content in the Fe–Mn oxide-bound state; Cd–O: Cd content in the organic-bound state; and Cd–R: Cd content in the residual state. Cd–root: Cd content in eggplant root; Cd–stem: Cd content in eggplant stem; Cd–leaf: Cd content in eggplant leaf; Cd–pedicel: Cd content in eggplant pedicel; Cd–peel: Cd content in eggplant peel; and Cd–pulp: Cd content in eggplant pulp. * indicates that the correlation between the corresponding two groups of data is significant (p ≤ 0.05).
Sustainability 15 16236 g005
Figure 6. Redundancy analysis between Cd content in parts of eggplant and soil Cd morphology. Red arrows indicate soil Cd morphology. Cd–E: Cd content in the exchangeable state; Cd–C: Cd content in the carbonate-bound state; Cd–Fe/Mn: Cd content in the Fe–Mn oxide-bound state; Cd–O: Cd content in the organic-bound state; and Cd–R: Cd content in the residual state. Blue arrows indicate the Cd content of parts of eggplant, Cd–root: Cd content in eggplant root; Cd–stem: Cd content in eggplant stem; Cd–leaf: Cd content in eggplant leaf; Cd–pedicel: Cd content in eggplant pedicel; Cd–peel: Cd content in eggplant peel; Cd–pulp: Cd content in eggplant pulp. The black circle indicates no P fertilizer applied under Cd pollution; different shapes indicate different types of P fertilizer; different colors indicate different levels of P fertilizer; treatments MAP, SSP, DAP, and DCP indicate monoammonium phosphate, superphosphate, diammonium phosphate, and dicalcium phosphate, respectively; and treatments P0, P1, P2, and P3 indicate the application of phosphate fertilizer levels of 0, 0.15, 0.25, and 0.35 mg kg−1, respectively. *, p < 0.05.
Sustainability 15 16236 g006
Table 1. Different P fertilizer types, P fertilizer levels, and application rates of each nutrient.
TreatmentCd Content
(mg kg−1)
Type of
P Fertilizer
P Fertilizer Levels (g kg−1)N (g kg−1)K2O (g kg−1)
150 (P0)0.20.15
25MAP0.15 (P1)0.20.15
35MAP0.25 (P2)0.20.15
45MAP0.35 (P3)0.20.15
55SSP0.15 (P1)0.20.15
65SSP0.25 (P2)0.20.15
75SSP0.35 (P3)0.20.15
85DAP0.15 (P1)0.20.15
95DAP0.25 (P2)0.20.15
105DAP0.35 (P3)0.20.15
115DCP0.15 (P1)0.20.15
125DCP0.25 (P2)0.20.15
135DCP0.35 (P3)0.20.15
Treatments MAP, SSP, DAP, and DCP denote the application of the phosphate fertilizer types monoammonium phosphate, superphosphate, diammonium phosphate, and dicalcium phosphate, respectively.
Table 2. BCFs for roots, stems, leaves, and pulp parts of the eggplant under different P fertilizers.
TypologyLevelBCF rootsBCF stemsBCF leavesBCF pulp
MAPP00.82 ± 0.022 Aa0.48 ± 0.001 Aa0.28 ± 0.004 Aa0.0141 ± 0.00014 Aa
P10.67 ± 0.044 ABb0.34 ± 0.015 Bc0.22 ± 0.008 Ab0.0082 ± 0.00015 ABc
P20.63 ± 0.042 Bb0.39 ± 0.011 Ab0.21 ± 0.001 Bb0.0092 ± 0.00034 Bb
P30.61 ± 0.027 Bb0.32 ± 0.003 Bd0.18 ± 0.017 Bc0.0083 ± 0.00011 Bc
SSPP00.82 ± 0.022 Aa0.48 ± 0.001 Aa0.28 ± 0.005 Aa0.0141 ± 0.00014 Aa
P10.73 ± 0.012 Ab0.38 ± 0.026 Ab0.22 ± 0.010 Ab0.0085 ± 0.00030 Ad
P20.81 ± 0.018 Aa0.39 ± 0.056 Ab0.24 ± 0.007 Ab0.0102 ± 0.00009 Ab
P30.75 ± 0.027 Ab0.35 ± 0.012 Ab0.22 ± 0.019 Ab0.0092 ± 0.00026 Ac
DAPP00.82 ± 0.022 Aa0.48 ± 0.001 Aa0.28 ± 0.005 Aa0.0141 ± 0.00014 Aa
P10.62 ± 0.035 Bb0.30 ± 0.019 Cc0.18 ± 0.017 Bb0.0078 ± 0.00041 Bb
P20.62 ± 0.040 BCb0.34 ± 0.005 Ab0.18 ± 0.012 Cb0.0078 ± 0.00015 Cb
P30.59 ± 0.037 Bb0.28 ± 0.021 Cd0.13 ± 0.007 Cc0.0069 ± 0.00019 Cc
DCPP00.82 ± 0.022 Aa0.48 ± 0.001 Aa0.28 ± 0.005 Aa0.0141 ± 0.00014 Aa
P10.69 ± 0.027 Ab0.26 ± 0.012 Db0.16 ± 0.017 Bb0.0062 ± 0.00018 Cb
P20.56 ± 0.015 Cc0.22 ± 0.029 Bc0.09 ± 0.007 Dc0.0046 ± 0.00030 Dd
P30.48 ± 0.020 Cd0.20 ± 0.011 Dc0.05 ± 0.012 Dd0.0050 ± 0.00006 Dc
T #************
L #************
T # × L #************
BCF roots: soil to roots Cd bioconcentration factors; BCF stems: soil to stems Cd bioconcentration factors; BCF leaves: soil to leaves Cd bioconcentration factors; BCF pulp: soil to pulp Cd bioconcentration factors. Treatments MAP, SSP, DAP, and DCP denote the application of phosphate fertilizer types monoammonium phosphate, superphosphate, diammonium phosphate, and dicalcium phosphate, respectively; and treatments P0, P1, P2, and P3 denote the application of phosphate fertilizer levels of 0, 0.15, 0.25, and 0.35 mg kg−1, respectively. Upper case letters (A, B, C, D) denote significant differences between different P fertilizer types with the same P fertilizer level, and lower case letters (a, b, c, d) denote significant differences between different P fertilizer levels with the same P fertilizer type. # denotes two-way ANOVA significance level for P fertilizer type (T) and P fertilizer level (L). ***, p < 0.01.
Table 3. TFs from root to stem, leaf and pulp parts of eggplant under different P fertilizers.
TypologyLevelTF stem/rootTF leaf/rootTF pulp/root
MAPP00.59 ± 0.017 Aab0.35 ± 0.004 Aa0.0172 ± 0.00059 Aa
P10.51 ± 0.057 Ab0.32 ± 0.031 Aab0.0123 ± 0.00090 Ac
P20.62 ± 0.058 Aa0.34 ± 0.024 Aab0.0147 ± 0.00088 Ab
P30.52 ± 0.022 Ab0.30 ± 0.024 Ab0.0134 ± 0.00073 Abc
SSPP00.59 ± 0.017 Aa0.35 ± 0.004 Aa0.0172 ± 0.00059 Aa
P10.53 ± 0.040 Aab0.31 ± 0.018 Ab0.0118 ± 0.00022 Ac
P20.48 ± 0.060 BCb0.30 ± 0.014 Bb0.0126 ± 0.00018 Bb
P30.47 ± 0.018 ABb0.30 ± 0.035 Ab0.0122 ± 0.00028 Bbc
DAPP00.59 ± 0.017 Aa0.35 ± 0.004 Aa0.0172 ± 0.00059 Aa
P10.49 ± 0.028 Abc0.29 ± 0.012 Ab0.0127 ± 0.00009 Abc
P20.55 ± 0.039 ABab0.30 ± 0.018 Bb0.0128 ± 0.00067 Bb
P30.47 ± 0.051 ABc0.22 ± 0.007 Bc0.0116 ± 0.00080 BCc
DCPP00.59 ± 0.017 Aa0.35 ± 0.004 Aa0.0172 ± 0.00059 Aa
P10.37 ± 0.005 Bb0.23 ± 0.030 Bb0.0090 ± 0.00043 Bc
P20.38 ± 0.058 Cb0.16 ± 0.008 Cc0.0082 ± 0.00069 Cc
P30.42 ± 0.034 Bb0.10 ± 0.026 Cd0.0105 ± 0.00039 Cb
T #*********
L #*********
T # × L #*********
TF stem/root: root to stem Cd translocation factor; TF leaf/root: root to leaf Cd translocation factor; TF pulp/root: root to pulp Cd translocation factor. Treatments MAP, SSP, DAP, and DCP denote the application of phosphate fertilizer types monoammonium phosphate, superphosphate, diammonium phosphate, and dicalcium phosphate, respectively; and treatments P0, P1, P2, and P3 denote the application of phosphate fertilizer levels of 0, 0.15, 0.25, and 0.35 mg kg−1, respectively. Upper case letters (A, B, C, D) denote significant differences between different P fertilizer types with the same P fertilizer level, and lower case letters (a, b, c, d) denote significant differences between different P fertilizer levels with the same P fertilizer type. # denotes two-way ANOVA significance level for P fertilizer type (T) and P fertilizer level (L). ***, p < 0.01.
Table 4. Proportion of soil Cd morphology under Cd stress by P.
TypologyLevelCd–ECd–CCd–Fe/MnCd–OCd–R
MAPP037.17%29.87%19.95%9.00%4.01%
P135.25%26.08%22.45%9.82%6.40%
P225.79%20.95%28.69%15.84%8.73%
P314.88%13.50%36.21%24.29%11.12%
SSPP037.17%29.87%19.95%9.00%4.01%
P132.38%24.25%24.42%10.91%8.03%
P223.45%21.29%29.27%16.67%9.32%
P314.44%13.23%35.74%24.68%11.91%
DAPP037.17%29.87%19.95%9.00%4.01%
P129.28%23.91%25.66%12.41%8.73%
P222.07%18.97%30.69%18.18%10.09%
P313.48%11.36%36.88%26.22%12.06%
DCPP037.17%29.87%19.95%9.00%4.01%
P126.29%23.76%26.90%13.42%9.63%
P222.13%17.40%30.41%19.66%10.41%
P312.52%10.61%37.70%26.57%12.61%
The five soil classifications were Cd–E: Cd content in the exchangeable state; Cd–C: Cd content in the carbonate-bound state; Cd–Fe/Mn: Cd content in the Fe–Mn oxide-bound state; Cd–O: Cd content in the organic-bound state; and Cd–R: Cd content in the residual state. Treatments MAP, SSP, DAP, and DCP indicate the application of phosphate fertilizer types monoammonium phosphate, superphosphate, diammonium phosphate, and dicalcium phosphate, respectively. P0, P1, P2, and P3 in the graphs denote the application of phosphate fertilizer levels of 0, 0.15, 0.25, and 0.35 mg kg−1.
Disclaimer/Publisher’s Note: The statements, opinions and data contained in all publications are solely those of the individual author(s) and contributor(s) and not of MDPI and/or the editor(s). MDPI and/or the editor(s) disclaim responsibility for any injury to people or property resulting from any ideas, methods, instructions or products referred to in the content.

