
Study on the Optimal Allocation of Water Resources Based on the Perspective of Water Rights Trading

Abstract
:1. Introduction
2. Research Methods
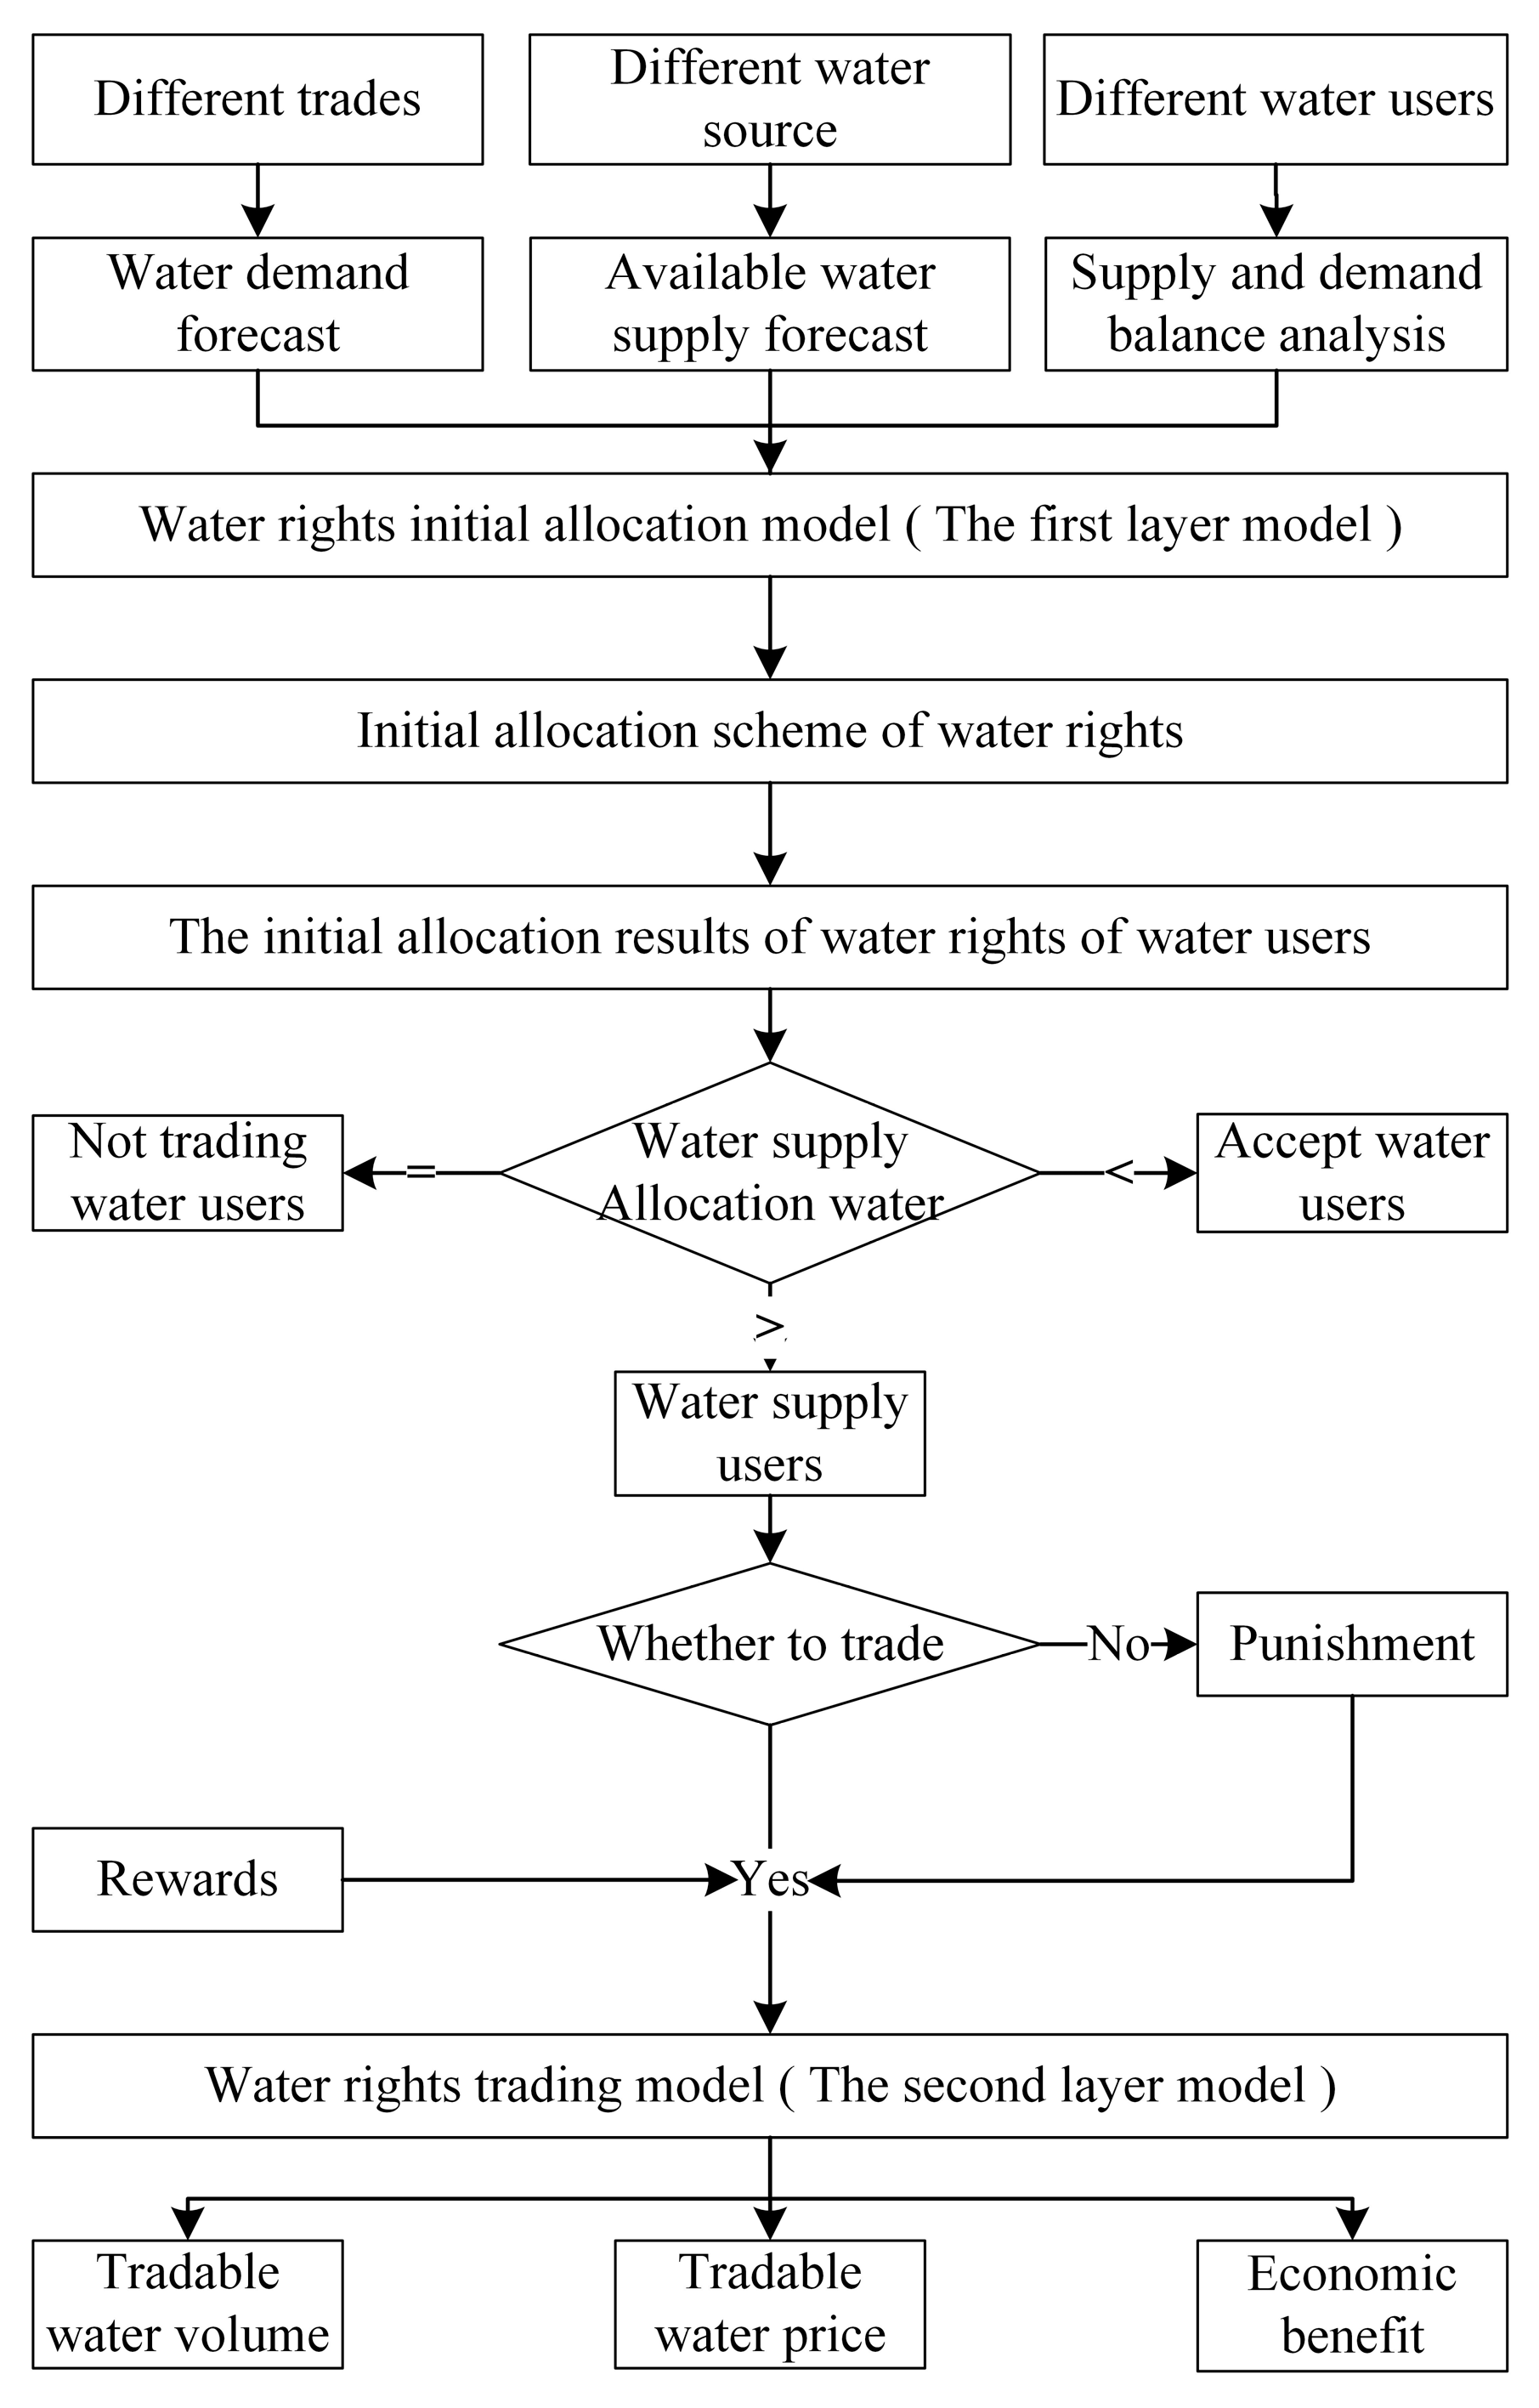
2.1. Model Framework
2.2. Model Construction
2.2.1. Initial Allocation Model of Water Rights
- (1)
- Decision variables
- (2)
- Objective function
- (3)
- Constraints
2.2.2. Water Rights Trading Model
- (1)
- Decision variables
- (2)
- Objective function
- (3)
- Constraints
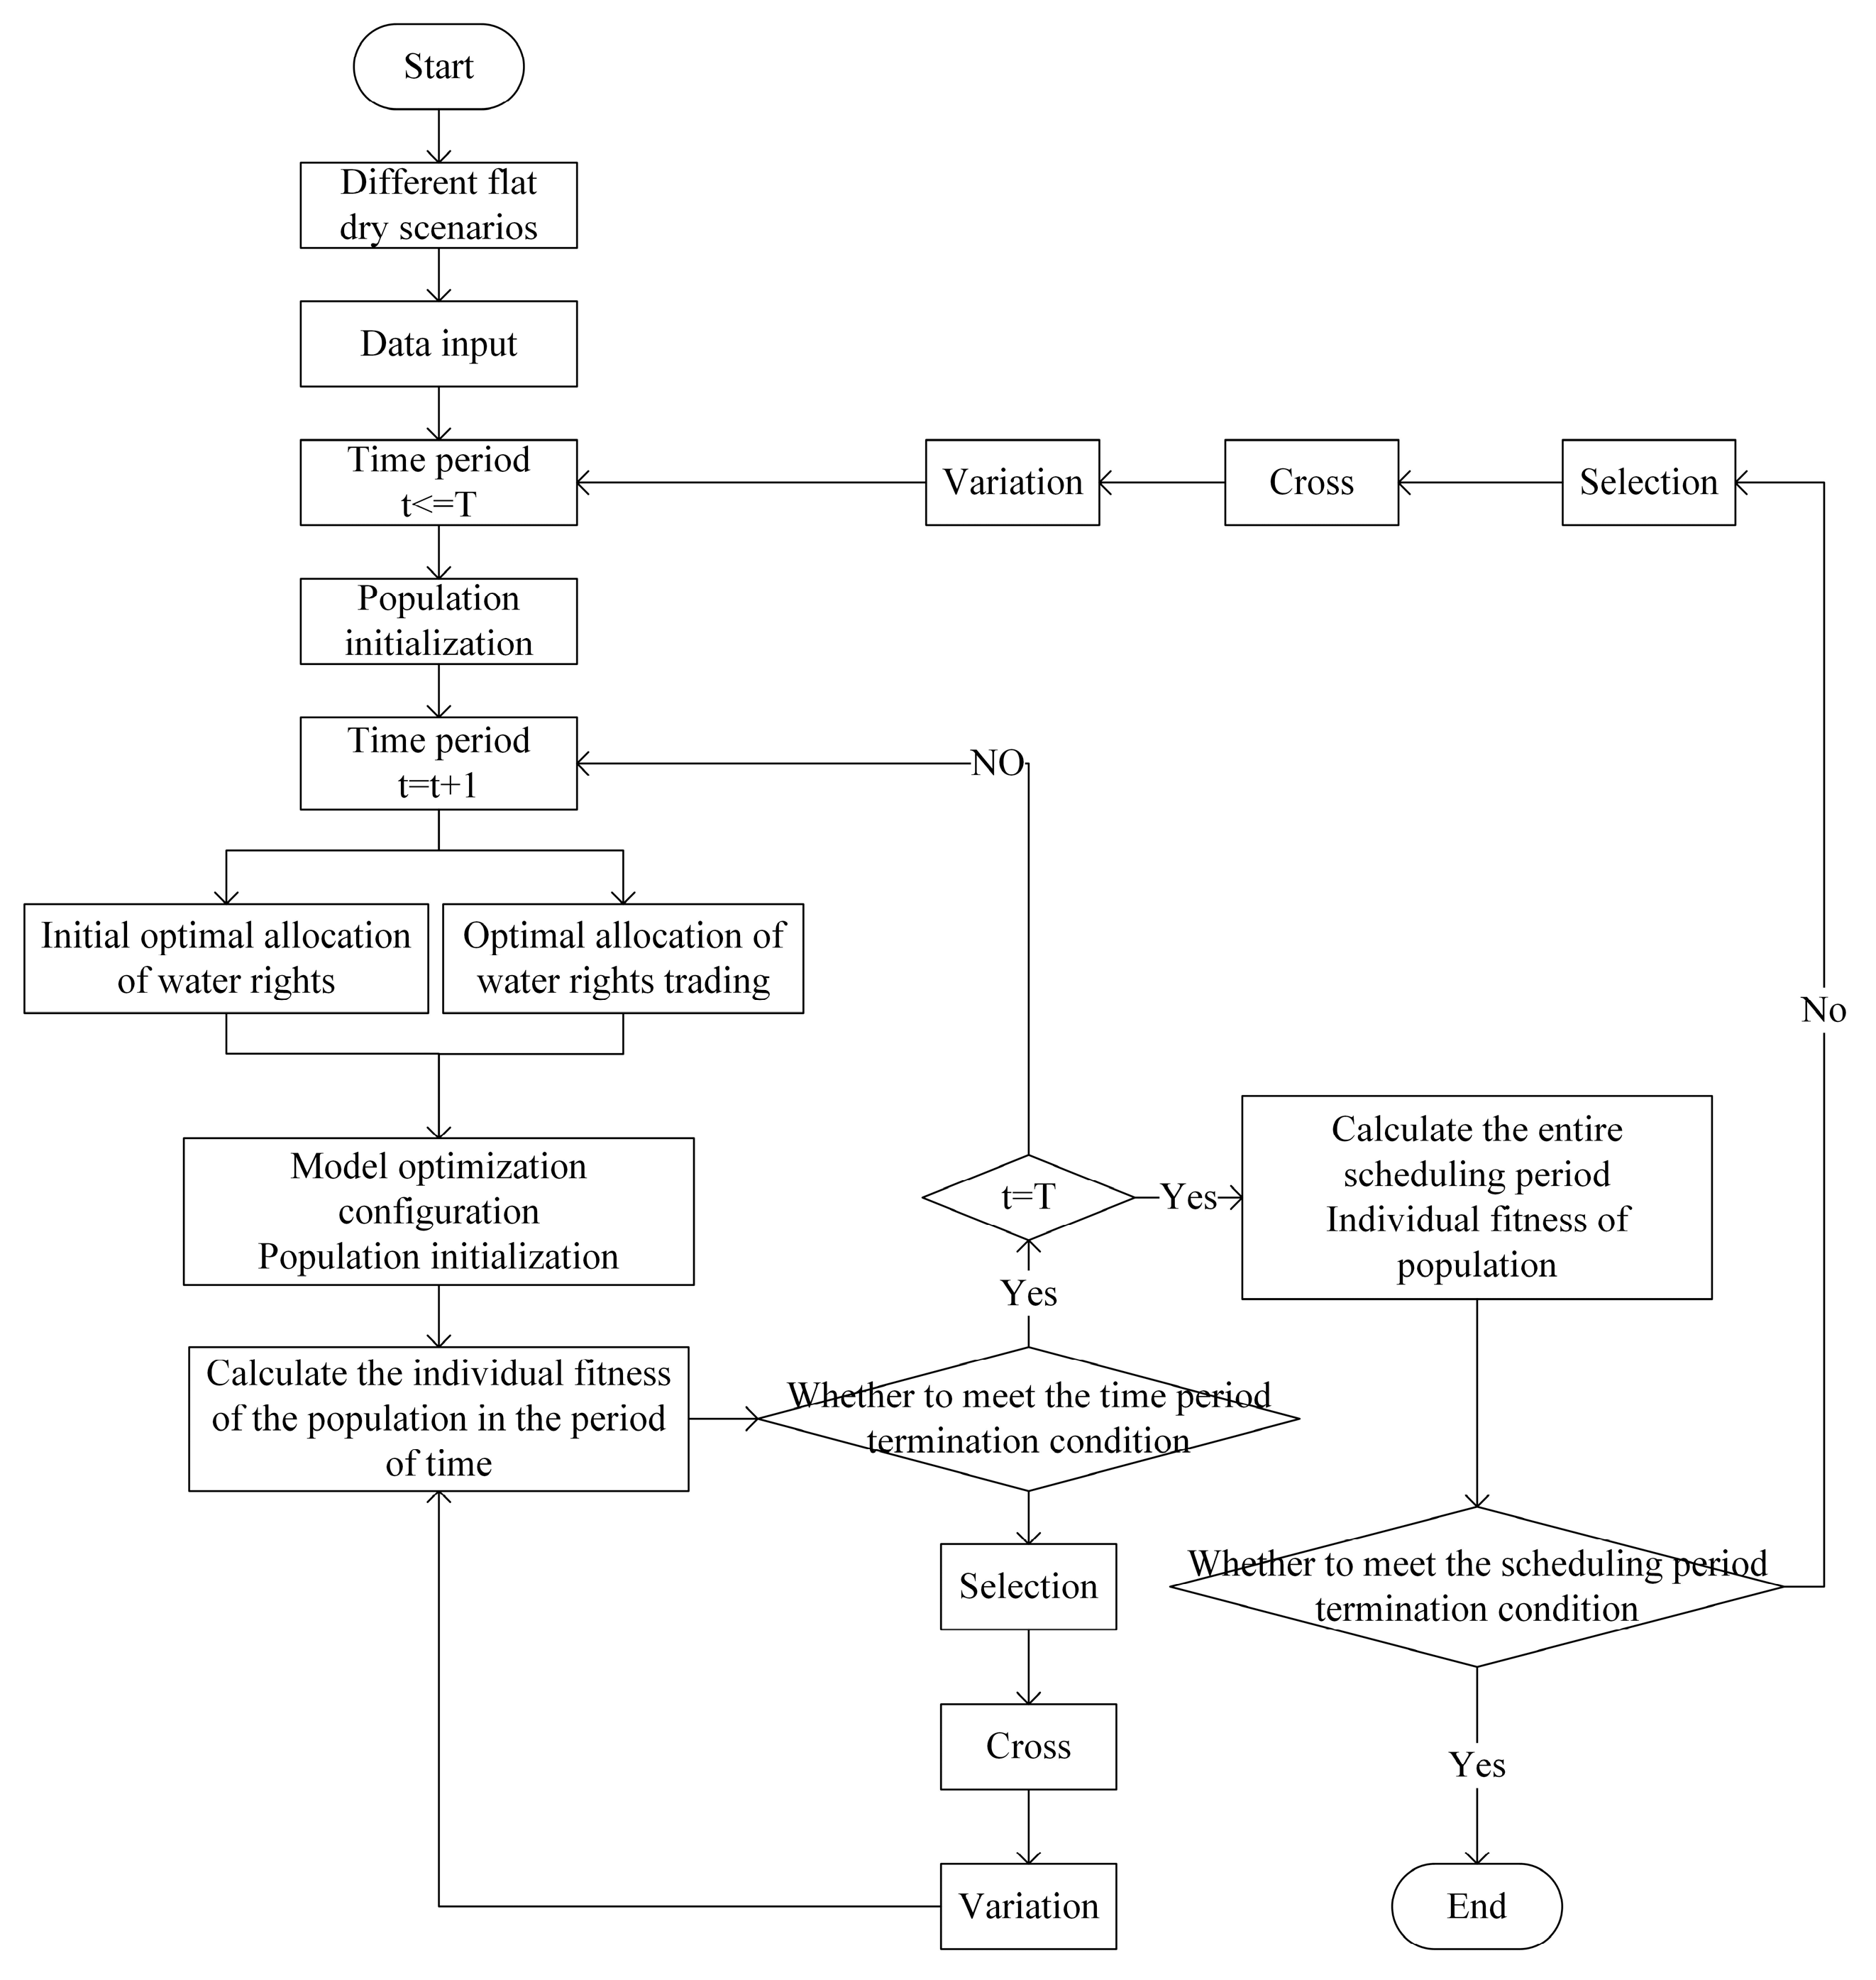
2.3. Model Solving
3. Application Case
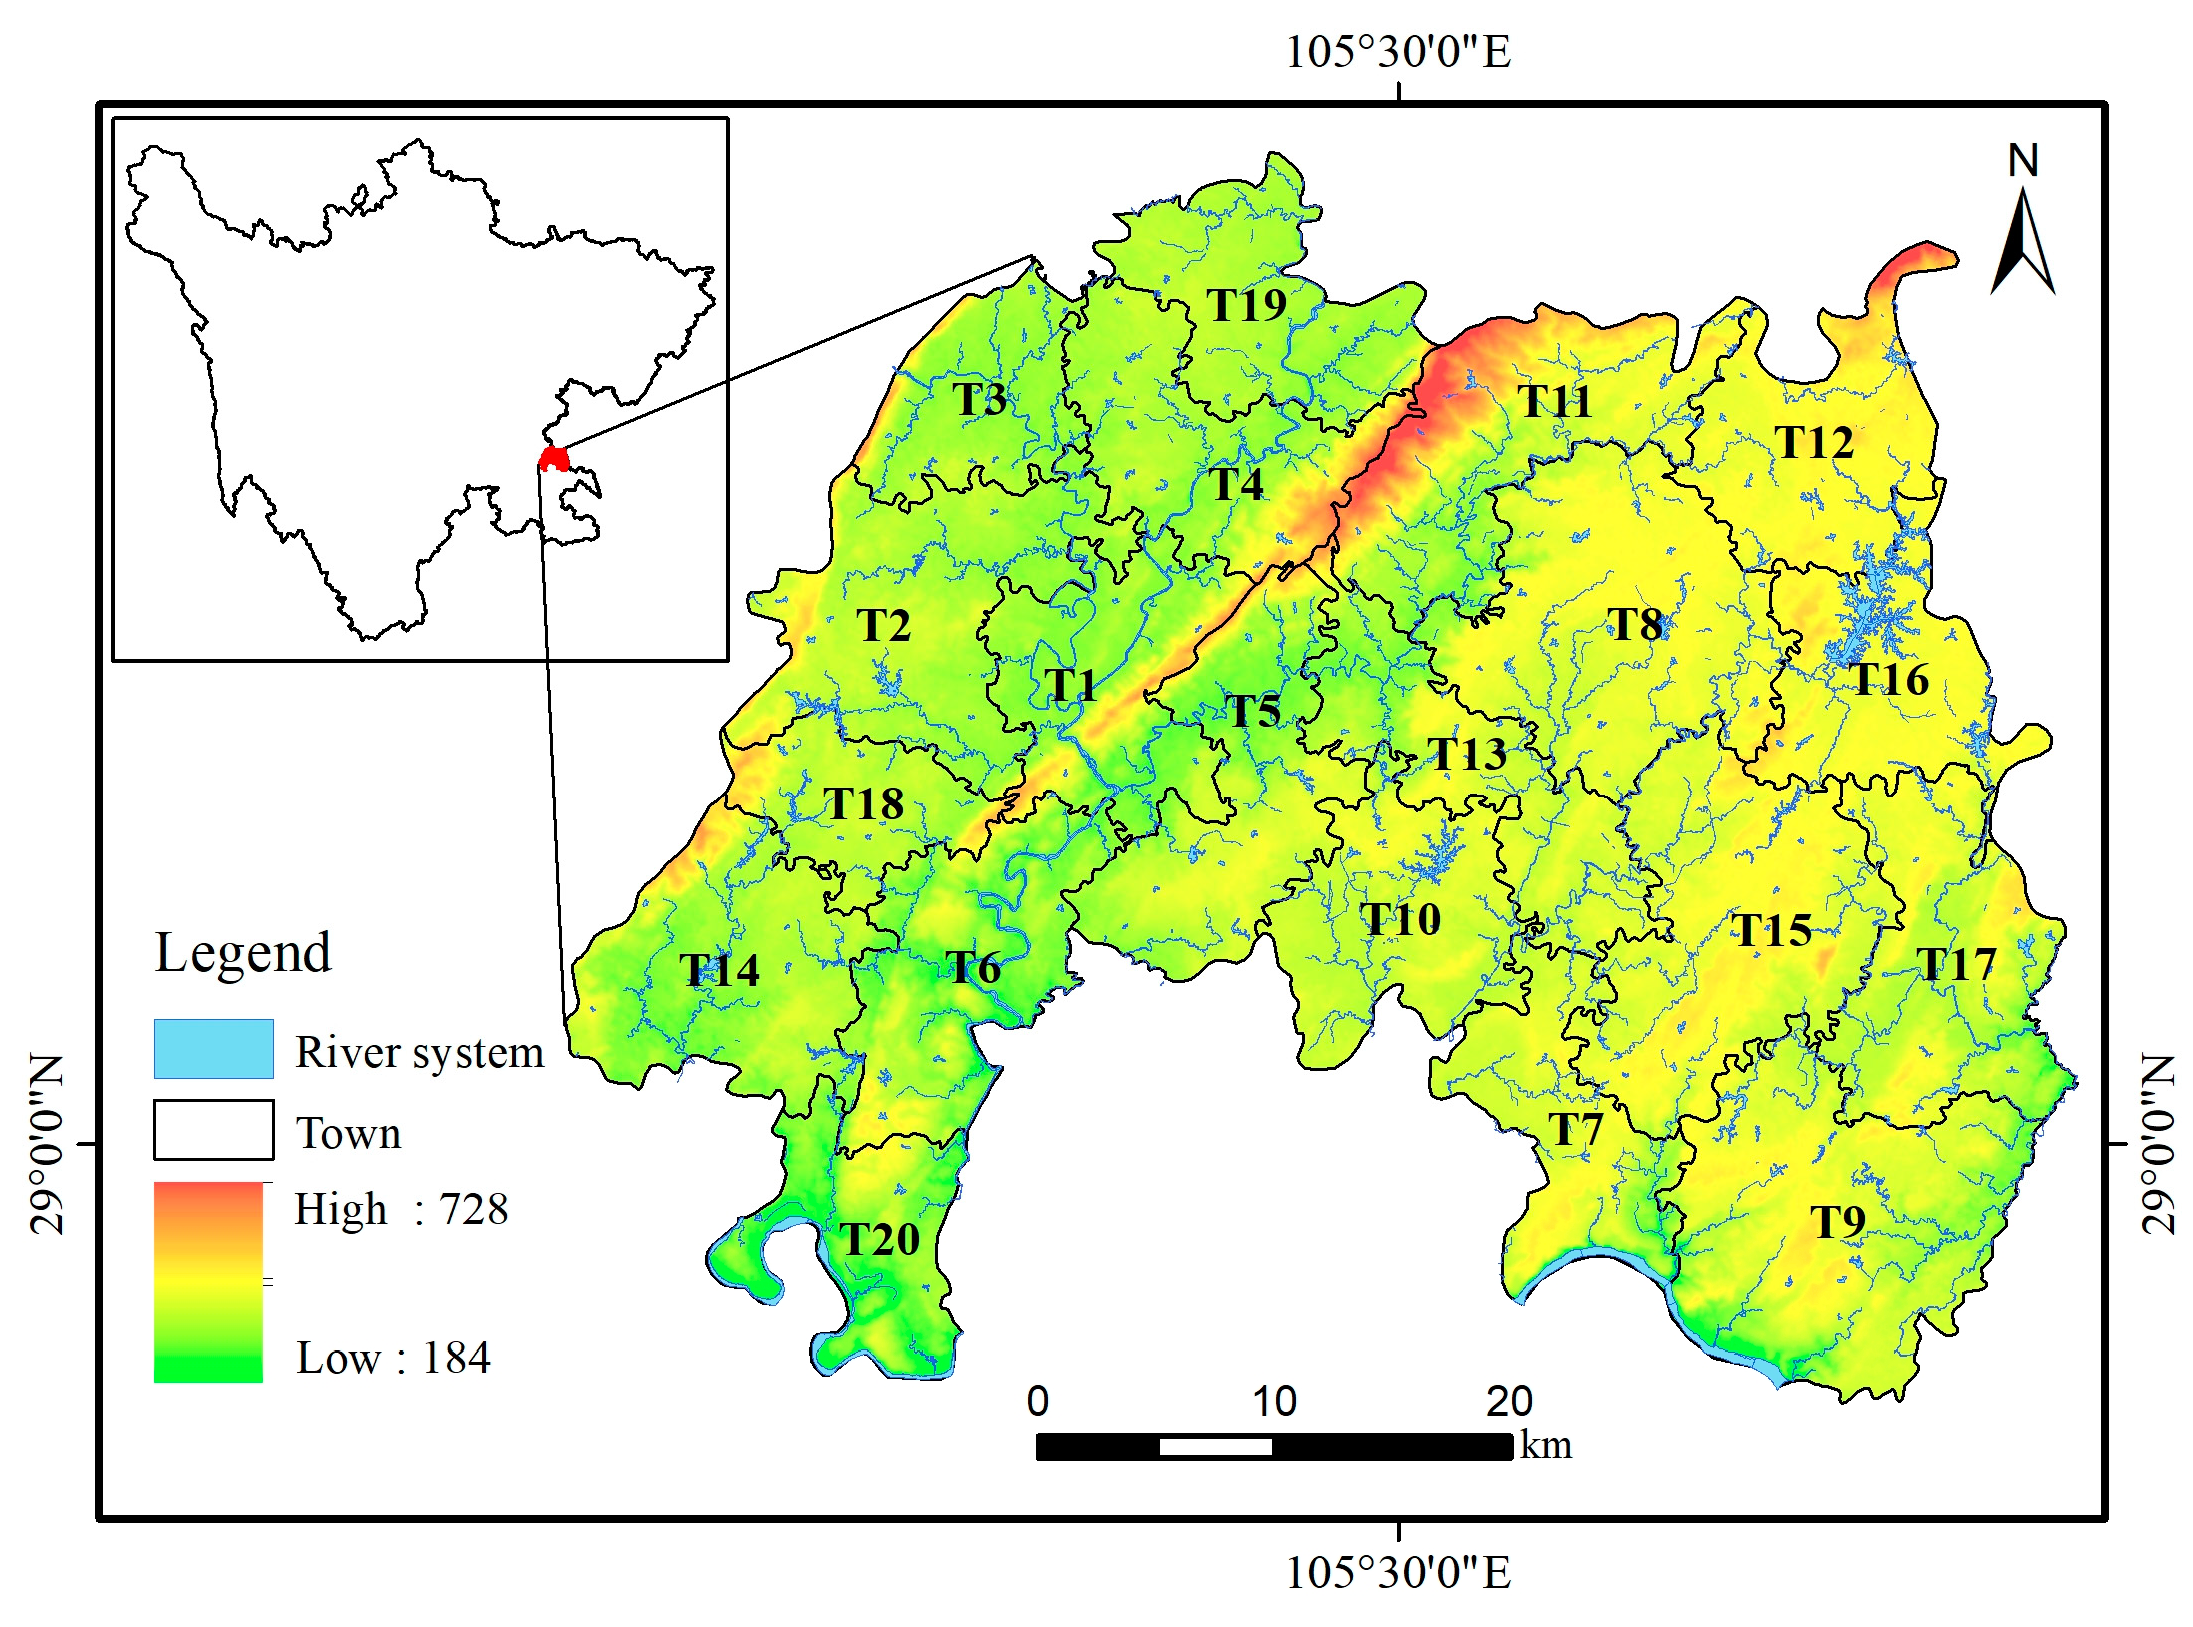
3.1. Overview of the Research Area
3.2. Data Sources
3.3. Supply and Demand Analysis
4. Results and Analysis
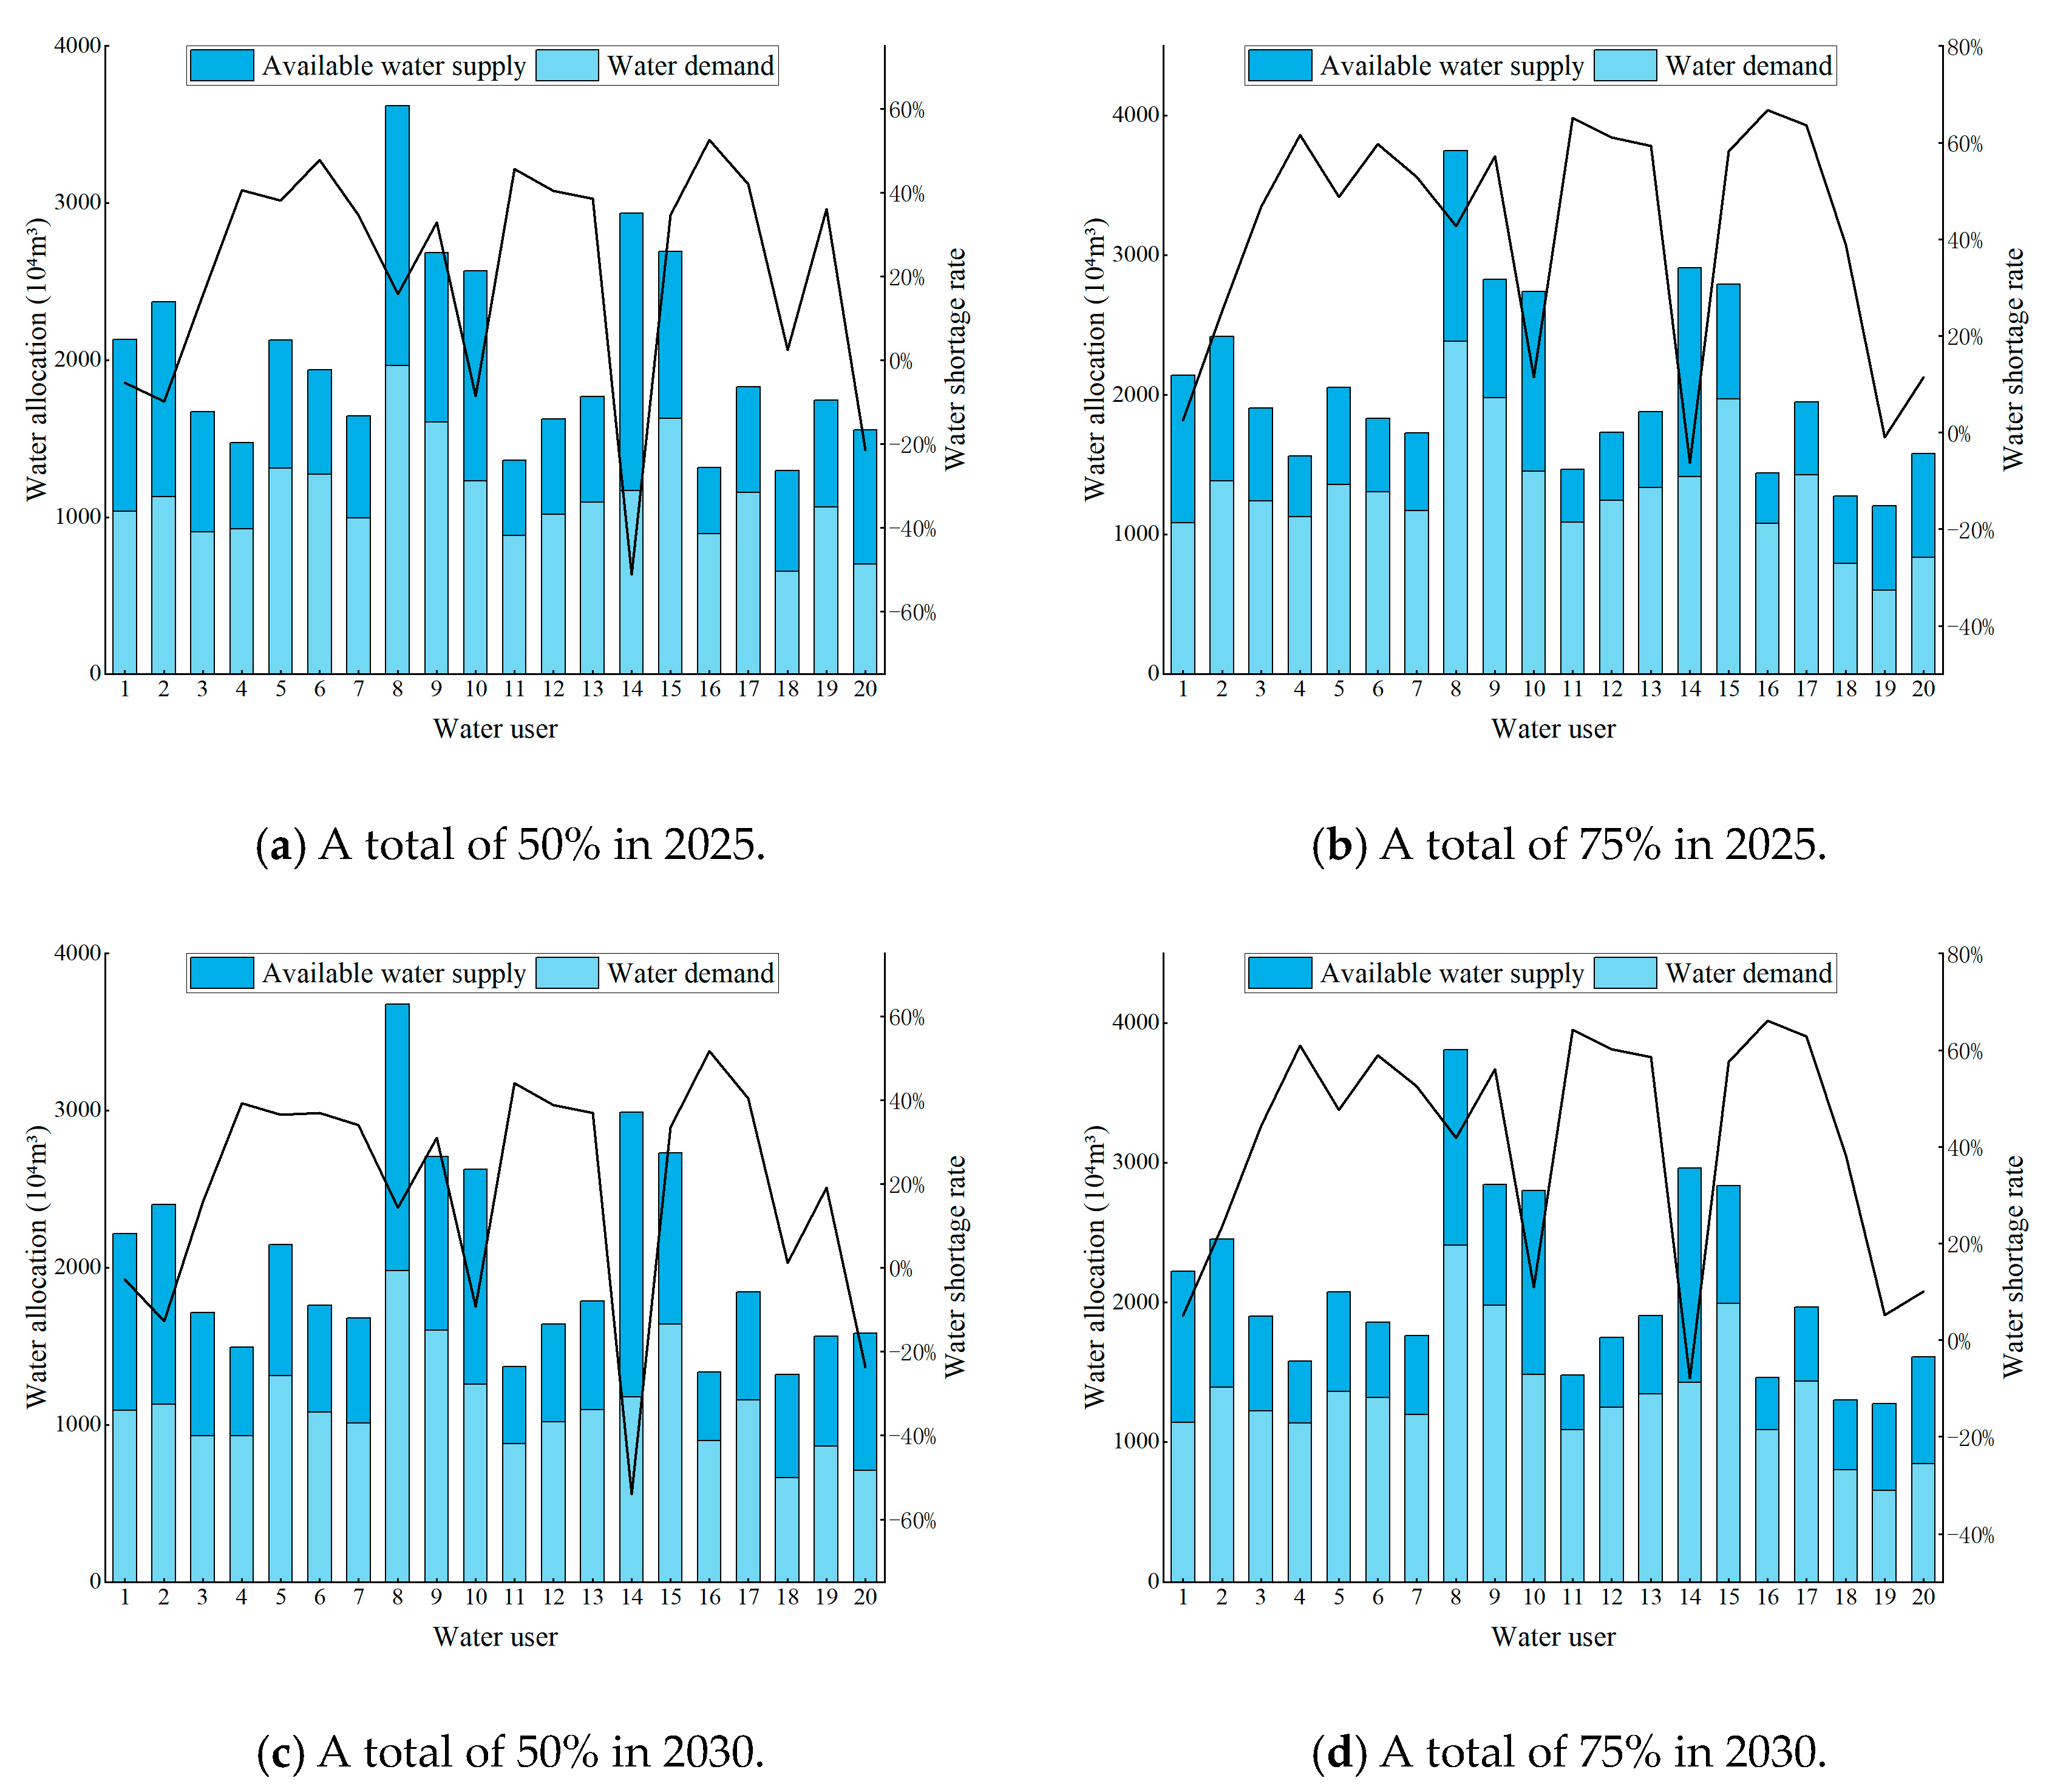
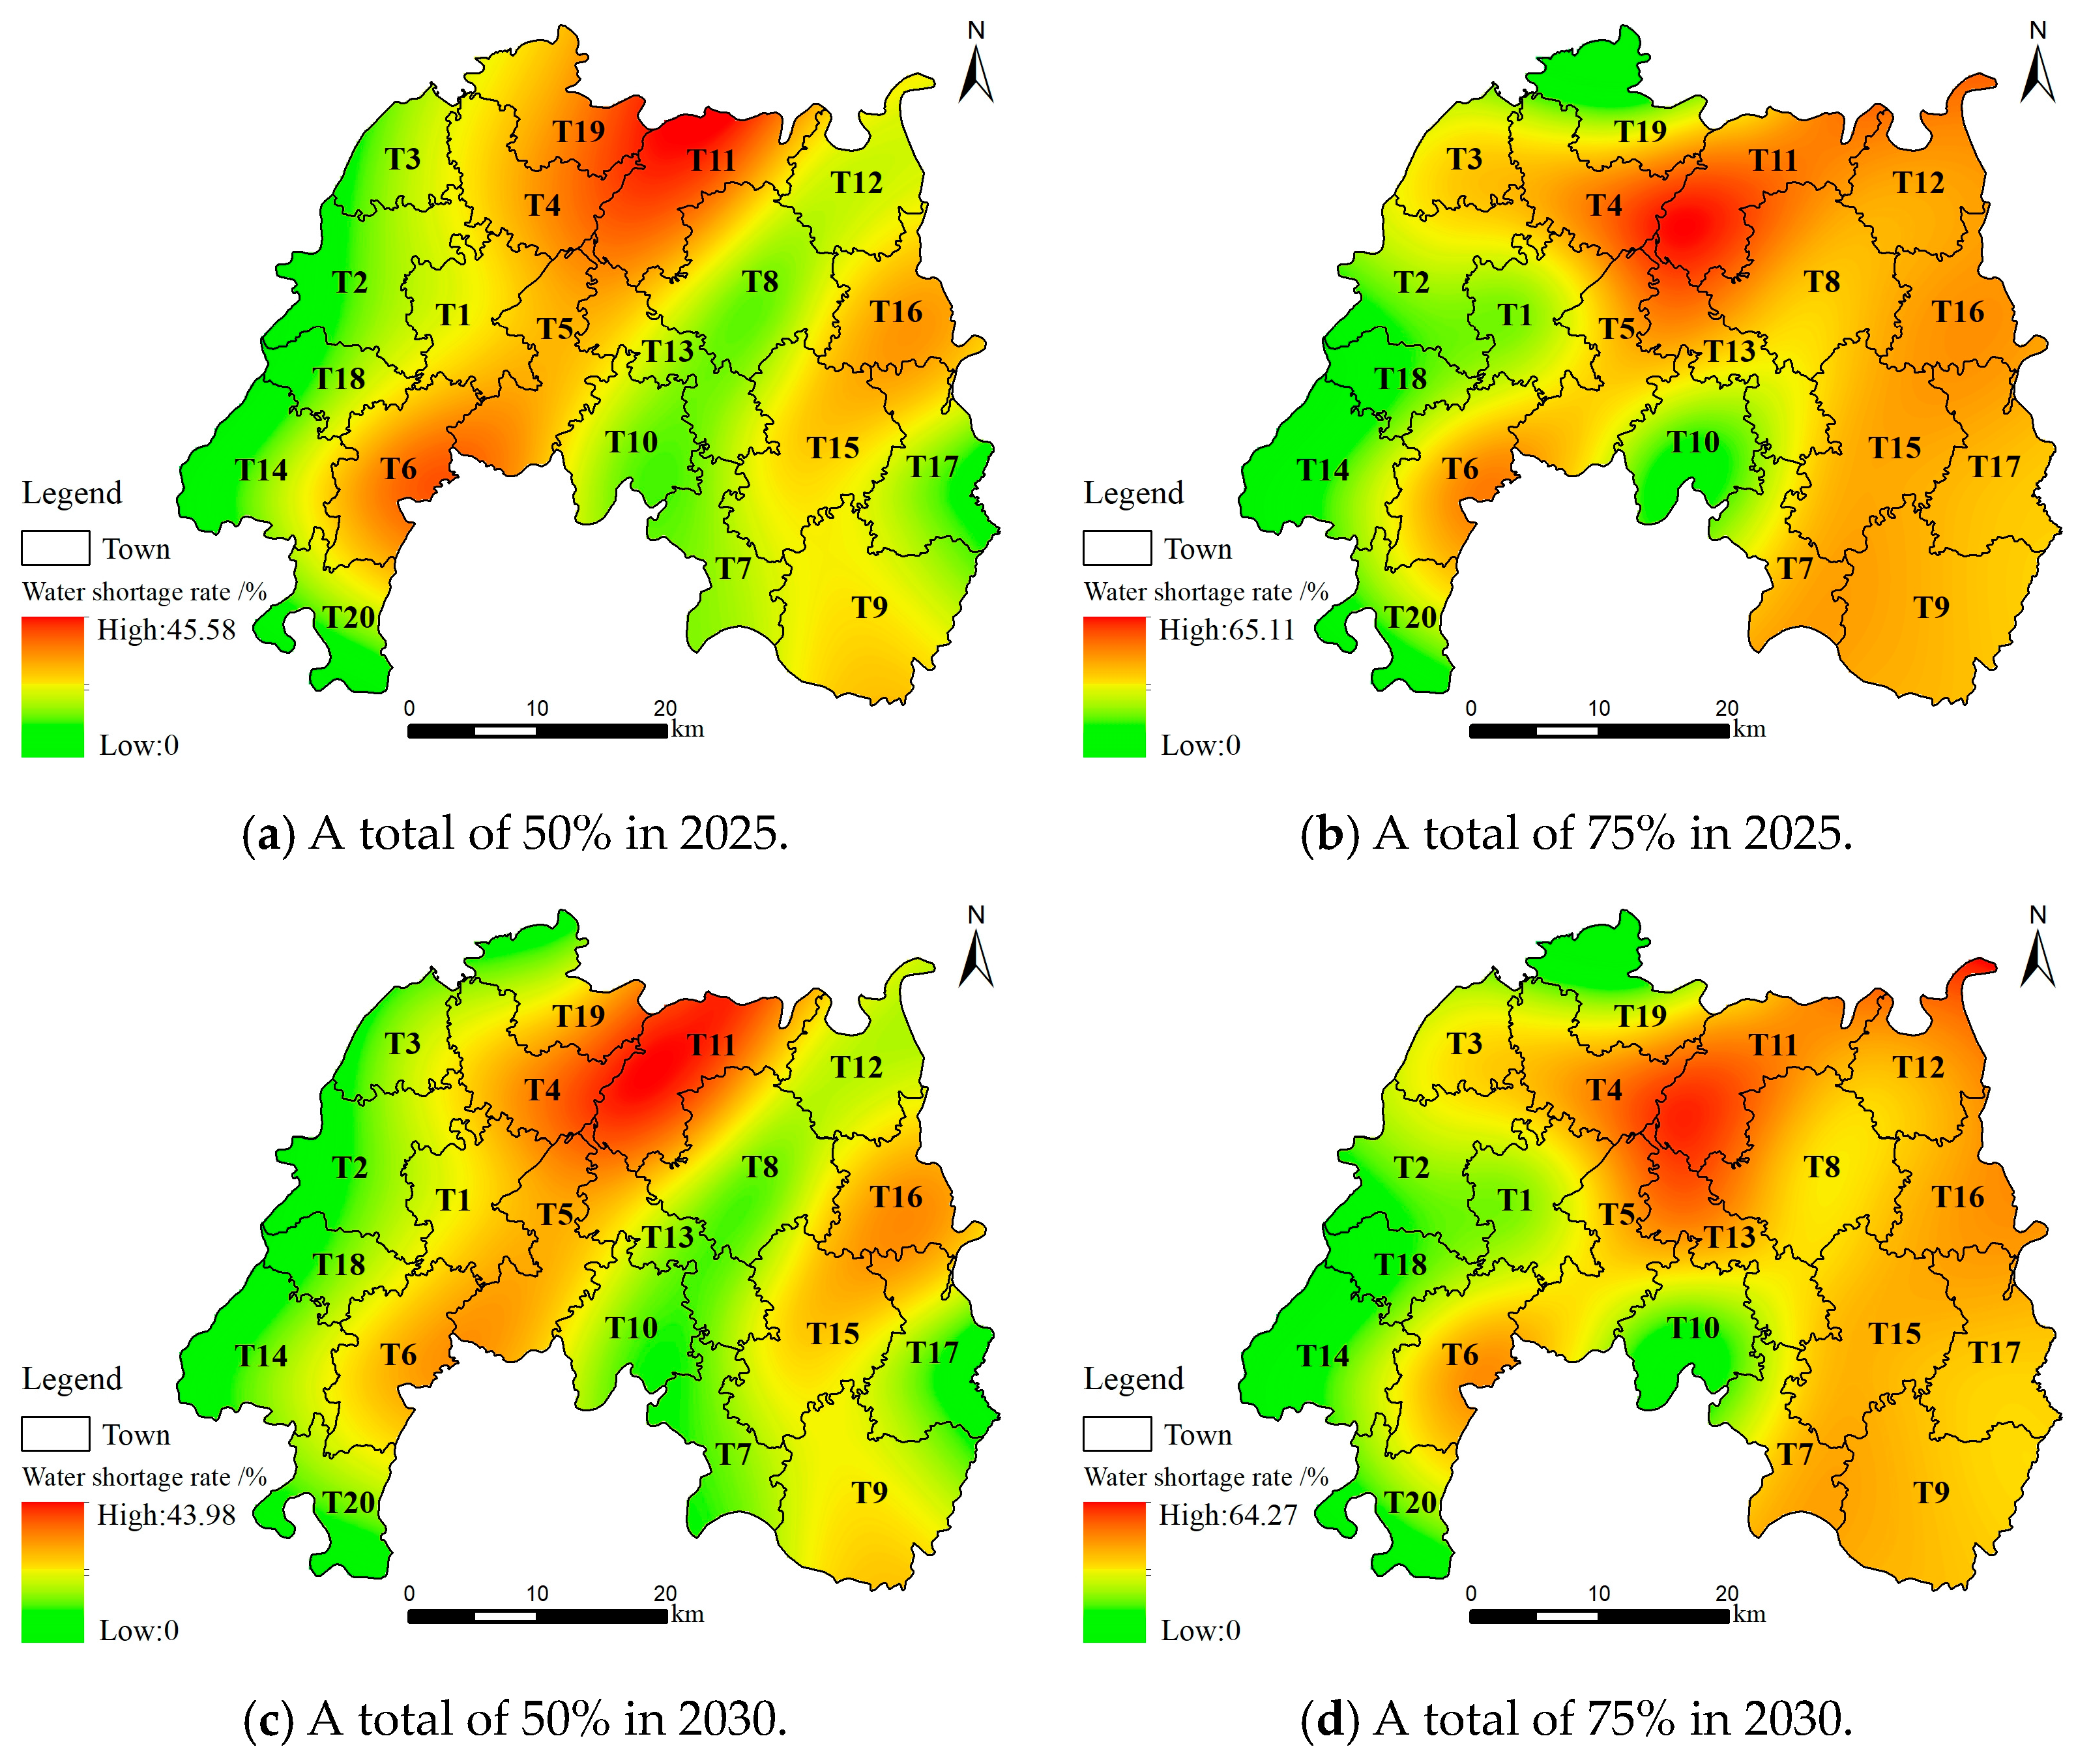
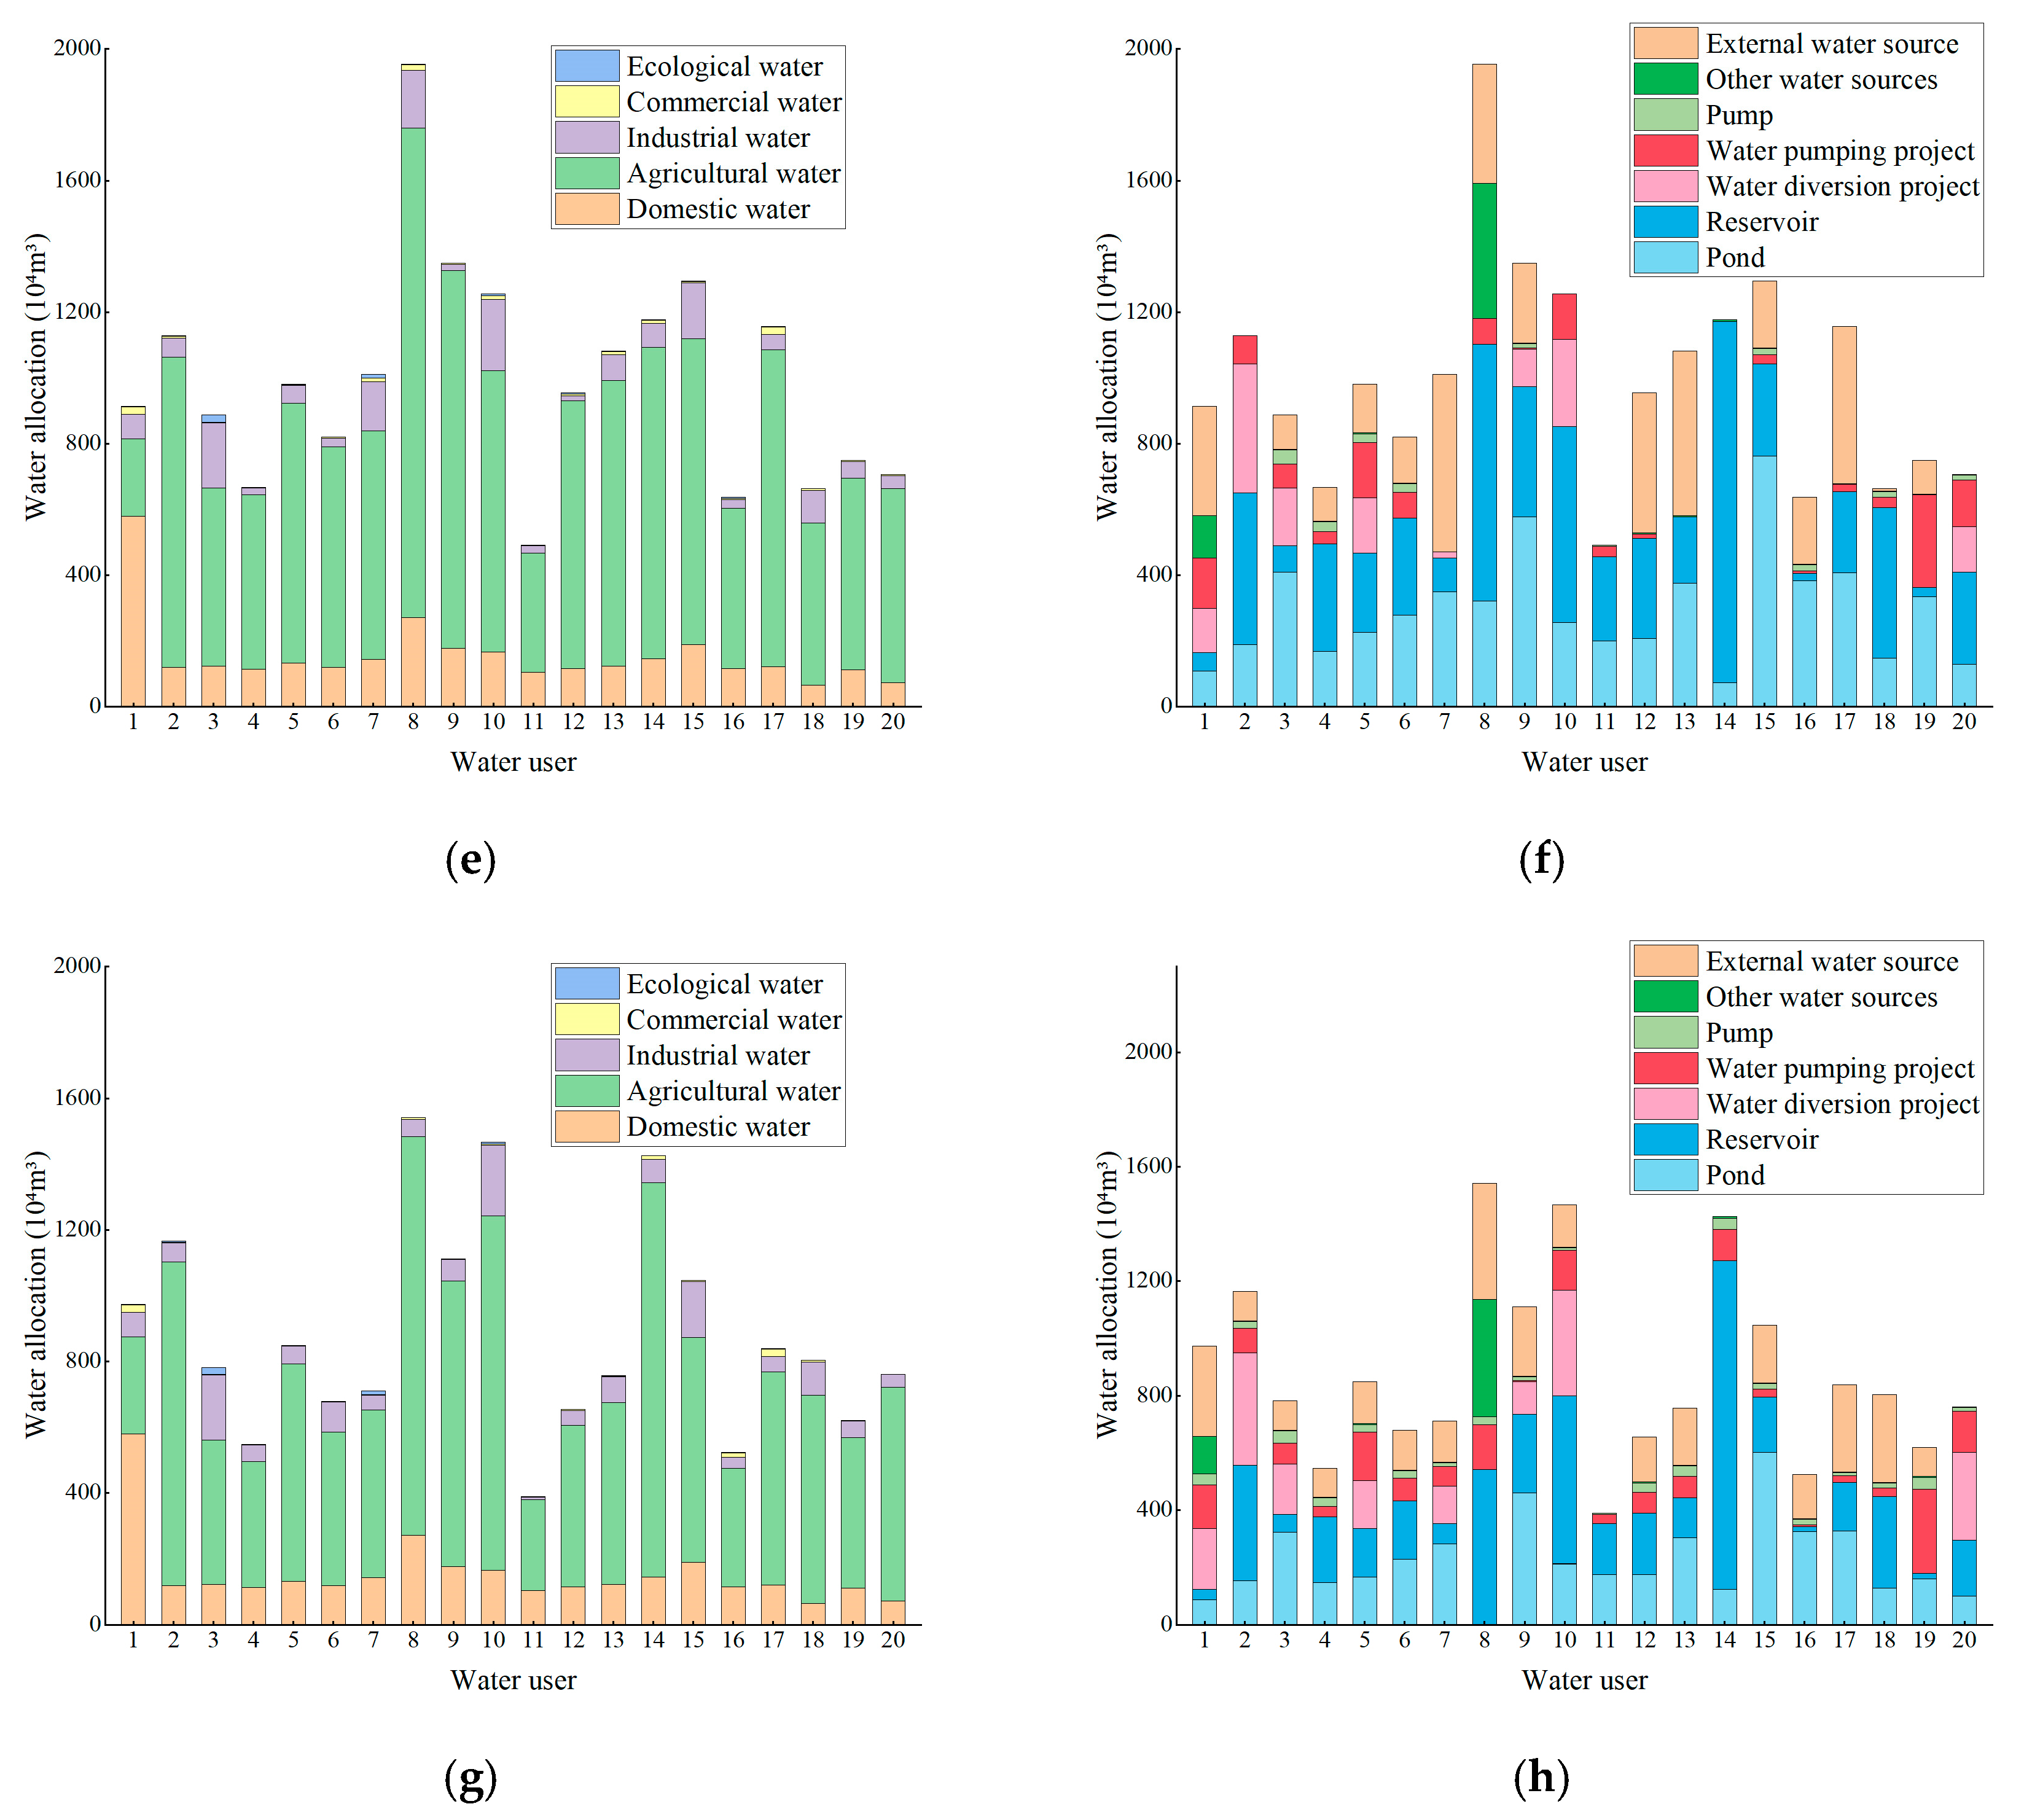
4.1. Analysis of Initial Allocation Results of Water Rights
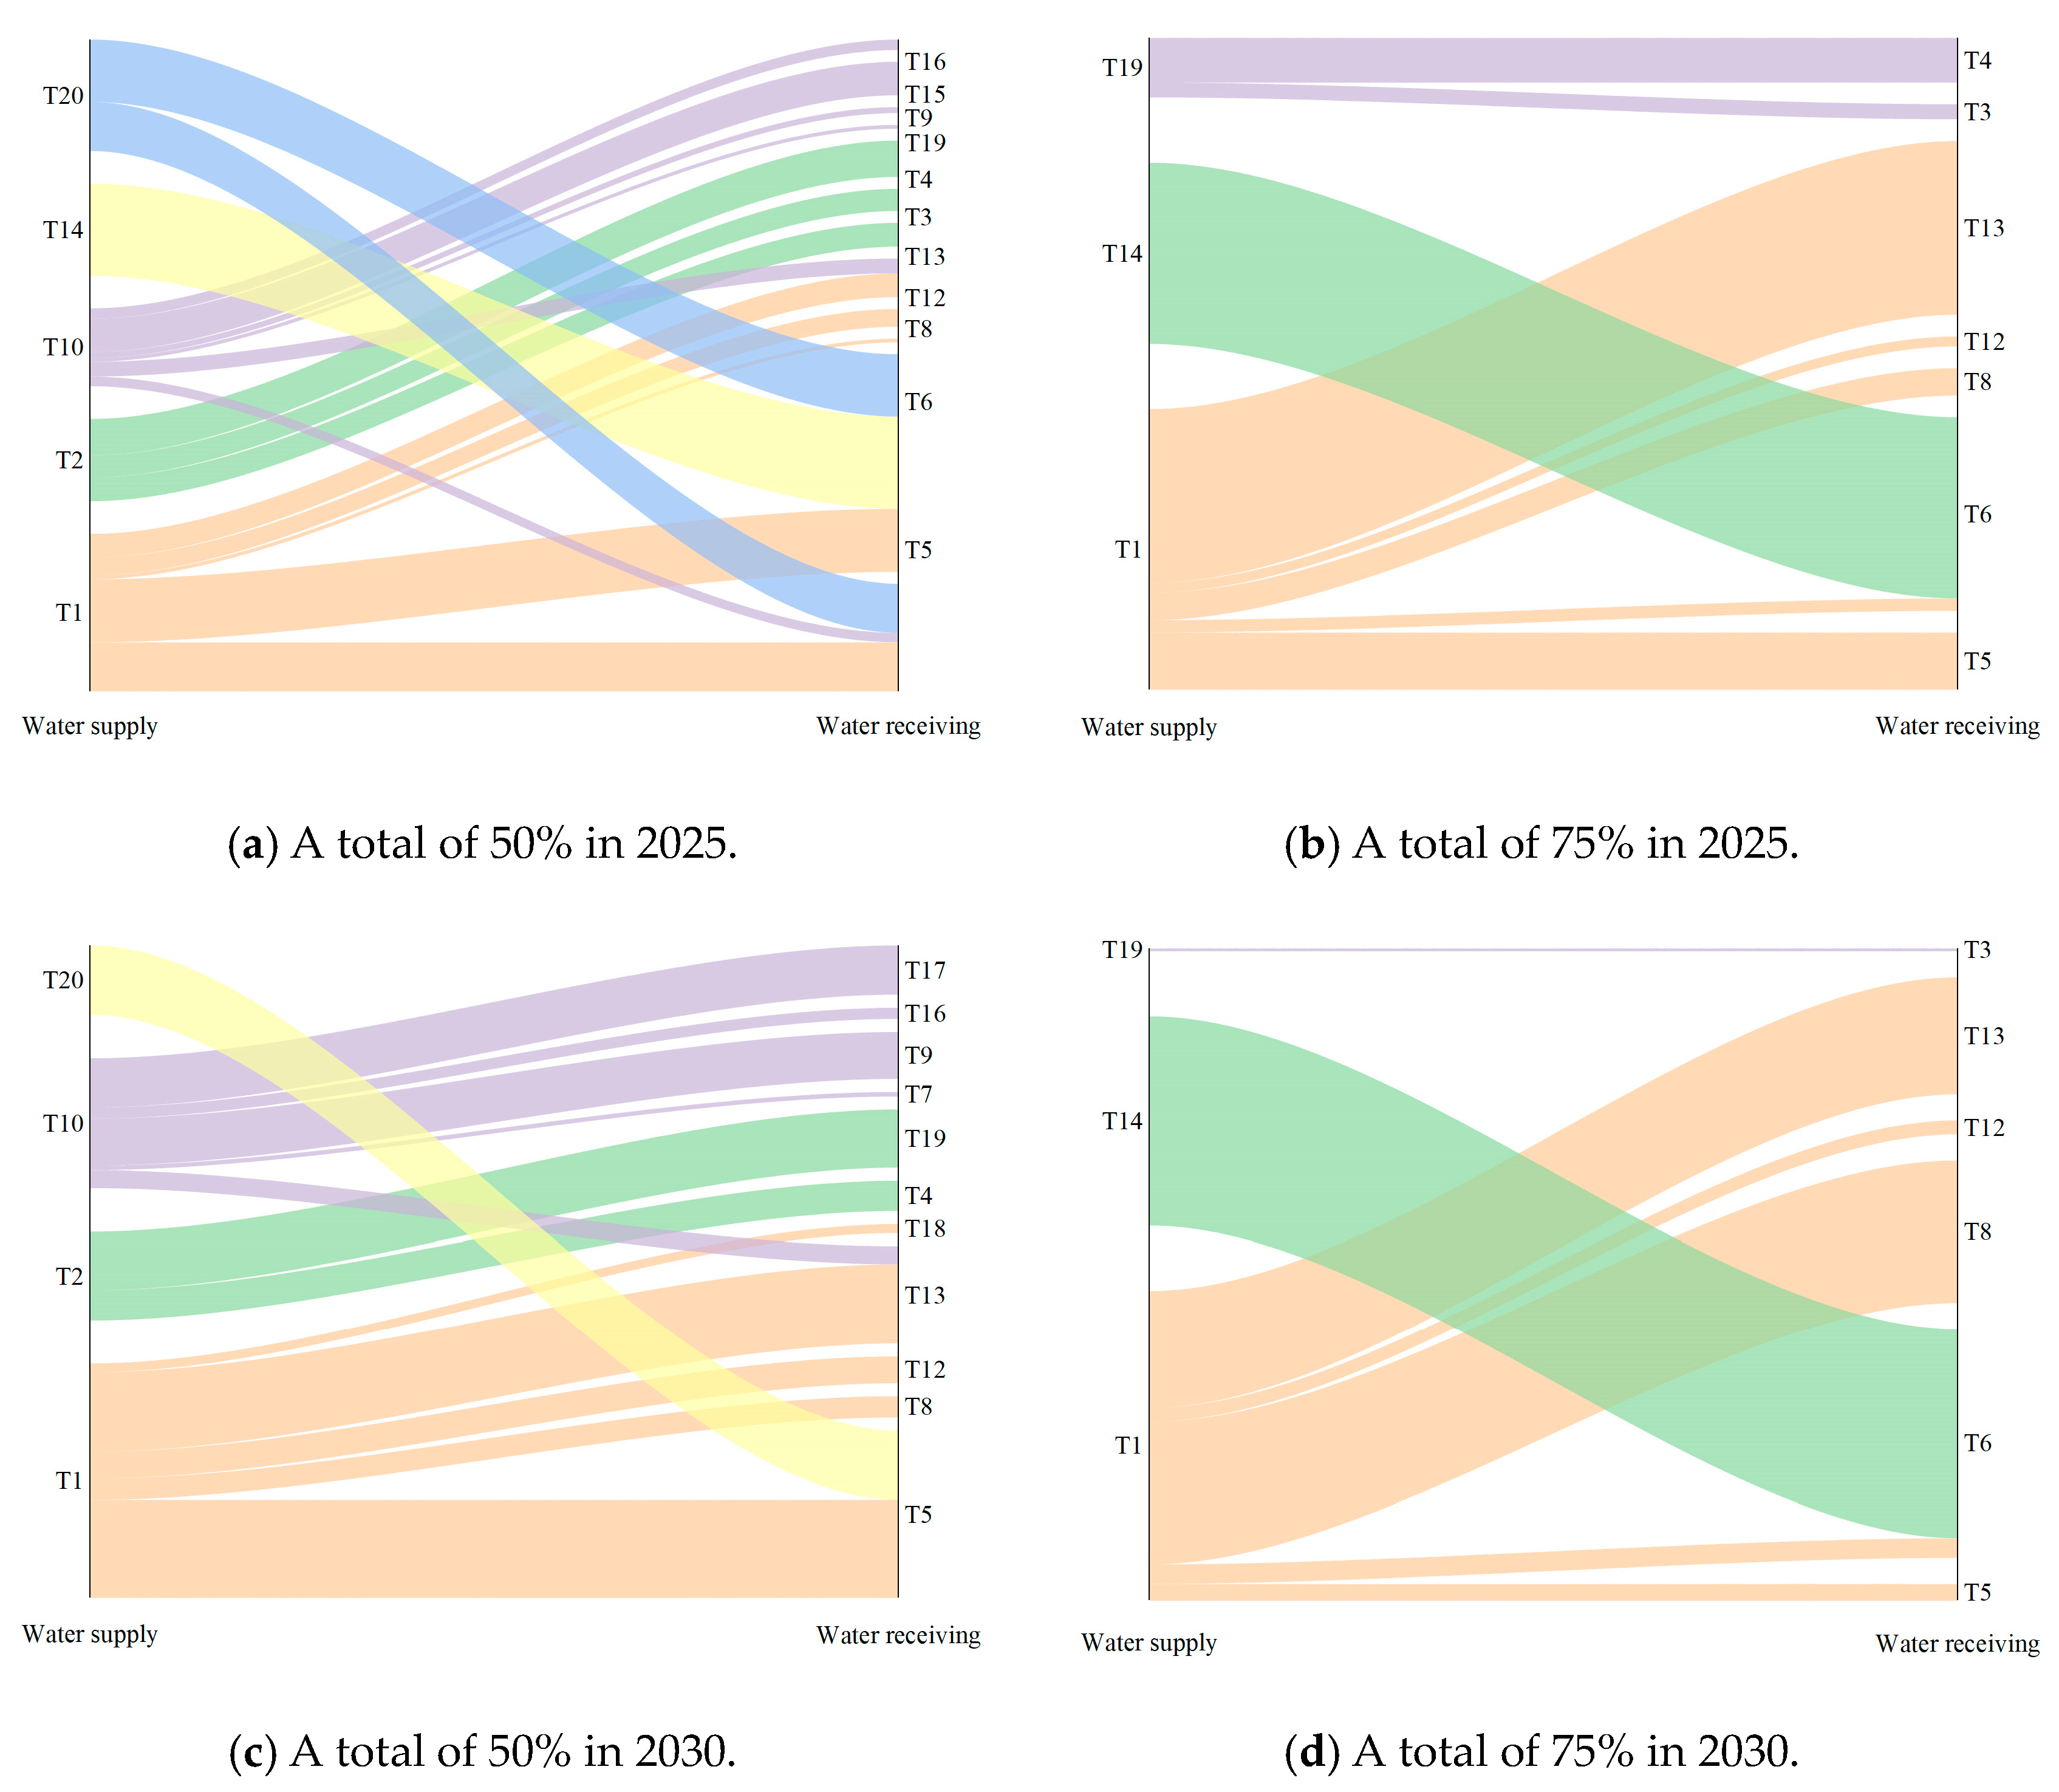
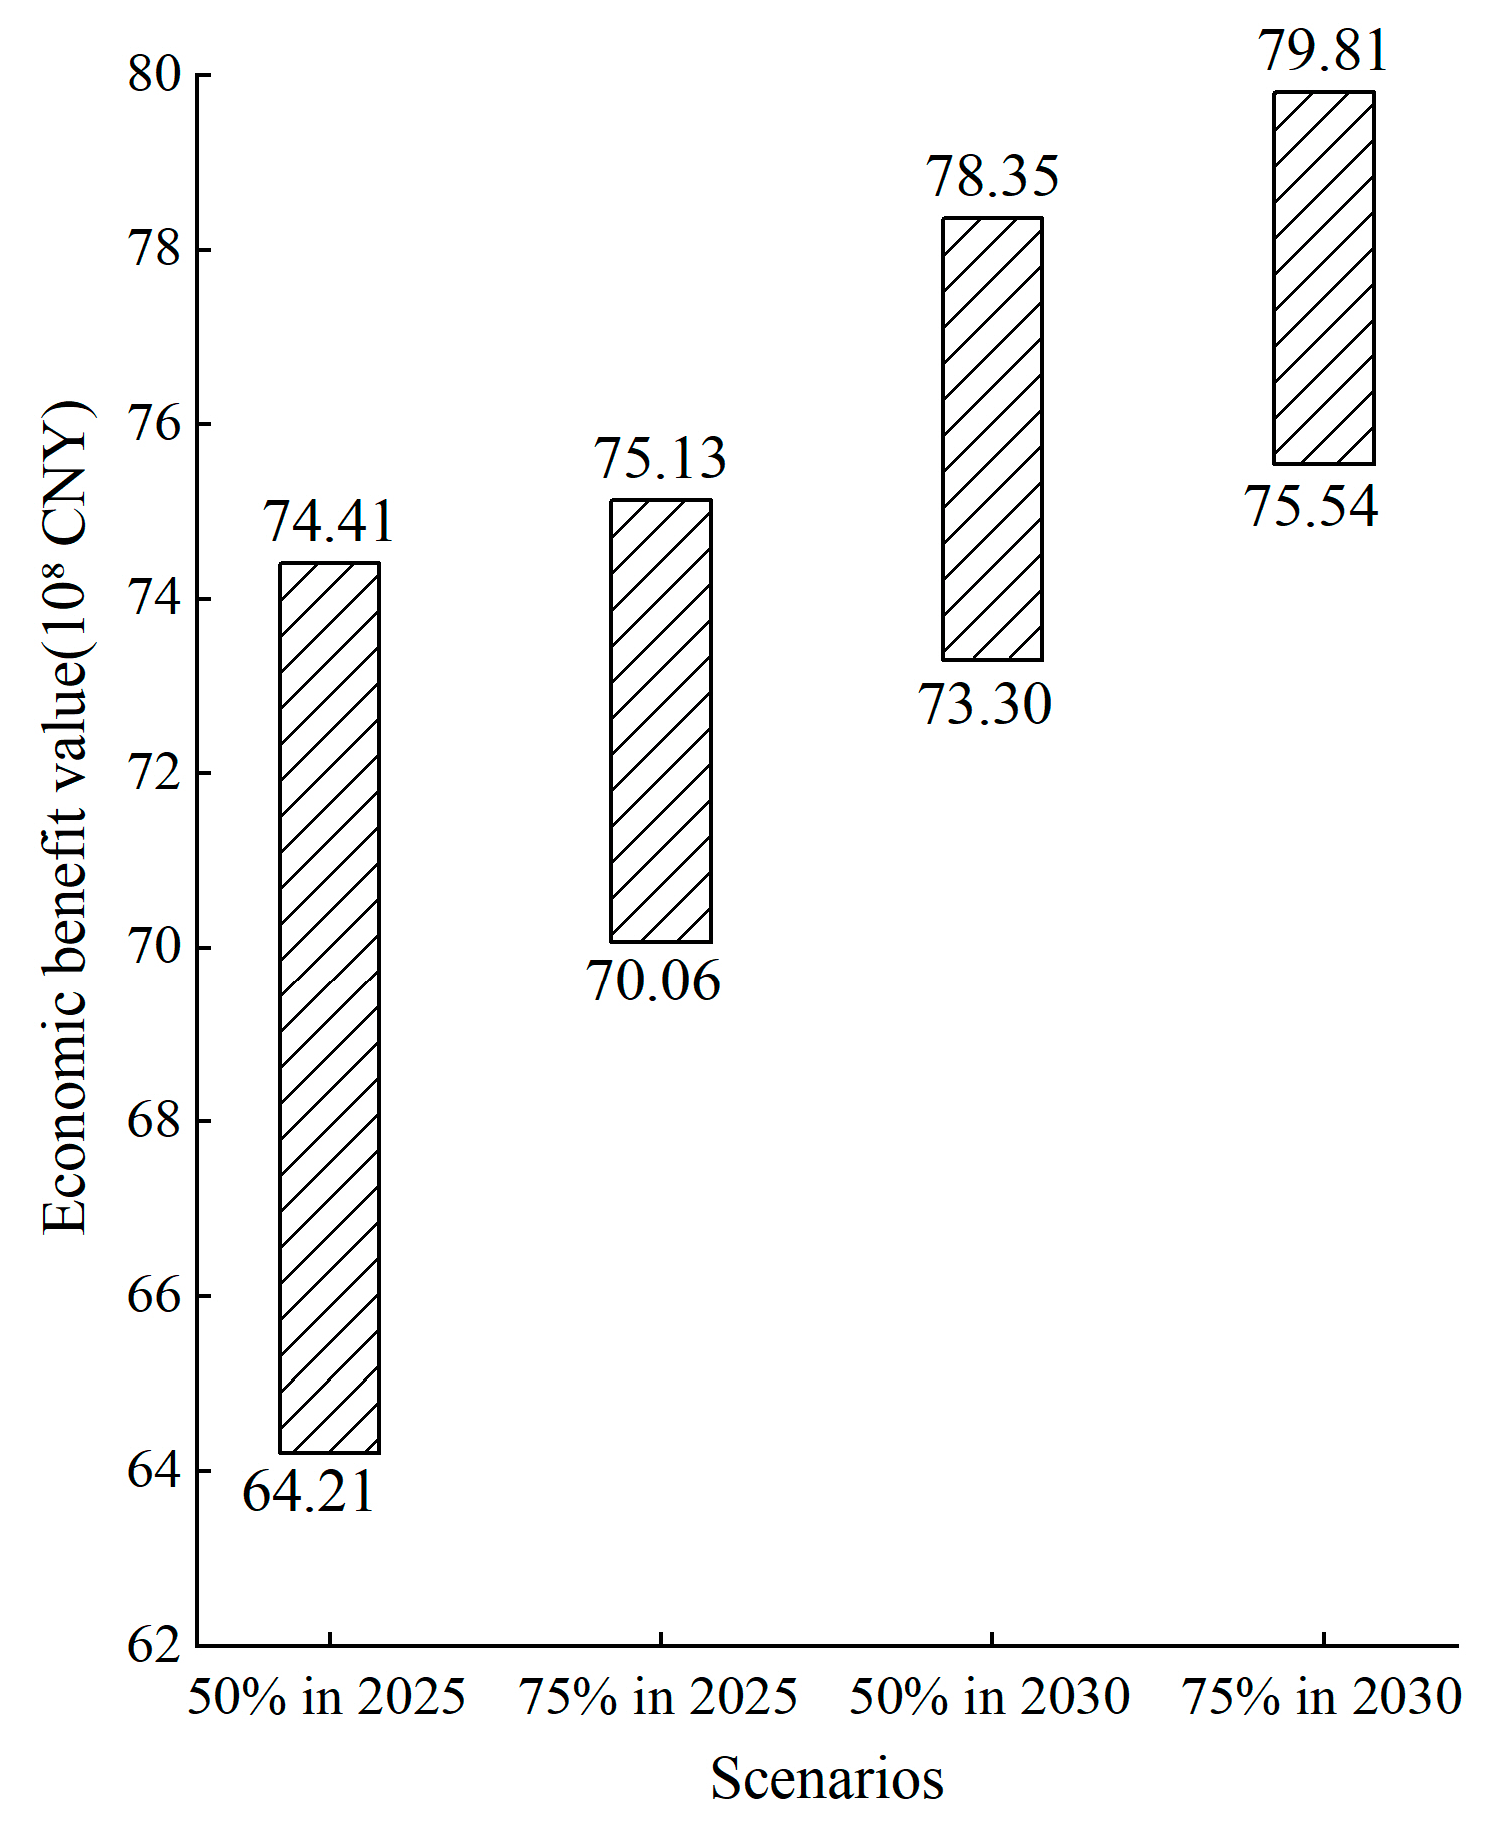
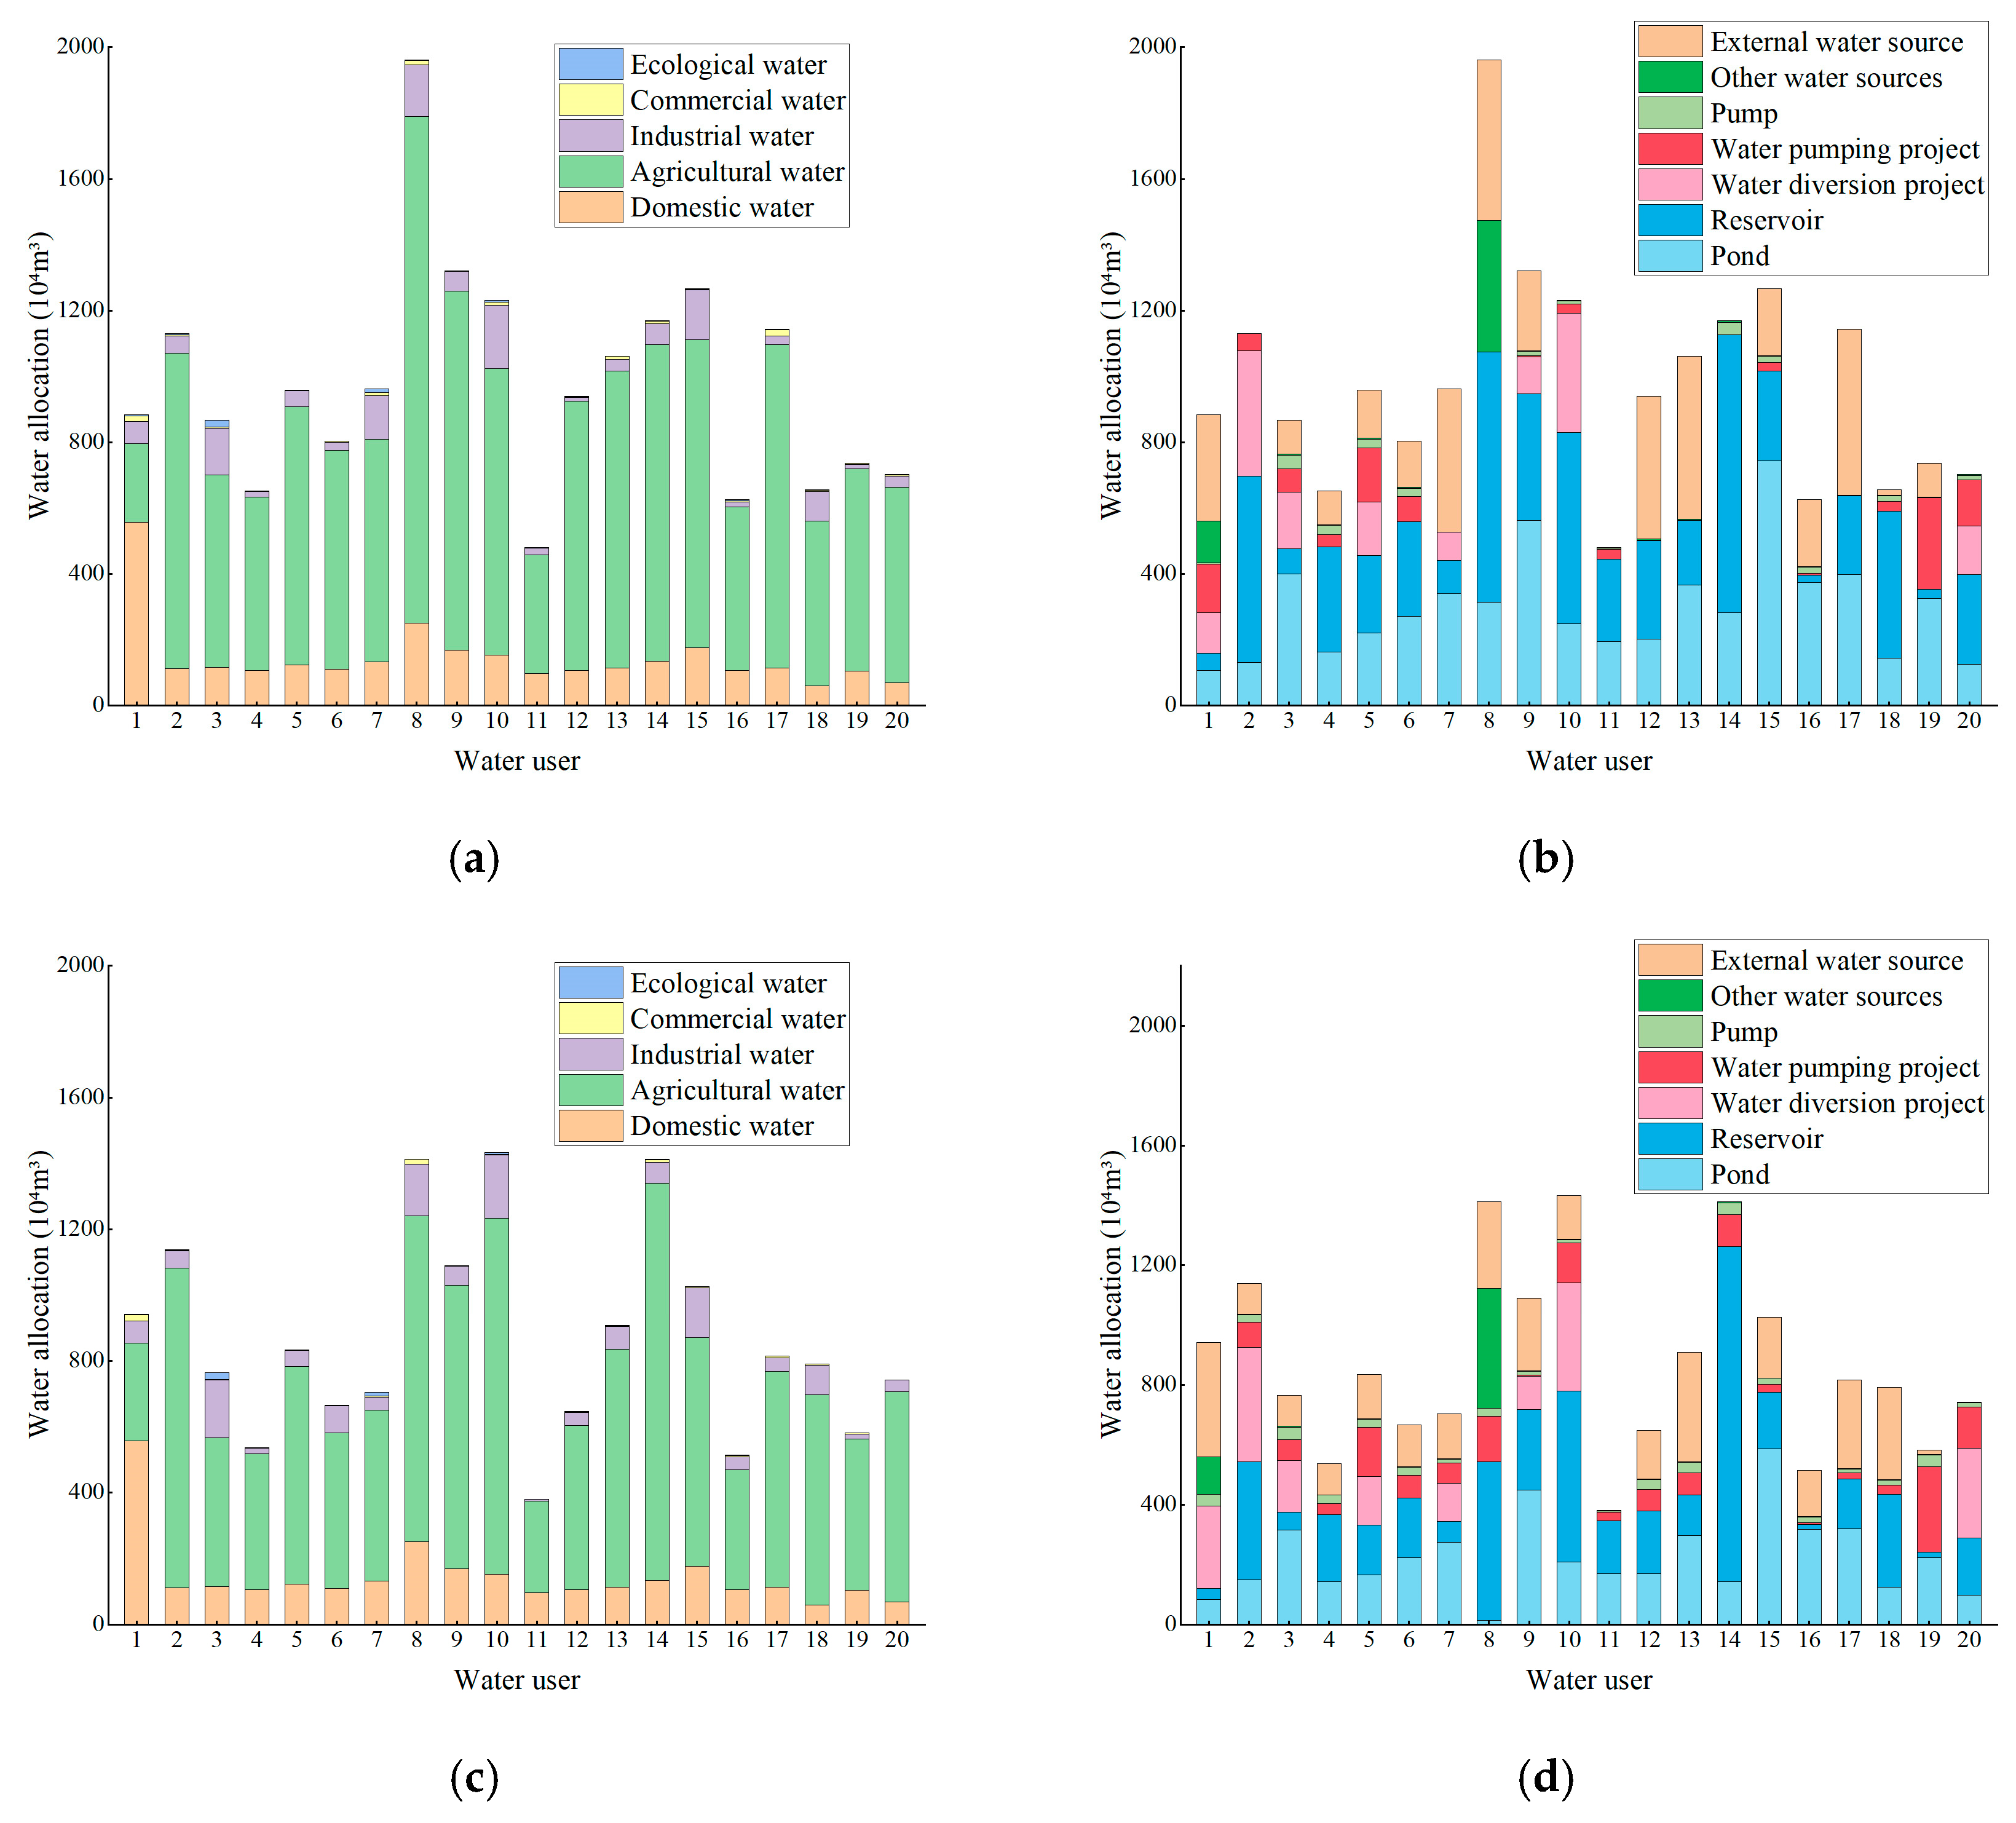
4.2. Analysis of Water Rights Trading Results
5. Conclusions
Author Contributions
Funding
Institutional Review Board Statement
Informed Consent Statement
Data Availability Statement
Conflicts of Interest
References
- Tan, L. Research on the Calculation Model of Binary Water Right Transaction Price Driven by Agricultural Water Saving in Irrigation Area. Master’s Thesis, Zhengzhou University, Zhengzhou, China, 2019. [Google Scholar]
- The United Nations. World Water Development Report 2015-Water for a Sustainable World; The United Nations Educational, Scientific and Cultural Organization: Paris, France, 2019. [Google Scholar]
- The United Nations. World Water Development Report 2019-Leaving No One Behind; The United Nations Educational, Scientific and Cultural Organization: Paris, France, 2019. [Google Scholar]
- Wu, F.P.; Li, Y. Research on the basic pricing model of water rights trading based on the shadow price of buyers and sellers. Soft Sci. 2019, 33, 85–89. [Google Scholar]
- Zheng, H.; Liu, Y.Y.; Zhao, J.S. Understanding water rights and water trading systems in China: A systematic framework. Water Secur. 2021, 13, 100094. [Google Scholar] [CrossRef]
- Yue, G.F.; Fu, Q.; Zhao, K.; Li, T.X. Research on water rights trading model based on interval programming. J. Northeast Agric. Univ. 2016, 47, 102–108. [Google Scholar]
- Rosegrant, M.W.; Binswanger, H.P. Markets in tradable water rights: Potential for efficiency gains in developing country water resource allocation. World Dev. 1994, 22, 1613–1625. [Google Scholar] [CrossRef]
- Pigram, J.J. Economic Instruments in the Management of Australia’s Water Resources: A Critical View. Int. J. Water Resour. Dev. 1999, 15, 493–509. [Google Scholar] [CrossRef]
- Grafton, R.Q.; Libecap, G.D.; Edwards, E.C.; Bob, R.J.; Landry, C. A Comparative Assessment of Water Markets: Insights from the Murray-Darling Basin of Australia and the Western US. ICER Work. Pap. 2012, 14, 175–193. [Google Scholar] [CrossRef]
- Galioto, F.; Guerra, E.; Raggi, M.; Viaggi, D. The impact of new regulations on water pricing in the agricultural sector: A case study from Northern Italy. Agric. Econ. Rev. 2017, 18, 77–95. [Google Scholar]
- Banihabib, M.E.; Tabari, M.M.R. Development of a Fuzzy Multi-Objective Heuristic Model for Optimum Water Allocation. Water Resour. Manag. 2019, 33, 3673–3689. [Google Scholar] [CrossRef]
- Kazemi, M.; Bozorg-Haddad, O.; Fallah-Mehdipour, E.; Chu, X.F. Optimal water resources allocation in transboundary river basins according to hydropolitical consideration. Environ. Dev. Sustain. 2021, 24, 1188–1206. [Google Scholar] [CrossRef]
- Maksud, B.; Anik, B.; Claudia, R. Potential gains from water rights trading in the Aral Sea Basin. Agric. Water Manag. 2015, 152, 41–56. [Google Scholar]
- Hartwig, L.D.; Jackson, S.; Smart James, C.R.; Osborne, N. Water trading by Aboriginal organisations in NSW, Australia. J. Rural Stud. 2023, 100, 102997. [Google Scholar] [CrossRef]
- Grantham, T.E.; Viers, J.H. 100 years of California’s water rights system: Patterns, trends and uncertainty. Environ. Res. Lett. 2014, 9, 084012. [Google Scholar] [CrossRef]
- Berck, P.; Lipow, J. Real and ideal water rights: The prospects for water-rights reform in Israel, Gaza, and the West Bank. Resour. Energy Econ. 1994, 16, 287–301. [Google Scholar] [CrossRef]
- Murthy, S.L.; Williams, M.; Baskin, E. The Human Right to Water in Israel: A Case Study of the Unrecognised Bedouin Villages in the Negev. Isr. Law Rev. 2012, 46, 25–59. [Google Scholar] [CrossRef]
- Poirier, R.; Schartmueller, D. Indigenous water rights in Australia. Soc. Sci. J. 2012, 49, 317–324. [Google Scholar] [CrossRef]
- Mckay, J. Water institutional reforms in Australia. Water Policy 2005, 7, 35–52. [Google Scholar] [CrossRef]
- Brennan, D. Water policy reform in Australia: Lessons from the Victorian seasonal water market. Agric. Resour. Econ. 2006, 50, 403–423. [Google Scholar] [CrossRef]
- Ghosh, S.; Cobourn, K.M.; Elbakidze, L. Water banking, conjunctive administration, and drought: The interaction of water markets and prior appropriation in southeastern Idaho. Water Resour. Res. 2015, 50, 6927–6949. [Google Scholar] [CrossRef]
- Fu, Q.; Zhao, K.; Liu, D.; Jiang, Q.X.; Li, T.X.; Zhu, C.H. The Application of a Water Rights Trading Model Based on two-Stage Interval-Parameter Stochastic Programming. Water Resour. Manag. 2016, 30, 2227–2243. [Google Scholar] [CrossRef]
- Wu, D.; Ma, C. Regional interest game and optimization model based on initial allocation of water rights. Peoples Yellow River 2018, 40, 40–45+55. [Google Scholar]
- Chen, X.N.; Wu, F.P.; Li, F.; Zhao, Y.; Xu, X. Prediction and analysis of water rights trading volume: Based on the water rights trading in Inner Mongolia, China. Agric. Water Manag. 2022, 272, 107803. [Google Scholar] [CrossRef]
- Qin, C.H.; Jiang, S.; Zhao, Y.; Zhu, Y.N.; Wang, Q.M.; Wang, L.Z.; Qu, J.L.; Wang, M. Research on Water Rights Trading and Pricing Model between Agriculture and Energy Development in Ningxia, China. Sustainability 2022, 14, 15748. [Google Scholar] [CrossRef]
- Wang, C.S. Research on Optimal Allocation of Water Resources in Wu’an City Based on GWAS Model; Hebei University of Engineering: Handan, China, 2022. [Google Scholar]
- Luan, Q.H.; Gao, H.Y.; Liu, H.L.; He, L.X.; Ma, J.; Wang, C.S. Optimal allocation of water resources in Wu’an City based on GWAS model. Water Resour. Prot. 2023, 39, 32–42. [Google Scholar]
- Sang, X.F.; Wang, H.; Wang, J.H.; Zhao, Y.; Zhou, Z.H. Water Resources Integrated Simulation and Allocation Model WAS (Ⅰ): Model Principle and Construction. J. Hydraul. Eng. 2018, 49, 1451–1459. [Google Scholar]
- Sang, X.F.; Zhao, Y.; Zhai, Z.L.; Chang, H.Y. Water Resources Integrated Simulation and Allocation Model WAS (Ⅱ): Application. J. Hydraul. Eng. 2019, 50, 201–208. [Google Scholar]
- National Bureau of Statistics. China Statistical Yearbook; China Statistical Press: Beijing, China, 2020.
- Zhang, F.Y.; Wu, Z.N.; Di, D.Y.; Wang, H.L. Water resources allocation based on water resources supply-demand forecast and comprehensive values of water resources. J. Hydrol. Reg. Stud. 2023, 47, 101421. [Google Scholar] [CrossRef]


| Water Supply Towns | Penalty Water Price (CNY/m3) | Water Receiving Towns | Trading Water Volume (104 m3) | Trading Water Price (CNY/m3) | ||||||
|---|---|---|---|---|---|---|---|---|---|---|
| Agriculture | Industry | Business | Agriculture | Industry | Business | Agriculture | Industry | Business | ||
| T1 | 0.28 | 3.60 | 6.43 | T5 | 61.68 | 0 | 4.80 | 0.18 | 0 | 4.38 |
| T6 | 27.37 | 50.63 | 5.50 | 0.26 | 2.82 | 4.35 | ||||
| T8 | 4.70 | 0 | 0 | 0.32 | 0 | 0 | ||||
| T12 | 0 | 20.22 | 3.99 | 0 | 3.82 | 4.42 | ||||
| T13 | 0 | 32.06 | 0 | 0 | 3.40 | 0 | ||||
| T18 | 0 | 0 | 0 | 0 | 0 | 0 | ||||
| T2 | 0.43 | 1.71 | 6.31 | T3 | 0 | 25.73 | 6.03 | 0 | 3.62 | 4.33 |
| T4 | 0 | 26.96 | 3.50 | 0 | 3.57 | 4.44 | ||||
| T19 | 17.45 | 31.33 | 0 | 0.29 | 3.42 | 0 | ||||
| T10 | 0.47 | 2.18 | 5.29 | T5 | 8.19 | 0 | 4.80 | 0.31 | 0 | 4.38 |
| T7 | 0 | 0 | 0 | 0 | 0 | 0 | ||||
| T9 | 0 | 0 | 4.69 | 0 | 0 | 4.39 | ||||
| T13 | 0 | 19.85 | 0 | 0 | 3.84 | 0 | ||||
| T15 | 0 | 0 | 8.21 | 0 | 0 | 4.24 | ||||
| T16 | 0 | 38.39 | 6.81 | 0 | 3.19 | 4.30 | ||||
| T17 | 0 | 14.43 | 0 | 0 | 4.05 | 0 | ||||
| T14 | 0.45 | 6.43 | 6.84 | T6 | 68.27 | 50.63 | 5.50 | 0.17 | 2.82 | 4.35 |
| T18 | 0 | 0 | 0 | 0 | 0 | 0 | ||||
| T20 | 0.21 | 4.66 | 6.43 | T5 | 61.68 | 0 | 4.80 | 0.18 | 0 | 4.38 |
| T6 | 28.12 | 50.63 | 5.50 | 0.26 | 2.82 | 4.35 | ||||
| Total | 211.50 | 360.86 | 64.13 | |||||||
| Water Supply Towns | Penalty Water Price (CNY/m3) | Water Receiving Towns | Trading Water Volume (104 m3) | Trading Water Price (CNY/m3) | ||||||
|---|---|---|---|---|---|---|---|---|---|---|
| Agriculture | Industry | Business | Agriculture | Industry | Business | Agriculture | Industry | Business | ||
| T1 | 0.09 | 7.02 | 5.71 | T5 | 18.57 | 0 | 4.80 | 0.28 | 0 | 4.38 |
| T6 | 0 | 0 | 5.50 | 0 | 0 | 4.35 | ||||
| T8 | 11.47 | 0 | 0 | 0.30 | 0 | 0 | ||||
| T12 | 0 | 0 | 3.99 | 0 | 0 | 4.42 | ||||
| T13 | 65.31 | 0 | 5.59 | 0.18 | 0 | 4.35 | ||||
| T18 | 0 | 0 | 0 | 0 | 0 | 0 | ||||
| T14 | 0.11 | 7.02 | 6.47 | T6 | 68.27 | 0 | 5.50 | 0.17 | 0 | 4.35 |
| T18 | 0 | 0 | 0 | 0 | 0 | 0 | ||||
| T19 | 0.51 | 1.77 | 5.16 | T3 | 0 | 0 | 0 | 0 | 0 | 0 |
| T4 | 0 | 0 | 6.03 | 0 | 0 | 4.33 | ||||
| T19 | 0 | 17.89 | 0 | 0 | 3.91 | 0 | ||||
| Total | 163.64 | 17.89 | 31.40 | |||||||
Disclaimer/Publisher’s Note: The statements, opinions and data contained in all publications are solely those of the individual author(s) and contributor(s) and not of MDPI and/or the editor(s). MDPI and/or the editor(s) disclaim responsibility for any injury to people or property resulting from any ideas, methods, instructions or products referred to in the content. |
© 2023 by the authors. Licensee MDPI, Basel, Switzerland. This article is an open access article distributed under the terms and conditions of the Creative Commons Attribution (CC BY) license (https://creativecommons.org/licenses/by/4.0/).
Share and Cite
Wang, G.; Zhang, X.; Du, L.; Lei, B.; Xu, Z. Study on the Optimal Allocation of Water Resources Based on the Perspective of Water Rights Trading. Sustainability 2023, 15, 16214. https://doi.org/10.3390/su152316214
Wang G, Zhang X, Du L, Lei B, Xu Z. Study on the Optimal Allocation of Water Resources Based on the Perspective of Water Rights Trading. Sustainability. 2023; 15(23):16214. https://doi.org/10.3390/su152316214
Chicago/Turabian StyleWang, Guangyao, Xinyue Zhang, Lijuan Du, Bo Lei, and Zhenghe Xu. 2023. "Study on the Optimal Allocation of Water Resources Based on the Perspective of Water Rights Trading" Sustainability 15, no. 23: 16214. https://doi.org/10.3390/su152316214
APA StyleWang, G., Zhang, X., Du, L., Lei, B., & Xu, Z. (2023). Study on the Optimal Allocation of Water Resources Based on the Perspective of Water Rights Trading. Sustainability, 15(23), 16214. https://doi.org/10.3390/su152316214