Abstract
China, as the world’s largest energy consumer, is faced with the growing pressure of carbon emission reduction. Promoting the sustainable transformation of the economy and society has become a major concern for all sectors of society. This paper assesses the potential impacts of industrial added value on energy consumption and carbon dioxide (CO) emissions from 2010 to 2020 in China using a multi-objective, linear programming model. The results show that when the industrial energy consumption is 3695.17 Mtce and the industrial CO emission is 9364.16 Mt, the goal of energy saving and emission reduction can be achieved. This corresponds to an annual average growth rate limit of industrial added value of 7.8%. In addition, we find that when the annual average growth rate of industrial added value is greater than 9.9%, changes in the annual average growth rate of industrial added value have no impact on economic development. However, industrial energy consumption intensity and industrial carbon emission intensity decrease with the increase in the annual average growth rate of sub-sectors. This study proposes that energy conservation, emission reduction, and a realization of the sustainable transformation of industry scheme need to be achieved by the Chinese government in order to to continue to promote the development of several sectors with low industrial energy consumption intensity and low industrial carbon emission intensity through policy implications.
1. Introduction
The issues of massive energy consumption and associated carbon dioxide (CO) emissions in China have always been the focus of the world [1]. Since the signing of the United Nations Framework Convention on climate change in 1992, the control of greenhouse gas emissions, especially CO emissions, has focused global attention [2]. World Bank statistics showed that the world CO emissions have almost been in linear growth since 1960. In 2007, China’s CO emissions surpassed the United States’ with an amount of 59.6 million tons (Mt), ranking the top of the world [3,4]. These excessive CO emissions are closely related to the energy consumption in China. According to the BP world energy statistics yearbook, the statistics data showed that China had become the world’s largest energy consumption growth market for 15 consecutive years [5]. At present, China’s energy consumption has been at the forefront of the world [6]. Given the current situation of the unfinished industrialization process, China’s energy consumption and related CO emissions would continue to increase [7]. Remarkably, industry sectors associated with energy consumption were the major emitter of CO emissions, contributing around 69.44% of the energy consumption and 61.4% of the CO emissions in China [8]. What is more, the amount of industrial CO emissions in China have increased from 3405.2 Mt in 2000 to 8977.1 Mt in 2013, with an average annual growth rate (AAGR) of over 7% [9]. Faced with the severe pattern of growth in industrial sector, energy conservation and carbon emission reduction should be an urgent task of industrial sector and the Chinese government [10]. Fortunately, the Chinese government has formulated the 13th Five-Year Plan (2016–2020) nationwide, which promised to control the energy consumption and CO emissions effectively to achieve green, low-carbon and sustainable development, aiming to decrease CO emissions per unit of Gross Domestic Product (GDP) by 18% and to reduce energy consumption per unit of GDP by 15% compared with 2015 level [11]. To achieve these targets, the industrial sector, the main contributor of energy consumption and CO emissions, was considered as the main object for energy conservation and carbon emission reduction [12].
Some research focuses on the issues of industrial energy consumption and CO emissions from the perspective of industrial added value. Industrial added value is a statistical indicator that reflects the scale, speed, efficiency, and structure of industrial development. Xing et al. [13] explored the relationship between industrial added value and energy consumption by using the Granger causality test in China, indicating that the industrial growth was the cause of industrial energy consumption growth. The impacts of industrial added value on CO emissions are researched by [14], which concluded that the increase in industrial sectors would lead to an increase in CO emissions. When the food and tobacco sector added value increases by 1%, CO emissions will increase by 2.856%. Similarly, Wei and Zhou [15] considered that the industrial added value had a significantly positive correlation with CO emissions. Xu et al. [16] applied the method of Co-integration Analysis to study the relationship between CO emissions and added value of Chinese manufacturing industry by Augment Dickey–Fuller (ADF) sequence. Results indicated the added value of manufacturing had an influence on the CO emissions of the manufacturing industry. Hao and Huang [17] attempted to decouple the relationship of industrial added value, energy consumption and carbon dioxide emissions. Results showed that the industrial added value had a significantly positive correlation with energy consumption and CO emission.
Direct studies of industrial added value were less common in earlier works, and mainly research studies were limited to analyzing the relationship between industrial added value and several factors including energy consumption, CO emissions, etc. Fewer studies expounded the impacts of industrial added value on energy consumption and CO emissions by the adjustment of sub-sector industrial added value. In this paper, the multi-objective linear programming model is proposed to evaluate the impacts of industrial added value on energy consumption and CO emissions. On the premise of the realization of the economic goals, we further discussed which department had impacts on energy conservation and CO emission reduction. To be specific, these sectors were determined by comparing the initial proportion of the sub-sector industrial added value with the proportion after the optimization. The main aims of this article include the following two aspects: (1) to evaluate the potential impact of China’s industrial added value on energy consumption and carbon emissions during 2010–2020; (2) to establish the multi-objective linear programming model with economic development factors, industrial carbon emission factors, industrial energy consumption factors and industrial scale factors as constraints, and seek the direction of China’s industrial structure adjustment under the context of the coordinated development of economic and environmental goals through model solving.
The rest of this paper is structured as follows. Section 2 introduces the methodology, followed by the data sources and determination of specific parameters in the model in Section 3. Then, Section 4 reveals the solution and simulation. Subsequently, Section 5 shows the optimized results. At last, Section 6 provides conclusions and some policy suggestions.
2. Methodology
The multi-objective linear programming model usually can be used to deal with optimization problems. It can take conflicting and uncertain targets into account. Meanwhile, it can also maximizes the target value and minimizes the impact of other constraints. Over the past few decades, many researchers have adopted multi-objective linear programming to solve practical problems and achieve ideal results. Li et al. [18] distributed irrigation water based on the interval linear multi-objective programming (ILMP) model, considering conflicting objectives and uncertainties. Meanwhile, the tradeoffs of various crops in different conditions were analyzed. The effective linkages between revenue/output advancement and water saving was provided by this model. Zhang et al. [19] studied the LNG importing strategies by establishing a multi-objective programming model, which took varieties of factors into account. The established model provided an efficient portfolio strategy for LNG importing. Tsao et al. [20] proposed a multi-objective mathematical programming model for the network design of a sustainable supply chain under uncertain conditions. The established model was conducive to maximizing social benefits while minimizing economic costs and environmental effect. Fu et al. [21] obtained the optimal solutions by developing an inexact multi-objective programming model for regional economy–energy–environment system management. Results indicated that the linkages among the economy–energy–environment systems were provided effectively by the model. In this paper, we explore the impacts of industrial added value on energy consumption and CO emissions based on the multi-objective linear programming model, which considers the conflicting and uncertain objectives. Meanwhile, the optimization model takes several restrictive factors into account, including industrial energy consumption intensity (IECI) and industrial carbon emission intensity (ICEI).
2.1. Objectives of the Optimization Model
The determination of objectives is significant in optimization model [22]. Costa [23] proposed that economic development and environmental protection should be symbiotic. At present, China adheres to the concept that clear waters and lush mountains are invaluable assets. While promoting economic development, China is implementing a sustainable development strategy and promoting a comprehensive green transformation of economic and social development. In this model, the maximization of industrial added value is chosen as an economic objective, and the minimization of industrial CO emissions is chosen as a sustainable development objective.
Objective 1: Economic objective—maximization of industrial added value
Objective 2: Sustainable development objective—minimization of industrial CO emissions
where G represents industrial added value in the target year; denotes the decision variable which denotes industrial added value of sector i in the target year; C means the industrial CO emissions in the target year; denotes industrial carbon emission intensity of sector i in the target year; n is the number of industrial sectors.
2.2. Constraints of the Optimization Model
Economic development constraints: Since the Reform and Opening in 1978, a high-speed growth had taken place in China’s industrial sector, which supported domestic economic growth. In recent years, China’s industrial structure has been optimized and upgraded, and industry is in the middle- and high-speed development stage. In 2020, China’s industrial added value accounted for 34.31% of GDP. Remarkably, a new requirement for domestic economic growth has been put forward by the Chinese government in the 14th Five-Year Plan Period (2021–2025). Industrial added value should maintain steady development in a reasonable range to boost economic growth. In this article, we assume that industrial added value is exponential growth, and the annual average growth rate remains unchanged during the study period.
where represents industrial added value in the basic year; n is the number of sectors; and indicate the lowest and highest average annual growth rate of industrial added value, respectively; t means the time from the basic year to the target year [24].
Industrial CO emissions constraints: In 2007, China became the world’s largest producer of CO emissions with an amount of more than 6 billion tons [24]. The industrial sector played a dominant role in China’s CO emissions, and was also the focal point of energy conservation and emission reduction. In order to achieve the goal of sustainable economic development, the industrial CO emissions and industrial carbon emission intensity should be limited within a certain range. We assume that the carbon emission intensity of sector i remains unchanged, which is calculated by relevant data of the basic year.
where represents the total CO emissions in the basic year; n is the number of sectors; denotes the upper limit of the average annual growth rate (AAGR) of industrial CO emissions; indicates the reduction target of industrial carbon emission intensity to the target year [24,25].
Energy consumption constraints: China’s economic growth needed the promotion of the industrial sector. The industrial sector as the main source of energy consumption, accounting for 69.44% of China’s total energy consumption in 2014. Simultaneously, the massive industrial energy consumption has great pressure on environmental quality, resulting in a large amount of CO emissions. Therefore, restrictions placed on industrial energy consumption and industrial energy consumption intensity are necessary and significant in the process of the sustainable green transformation of industry. We assume that the energy consumption intensity of sector i remains unchanged, which is calculated by the relevant data of the basic year.
where E indicates the industrial energy consumption under standard coal in the target year; n is the number of sectors; denotes the industrial energy consumption under standard coal in the basic year; denotes the energy consumption intensity of sector i in the target year; represents the upper limit of the annual average growth rate of industrial energy consumption. represents the reduction target of industrial energy consumption intensity to the target year [25,26].
3. Data Sources and Determination of Specific Parameter Values in the Model
3.1. Data Sources
In this paper, the classification of the industrial sector and determination of industrial added value data are derived from the Chinese input–output table 2020, which is compiled by Chinese Input–Output Association. Mi et al. [22] and Sun et al. [25] introduced the structure of input–output table and adopted an input–output method to figure out the issues of energy consumption and CO emissions. For the convenience of research, the energy material data are converted into standard coal for calculation. The energy material data are selected as the basic data, which are derived from the China Statistical Yearbook 2020. The reference coefficient of various fossil energy conversion into standard coal is derived from the China Energy Statistics Yearbook 2016. The formula of energy consumption under standard coal is referred as follows:
where denotes the industrial energy consumption under standard coal at the basic year; n indicates the number of sectors; m indicates the number of fossil fuels; represents the energy material data; i means the category of departments; j means the types of fossil fuel; is the coefficient of standard coal.
The determination of CO emissions is crucial. In this paper, we calculate CO emissions according to the direct energy consumption method provided by Intergovernmental Panel on Climate Change (IPCC) [26]. The related calculation parameters of CO emissions are referred to Cheng [27]. The formula is referred as to follows:
where CO represents the industrial CO emissions (unit: Mt); j is the type of fossil fuel; m is the number of fossil fuel; represents the energy material data; represents the low calorific value; denotes carbon content provided by IPCC; means the rate of carbon oxidation and 44/12 is the conversion coefficient from carbon to carbon dioxide.
The related calculation parameters of CO emissions and the reference coefficient of various fossil energy conversion into standard coal are summarized in Table 1. The last column in Table 1 gives data on energy consumption by industry sector in 2020.

Table 1.
Correlation calculation parameters.
According to the parameters in Table 1 and the data of the statistical yearbook, the change curves of industrial carbon emission (in 100 million tons) and industrial added value (in CNY 1 billion) from 1995 to 2020 can be obtained, as shown in Figure 1a,b. As can be seen from Figure 1a, industrial carbon emissions showed an upward trend from 1995 to 2014, a downward trend from 2014 to 2016, and then an upward trend. As can be seen from Figure 1b, industrial added value has been on an upward trend during 1995–2020, but the upward trend began to slow down in 2018–2020.
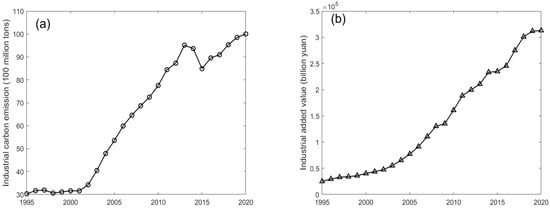
Figure 1.
The change curves of industrial carbon emission and industrial added value from 1995 to 2020, (a) the industrial carbon emission, (b) the industrial added value.
Notably, the changes in the Chemical Industry are obvious when the CO emissions in the sub-sectors are calculated. In order to ensure consistency of data, CO emissions from the Chemical Industry are the sum of five sub sectors in the China Statistical Yearbook 2015. Data from other sectors are not actually affected or changed. The 2010 is chosen as the basic year, and 2025 is chosen as the target year, which is the final year of 14th Five-Year Plan. The whole industry is divided into 23 sub-sectors. denotes the industrial added value of sector i in the target year.
We obtain the carbon emission data of 23 sub-sectors from 1995 to 2020, as shown in Figure 2.
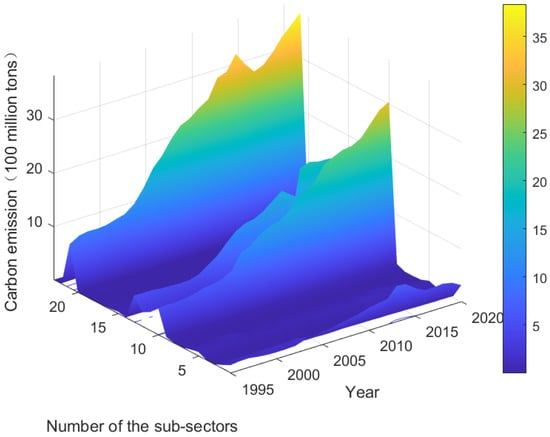
Figure 2.
The carbon emission data of 23 sub-sectors.
In this paper, we classify the departments in the grey area, A, into the high energy consumption intensity and carbon emission intensity departments. Sectors in region B are classified as low energy consumption intensity and carbon emission intensity departments. The distribution of sub-sectors based on the industrial energy consumption intensity and industrial carbon emission intensity is shown in Figure 3. The corresponding abbreviations and specific categories are shown in Table 2.
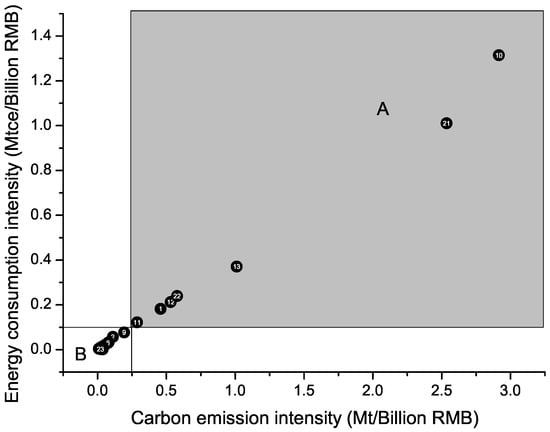
Figure 3.
The distribution of sub-sectors based on industrial carbon emission intensity and industrial energy consumption intensity.
Table 2.
Corresponding abbreviations and categories of the industrial sector.
3.2. Determination of Specific Parameter Values in the Model
Prospective analysis of the impact of the industrial added value on energy consumption and CO emissions. It is significant to determine the corresponding data in the model. In Section 2, there are six driving factors affect energy consumption and CO emissions. Their parameter values are obtained as follows.
The lowest average annual growth rate of the industrial added value (): Li [28] indicated that the proportion of industrial added value to GDP should exceed 30% by 2025. At this time, GDP would reach CNY 105712.2 billion, which was predicted by Liu [29]. According to the calculation, the annual average growth rate of the industrial added value will reach 6.74% from 2020 to 2025. In addition, the average annual growth rate of industrial added value was 7.12% from 2015 to 2020 based on the industrial added value data provided by China Statistical Bulletin 2020. Eventually, combined with the data of the average annual growth rate of the industrial added value in the two periods of time, the lowest average annual growth rate of industrial added value () during the period of 2015–2025 was determined as 6.93%.
The highest average annual growth rate of the industrial added value (): On the basis of historical data, the maximum average annual growth rate of the industrial added value was 10.8% from 2015 to 2020. Ren [30] considered that the growth of the industrial added value would slow down during the 14th Five-Year Plan period (2021–2025). Meanwhile, resources and environmental constraints have led to a reduction in the average annual growth rate of the industrial added value [31]. Therefore, the maximum average annual growth rate of industrial added value was not more than 10.8% during the 14th Five-Year Plan period (2021–2025). The average annual growth rate of the industrial added value was 7.12% from 2015 to 2020. The highest average annual growth rate of the industrial added value () was determined as 8.94% during the period of 2021–2025.
The upper limit of the average annual growth rate of industrial CO emissions (): Niu [32] concluded that the average annual growth rate of industrial CO emissions should be controlled within 5% in the period of 2010–2020. Moreover, Yang et al. [33] predicted the average annual growth rate of CO emissions would reach 4.42% from 2021 to 2025. Taking the target of CO emission reduction into account, The was determined as 4.42%.
The upper limit of the average annual growth rate of industrial energy consumption (): Sun and Liu [34] forecasted China’s industrial energy consumption and obtained the predicted results of 2970.99 Mtce and 4318.80 Mtce in 2020 and 2025, respectively. Meanwhile, industrial energy consumption in the statistical yearbook was 2802.06 Mtce in 2020. In the same year, there is little difference in the value of industrial energy consumption. Therefore, the predictive value 4318.80 Mtce of industrial energy consumption in 2025 can be referred. The was determined as 3.04%.
The reduction target of industrial carbon emission intensity (): During 2015–2020 and 2021–2025 period, the Chinese government identified the target of industrial carbon emission intensity decrease by 21% and 22%, respectively [35]. Up to now, the actual reduction data of industrial carbon emission intensity from 2015 to 2020 is insufficient. Therefore, we take the setting target as a reference value from 2021 to 2025. The was determined as 38.38%.
The reduction target of industrial energy consumption intensity (): During the periods 2015–2020 and 2021–2025, the Chinese government identified targets of industrial energy consumption intensity decrease as 28% and 18%, respectively [35]. Up to now, the actual reduction data of industrial energy consumption intensity from 2015 to 2020 are insufficient. Therefore, we take the setting target as a reference value from 2021 to 2025. The was determined as 40.96%.
The multi-objective linear programming model was constructed more specifically as follows:
4. Solution and Simulation
Several limitations exist in the solution of multi-objective programming model. The solution of multi-objective programming need to satisfy all constraint conditions. In order to obtain the optimal solution, the objective function of minimum CO emissions turn into the low carbon constraint condition in this paper. When CO emissions are lower than the maximum limit value, the target of CO emission reduction is considered to be achieved.
According to the historical data from 2011 to 2020, the lowest and highest average annual growth rate of sub-sector industrial added value were −1.7% and 19.8%, respectively. The parameter of the lowest average annual growth rate of sub-sector industrial added value was determined as 6.93% from 2010 to 2020. Combined with historical data and determined parameter values, we assumed that the annual average change rate limit of sub-sector industrial added value was from 6.93% to 19.8%. The meaning of sub-sector annual average change rate limit is that when the annual average change rate limit of sub-sector industrial added value was 6.93%, the upper and lower limit of the average annual growth rate of sub-sector industrial added value are 6.93% and −6.93%, respectively. In this paper, the annual average change rate limit of sub-sector industrial added value was chosen as variate. The Figure 4 reflected the impact of the annual average change rate limit of sub-sector industrial added value on industrial energy consumption and CO emissions. Subsequently, the Figure 5 reflected the impact of the annual average change rate limit of sub-sector industrial added value on industrial energy consumption intensity and industrial carbon emission intensity.
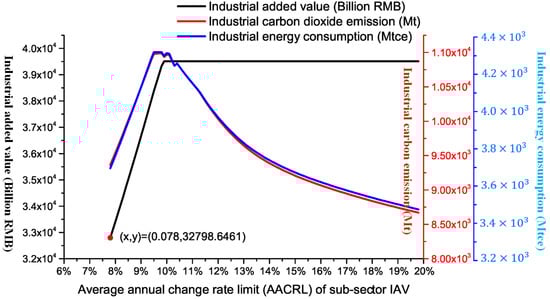
Figure 4.
The impact o f AACRL of sub-sector IAV on industrial CO emissions (C) and energy consumption (E).
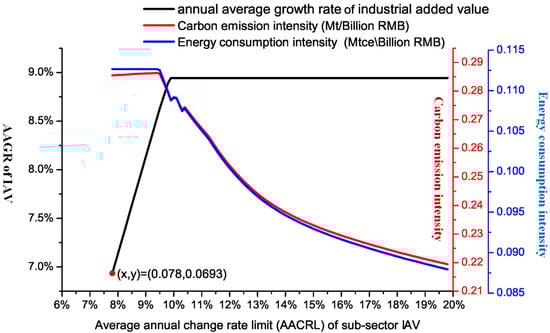
Figure 5.
The impact of AACRL of sub-sector IAV on industrial carbon emission intensity (ICEI) (), industrial energy consumption intensity (IECI) () and AAGR of IAV.
Figure 4 indicates that when the sub-sector annual average change rate limit is less than 9.8%, the industrial added value has a positive impact on energy conservation and emission reduction. When the sub-sector annual average change rate limit is more than 9.9%, energy consumption and CO emissions have been declining as the sub-sector annual average change rate limit has increased, while the industrial added value has remained the same. In addition, when the sub-sector annual average change rate limit is more than 7.8%, the targets of energy conservation and emission reduction can be achieved in 2025. Furthermore, when the sub-sector annual average change rate limit reaches 9.8%, we find that the maximum energy consumption and CO emissions are 4318.8 Mtce and 11,988.24 Mt, respectively.
The overall trend of industrial energy consumption intensity and industrial carbon emission intensity has dropped (Figure 5). When the annual average change rate limit of sub-sector industrial added value is more than 7.8% (the average annual growth rate reaches 6.93%), industrial energy consumption intensity and industrial carbon emission intensity can achieve the setting targets. In addition, when the sub-sector annual average change rate limit is more than 9.9%, the average annual growth rate remains unchanged.
Simulation results show that when the annual average change rate limit of sub-sector industrial added value is more than 7.8%, both the industrial energy consumption and CO emissions setting targets can be achieved. Simultaneously, the targets of industrial energy consumption intensity and industrial carbon emission intensity can both be achieved. When the annual average change rate limit is more than 9.9%, the industrial added value remains unchanged. But energy consumption and CO emissions decrease as the annual average change rate limit increases. In view of this condition, we discuss the proportion and proportion change value of the sub-sector industrial added value. The proportion change value represents the proportion of industrial added value in the optimized sub-sector in 2020 subtracted by the proportion of industrial added value in the initial sub-sector in 2010. The specific results are shown in Figure 6, Figure 7 and Figure 8. Among of them, Figure 6 shows the proportion and proportion change value of industrial added value of high industrial carbon emission intensity and industrial energy consumption intensity sectors. Figure 7 and Figure 8 show the proportion and proportion change value of industrial added value of low industrial carbon emission intensity and industrial energy consumption intensity sectors.
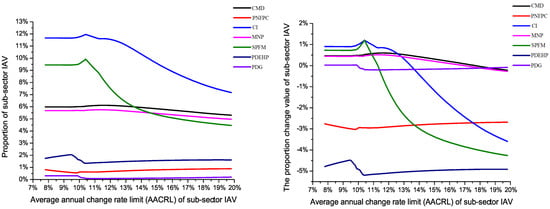
Figure 6.
The proportion and proportion change value of the optimized high industrial carbon emission intensity (ICEI) and industrial energy consumption intensity (IECI) sector.
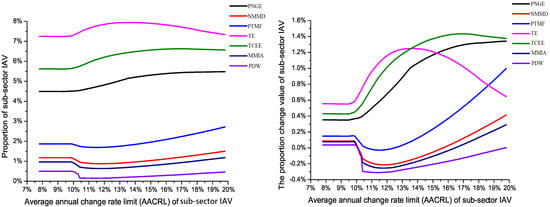
Figure 7.
The proportion and proportion change value of the optimized low industrial carbon emission intensity (ICEI) and industrial energy consumption intensity (IECI) sector.
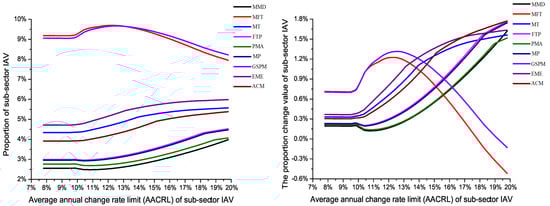
Figure 8.
The proportion and proportion change value of the optimized low industrial carbon emission intensity (ICEI) and industrial energy consumption intensity (IECI) sector.
Figure 6 shows the optimized results. From the figure, we find that the sub-sectors with the highest proportions of industrial added value are Coal Mining and Dressing (CMD), Nonmetal Mineral Products (MNP), Smelting and Pressing of Ferrous Metals (SPFM), and Chemical Industry (CI). In addition, the sub-sectors with highest proportion change values of industrial added value are Petroleum and Nuclear Fuel Processing and Coking (PNFPC), Chemical Industry (CI), Smelting and Pressing of Ferrous Metals (SPFM), and Production and Distribution of Electric and Heat Power (PDEHP). Among of them, the proportion change value of Chemical Industry (CI) and Smelting and Pressing of Ferrous Metals (SPFM) is more significant.
After optimization, the sectors with higher proportions of industrial added value are those with low industrial energy consumption intensity and industrial carbon emission intensity, including Transportation Equipment (TE) and Telecommunication, Computer and other Electronic Equipment (TCEE). The proportion of these sub-sectors’ IAV has little change. Meanwhile, the proportion change value of sub-sector industrial added value has little change. The range of proportion change value is less than 1%. This means that the effect of these sub-sectors’ industrial added value on energy conservation and emission reduction is small.
After optimization, the sectors with higher proportions of industrial added value are those with low industrial energy consumption intensity and industrial carbon emission intensity, including Manufacture of Foods and Tobacco (MFT) and General and Special Purpose Machinery (GSPM). The proportion of sub-sector industrial added value has little change. However, the proportion change value of these sub-sectors’ industrial added value is great. The range of proportion change value exceeds 1%. This means that the effect of sub-sector industrial added value on energy conservation and emission reduction is great.
Obviously, the proportion of Chemical Industry (CI) and Smelting and Pressing of Ferrous Metals (SPFM) declined with the annual average change rate limit increases. Moreover, the proportion of other sub-sectors’ industrial added value has little change with the increase in the annual average change rate limit. When industrial added value remains unchanged (the annual average change rate limit exceeds 9.9%), we find that the optimized proportion of sectors with high industrial energy consumption intensity and industrial carbon emission intensity is lower than the initial proportion, including Petroleum and Nuclear Fuel Processing and Coking (PNFPC) and Production and Distribution of Electric and Heat Power (PDEHP), etc. Simultaneously, the proportion change value of industrial added value in some sectors with low industrial energy consumption intensity and industrial carbon emission intensity are negative and the value is small. In addition, the highest and lowest proportion of each sub-sector industrial added value are different. When the range of the annual average change rate limit is between 10% and 15%, they can achieve the optimal proportion. This means that when an appropriate annual average change rate limit is chosen, the adjustment of the sub-sector industrial added value has a critical impact on energy conservation and emission reduction.
5. Results
The proportion change value of sub-sector industrial added value reflects the development of sub-sector from the side. We divide the industrial sub-sector into four categories based on it. The classification is beneficial to the adjustment of industry and helps to achieve the goal of energy conservation and emission reduction. The specific classification results can be seen in Table 3.
Table 3.
The classification of sub-sector.
Table 3 shows that sectors that need to be restricted in development are those with high industrial energy consumption intensity and industrial carbon emission intensity, including Petroleum and Nuclear Fuel Processing and Coking (PNFPC), Production and Distribution of Electric and Heat Power (PDEHP), Chemical Industry (CI) and Smelting and Pressing of Ferrous Metals (SPFM). In order to save energy and reduce CO emissions, we should focus on these sectors. Simultaneously, we also find that the rapidly developing sectors are those with low industrial energy consumption intensity and industrial carbon emission intensity from Table 3, including Metals Mining and Dressing (MMD), Electrical Machinery and Equipment (EME) and Manufacture of Textile (MT), etc. It is shown that we should promote the development of these sectors to achieve the goal of energy conservation and emission reduction. The development of other sub-sector is voluntary, including nonmetal minerals mining and dressing (NMMD), Manufacture of Foods and Tobacco (MFT), Manufacture of Measuring Instruments and Apparatuses (MMIA), General and Special Purpose Machinery (GSPM) and Production and Distribution of Water (PDW). That means these sectors are not the main drivers of energy conservation and emission reduction.
6. Conclusions and Policy Suggestions
6.1. Conclusions
An optimization model was developed to assess the potential impacts of industrial added value on energy consumption and CO emissions. According to the adjusted results of industrial sectors, some conclusions can be obtained.
(1) When the sub-sector annual average change rate limit is below 9.8%, the industrial added value has a positive impact on energy consumption and CO emissions. In addition, the goals of industrial added value, energy consumption and CO emissions in the Fourteenth Five-Year Plan can be achieved if the sub-sector annual average change rate limit reaches 7.8%. In addition, we find that the appropriate sub-sector annual average change rate limit is more conducive to achieving energy conservation and CO emission reduction goals. When the range of sub-sector annual average change rate limit is between 10% to 15%, the adjustment of sub-sector industrial added value has a critical impact on energy consumption and CO emissions.
(2) Rapid development of the industrial sector is an effective method to save energy and reduce CO emissions. To be specific, China needs to strive to raise the proportion of several sectors with low industrial energy consumption intensity and industrial carbon emission intensity including Metals Mining and Dressing (MMD), Manufacture of Textile (MT) and Electrical Machinery and Equipment (EME), etc. On the contrary, the development of several sectors with high industrial energy consumption intensity and industrial carbon emission intensity needs to be restricted, specifically Petroleum and Nuclear Fuel Processing and Coking (PNFPC), Production and Distribution of Electric and Heat Power (PDEHP), Chemical Industry (CI), and Smelting and Pressing of Ferrous Metals (SPFM).
6.2. Policy Suggestions
In order to achieve the targets of energy conservation and emission reduction and promote the sustainable transformation of industrial economy, a number of feasible policy recommendations are proposed from the perspective of government and enterprises. The main details are as follows.
(1) The government should restrict the rapid development of high energy consumption and CO emissions sectors including Petroleum and Nuclear Fuel Processing and Coking (PNFPC), Production and Distribution of Electric and Heat Power (PDEHP), Chemical Industry (CI) and Smelting and Pressing of Ferrous Metals (SPFM). Meanwhile, the government should promote the transformation from sectors with high industrial energy consumption intensity and industrial carbon emission intensity to those with low industrial energy consumption intensity and industrial carbon emission intensity through attracting foreign investment and implementing the carbon tax policy. In addition, the optimization of energy structure and improvement of energy efficiency are also effective ways to reduce the intensity of energy consumption and carbon emissions. Specifically, the government should develop new energy including solar, wind, geothermal energy, etc., and encourage technological innovation. Meanwhile, the government should also promote the utilization of these clean energy alternative through subsidies, further improving the proportion of renewable energy consumption in the industrial sector. Finally, the government should improve the carbon permit trading market and industrial chain of related industries. It can effectively promote the carbon emissions trading and green development of industry.
(2) In the process of promoting the rapid development of sectors with low industrial energy consumption intensity and industrial carbon emission intensity, related enterprises can promote the increase of industrial added value by raising the remuneration of workers and increasing the profits of enterprises. Concretely, these enterprises should encourage company employees to attend the proper vocational training to improve their remuneration. Simultaneously, they can obtain higher industrial profit through strengthening their research and development and updating and remoulding the production process. In addition, these enterprises can also achieve the growth of corporate profits by reducing energy consumption to reduce production costs. Finally, these enterprises should set up the idea of industrial green development. In particular, they should improve energy efficiency through technological innovation all the while promoting the development of a circular economy by developing green products.
(3) In general, China’s industrial sector still needs to maintain steady growth during the Fourteenth Five-Year Plan. It is conducive to achieving the goals of energy saving and emission reduction. In particular, the Chinese government should encourage and support the rapid development of some sectors with low industrial energy consumption intensity and industrial carbon emission intensity. Notably, the formulation of the industrial sector’s economic policy should be more consistent with energy conservation and environmental protection in the future.
Author Contributions
Conceptualization, H.X., B.X. and S.J.; Data curation, B.X.; Formal analysis, H.X.; Funding acquisition, H.X. and S.J.; Methodology, H.X., B.X. and S.J.; Software, H.X., B.X. and S.J.; Supervision, S.J.; Visualization, H.X.; Writing—original draft, B.X.; Writing—review and editing, H.X. and S.J. All authors have read and agreed to the published version of the manuscript.
Funding
Project is supported by the National Natural Science Foundation of China (Grant Nos. 51306072, 72243005, 71704067, 71690242 and 91546118), Qing Lan Project of Jiangsu Province (2021), Special Science and Technology Innovation Program for Carbon Peak and Carbon Neutralization of Jiangsu Province (Grant No. BE2022612).
Institutional Review Board Statement
Not applicable.
Informed Consent Statement
Not applicable.
Data Availability Statement
Data are contained within the article.
Conflicts of Interest
The authors declare no conflict of interest.
References
- Wang, S.S.; Zhou, D.Q.; Zhou, P.; Wang, Q.W. CO2 emissions, energy consumption and economic growth in China: A panel data analysis. Energy Policy 2011, 39, 4870–4875. [Google Scholar] [CrossRef]
- Xie, R.; Hu, G.; Zhang, Y.; Liu, Y. Provincial transfers of enabled carbon emissions in China: A supply-side perspective. Energy Policy 2017, 107, 688–697. [Google Scholar] [CrossRef]
- Wen, H.; Chen, Z.; Yang, Q.; Liu, J.; Nie, P. Driving forces and mitigating strategies of CO2 emissions in China: A decomposition analysis based on 38 industrial sub-sectors. Energy 2022, 245, 123262. [Google Scholar] [CrossRef]
- Mardani, A.; Streimikiene, D.; Cavallaro, F.; Loganathan, N.; Khoshnoudi, M. Carbon dioxide (CO2) emissions and economic growth: A systematic review of two decades of research from 1995 to 2017. Sci. Total Environ. 2019, 649, 31–49. [Google Scholar] [CrossRef]
- Niu, S.; Liu, Y.; Ding, Y.; Qu, W. China energy systems transformation and emissions peak. Renew. Sustain. Energy Rev. 2016, 58, 782–795. [Google Scholar] [CrossRef]
- Yu, H.; Duan, J.; Du, W.; Xue, S.; Sun, J. China’s energy storage industry: Develop status, existing problems and countermeasures. Renew. Sustain. Energy Rev. 2017, 71, 767–784. [Google Scholar] [CrossRef]
- Zhang, Y. Analysis of China’s energy efficiency and influencing factors under carbon peaking and carbon neutrality goals. J. Clean. Prod. 2022, 370, 133604. [Google Scholar] [CrossRef]
- Irfan, M.; Ullah, S.; Razzaq, A.; Cai, J.; Adebayo, T.S. Unleashing the dynamic impact of tourism industry on energy consumption, economic output, and environmental quality in China: A way forward towards environmental sustainability. J. Clean. Prod. 2023, 387, 135778. [Google Scholar] [CrossRef]
- Köne, A.Ç.; Büke, T. Forecasting of CO2 emissions from fuel combustion using trend analysis. Renew. Sustain. Energy Rev. 2010, 14, 2906–2915. [Google Scholar] [CrossRef]
- Wang, C.; Wang, F.; Zhang, X.; Yang, Y.; Su, Y.; Ye, Y.; Zhang, H. Examining the driving factors of energy related carbon emissions using the extended STIRPAT model based on IPAT identity in xinjiang. Renew. Sustain. Energy Rev. 2017, 67, 51–61. [Google Scholar] [CrossRef]
- Gu, A.; Teng, F.; Feng, X. Effects of pollution control measures on carbon emission reduction in China: Evidence from the 11th and 12th Five-Year Plans. Clim. Policy 2018, 18, 198–209. [Google Scholar] [CrossRef]
- Li, Z.; Sun, L.; Geng, Y.; Dong, H.; Ren, J.; Liu, Z.; Tian, X.; Yabar, H.; Higano, Y. Examining industrial structure changes and corresponding carbon emission reduction effect by combining input–output analysis and social network analysis: A comparison study of China and Japan. J. Clean. Prod. 2017, 162, 61–70. [Google Scholar] [CrossRef]
- Xing, S.; Lu, J.; Zhang, C.; Sun, S. Does line loss broaden the deviation between the added value of industry and the industrial electricity consumption in China? Environ. Dev. Sustain. 2019, 21, 1635–1648. [Google Scholar] [CrossRef]
- Dong, B.; Ma, X.; Zhang, Z.; Zhang, H.; Chen, R.; Song, Y.; Shen, M.; Xiang, R. Carbon emissions, the industrial structure and economic growth: Evidence from heterogeneous industries in China. Environ. Pollut. 2020, 262, 114322. [Google Scholar] [CrossRef]
- Wei, P.; Zhou, Y. Urbanization, energy consumption and carbon emission: A empirical study on transnational panel data based on STIPAT model. Ecol. Econ. 2014, 14, 571–575. [Google Scholar]
- Xu, B.; Lin, B. Reducing CO2 emissions in China’s manufacturing industry: Evidence from nonparametric additive regression models. Energy 2016, 101, 161–173. [Google Scholar] [CrossRef]
- Hao, Y.; Huang, Z.; Wu, H. Do carbon emissions and economic growth decouple in China? An empirical analysis based on provincial panel data. Energies 2019, 12, 2411. [Google Scholar] [CrossRef]
- Li, M.; Fu, Q.; Singh, V.P.; Liu, D. An interval multi-objective programming model for irrigation water allocation under uncertainty. Agric. Water Manag. 2018, 196, 24–36. [Google Scholar] [CrossRef]
- Zhang, X.N.; Zhong, Q.Y.; Qu, Y.; Li, H.L. Liquefied natural gas importing security strategy considering multi-factor: A multi-objective programming approach. Expert Syst. Appl. 2017, 87, 56–69. [Google Scholar] [CrossRef]
- Tsao, Y.C.; Thanh, V.V.; Lu, J.C.; Yu, V. Designing sustainable supply chain networks under uncertain environments: Fuzzy multi-objective programming. J. Clean. Prod. 2018, 174, 1550–1565. [Google Scholar] [CrossRef]
- Fu, Z.H.; Xie, Y.L.; Li, W.; Lu, W.T.; Guo, H.C. An inexact multi-objective programming model for an economy-energy-environment system under uncertainty: A case study of Urumqi, China. Energy 2017, 126, 165–178. [Google Scholar] [CrossRef]
- Mi, Z.F.; Pan, S.Y.; Yu, H.; Wei, Y.M. Potential impacts of industrial structure on energy consumption and CO2 emission: A case study of beijing. J. Clean. Prod. 2015, 103, 455–462. [Google Scholar] [CrossRef]
- Costa, I.; Ferrão, P. A case study of industrial symbiosis development using a middle-out approach. J. Clean. Prod. 2010, 18, 984–992. [Google Scholar] [CrossRef]
- Li, A.; Zhang, A.; Zhou, Y.; Yao, X. Decomposition analysis of factors affecting carbon dioxide emissions across provinces in China. J. Clean. Prod. 2017, 141, 1428–1444. [Google Scholar] [CrossRef]
- Sun, L.; Wang, Q.; Zhang, J. Inter-industrial carbon emission transfers in China: Economic effect and optimization strategy. Ecol. Econ. 2017, 132, 55–62. [Google Scholar] [CrossRef]
- Du, T.J. The fourth assessment report of the intergovernmental panel on climate change (ipcc). Political Sci. Politics 2007, 36, 423–426. [Google Scholar]
- Cheng, Z.; Li, L.; Liu, J. Industrial structure, technical progress and carbon intensity in china’s provinces. Renew. Sustain. Energy Rev. 2018, 81, 2935–2946. [Google Scholar] [CrossRef]
- Li, Y. Information Drive and Effective Investment Support to Realize the Sustainable and Healthy Development of Industry; Technical Report. 2017. Available online: https://www.cinn.cn/zggylt/ (accessed on 16 November 2023).
- Liu, S. Ten Years’ Outlook on China’s Economic Growth (2017–2026): The Old Economy and New Kinetic Energy; CITIC Publishing Group: Beijing, China, 2017. [Google Scholar]
- Ren, J. The industry development of our country "12th five-year" review and prospect of “13th five-year”. Macro Econ. Manag. 2016, 10, 6–9. [Google Scholar]
- Dai, J.; Ni, Y.; Dong, D.; Qin, S.; Zhu, G.; Huang, S. 2021–2025 is a period of great development of China’s natural gas industry: Suggestions on the exploration and development of natural gas during the 14th five-year plan in China. J. Nat. Gas Geosci. 2021, 6, 183–197. [Google Scholar] [CrossRef]
- Niu, H. Prediction of carbon emissions in china’s industrial structure adjustment—Based on dynamic multi-objective optimization model. Res. Technol. Econ. Manag. 2016, 8, 17–21. [Google Scholar]
- Yang, H.; Li, X.; Ma, L.; Li, Z. Using system dynamics to analyse key factors influencing China’s energy-related CO2 emissions and emission reduction scenarios. J. Clean. Prod. 2021, 320, 128811. [Google Scholar] [CrossRef]
- Sun, W.; Liu, M. Prediction and analysis of the three major industries and residential consumption CO2 emissions based on least squares support vector machine in China. J. Clean. Prod. 2016, 122, 144–153. [Google Scholar] [CrossRef]
- Wang, N.; Guo, J.; Zhang, X.; Zhang, J.; Li, Z.; Meng, F.; Zhang, B.; Ren, X. The circular economy transformation in industrial parks: Theoretical reframing of the resource and environment matrix. Resour. Conserv. Recycl. 2021, 167, 105251. [Google Scholar] [CrossRef]
Disclaimer/Publisher’s Note: The statements, opinions and data contained in all publications are solely those of the individual author(s) and contributor(s) and not of MDPI and/or the editor(s). MDPI and/or the editor(s) disclaim responsibility for any injury to people or property resulting from any ideas, methods, instructions or products referred to in the content. |
© 2023 by the authors. Licensee MDPI, Basel, Switzerland. This article is an open access article distributed under the terms and conditions of the Creative Commons Attribution (CC BY) license (https://creativecommons.org/licenses/by/4.0/).