Article

Exploring Key Factors and Driving Mechanisms of Construction Waste Recycling Development in China: Combination of PEST Model and Fuzzy-Set Qualitative Comparative Analysis

1
Department of Construction Management and Real Estate, College of Civil and Transportation Engineering, Shenzhen University, Shenzhen 518060, China
2
Key Laboratory for Resilient Infrastructures of Coastal Cities, Shenzhen University, Ministry of Education, Shenzhen 518060, China
3
Sino-Australia Joint Research Center in BIM and Smart Construction, Shenzhen University, Shenzhen 518060, China
*
Author to whom correspondence should be addressed.
Sustainability 2023, 15(23), 16177; https://doi.org/10.3390/su152316177
Submission received: 30 September 2023 / Revised: 14 November 2023 / Accepted: 20 November 2023 / Published: 21 November 2023
(This article belongs to the Special Issue Construction and Demolition Waste Management for Carbon Neutrality)

Abstract

:
The construction waste recycling (CWR) industry in China is still in the primary stage. Thus, exploring the driving mechanisms of its development has significant theoretical worth and practical significance. Existing studies mainly focused on identifying individual key factors, while paying limited attention to the synergistic effects of multiple factors. The aim of this study is to systematically identify the primary drivers of China’s CWR industry from a macro perspective and explore their conjunctional effect on the development of the CWR industry in China. Firstly, based on the PEST model, the key factors driving the development of the CWR industry were identified from political, economic, social, and technological aspects. Secondly, the fuzzy-set Qualitative Comparative Analysis (fsQCA) approach was used to explore the causal relationship between the conjunction of these factors and the development level of the CWR industry. This study yields two interesting conclusions. The first is that none of the political, economic, social, and technological factors is a necessary condition. It means that the absence of any single factor will not restrict the development of the CWR industry. The second reveals two causal paths for the high-level development of the CWR industry, namely, the configuration of policy and social factors and the individual effect of economic factors. High-level development in the CWR industry can drive the sustainable development of the construction sector.

1. Introduction

With the continuous urbanization and rapid development of infrastructure construction in China, the construction industry has generated plenty of concrete, masonry, rubble, mortar, sludge, and other construction waste. China’s annual production of construction waste reached 30 billion tons according to statistics in 2020 [1]. A large amount of construction waste that has been landfilled occupies valuable land resources and brings potential environmental risks, such as dust and groundwater contamination [2]. In the context of the current vigorous development of socialist ecological civilization construction and the development of the circular economy and “zero waste” city, the recycling of construction waste has become the inevitable development direction [3,4].
Although both the central and local governments are actively promoting CWR, China’s CWR industry development is still in the primary stage in general. There is a serious spatial imbalance in this industry’s development. Therefore, it is valuable and practical to explore the key factors and driving mechanisms of development in the CWR industry. A couple of studies have attempted to address this problem based on experience or surveys. Li et al. [5] studied the key policies affecting the recycling industry development. Ma et al. [6] discussed in detail the potential challenges facing the resource industry. The lack of on-site sorting of construction waste [2,7], the absence of certification standards for resource management products [7,8], unsound laws and regulations for construction waste management [7,9,10], restricted land for resource disposal centers [4,7], difficulties in marketing recycled products [8,10], lack of awareness of resource preservation and environmental conservation [8,9,10,11], and low technical and equipment levels [11] were identified as critical barriers.
However, these studies often tend to focus on the investigation of individual influencing factors [5], or employ methods such as comparisons [2], statistics [2,4], expert ratings [11], and surveys [9] to identify key influencing factors. Rarely do they use a theoretical framework to synthetically identify and organize these factors, thus providing a macro and integral perspective to understand the driving force of the CWR industry’s development. Most of all, these researches rarely concern the conjunctional effect of multiple factors [11]. Indeed, the influencing factor probably takes effect in combination with other factors instead of independently, and the state of the industry’s development is determined by the combination of these factors. Therefore, there may be various configurations of factors that will form “Equivalent” causal paths.
China, in particular, has a large territory with varying levels of urban administration, resource endowment, and economic growth in different regions. This heterogeneity may lead to diverse development paths of the CWR industry, which rely on various conjunctions of influential factors. Thus, the objective of this study is to systematically identify key driving factors, and then explore the conjunctional effect of these factors on the development of the CWR industry in China. Multiple linear regression and fuzzy-set Qualitative Comparative Analysis (fsQCA) are the research methods employed in this paper. Firstly, the factors were identified based on the PEST model, which is frequently used to examine macro factors that affect industry growth [12]. Secondly, multiple linear regression was used to analyze the independent effects of each factor on the development of the CWR industry. Finally, fsQCA, a set theory-based approach, was applied to analyze the concurrent causality of antecedent conditions from a configuration perspective.
The subsequent content is structured as follows: In the next section, the key factors driving the development of the CWR industry are identified based on the PEST model. In Section 3, the fsQCA and multiple linear regression are introduced. On this basis, taking typical Chinese cities as examples, fsQCA is used to analyze the combined conditions and to determine the multiple casual paths for the development of the CWR industry in Section 4. Finally, the results are discussed in detail.

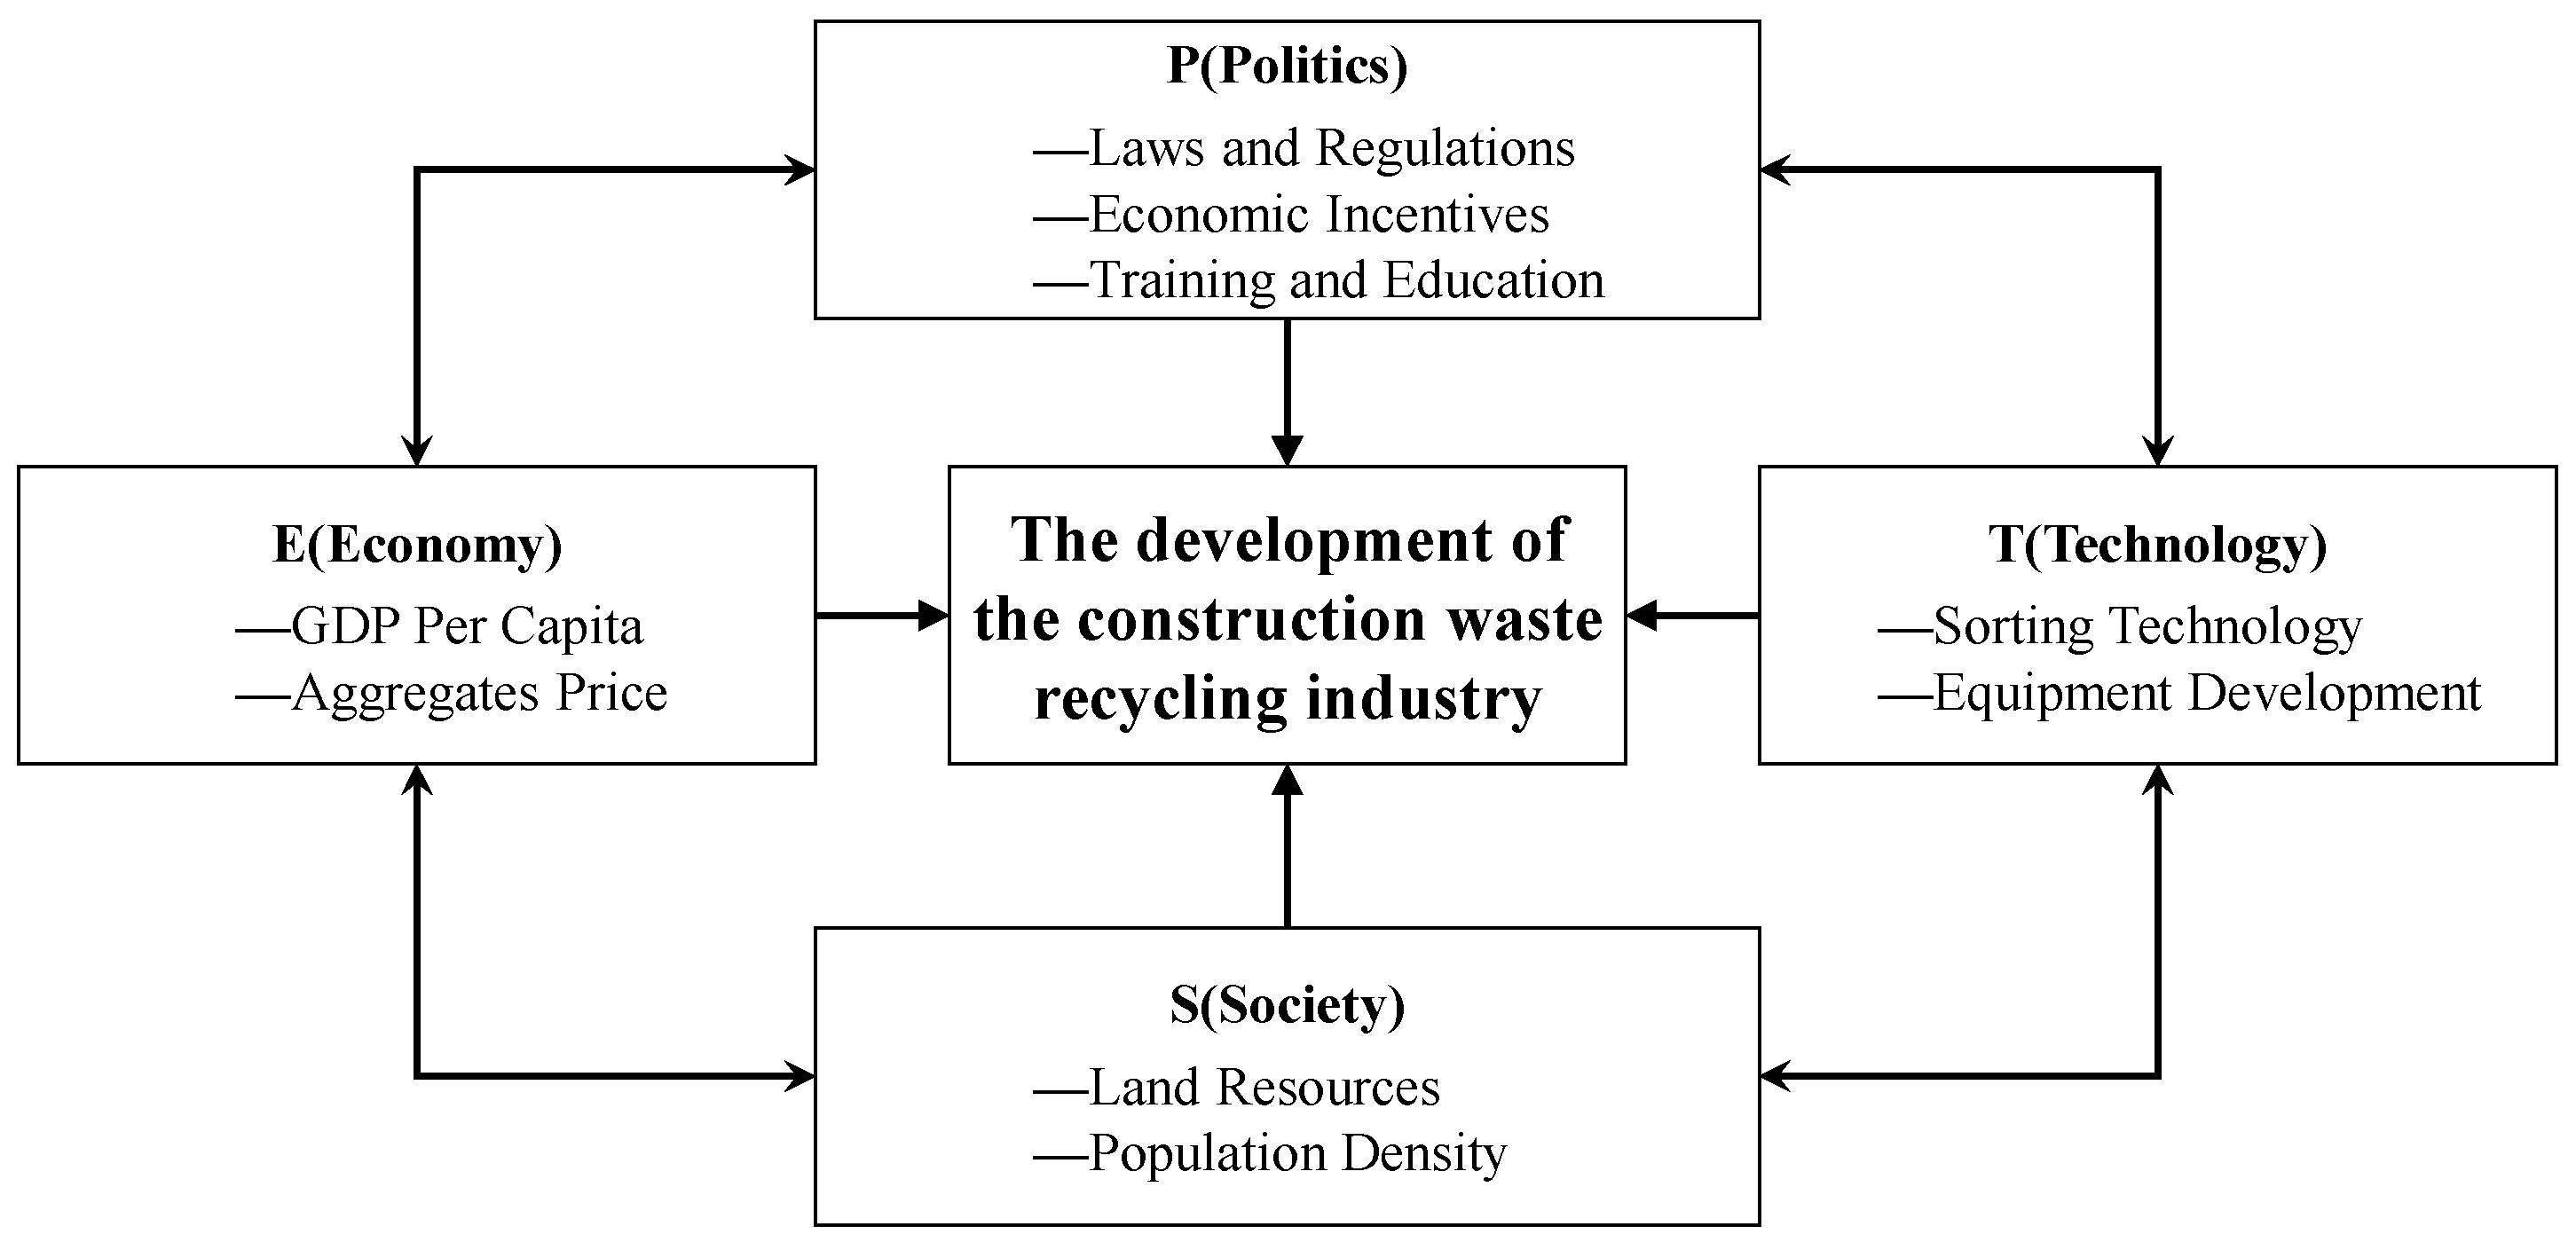
2. Identification of Influential Factors Based on PEST

The PEST model is often used as a classical method for systematic analysis of the macro-environment affecting industry development [13]. Based on the PEST framework, this study identified the key factors driving the development of the CWR industry from four aspects: policy measures, economic development, social conditions, and technology level (see Figure 1).

2.1. Policy Measures

Various policies, such as laws, regulations, and economic incentives, have been regarded as useful strategies for promoting CWR. The lack of relevant supporting legal and regulatory policy support has been recognized as the crucial reason for the current difficulties in the industry’s development. For example, Chen et al. [14] argued that inadequate construction waste regulations and poor implementation contributed to the difficulty in operating CWR enterprises. Additionally, Li et al. [5] discovered that CWR industries initially faced severe financial pressure due to the lack of relevant fiscal incentives. Recycling companies find it challenging to sustain long-term operations without government subsidies [15]. Financial subsidies, tax breaks, low rent for land, and other preferential policies will help recycling enterprises to achieve economic viability and commercial profitability, thus fostering the resource-based industry [16].

2.2. Economic Development

Economic development is generally measured by indicators such as national income, GDP per capita, and price level. On the one hand, the generation and management of urban construction waste are closely correlated with GDP. Due to the shortage of land resources, some cities with high GDP per capita (e.g., Shenzhen, Beijing, Shanghai, and Guangzhou) need to demolish a large number of urban villages for urban renewal, which will inevitably generate a lot of construction and demolition waste [2]. From the perspective of environmental sustainability, the use of recycled building materials, such as plastics, is encouraged [17]. However, this is significantly influenced by the price levels of construction materials. Due to the competitive relationship between natural aggregates (NA) and recycled aggregates (RA), the use of RA will be directly influenced by the quantity and price of natural aggregates. RA are more economically attractive when natural sand and gravel are scarce and expensive [18]. The economic cost savings for consumers using RA is minimal when cheap NA is available, which seriously hinders the promotion and application of RA [19].

2.3. Social Conditions

The social environment includes the natural environment and socio-cultural background. CWR is generally more urgent in locations with limited land resources. For example, due to the land scarcity and high population density, Japan and South Korea have developed recycling technologies such as concrete waste and achieved a high rate of recycling because of relatively poor natural resources [20]; the management of construction waste has received special attention from the Hong Kong government [21,22,23]; Beijing, Shanghai, Shenzhen, and other cities in China have been very urgently exploring the resource utilization of construction waste [16].

2.4. Technology Level
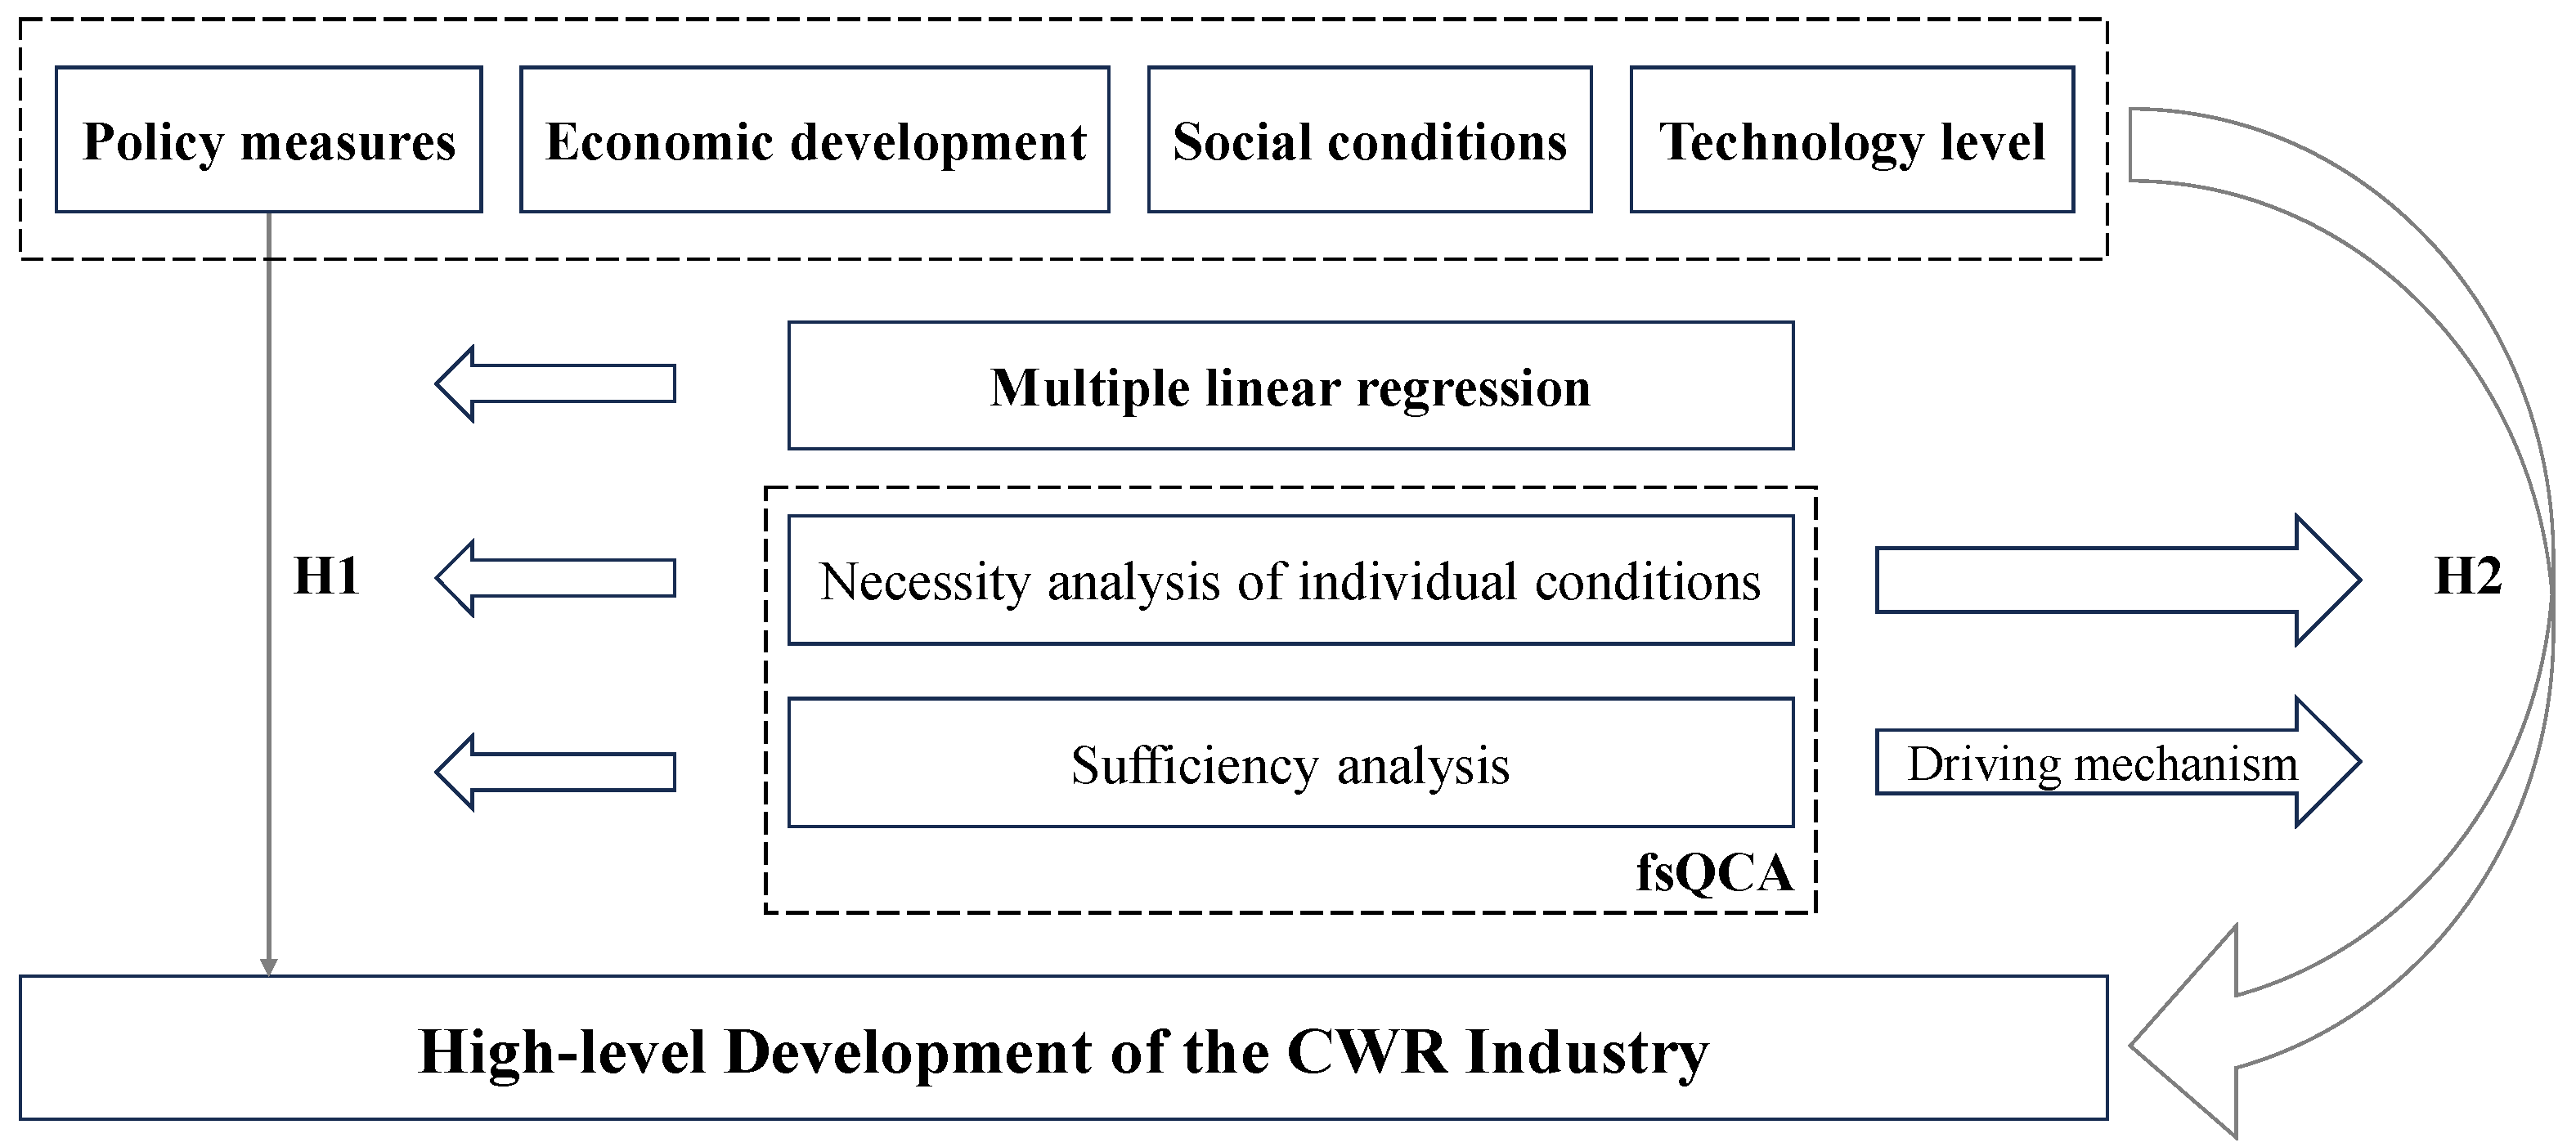
The technological level involves technological innovation and patents related to the sorting and processing of construction waste. Technical means lay the critical foundation for CWR. The level of technology directly affects the cost and quality of resource treatment [24]. For Japan and Germany, the high development of the CWR industry relied heavily on their strong technology and equipment development capabilities [23,25]. Due to insufficient attention on the R&D of CWR technology and equipment, much construction waste in China has not been effectively recycled [26]. For instance, construction waste sorting technology occupied a decisive position in improving the quality of recycled products [27]. Strengthening technological innovation can greatly improve the resource utilization rate of construction waste and thus promote CWR’s development.

3. Method and Data

Based on the analysis of the background and literature review, it was observed that policy measures are the primary focus of most scholars. It seems likely that policy measures are regarded as the most essential factor. To validate whether policy measures can effectively drive the development of the CWR industry, this study proposes the following hypothesis:
Hypothesis 1 (H1):
Political measures can drive high-level development in the CWR industry.
Furthermore, after identifying the driving factors of the CWR industry based on the PEST model, the other research question emerges. Can the other factors mentioned in the PEST model identically provide driving force for high-level development in the CWR industry? What are their driving mechanisms? Do they work solely or collectively with other factors? To address these questions, this study proposed a second hypothesis:
Hypothesis 2 (H2):
Multiple factors in the PEST model can collectively promote high-level CWR industry development.
Multiple linear regression and fsQCA were employed to validate the two hypotheses mentioned above, as illustrated in Figure 2.

3.1. Fuzzy-Set Qualitative Comparative Analysis (fsQCA)

Qualitative Comparative Analysis (QCA) allows an analysis of the causal relationship between the antecedent conditions’ configurations and the outcome variable to obtain multiple causal paths. The causal path is a sufficient condition for obtaining the result, namely, a sufficient configuration of the antecedent conditions. Different causal paths mean influencing the outcome in different ways but with the same effectiveness [28]. According to the variable’s type, the QCA could be classified as crisp-set Qualitative Comparative Analysis (csQCA), multi-value Qualitative Comparative Analysis (mvQCA), and fuzzy-set Qualitative Comparative Analysis (fsQCA) [29]. The csQCA can handle dichotomous variable issues with values of 0 or 1 [30], and the mvQCA can be used in multi-valued classification. Both of them, however, are limited to the discrete variable classification problem. Contrarily, fsQCA can classify the membership scores of different variables on a continuous scale ranging from 0 to 1, which largely avoids contradictory configurations. Since the variables in this study are all continuous variables, this study adopted the fsQCA. Data analysis using software fsQCA 3.0 consists of three main steps: data calibration, necessity analysis, and sufficiency analysis [31].

3.1.1. Data Calibration

Data calibration is the process of transforming the study condition variables into case sets and determining the membership that matches a certain set [32]. Three anchors—inclusion, exclusion, and crossover thresholds—need to be set by the membership. The membership values, which range from 0 to 1, represent the degree from completely unaffiliated to affiliated. The crossover (0.5) is the midpoint that distinguishes between complete non-membership and complete membership [33]. In addition, the calibration allows the researcher to set the membership values based on existing theory or external reality. According to Coduras et al. [34], the 75% quantile, median, and 25% quantile of each variable were chosen as the threshold values for the inclusion, crossover, and exclusion thresholds. To complete data calibration, the antecedent conditions (i.e., number of policy measures, natural aggregate price, population density, and patent number) and the outcome condition (development level of the CWR industry) were transformed into fuzzy-set membership values between 0 and 1 [35].

3.1.2. Necessity Analysis

The purpose of the necessity analysis is to determine whether a single condition consistently exists when all outcomes are present (or absent) [35,36]. Two metrics, consistency and coverage, are obtained when calculating the necessity analysis [37]. Consistency quantifies the extent to which each antecedent condition is a subset of the outcome variable. In general, it can be assumed that an antecedent condition is necessary for the occurrence of the outcome if its consistency is above 0.9 [38] and it passes the necessity test. Coverage is expressed as the extent to which each antecedent condition explains the outcome variable [37]. There are different types of coverage, including solution coverage, raw coverage, and unique coverage. Solution coverage is the proportion of cases that can be explained by all condition configurations. Raw coverage and unique coverage are for each specific conditional configuration. The former indicates how many cases can be explained by that condition configuration, merely demonstrating sufficiency. The latter indicates how many cases can only be explained by that specific combination, reflecting the necessity of this conditional configuration [28].

3.1.3. Sufficiency Analysis

The core of the sufficiency analysis is to create a truth table that lists all logically possible conditions combinations, the number of cases they contain, and raw consistency scores [36]. If n conditions exist, there are at most 2n conditions combinations. Not all conditional configurations, however, are useful. Reasonable conditional configurations are found using the Boolean algorithm and counterfactual analysis, by determining the appropriate case frequency threshold and the original consistency threshold [39]. The “logical remainders” (the combination of conditions that exist logically but do not observe factual cases) is the combination of conditions that have no case coverage if the case frequency criterion is set to 1. By adding different logical remainders into standardized analysis, three types of fsQCA solutions can be obtained: complex solutions, parsimonious solutions, and intermediate solutions. The complex solutions unuse “logical remainders”, while the parsimonious solutions use all “logical remainders” that may help simplify the configuration but do not evaluate the rationality. The intermediate solutions outperform the parsimonious and complex ones by embracing the “logical remainder”, which is consistent with theory and practice [30]. As a result, this paper’s findings mostly focus on intermediate solutions. In addition, when setting the original consistency threshold, Schneider and Wagemann [38] considered a minimum threshold of 0.75, and the threshold also varied with the size of the sample.

3.2. Multiple Linear Regression

When the independent variables are continuous, multiple linear regression can be used to examine the relative degree of each factor’s impact on the development of the CWR industry [40]. To assess the effects of policy measures, economic development, social conditions, and technology level on the CWR industry, in turn, multiple regression analysis was chosen before configuration analysis in this study.
Evaluation metrics are often used to test regression effects. The regression employs both the F-test and the t-test. The F-test is a significance test of the regression equation that determines if at least one of the model’s independent variables will have an impact on the dependent variable. If p < 0.05, at least one of the independent variables will be related to the dependent variable. The significance of the t-test for each variable’s coefficients is measured by the p value. If the p value is less than 0.05, it is considered that the independent variable has a significant impact on the model. The multiple linear regression equation’s goodness-of-fit test is often expressed by the adjusted R2; values closer to 1 indicate a better fit for the model [41].

3.3. Data Collection

3.3.1. Studied Cities

To exploit the casual paths of CWR development in different regions, representative cities were selected as samples. First, Chinese municipalities and provincial capitals were chosen, which serve as the political and economic centers of provinces and regions and can reflect the local level of resourcefulness. In addition, the 35 pilot cities (districts) for construction waste management designated by the Notice on the Pilot Work of Construction Waste Management issued by the Ministry of Housing and Urban–Rural Development in 2018 were also included in this study. A final sample of 52 cities was obtained; duplicate cities were removed.

3.3.2. Dependent Variables

In this study, we used the number of registered CWR companies in each city as dependent variable [5]. We wanted to examine if these influential factors determine the development of CWR industry. Thus, the recycling companies were considered as the outcome variables rather than independent variables. The number of CWR enterprises was investigated using the website of Enterprise Information Inquiry (www.qcc.com/ (accessed on 10 March 2020)), which provides a query for enterprise register and operation information. The search terms are “city name” combined with “construction and demolition waste”, “construction waste”, “recycling”, “reuse”, “comprehensive utilization”, “recycled aggregates” or “recycled bricks”, etc. The retrieved list of enterprises was further filtered according to their business scope, to eliminate enterprises unrelated to construction waste disposal. Afterward, the number of CWR enterprises in each city was counted.

3.3.3. Antecedent Conditions

Related policy documents were obtained by searching the official websites of government departments and BeidaFaBao (www.pkulaw.com (accessed on 25 March 2020)) which is a law-related platform provided by Peking University. In this study, the keywords “construction and demolition waste”, “construction waste”, “recycling”, “reuse”, and “comprehensive utilization” were used as search terms. A total of 282 policy texts from 52 cities were obtained. After browsing, the irrelevant documents were eliminated. Finally, 175 valid policy texts were found. Then, the content analysis method was used to count the policy measures adopted in each city. The policy document was read separately by two graduate students to identify the compulsory, market, and information-based measures [42]. After an agreement was reached, the number of each type of measure was counted. The aggregated number of policy measures in each city represents the quantitative outcomes of each city’s policy measures.
In this study, natural aggregate prices were used to quantify economic growth. Usually, economically developed areas have a large scale of construction activity, so the high aggregate demand will motivate the increase in the price of NA accordingly. At the same time, high NA prices also contribute to promoting the recycling of building waste. The prices of coarse sand were queried on the websites of Zaojiatong (www.zjtcn.com (accessed on 1 February 2020)).
Social conditions include local resource conditions, geographical conditions, etc. We chose Urban Population Density as a representative index of social conditions, because the recycling of construction waste will be actively promoted in densely populated areas, where the impact of construction waste landfills is more significant on residents due to the restriction of land resources. The indicators were obtained from the China Urban Statistical Yearbook 2019.
The technological research and development (R&D) level of each city can be expressed in patents numbers. Considering that the number of patents related to the disposal of construction waste is difficult to obtain, the total number of patents approved by the city was used. The data was collected from the China Urban Statistical Yearbook 2019.

4. Results

4.1. Regression Analysis

Linear regression analysis was conducted with the four antecedent conditions as independent variables. The results are presented in Table 1.
According to the regression results, the equation is significant as a whole. However, only population density is a significant independent variable, while the other variables are not. It shows that population density is the only variable significantly impacting the high-level development of the CWR industry. However, does it mean that other factors do not matter? Does this mean that H1 is not valid? It is somewhat imprudent to reach these conclusions relying only on these results. FsQCA provides a perspective to figure out the combined effect of multiple factors rather than focusing on individual factors alone. This configuration analysis is capable of identifying the causal pathways wherein several components work together to affect the development of the CWR industry.

4.2. fsQCA Analysis

4.2.1. Necessity Analysis of Individual Conditions

The necessity analysis of the calibrated antecedent conditions is shown in Table 2.
From the results, it can be seen that the consistency of all the antecedent conditions does not exceed 0.9, indicating that there are no necessary conditions determining the development of the CWR industry. It means that the lack of any single condition will not be a bottleneck for the high-level development of the CWR industry. Similarly, there is no single necessary condition for low-level development too.
The only condition for consistency over 0.7 is “Population Density”. It means that this variable has a relatively strong explanation power, although it does not reach the necessary level. Similarly, the other three separate conditions, namely, the Number of Policy Measures (consistency 0.667), the Natural Aggregate Price (consistency 0.657), and the Patents Number (consistency 0.660), can help the CWR industry develop at a high level [9,10,43]. This validates H1, indicating that policy measures alone may not be a necessary condition for the high-level development of the CWR industry but may interact with other factors to drive industry development.

4.2.2. Configurations Analysis

The configurations analysis is designed to calculate the sufficiency of the results generated by different combinations of multiple conditions. Combination consistency is used to measure the sufficiency of combinations, and the minimum acceptable level is set no lower than 0.75 [38]. Before conducting the configuration analysis, a truth table was created, including all possible combinations (24 = 16). Case frequencies and consistency thresholds were set based on the sample size (52 as medium size) to 1 and 0.75, separately. Afterward, the complex, intermediate, and parsimonious solutions were obtained.
The intermediate solutions are presented in Table 3. In this paper, two configurations were obtained, both of which had consistency levels for individual configurations and overall solutions above the minimum acceptable value of 0.75. The consistency of the overall solution is 0.778 and the coverage is 0.628. The two configurations in Table 3 can be regarded as sufficient conditions for the high-level development of the CWR industry. In other words, these casual paths can achieve the purpose of high-level development of the CWR industry equivalently. In Table 3, ● and ⊗, respectively, indicate the presence and absence of conditions; large and small circles represent core and edge conditions; blanks represent conditions that may or may not exist. This indicates that H2 holds true, meaning that the combination of strong policy measures and high population density, as well as high NA prices in the absence of other conditions, can both promote high-level development in the CWR industry. This also demonstrates that the macro-level factors proposed based on the PEST model can drive the development of the CWR industry.
In Configuration 1, the combined presence of policy measures and population density conditions plays a core role. Cities with intensive policy measures and high population density provide sufficient conditions for the CWR industry to develop at a high level. In this configuration, the price of NA and the technological development capacity of the city are inessential. This confirms the validity of H1. That is, policy measures, while not a sole necessary condition, can interact with population density to drive high-level development in the CWR industry. It also means that CWR enterprises are inclined to invest and manufacture waste-recycled products where adequate policy promotion measures are in place and the population is dense as well. The consistency of this configuration is 0.789, indicating that 78.9% of the cases that meet this configuration are likely to achieve a high level of development. The unique coverage reaches 0.487, and the raw coverage is 0.571. It means that this path explains 57.1% of the industry’s high-level development cases, and 48.7% of the cases can only be explained by this path. This is the case for mega-cities such as Beijing, Shanghai, Guangzhou, and Shenzhen, as well as densely populated local cities such as Xuchang, Handan, and Suzhou. Xuchang has pioneered the franchise operation of CWR since 2009. In 2020, Xuchang comprehensively utilized 2.86 million tons of construction waste, with the recycling rate up to 98%.
In Configuration 2, the presence of economic conditions (NA prices) alone plays a central role. In this situation, even weak policy measures, low population density, and an unadvanced technological level cannot hinder the launch of CWR companies. This shows that market forces themselves can drive a high level of development in the CWR industry. The configuration consistency is 0.767. In addition, the unique coverage is 0.057, and the raw coverage is 0.142. This casual path explains 14.2% of the high-level development cases, with around 5.7% of cases explained solely by this path.

5. Discussion

Different from previous studies majorly relying on experts’ experience, this study first set a macro framework based on the classic PEST model to facilitate the comprehensive identification of key influential factors in the development of the CWR industry. Four essential factors related, respectively, to policy measures, economic development, social conditions, and technology level were selected accordingly. The policy, economic, and technological barriers are echoed by several previous studies. However, the social factor is commonly overlooked by these studies. For instance, Bao et al. [43] discovered that CWR in Shenzhen, China, was influenced by a thriving C&D waste recycling market, the introduction of advanced recycling technology, and the enactment of effective policy measures. Omer et al. [44] argued that lack of policy support, insufficient demand for recycled products, and limited recycling facilities hindered the CWR in construction projects.
According to the regression results, only the social condition (i.e., population density) has a significant effect on the CWR industry, while other factors such as policy measures (i.e., the number of policy measures), the economic development (i.e., natural aggregate price), and the technology level (i.e., patent number) do not. This conclusion coincides in part with Liu et al. [10], who deemed environmental awareness, also one of the social conditions, as the most positive and relevant factor in CWR. However, these results contradict those previous studies mentioned above, which emphasized the significant roles of policy, markets, and technology. However, it is inconsistent with Huang et al.’s [26] study, which recognized that inadequate management systems and an immature CDW recycling market were the primary obstacles to CDW recycling. These contradictory viewpoints illustrated that this complicated issue cannot be addressed only through traditional statistical analysis. New analysis perspectives and approaches are needed. Thus, we further used the fsQCA method based on set theory to explore the combined effect of these factors, to which little attention has been paid before.
Using 52 typical Chinese cities as examples, two driving paths were found sufficient for a high-level development of the CWR industry, i.e., a policy–society configuration and an economy configuration. However, no condition is necessary for the development of the CWR industry. This analysis aspect is totally different from the previous studies, which mostly relied on literature reviews and a semi-structured questionnaire technique, e.g., Badraddin et al. [45] and Bao and Lu [15]. Via these approaches, they identified the technical, regulatory, environmental, and economic barriers to CWR, but cannot further elucidate whether the existence of any barrier will necessarily lead to the failure of CWR, or which barriers must be overcome for the successful operation of concrete recycling.
As for the first configuration, i.e., policy measures and population density, only population density has a significant effect according to the regression results. However, it is neither necessary nor sufficient alone for the development of the CWR industry. Nor is policy. Nevertheless, the combination of intensive policy measures and dense population is sufficient to promote the CWR industry. This conclusion demonstrates that the regions that solely concentrate on developing policies will not be as successful as expected, if the local social conditions are neglected. In densely populated areas, the land is generally more valuable. The demand for saving landfill is therefore stronger. Nevertheless, CWR companies cannot benefit directly from land savings. Thus, the involvement of local authorities is necessary, for instance, to increase the landfill charge level or force the construction waste to be recycled. This situation has been witnessed in a couple of densely populated economies such as Japan [46], Singapore [47], and Korea [48]. Regarding the economy configuration, NA price has no significant effect on the regression. However, a high NA price is a sufficient, although not necessary, condition for the development of CWR. In a few instances, where NA prices are high in the area, the market environment will motivate the boom of the CWR industry alone, even if the other three conditions are weak. This situation has been witnessed in Germany. Despite being the largest producer of natural sand and aggregates in Europe, Germany had a 90% CDW recycling rate in 2005 alone due to the nation’s high demand for mineral resources and the scarcity of landfill sites [49,50].
In a word, this study reveals that choosing the appropriate driving path in line with the local socio-economic conditions is vital to effectively encourage the growth of the CWR industry, instead of solely emphasizing the aggressive development of legislative or economic measures. This conclusion will shed light on the construction waste management of municipal authorities. In densely populated areas, the enhancement of policymaking is an effective way to achieve the CWR goal. In regions with a high NA price, the authorities may put more effort into maintaining the market environment.

6. Conclusions

This paper utilized the PEST model to identify the macro factors driving the development of the CWR industry. The verification of two hypotheses using multiple linear regression and fsQCA unveiled the core conditions and causal pathways influencing the development of the CWR industry.
The results from both the multiple linear regression and fsQCA confirmed H1. This study demonstrated that policy measures are not a sole necessary condition for the development of the CWR industry, but in societies with a high population density, well-developed policy measures can promote high-level development in the CWR industry. Furthermore, the results from multiple linear regression and necessity analysis of individual conditions collectively suggested that social factors (population density), notably, can play a crucial role in facilitating high-level development in the CWR industry.
The fsQCA verified H2, demonstrating that political, economic, social, and technological factors can interact jointly to promote high-level development in the CWR industry. Two driving paths were found for the high-level development of the CWR industry, namely, the linkage mode of policy factors and social factors, and the independent mode of economic factors. Political measures are an important factor in promoting CWR but do not necessarily result in a high level of industry development unless they are matched with suitable social conditions (high population density). In addition, when high local natural resource prices exist, the CWR industry may develop at a high level even with limited policy measures.

7. Implications, Limitations, and Future Lines of Research

Based on the above conclusions, practical implications for the management of the CWR industry in China can be derived. On a theoretical level, this work is the first to use the combination of PEST and fsQCA to analyze the development paths of the CWR industry in China. Using objective data and two different methods can provide more comprehensive and valuable results for promoting the development paths of the CWR industry. On a practical level, local policies should be formulated according to local conditions, and appropriate development paths for the CWR industry can be chosen according to local social and economic conditions. In the case of market-oriented conditions, priority should be given to the use of market-oriented measures to solve the problems of CWR.
Finally, this study leaves several limitations to be improved. Given the availability of data, the number of indicators chosen in this study is limited, which may be improved by exploring more data sources in further studies. Moreover, this preliminary study only examines the causal pathways that influence the development of the CWR business in 52 representative cities in China. More cities or economies should be incorporated in future.

Author Contributions

Conceptualization, J.L.; methodology, J.L. and J.J.; software, J.L.; data curation, J.J.; writing—original draft preparation, J.L. and J.J.; writing—review and editing, J.L.; supervision, J.L.; funding acquisition, J.L. All authors have read and agreed to the published version of the manuscript.

Funding

This research was funded by the National Social Science Foundation of China (NSSFC) (Grant No. 22BGL194).

Institutional Review Board Statement

Not applicable.

Informed Consent Statement

Not applicable.

Data Availability Statement

We have participated sufficiently in this research to take public responsibility for the appropriateness of the collection, analysis, and interpretation of the data.

Conflicts of Interest

The authors declare no conflict of interests.

References

  1. Fang, Y. Effects of Recycled Powder on Carbonation Resistance of Concrete. Fujian Archit. Constr. 2021, 281, 161–165. [Google Scholar]
  2. Duan, H.B.; Miller, T.R.; Liu, G.; Tam, V.W.Y. Construction debris becomes growing concern of growing cities. Waste Manag. 2019, 83, 1–5. [Google Scholar] [CrossRef]
  3. Zhang, Z.C.; Sheng, G.Y.; Li, J.H.; Xu, L. Waste-free city construction: New concept, new model, new direction. Reg. Econ. Rev. 2019, 3, 84–95. [Google Scholar] [CrossRef]
  4. Aleksanin, A. Development of construction waste management. E3S Web Conf. 2019, 97, 06040. [Google Scholar] [CrossRef]
  5. Li, J.R.; Yao, Y.; Zuo, J.; Li, J.G. Key policies to the development of construction and demolition waste recycling industry in China. Waste Manag. 2020, 108, 137–143. [Google Scholar] [CrossRef]
  6. Ma, M.; Tam, V.W.Y.; Le, K.N.; Li, W. Challenges in current construction and demolition waste recycling: A China study. Waste Manag. 2020, 118, 610–625. [Google Scholar] [CrossRef]
  7. Liu, T.T.; Zhang, J.; Sheng, J. Investigation and Research on Key Factors of Construction Waste Recycling Industry Development. Hous. Real Estate 2021, 21, 136–138+248. [Google Scholar]
  8. Qi, D.D.; Hu, M.M.; Shi, S.Y. Analysis of Critical Success Factors for Recycling of Construction Waste. Archit. Technol. 2012, 43, 601–604. [Google Scholar]
  9. Lu, W.S.; Yuan, H.P. Exploring critical success factors for waste management in construction projects of China. Resour. Conserv. Recycl. 2010, 55, 201–208. [Google Scholar] [CrossRef]
  10. Liu, H.Y.; Long, H.Y.; Li, X.W. Identification of critical factors in construction and demolition waste recycling by the grey-DEMATEL approach: A Chinese perspective. Environ. Sci. Pollut. Res. 2020, 27, 8507–8525. [Google Scholar] [CrossRef]
  11. Wang, Y.; Xue, L.; Gou, W. Key obstacles in resource utilization of construction waste on-site. J. Arid Land Resour. Environ. 2023, 37, 113–119. [Google Scholar] [CrossRef]
  12. Debnath, R.; Bardhan, R.; Reiner, D.M.; Miller, J.R. Political, economic, social, technological, legal and environmental dimensions of electric vehicle adoption in the United States: A social-media interaction analysis. Renew. Sust. Energy Rev. 2021, 152, 111707. [Google Scholar] [CrossRef]
  13. Amponsah, C.T.; Ahmed, G. New global dimensions of business excellence. Int. J. Bus. Excell. 2017, 13, 60–78. [Google Scholar] [CrossRef]
  14. Chen, J.; Wang, Y.Y.; Roeder, C.W.; Ma, J. Behavior of normal-strength recycled aggregate concrete filled steel tubes under combined loading. Eng. Struct. 2017, 130, 23–40. [Google Scholar] [CrossRef]
  15. Bao, Z.K.; Lu, W.S. Developing efficient circularity for construction and demolition waste management in fast emerging economies: Lessons learned from Shenzhen, China. Sci. Total Environ. 2020, 724, 138264. [Google Scholar] [CrossRef]
  16. Jin, R.Y.; Li, B.; Zhou, T.Y.; Wanatowski, D.; Piroozfar, P. An empirical study of perceptions towards construction and demolition waste recycling and reuse in China. Resour. Conserv. Recycl. 2017, 126, 86–98. [Google Scholar] [CrossRef]
  17. Lamba, P.; Kaur, D.P.; Raj, S.; Sorout, J. Recycling/reuse of plastic waste as construction material for sustainable development: A review. Environ. Sci. Pollut. Res. 2022, 29, 86156–86179. [Google Scholar] [CrossRef]
  18. Chen, J.L.; Zhou, W.J.; Li, W. Precondition and Problems in Reutilization of Building Wastes. Archit. Technol. 2015, 46, 1114–1116. [Google Scholar] [CrossRef]
  19. Gálvez-Martos, J.-L.; Styles, D.; Schoenberger, H.; Zeschmar-Lahl, B. Construction and demolition waste best management practice in Europe. Resour. Conserv. Recycl. 2018, 136, 166–178. [Google Scholar] [CrossRef]
  20. Li, J.R.; Liang, J.L.; Zuo, J.; Guo, H. Environmental impact assessment of mobile recycling of demolition waste in Shenzhen, China. J. Clean. Prod. 2020, 263, 121371. [Google Scholar] [CrossRef]
  21. Lu, W.S.; Tam, V.W.Y. Construction waste management policies and their effectiveness in Hong Kong: A longitudinal review. Renew. Sust. Energy Rev. 2013, 23, 214–223. [Google Scholar] [CrossRef]
  22. Hossain, M.U.; Wu, Z.; Poon, C.S. Comparative environmental evaluation of construction waste management through different waste sorting systems in Hong Kong. Waste Manag. 2017, 69, 325–335. [Google Scholar] [CrossRef]
  23. Jin, R.Y.; Yuan, H.P.; Chen, Q. Science mapping approach to assisting the review of construction and demolition waste management research published between 2009 and 2018. Resour. Conserv. Recycl. 2019, 140, 175–188. [Google Scholar] [CrossRef]
  24. Dias, A.B.; Pacheco, J.N.; Silvestre, J.D.; Martins, I.M.; de Brito, J. Environmental and Economic Life Cycle Assessment of Recycled Coarse Aggregates: A Portuguese Case Study. Materials 2021, 14, 5452. [Google Scholar] [CrossRef]
  25. Tam, V.W.Y. Comparing the implementation of concrete recycling in the Australian and Japanese construction industries. J. Clean. Prod. 2009, 17, 688–702. [Google Scholar] [CrossRef]
  26. Huang, B.J.; Wang, X.Y.; Kua, H.; Geng, Y.; Bleischwitz, R.; Ren, J.Z. Construction and demolition waste management in China through the 3R principle. Resour. Conserv. Recycl. 2018, 129, 36–44. [Google Scholar] [CrossRef]
  27. Hyvarinen, M.; Ronkanen, M.; Karki, T. Sorting efficiency in mechanical sorting of construction and demolition waste. Waste Manag. Res. 2020, 38, 812–816. [Google Scholar] [CrossRef]
  28. Mendel, J.M.; Korjani, M.M. Charles Ragin’s Fuzzy Set Qualitative Comparative Analysis (fsQCA) used for linguistic summarizations. Inf. Sci. 2012, 202, 1–23. [Google Scholar] [CrossRef]
  29. Du, Y.; Jia, L. Group Perspective and Qualitative Comparative Analysis (QCA): A New Path for Management Research. Manag. World 2017, 6, 155–167. [Google Scholar] [CrossRef]
  30. Kirchherr, J.; Charles, K.J.; Walton, M.J. Multi-causal pathways of public opposition to dam projects in Asia: A fuzzy set qualitative comparative analysis (fsQCA). Glob. Environ. Change 2016, 41, 33–45. [Google Scholar] [CrossRef]
  31. Rihoux, B.; Ragin, C.C. Configurational Comparative Methods: Qualitative Comparative Analysis (QCA) and Related Techniques; Sage Publications: Thousand Oaks, CA, USA, 2008. [Google Scholar]
  32. Ragin, C.C. Fuzzy-Set Social Science; University of Chicago Press: Chicago, IL, USA, 2000. [Google Scholar]
  33. Ragin, C.C. Redesigning Social Inquiry: Fuzzy Sets and Beyond; University of Chicago Press: Chicago, IL, USA; London, UK, 2009. [Google Scholar]
  34. Coduras, A.; Clemente, J.A.; Ruiz, J. A novel application of fuzzy-set qualitative comparative analysis to GEM data. J. Bus. Res. 2016, 69, 1265–1270. [Google Scholar] [CrossRef]
  35. Bouwmana, H.; Nikoub, S.; Reuvera, M.d. Digitalization, business models, and SMEs How do business model innovation practices improve performance of digitalizing SMEs. Telecommun. Policy 2019, 43, 101828. [Google Scholar] [CrossRef]
  36. Beynon, M.J.; Jones, P.; Pickernell, D. Country-level entrepreneurial attitudes and activity through the years: A panel data analysis using fsQCA. J. Bus. Res. 2020, 115, 443–455. [Google Scholar] [CrossRef]
  37. Ragin, C.C.; Strand, S.I.; Rubinson, C.J.U.o.A. User’s guide to fuzzy-set/qualitative comparative analysis. Univ. Ariz. 2008, 87, 1–87. [Google Scholar]
  38. Schneider, C.Q.; Wagemann, C. Set-Theoretic Methods for the Social Sciences: A Guide to Qualitative Comparative Analysis; Cambridge University Press: Cambridge, UK, 2012. [Google Scholar]
  39. Park, Y.; Sawy, O.A.E.; Fiss, P. The Role of Business Intelligence and Communication Technologies. J. Assoc. Inf. Syst. 2017, 18, 648–686. [Google Scholar] [CrossRef]
  40. Umegaki, H.; Suzuki, Y.; Komiya, H.; Watanabe, K.; Nagae, M.; Yamada, Y.; Kuzuya, M. Association between gait speed and errors on the Clock Drawing Test in older adults with mild cognitive impairment. Sci. Rep. 2022, 12, 9929. [Google Scholar] [CrossRef]
  41. Kong, X.Q.; Liu, X.D.; Shang, Y.P.; Li, Y.; Li, J.B. Performance prediction of DX-SAHP based on multiple linear regression algorithm. Acta Energiae Solaris Sin. 2022, 43, 443–449. [Google Scholar] [CrossRef]
  42. Liao, Z.J. Content analysis of China’s environmental policy instruments on promoting firms’ environmental innovation. Environ. Sci. Policy 2018, 88, 46–51. [Google Scholar] [CrossRef]
  43. Bao, Z.K.; Lee, W.M.W.; Lu, W.S. Implementing on-site construction waste recycling in Hong Kong: Barriers and facilitators. Sci. Total Environ. 2020, 747, 141091. [Google Scholar] [CrossRef]
  44. Omer, M.M.; Rahman, R.A.; Almutairi, S. Strategies for Enhancing Construction Waste Recycling: A Usability Analysis. Sustainability 2022, 14, 5907. [Google Scholar] [CrossRef]
  45. Badraddin, A.K.; Rahman, R.A.; Almutairi, S.; Esa, M. Main Challenges to Concrete Recycling in Practice. Sustainability 2021, 13, 11077. [Google Scholar] [CrossRef]
  46. Jin, R.Y.; Chen, Q. Investigation of Concrete Recycling in the U.S. Construction Industry. Procedia Eng. 2015, 118, 894–901. [Google Scholar] [CrossRef]
  47. Bai, R.; Sutanto, M. The practice and challenges of solid waste management in Singapore. Waste Manag. 2002, 22, 557–567. [Google Scholar] [CrossRef]
  48. Kim, J. Construction and demolition waste management in Korea: Recycled aggregate and its application. Clean Technol. Environ. Policy 2021, 23, 2223–2234. [Google Scholar] [CrossRef]
  49. Hoang, N.H.; Ishigaki, T.; Kubota, R.; Tong, T.K.; Nguyen, T.T.; Nguyen, H.G.; Yamada, M.; Kawamoto, K. Financial and economic evaluation of construction and demolition waste recycling in Hanoi, Vietnam. Waste Manag. 2021, 131, 294–304. [Google Scholar] [CrossRef]
  50. Delvoie, S.; Courard, L.; Hubert, J.; Zhao, Z.F.; Michel, F. Construction and Demolition Wastes: Specific conditions for recycling in North West Europe. Cem. Wapno Beton 2020, 25, 3–20. [Google Scholar] [CrossRef]
Figure 1. The identification of influential factors of CWR based on PEST.
Sustainability 15 16177 g001
Figure 2. The relationship between the methods and hypotheses.
Sustainability 15 16177 g002
Table 1. Multiple linear regression analysis results.
VariablesNon-Standardized CoefficientsStandardized Coefficientstp Value
BetaStd. ErrorBeta
Constant3.03910.505-0.2890.774
Number of Policy Measures1.6781.6220.1981.0340.307
Natural Aggregate Price−0.0130.085−0.026−0.1550.877
Population Density0.0140.0060.5322.3040.026 *
Patents Number−8.886 × 10−50.000−0.118−0.4730.639
* Model significance (F = 4.661; p < 0.05), Adjusted R2 = 0.234; * p < 0.05.
Table 2. Necessity analysis results for high-development level and low-development level.
Condition High-Development LevelLow-Development Level
ConsistencyCoverageConsistencyCoverage
Number of Policy MeasuresHigh0.6680.6590.4290.436
Low0.4290.4220.6640.673
Natural Aggregate PriceHigh0.6570.6420.4570.459
Low0.4460.4430.6440.659
Population DensityHigh0.7200.6960.4010.399
Low0.3790.3810.6950.719
Patents NumberHigh0.6610.6400.4500.449
Low0.4320.4330.6400.660
Table 3. Configuration analysis of high-level CWR industry development.
Condition ConfigurationPolicy–SocietyEconomy
Configuration 1Configuration 2
Number of Policy Measures
Natural Aggregate Price
Population Density
Patents Number
Consistency0.7890.767
Raw coverage0.5710.142
Unique coverage0.4870.057
Solution coverage0.628
Solution consistency0.778
Disclaimer/Publisher’s Note: The statements, opinions and data contained in all publications are solely those of the individual author(s) and contributor(s) and not of MDPI and/or the editor(s). MDPI and/or the editor(s) disclaim responsibility for any injury to people or property resulting from any ideas, methods, instructions or products referred to in the content.

