Abstract
Hazards are becoming more frequent and disturbing the built environment; this issue underpins the emergence of resilience-based engineering. Adaptive pathways (APs) were recently introduced to help flexible and dynamic decision making and adaptive management. Especially under the climate change challenge, APs can account for stressors occurring incrementally or cumulatively and for amplified-hazard scenarios. Continuous records from structural health monitoring (SHM) paired with emerging technologies such as machine learning and artificial intelligence can increase the reliability of measurements and predictions. Thus, emerging technologies can play a crucial role in developing APs through the lifetimes of critical infrastructure. This article contributes to the state of the art by the following four ameliorations. First, the APs are applied to the critical transportation infrastructure (CTI) for the first time. Second, an enhanced and smart AP framework for CTI is proposed; this benefits from the resilience and sustainability of emerging technologies to reduce uncertainties. Third, this innovative framework is assisted by continuous infrastructure performance assessment, which relies on continuous monitoring and mitigation measures that are implemented when needed. Next, it explores the impact of emerging technologies on structural health monitoring (SHM) and their role in enhancing resilience and adaptation by providing updated information. It also demonstrates the flexibility of monitoring systems in evolving conditions and the employment of AI techniques to manage pathways. Finally, the framework is applied to the Hollandse bridge, considering climate-change risks. The study delves into the performance, mitigation measures, and lessons learned during the life cycle of the asset.
1. Introduction
Population growth has significantly amplified the need for product transportation, while frequent natural disasters exacerbated by climate change have resulted in excessive use and aging of transportation assets. Critical transportation infrastructure (CTI), such as highway bridges, is aging worldwide. Preserving its optimal functionality has become a significant challenge, according to European Resilience Management Guidelines [1]. The vulnerability of CTI increases because it is exposed to multiple hazards and stressors (e.g., earthquakes, floods, increased demands of traffic load) amplified by climate change (e.g., extreme temperatures and winter storms). One out of three bridges in the United States must be replaced or repaired [2]. The recent collapse of the Morandi [3] and the Gujarat [4] bridges resulted in catastrophic consequences. Therefore, the transport networks need to be strengthened, and improved management strategies must be implemented.
Building new structures or strengthening existing ones rely extensively on sustainability criteria. The emphasis on eco-conscious design, reduced energy consumption, factors related to climate change, and constraints on carbon emissions have significantly influenced the prioritization and decisions made in structural terms. Due to global economic instability and the depletion of natural wealth, resources are becoming scarcer by the day. Therefore, it is becoming imperative to establish a strategy that promotes technological innovation, environmental and energetic efficiency, and judicious resource allocation. To attain a transportation system that is both sustainable and secure, and that fosters economic growth, it is crucial to take measures that align with resilience goals at various levels.
The digital revolution has resulted in the widespread use of simplified tools, which allow real-time estimation of resilience and sustainability. These evaluations are based on metrics (e.g., strain values, acceleration, deflections) obtained from next-generation sensors (e.g., synthetic aperture Ladar (SAL), global navigation satellite system (GNSS), mobile phones), as well as traditional structural health monitoring (SHM) methods [5,6], and offer essential documentation for informed decision making. The evolution of technology and the architecture of contemporary SHM systems (e.g., computer-vision-based SHM systems (CV-based SHM), digital twins [7], and the Internet of things (IoT)), help limit uncertainties [8], provide future projections, and analyze complex scenarios with increased accuracy [9].
Furthermore, hazards are becoming increasingly frequent due to growing urbanization, climate change, etc., which has resulted in more significant impacts on infrastructure, communities, and the environment. The focus of disaster-mitigation strategies has shifted from disaster response to preparedness and prevention [10], with the aim to safeguard the functionality of the CTI. Climate change introduces daily stresses that accumulate over time and amplify hazard scenarios. Thus, decision strategies for the lifespans of CTI should be proposed right from its conception, and should be subject to ongoing evaluation through CTI monitoring (i.e., timely decision strategy), future scenarios (i.e., hazards, socio-economic, and man-made) and continuous computation of relevant metrics. Implementing those strategies empowers stakeholders and owners to proactively take measures to minimize the consequences, rather than resorting to reactive actions to restore CTI functionality.
To address these challenges, adaptative pathways (APs) have emerged as a recent approach to offer improved solutions and greater flexibility in decision-making processes, especially when dealing with complex, dynamic, and uncertain social and environmental issues. APs [11] were developed to deal with the theory of change and sustainable pathways [12,13,14]. Then, they were applied successfully, specifically to climate change challenges in the water- and land-management fields [11].
In this document, “adaptive pathways” are defined as methods that integrate continuous performance analysis and life-cycle assessment. This approach is coupled with ongoing monitoring and flexible decision making, enabling mitigation and adaptation to any dynamic changes affecting the studied system and its surroundings. The methods can be used at various levels such as asset, infrastructure, network, system, and more. Their applicability at diverse scales emphasizes their effectiveness regarding challenges and complexities in various systems.
Adaptive pathways (APs) are a promising method consisting of a flexible decision-making approach which has been proposed for about a decade now [12,13,14,15,16,17]. They help tackle the complex, changing, and uncertain social and environmental challenges of sustainable planning while incorporating and adapting to time-changing conditions [18,19]. APs can be defined as the succession of actions and decisions implemented gradually depending on future dynamics [20]. Those actions are measures to be applied in an adaptive plan conditional on event occurrence to accomplish future goals [21]. This way, the adaptive plan is flexible, accounts for uncertainties, and prevents regretful and unsuccessful interventions [22,23]. Moreover, AP concepts [24] need to ensure that adaptation responses consider three vital elements for decision-making flexibility over time: (1) dependency of the path, (2) decision sequencing, and (3) timeframes.
This adaptive quality seems appealing particularly considering the climate change aspect, which manifests the gradual accumulation of stressors. Thus, climate change requires adaptive responses to address evolving conditions, and their consequences. The infrastructure must also contend with more frequent and intensified isolated events, such as storms and heatwaves. Moreover, climate change adaptation is shifting from forecasting impacts and delivering several possibilities and solutions for adaptation to the apprehension of adaptive management and dynamic decision procedures [25]. Central to this transition is the crucial role of assessment and monitoring, which supply essential, up-to-date information for AP application, adjustment, and learning. Nevertheless, the concept still lacks detailed and comprehensive real-world examples [26]. Moreover, most of the applications address climate change in water- and land-management fields.
To our knowledge, adaptive pathways are not used yet in the field of transportation infrastructure. Additionally, the existing applications (such as [11]) have not benefited so far from SHM, emerging technologies, or resilience and sustainability metrics to effectively supervise and enhance their progress. Therefore, this article contributes to the state of the art by placing at the forefront a new framework for APs enhanced with emerging technologies. For the first time, APs are explored within the context of critical transportation infrastructure (CTI), particularly for bridges. Resilience is estimated for structural integrity, functionality, operation (e.g., SHM), and resource management for the asset. APs are thus a data-driven, flexible decision-making approach for the series of actions needed to protect and expand the life cycle of CTI. Moreover, decisions are gradually implemented and fine-tuned depending on current and anticipated dynamics (i.e., an adaptive, resilient, and smart solution).
The Hollandse bridge (i.e., “Hollandse Brug” in Dutch) is selected for this study as it is: (1) the oldest prestressed highway bridge in Flevopolder, Netherlands; (2) a CTI of the network; (3) in a surrounding area exhibiting exponential population growth in a short time; (4) suffering from traffic load issues and several mitigation measures were previously taken, offering a comprehensive historical, present, and future perspective for this study; (5) prone to climate change risk; (6) likely to benefit from an extensive monitoring system for the structure and the environment. The development of the AP framework in this case study is endowed by the lessons learned from: (a) continuous performance assessment of the asset; (b) uninterrupted monitoring by using sensors for structural systems and the environment combined with emerging technologies such as machine learning (ML) and artificial intelligence (AI); (c) the range of mitigation measures applied from a pre-available portfolio; (d) continuous assessment of resilience and sustainability indices; and (e) consideration of financial-resource strategies.
In the following, Section 2 introduces an adaptive-pathway framework benefiting from the resilience of monitoring systems and discusses how emerging technologies can enhance the adaptive magnitude. The method also quantifies the resilience and sustainability indexes for APs (Section 2.3). Section 3 discusses emerging technologies in monitoring, such as CV-based systems, AI, and ML, with a focus on SHM. It demonstrates how engineering decisions are supported by up-to-date information from contemporary and smart SHM systems depicted by the resilience and sustainability indices that drive APs. Finally, it discusses the resilience and adaptive aspects of monitoring systems and AI methods (Section 3.4). Section 4 introduces the Hollandse bridge case study, its monitoring system, and its deterioration. Then, Section 5 develops existing and plausible APs for the asset, benefiting from the resilience of monitoring systems and emerging technologies. Section 6 discusses in depth the lessons learned from the Hollandse bridge APs, and Section 7 concludes the paper.
2. Framework for Adaptive Pathways Enhanced with Emerging Technologies
This section introduces the framework for APs enhanced with emerging technologies. Section 2.1 starts with a meticulous analysis of the framework’s inception. Emerging technologies that enhance APs are explained in Section 2.2. APs are continuously assessed using resilience and sustainability indexes. Their quantification is outlined in Section 2.3.
2.1. Inception of the Framework
The framework for adaptative pathways enhanced with emerging technologies proposed in this article is inspired by [27,28,29] and then further refined for CTI as described herein. The framework can also consider the data quality from monitoring systems as introduced in [30,31].
The framework (see Figure 1) has three key phases: (1) continuous performance assessment; (2) monitoring enhanced with emerging technologies; and (3) adequate mitigation measures for CTI. The framework accounts for the climate change impacts and life-cycle assessments. It is divided into nine steps emphasizing proactive planning for adaptation under climate change, rather than responding reactively.
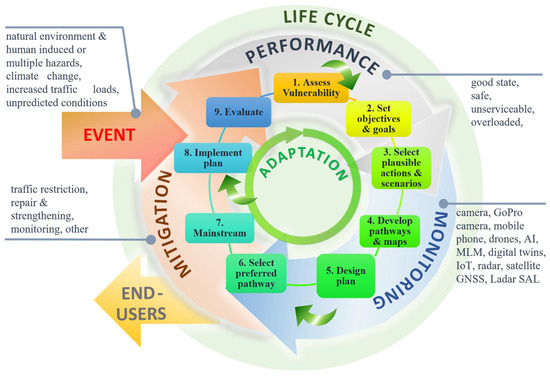
Figure 1.
Framework for enhanced adaptative pathways.
The nine steps are:
- Assess vulnerability. The potential impact (i.e., exposure and sensitivity) for the specified climate-change projections and trends are assessed. The assessment includes: (1) the climate projections and hazards for the studied region; (2) the risk and its potential impact (i.e., the climate-change exposure and sensitivity); and (3) the adaptive capacity, i.e., the capacity to cope with current and future climate changes (or any other stressors). Resilience and adaptive capacity are interconnected because a high level of adaptive capacity ensures absorption of impacts of climate change and their rebounds [27]. The assessment also considers the population and traffic growth.
- Set objectives and goals. In this step, adequate goals and objectives are set for the identified vulnerabilities to improve the adaptation of social–technical–environmental (STE) conditions. Vulnerabilities are prioritized according to: (1) their risks associated with climate change; and (2) their capacity to accommodate within the constraints of available resources and technical and institutional capacities. Adaptation measures (short- and long-term) are then determined and selected (i.e., sensitive assets, adaptive capacities mitigating impacts, etc.). The primary stakeholders and decision-makers must be involved in implementing the measures.
- Select plausible actions and scenarios to account for the region’s geographical and demographic characteristics, country, infrastructure, population density, STE conditions, etc. A variety of types and timeframes for actions and scenarios must be considered. The technical effectiveness, cost–benefit analysis, and implementations (i.e., availability of the needed skills, information, institutions’ capacities, and budgets) are essential to the process, and, therefore, they must be included.
- Develop pathways and maps for APs after plausible actions and scenarios are selected. Types of adaptation measures, strategies (non-structural, structural, robustness, flexibility, resilience, etc.), and timing of actions are evaluated and incorporated in the APs.
- Design the adaptation plan once APs and maps are developed and strategies are determined. Means are selected to ensure: (i) the robustness, resilience, and flexibility of the plan; and (ii) the availability of the necessary investments.
- Select the preferred pathway and reassess its performance through time to adapt to newly identified challenges and rely on insights from all other already developed pathway scenarios.
- Adapt the plan to the mainstream ensuring vulnerabilities, preparedness, climate impacts and adaptation responses are translated into well-suited and holistic policies, programs, plans, and projects at all levels (i.e., national, regional, etc.).
- Implement adaptation plan by building capacity and eliminating barriers. Achieving this requires overcoming challenges in many areas. Some examples are: (i) guaranteeing adequate administrative, personnel, and institutional capacity; (ii) ensuring legal frameworks and enforcement, and a participatory and inclusive process; (iii) sustaining a strong scientific basis for monitoring and policy; (iv) using life-cycle cost and elaborating on sustainable finance models; and (v) preparing for external events (i.e., generating negative consequences or opportunities for improvement), helping implement proactive “no-regrets” adaptation measures [27].
- Evaluate and monitor adaptations. Policymakers must check that the measures considered by stakeholders: (i) are favorable to citizens; and (ii) align with the anticipated outcomes assessed during step 1 (i.e., assess vulnerability). Climate change unfolds over the long term; thus, evaluating the outcomes of the adaptation measures necessitates an extended timeframe to be adequately comprehended. Adaptive management processes allow reflection on these changes based on evaluation results. They review the evaluation results, address the adaptation measures’ flaws, promote and implement new adaptation measures, and revise implementations of adaptation strategies.
2.2. The Adaptive Magnitude Enhanced by Emerging Technologies
The first step to generating APs is considering all possible levels, events, decisions, and scenarios for climate change and other hazards of interest. Secondly, several APs are developed to represent several existing and plausible scenarios and sets of decisions. Next, one of the plausible pathways is chosen for implementation as a starting point, followed by some events (such as increased population and traffic), and then, in parallel with the analysis of the bridge performance levels, adequate decisions are made for bridge maintenance and SHM of the bridge as per the needs of the developed study herein (details presented in Section 4 and Section 5). The chosen pathway is the “plausible pathway” (or a combination of the already existing pathway with a future plausible one). The chosen pathway is flexible and dynamic and can change progressively following the occurrence of new events and situations, hazards, and monitoring data.
For the proposed method, the decision points are synchronized; thus, a specific event (such as an increase in population or traffic, a flood event, etc.) induces monitoring-data-updated analysis, and the performance is studied to suggest mitigation measures and more-adequate actions for the installation of monitoring systems. The decision points can depict existing actions (i.e., based on the history of the studied asset, city, etc.) or illustrate plausible actions (i.e., scheduled to be carried out in the future).
Figure 2 is a generic representation of the magnitude of adaptation throughout the life cycle of an asset and depicts several existing and plausible APs while various hazard events occur. The plausible pathways start with a decision point that represents the already-taken actions based on the history of the studied asset or plausible actions that are scheduled or investigated to be adopted in the future. Hazardous events may pre-exist or follow the decision points and are illustrated with a lightning symbol.
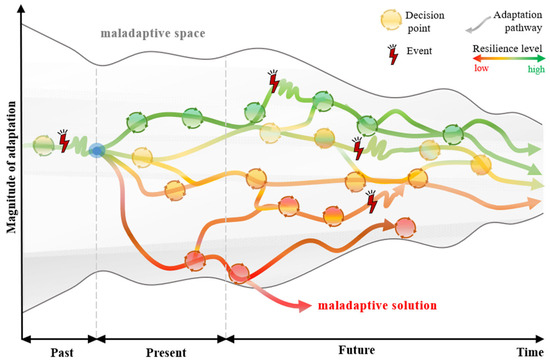
Figure 2.
Generic adaptative pathways (plausible and existing).
The magnitude of adaptation is defined by the envelope of the extreme pathways and decisions (grey hatched area). Over time, the possible efforts or available tools to increase the robustness of the system vary. The alternative pathways may overlap due to the degree of complexity reached by the actual system. This creates limitations to the remaining plausible solutions, as most of them have already been implemented. In the long term, the system becomes less adaptive as it approaches the boundaries of the adaptive space and is characterized by lower flexibility in coping with stressors. In Figure 2, the magnitude of adaptation is shown on the y-axis, and the time (past, present, and future) is shown on the x-axis.
Any pathway outside the adaptive space results is considered a maladaptive solution, which means they are not chosen for potential implementation. Maladaptive solutions may result from decisions related to increased risk of adverse outcomes. For example, maladaptive solutions would be any effort that decreases an asset’s value, such as: (i) the increase in greenhouse emission; (ii) the deterioration of the ecosystem; and (iii) high economic risk. For each pathway and measure taken, the resilience level is assessed. As such, to avoid devaluation of the asset, the resulting pathway is a sequence of events and decisions within the adaptive space that follows an increased level of resilience throughout time. The resilience level is entirely data-based and is derived from an overall average of risk, hazards, monitoring, and components (structural, functionality, resources, operation), while also considering the reliability level. This level can vary from action to action, leading to different pathways, and is depicted with a color palette ranging from red to green for “low” and “high” resilience, respectively (Figure 2). The higher the resilience level is, the longer the adaptive pathway can be.
However, increased resilience levels did not always ensure high levels of sustainability. In past decades, sustainable planning and management were not of high concern. Sustainability was promoted in the 1987 WCED Commission’s Report, where sustainable development was defined as “the development that meets the needs of the present without compromising the ability of future generations to meet their own needs” [32]. Since then, the three different pillars of sustainability have been related to: (1) the environment; (2) society; and (3) the economy [33]. In light of this, the decision points are not only monitored by means of the resilience metrics but also by sustainability metrics, as presented in Section 2.3. The digital era has offered many smart and efficient computation, storage, and prediction solutions that are discussed further in Section 3.
In this study (detailed in Section 4 and Section 5), all pillars of sustainability are considered, including: (1) the environment through climate change; (2) society through population and traffic increases; and (3) the economy through the resources allocated to the infrastructure project. Aiming to enhance APs’ qualitative assessment, resilience and sustainability indices are combined with structural and monitoring data. Assisted by emerging technologies of AI that help to increase reliability, the policy followed under the occurrence of new events is updated. The progressive change in the AP demonstrates the flexibility to adapt.
2.3. Quantification of Resilience and Sustainability
The importance of resilience results from the aptitudes of structures to adequately accommodate abrupt events (i.e., earthquakes, hurricanes, storms, and extreme climate hazards) and chronic stressors (i.e., increased temperature, humidity, CO2 levels, etc.) during their lifetime. Those aptitudes are: (1) preparing and planning before an event or a stressor; (2) absorbing the hazard event and consequences; (3) efficiently responding to the hazard-event disturbance by using the available resources adequately; (4) recovering quickly and restoring the functionality of the infrastructure or system; and (5) adapting to the changes in circumstances as well as retaining lessons for improvement in the future [34,35]. Resilience engineering is considered for all levels, from materials and infrastructure to country levels, etc., and aims to study multi-hazard cascading events and their interdependencies [36].
Numerous resilience-assessment procedures and metrics assessments are available [34,35,37,38,39,40,41,42]. These quantifications increase in complexity conditional on needs and scales (i.e., single facility or system, the system of assets, and infrastructure networks). Multicriteria approaches that consider different parameters and criteria for estimating structures’ resilience and reliability have also been proposed in the literature [43,44]. Recently, quantifications have allowed us to account for community resiliency by incorporating socio-economic interactions [45,46] and interdependency [47]. Other resilience methods exist, such as agent-based and fuzzy [48,49].
However, resilience-assessment procedures need to be followed by adequate decision-making processes. Therefore, APs would be a suitable framework to consider the flexible decision-making process and social and environmental changes (e.g., climate change, adaptation process).
Under the prism of the United Nations (UN) Sustainability Development Goals (SDG), an in-depth sustainability analysis is needed, arraying the three pillars of environment, society, and economy. Very few methods were available to suggest and compute sustainability metrics [43,50,51,52]. A holistic approach that combines the pillars of sustainability and resilience aptitudes is necessary, especially now, to adapt the structures to the ever-changing environment under continually augmenting climate effects.
The proposed framework utilizes a new methodology [53] that combines resilience and sustainability quantification (Section 2.3.2). The used quantification method is a data-driven multicriteria approach where the different aging periods of the asset and the various parameters of resilience components are weighted. Resilience quantification considers four components of the asset’s life cycle: performance/safety; functionality; operations; and resources. Functionality of components has already been considered the most crucial indicator for estimating the resilience of a CTI, and is also related to the structural integrity of the asset [35,41,42,54]. However, in the adopted methodology, the indicators mentioned above are considered as separate resilience components to identify the criticality and participation levels of the resilience.
Socio-economic criteria corresponding to sustainability demands are also considered. In line with this, the maintenance of structures for their recovery and adaptation, along with limitations derived from the safety, functionality, or environmental demands, are essential for the decision-making process. Resources are strongly correlated with the cost of the available mitigation measures that can be adopted [55,56], affecting also the flexibility of the AP. For instance, adaptation is limited if resources are lacking. Therefore, investment is essential for meeting the targeted levels and is considered one of the resilience components. Modern needs also include CTI operations, usually based on technological advancement, and contribute drastically to adaptation. For the AP method considered herein, the resilience index (Section 2.3.1) and sustainability index (Section 2.3.2) are computed using the inflow of SHM data throughout the asset’s lifetime, setting the ground for AI predictions of plausible pathways.
2.3.1. Resilience Index
Data-based resilience quantification accounts for proper criteria throughout the aging periods of an asset. Those periods are considered as key performance indicators (KPIs): (a) initial state; (b) absorption; (c) idle period; (d) recovery; and (e) adaptation. The quantification includes four main components organized into a group of performance indicators (GPI). The GPI expresses: (i) structural integrity; (ii) functionality; (iii) operations; and (iv) resources; each containing various parameters [53]. In the case of a reinforced concrete bridge, the structural integrity is indicated by performance indicators (PIs) such as the material properties (e.g., strength), the width of cracks, strains, and deflections. Functionality changes are expressed in traffic load, the number of lanes that are not in use, and the traffic regulations. Operations may include but are not limited to the type of monitoring system, analytics, data management, storage, and the system’s security. Resources are estimated in monetary levels and the personnel needed to run, manage, maintain, and repair the asset. During design, many natural hazards are assessed with an increased accuracy level. Currently, the increasing frequency of climate-change-related hazards is resulting in more-frequent impacts on the built environment [57]. Therefore, resilience should be estimated for each component.
The methodology sets a scale of importance for every parameter ranging from 1 to 4, with “1” corresponding to a low importance level (γ). For instance, at the initial and absorption states, the importance level of the material’s strength is considered to be higher. In contrast, the importance level is lower in the idle, recovery, and adaptation periods since decaying is expected. Each quantity’s reliability level (L) is also a crucial variable. For example, the reliability level of a chosen material’s strength ranges from 95% to 99% at the initial design stage. After this period, depending on the damage type and monitoring data available, the material’s reliability level decreases, especially close to the end-of-life of an asset. The reliability level throughout the life cycle of the asset is included by applying a reducing factor [50,53,58,59,60]. The data acquired above lead to iterative model updating for the GPIs.
The resilience quantification derives from Equations (1) and (2). Based on Equation (1), the overall resilience index (RI), at time t, is estimated as the average number of the RIs of all the components (RIc): (i) structural integrity; (ii) functionality; (iii) operations; and (iv) resources. Each RIc is calculated from Equation (2) and multiplied with a participation factor depending on the structure’s age and the component’s criticality at the specific aging period examined.
where:
- RIc is the resilience index of components (c) and c is
- ο
- structural (s),
- ο
- functional (f),
- ο
- operational (op), and
- ο
- resources component (r);
- RI is the total resilience index of the asset;
- βc(t) is the resilience participation factor of the component;
- γi,c(t) is the importance level of the parameter (PI);
- Li,c(t) is the reliability level of the parameter (PI).
The participation factors of each component (βc) result from a sensitivity analysis (SenAn) based on a targeted resilience level. Since the methodology is data-based, the more accurate the data and the more reliable the technology is, the more representative the resilience index of the studied infrastructure. For instance, during preparedness periods, the targeted resilience level can benefit from up-to-date information offered by various systems, directly or indirectly, each one having a particular accuracy depending on the equipment, acquiring method, and conditions. For example, in the case of visual inspections, there are limitations and difficulties, whereas, if smart and adaptive computer-vision-based systems are used, the collection gives multiple information points of high accuracy without affecting the functionality of the bridge, enhancing the assessment of the condition in an easy, expedient, and objective manner [61]. Finally, the resilience metric for a time duration Δt is simply the area below the curve formed by the RI(t) for the considered period.
2.3.2. Sustainability Index
In the interests of sustainability, the developed methodology of [53] is compiled to estimate the sustainability level of the asset throughout its life cycle. In this research, sustainability is investigated indirectly from the estimated resilience curve. The parameters for the calculation of the RI also includes the three pillars of sustainability, which are: (a) economy; (b) society; and (c) environment. Thus, parameters, such as the available resources (e.g., monetary and human), limitations (e.g., financial, delivery, or delay time), and action time correlated with the cost, are utilized to express the economic level. The “environment” pillar is taken into account using the occurrence of a natural hazard through the different periods of the asset’s life cycle, as well as with the limitation parameter in the case of environmental restrictions. Finally, hazard events (e.g., increased traffic demand, natural-hazard occurrence) are accounted for in every KPI of resilience. Together with the structural integrity and functionality components, it depicts the collateral influence of societal variables on the estimation of sustainability.
The sustainability level is derived by attributing different weight factors (Wf) for the KPIs based on a sensitivity analysis. Each KPI contributes at a different rate to the final sustainability-level estimation expressed by sustainability indices (SΙs) at time t, as Equation (3) describes. The calculation process of the overall SI leverages the already estimated RIs of specific periods of the asset’s life cycle (RIm). It follows the estimation of the sustainability indices for each of the KPIs (SIm) in Equation (4). The SIs are used to calibrate into four different levels the capacity of the asset in structural, functional, operational, and resourcefulness terms in the present and future. Therefore, this methodology is a reliable means not only for the asset’s management but also for the development of APs. By implementing the AP framework, the metrics of the above equations give evidence and updates for each plausible pathway based on the inflow of the SHM data and information. Finally, the sustainability metric for a time duration Δt is simply the area below the curve formed by the SI(t) for the considered period. Figure 3 resumes the interaction details discussed in Section 2.3.1 and Section 2.3.2 as a flowchart.
where:
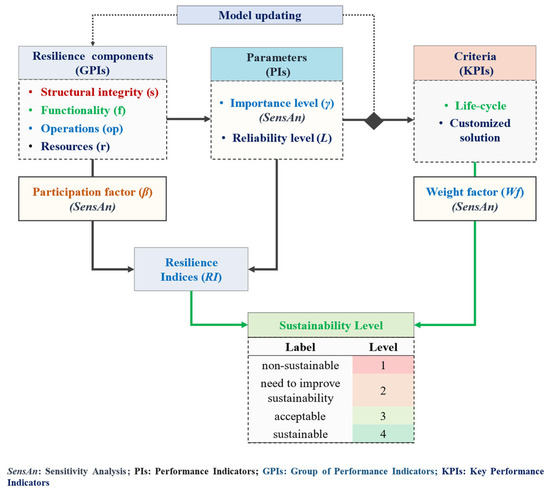
Figure 3.
The flowchart of the applied methodology for resilience- and sustainability-index assessment.
- SI is the overall sustainability index of the asset;
- m is the total number of KPIs, which are the distinct periods of the asset’s life cycle (e.g., initial state, absorption period, idle time, recovery period, and adaptation);
- SIm is the sustainability index for a certain distinct period of the asset’s life cycle;
- RIm(t) is the overall RI for a certain distinct period of the asset’s life cycle;
- Wfm(t) is the weight factor for each KPI.
3. Emerging Technologies in Monitoring and Their Adaptive and Resilient Aspects
Emerging technologies have a significant role in asset management and maintenance. They are used to enhance the framework of APs. In Section 3.1 and Section 3.2, the CV-based systems, artificial intelligence, and machine learning with a focus on SHM are discussed. Section 3.3 debates how resilience engineering benefits from up-to-date information provided by modern SHM systems.
3.1. Computer-Vision-Based SHM Systems
In broad terms, there are three sensor/sensing technology types: contact; non-contact; and remote. Contact sensors such as strain gauges and accelerometers are most commonly used in the SHM of bridges [62,63]. They are mature and provide accurate and reliable measurements. Their main disadvantages are related to their: (i) installation, which requires access to the bridge and may involve working at heights; and (ii) maintenance, which may require replacing malfunctioning sensors. Remote monitoring covers large geographical regions using satellite radar imagery [64]. This technology offers collection of measurements of bridge movements with an accuracy of millimeters. The disadvantage is that bridge movements can be collected only in an interval of days. Non-contact sensing (as defined in this article) utilizes laser- and vision-based technologies. The former sensing technology is very costly. The latter technology is becoming very attractive for measuring bridge response due to its low cost and easy set-up [65]. Vision-based sensors (or cameras) collect image frames, which are analyzed to track certain features related to the structure’s condition at local and/or global levels [66]. This technique is usually known as computer-vision-based (CV-based) SHM. CV-based systems are frequently installed (or set up) away from the bridges without disrupting traffic or requiring work at heights. In comparison to contact sensors, CV-based systems can be effortlessly recovered. The quality of the measurements is influenced by environment and camera specificity factors.
CV-based systems offer the collection of a wide variety of information: (i) traffic, which includes the number of cars, pedestrians, cyclists, etc., axel locations, and type of vehicles; (ii) distributed temperature on the bridge surface; (iii) bridge response, for example, vibration parameters or static response due to slowly passing vehicles; and (iv) surface measurements such as cracks and spalling. A typical CV-based SHM system comprises a camera, a tripod (hardware), and image processing algorithms (software). A variety of cameras, such as action cameras, professional cameras, security cameras, and smartphone cameras, have been used in bridge monitoring projects [67,68,69,70].
Figure 4 shows the application of a CV-based SHM system for monitoring structural response and traffic on the University of Twente (UT) Campus bridge [71]. The system consists of two cameras: (1) a traffic camera (its field-of-view is shown in Figure 4a; and (2) a monitoring camera for measuring bridge response. The monitoring camera has a zoom lens to capture small bridge deformations. Within its field-of-view both artificial targets (which have known dimensions) and natural targets (such as bolts and knots in timber elements) can be seen, as shown in Figure 4b. Figure 4c plots raw (i.e., not pre-processed for measurement noise) vertical displacements of a target (from Figure 4b) during a single pedestrian crossing. Figure 4d,e plot the unit influence line induced by the moving load and power spectral density (PSD), respectively. The influence line can be used to characterize the load and response mechanism and assess the performance of the bridge when the known load is used as the moving load. The PSD plot shows the first few bridge frequencies, which can also be used to characterize the dynamic response of the bridge.
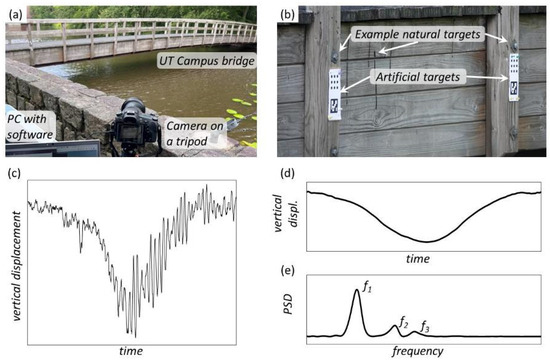
Figure 4.
CV-based SHM system for bridge monitoring: (a) the setup of the system; (b) the camera field-of-view; (c) raw vertical displacements of the bridge at its midspan during a pedestrian crossing; (d) static response component; (e) and power spectrum density plot.
3.2. Artificial Intelligence and Machine Learning with a Focus on SHM
Artificial intelligence (AI) and machine learning (ML) support the analysis of SHM data. The machine learning model (MLM) is a trained computer system that generates data, makes accurate predictions, and can identify errors or fault measurements and update [61,66,72,73,74,75]. The algorithms are selected to minimize data-processing time and errors and provide efficiency. Many AI methods, such as fuzzy logic, neural networks and autoregressive models, find applications in structural engineering since they assist in the condition assessment of an asset by: (i) identifying the critical parameters; (ii) making reliability analysis; (iii) identifying load patterns or extreme loads on structures (e.g., traffic load, extreme temperature, wind, or snow); (iv) making load-effect analysis; (v) early warning assisting in decision making; and (vi) recognizing fault measurements of sensors [72,73,75,76]. MLMs are developed based on one of three categories: (1) supervised learning (e.g., classification or regression); (2) unsupervised learning (e.g., clustering); and (3) reinforcement learning [75,77,78] and criteria and thresholds defined by expert judgments and codes.
Figure 5 illustrates the process for decision making based on monitoring data.
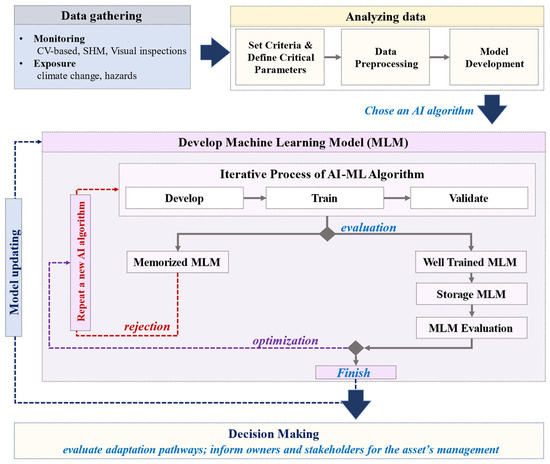
Figure 5.
Artificial intelligence (AI) and machine learning model (MLM) process for decision making based on monitoring data.
3.3. How Modern SHM Systems Offer up-to-Date Information to Enhance Resilience
SHM systems enable data-based decision making about the asset’s functionality and advocate for assessment (directly or indirectly). Despite the massive quantity of measurements and the information gathered, when cross-checked using data acquired from various systems, their reliability level and accuracy are enhanced. This leads to a more pragmatic quantification of infrastructure resilience and, in the long term, to an upgraded resilience level [79,80].
SHM systems consist of both hardware (e.g., sensors, cameras, mobile phones) and software parts (e.g., databases, process algorithms) and use internet networks (e.g., cloud storage). Some studies [66,81,82] have reported the foremost SHM contributions to infrastructure-resilience qualities. The resilience at the SHM level can also be described with an approach analogous to that for an asset. The authors of [83,84] introduced the aspect of the resilience of CV-based SHM systems to acute and isolated shock events, which was inspected further for adaptation aspects (Section 3.4). However, the distinct periods (Figure 6 and Table 1) are different from the resilience periods on the global level (e.g., bridge resilience). The local resilience depends on the SHM system chosen (sensors, wiring, internet, software, algorithms, output, time, environmental conditions, system maintenance, access, and end-user). It is affected by events that do not necessarily have a tremendous impact on the asset’s performance, though they affect the accuracy of measurements. For instance, in extreme environmental conditions such as strong wind or high temperatures, the sensor can be damaged, dislocated, or even fall. Thus, the camera’s lens can potentially break and lose the measurement. Therefore, the system’s functionality is affected, and an immediate replacement is needed. Similarly, the case of a power outage, which results in the disconnection of the network or even a bug in the algorithm used, affects the resilience quantification or further model updating both at the local and global levels, increasing uncertainty.
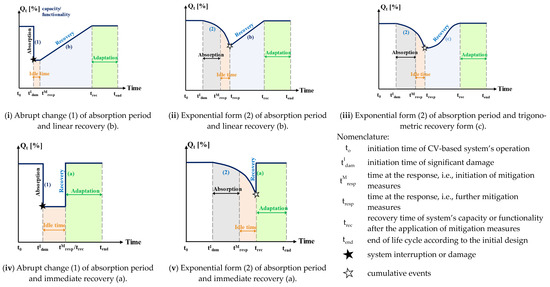
Figure 6.
Different forms of CV-based SHM systems’ resilience curves.

Table 1.
Description of the different events determining the CV-based SHM systems’ resilience curves.
At the local level, many factors affect the form of the resilience curve differently. For instance, for the CV-based SHM systems, the main factors could be: (i) the interruption of the network or the CV-based SHM system’s aging, such as a restart of the computer, internet disconnection, cable replacement, a bug of the AI algorithm; as well as (ii) the occurrence of cumulative events, such as fault measurements, breakdown of the camera or camera lenses; and (iii) the environmental conditions, such as wind, fog, rain, and light conditions. Therefore, depending on the occurrence of an extreme event and the exposure conditions, especially with climate-change events, there is an impact on the resilience components of operation and resources, as Figure 6 and Table 1 illustrate. For example, the absorption of an occurrence when monitoring with a CV-based SHM system can have two forms: either an abrupt change (1) for events such as hardware damage (Figure 6(i)), an interruption of the system (Figure 6(iv)) or an exponential form (2) when cumulative events that affect the CV-based SHM system’s response occur (Figure 6(ii–iv)).
Possible events relevant to these kinds of curves would be the need for system upgrading due to the decaying of wiring or cables (Figure 6(ii)) and damage to the system’s components due to environmental exposure and conditions such as high winds, heavy rain, and dense fog (Figure 6(iii)). Additionally, the recovery period, depending on the mitigation strategy, follows either: (a) a steep form (immediate recovery); (b) a linear; or (c) a trigonometric form, resulting in adapting the system to both hardware and software in future time. The different forms of recovery period are described extensively and are matched with the various events, exposure conditions, and time in Figure 6 and Table 1.
3.4. Adaptive Aspects of Monitoring Systems and AI Methods
All data and information derived from the monitoring systems assist in further decision making regarding the management of assets. As mentioned, climate-change events necessitate an innovative approach to acquiring and using the data. Following a strategy based on cost reduction, minimization of losses, and fast adaptation demands, monitoring should ensure increased reliability levels and reduction of uncertainties. The CV-based monitoring systems, in combination with AI and MLM tools, provide a wide range of measurements and can be characterized as: (i) reliable; (ii) resilient; (iii) adaptive; and (iv) sustainable, despite the challenges or risks of their application. Table 2 below summarizes the four dimensions for each one of those systems and methods as well as the possible risks accompanied by appropriate solutions [81,85,86,87,88,89].
Table 2.
The four dimensions of CV-based artificial intelligence (AI) algorithms and machine learning models (MLM) methods, possible risks, and appropriate solutions.
The adaptive nature of CV-based systems is highlighted by their ability to produce a wide range of data and measurements from only one kind of sensor. For example, a mobile phone can record, store, transmit, and visualize data. It can provide measurements of both deflections of a bridge deck and the traffic flow. Those data can easily be further processed using different types of AI algorithms and MLM methods to generate complex scenarios of hazards, produce artificial data, and lastly, update models, such as finite element models (FEM) and digital twins (DT) as well as discover alternative, optimized solutions [72,90].
Regarding the sustainability of sensors, the critical parameters are the production and the cost. Even though technological advances in production lines limit the carbon footprint of production and have radically reduced the purchase cost of sensors, unexpected events, such as the energy crisis, can have an unfavorable effect [88,89]. Apart from the cost, an essential parameter of applying sensors is their communication with emerging technologies that are self-evaluated, self-updated, and self-adapted [86,91,92,93,94].
The architecture of a well-designed and secured monitoring system is fundamental to supporting documentation and facilitating decision making. Communication between the parts of the system, especially in CV-based SHM systems (sensors, AI, MLM), provides provisions under changing conditions, risks, and hazards and enables stakeholders to design adaptation plans. During this design, many options can be implemented over time, on the local or global level, incorporating a long-term vision and objectives into short-term decisions. Those adaptation options take into consideration an asset’s life cycle expansion by informing modeling with predictions from MLMs based on, e.g., climate-change effects and traffic increase [72,85,95]. The timeline of the decisions towards implementing the adaptation process is the adaptive pathway with which different defense levels are built for multiple hazards, enhancing the reliability, resilience, adaptiveness, and sustainability of decaying infrastructures (Figure 7).
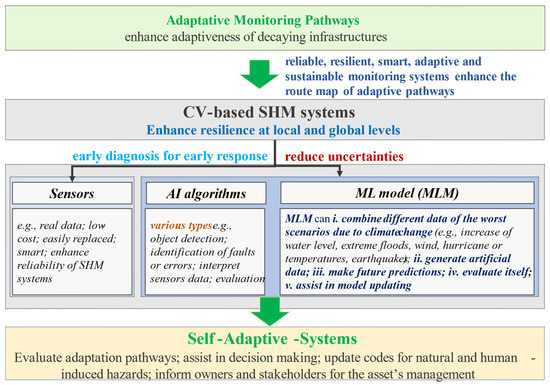
Figure 7.
Architecture of innovative CV-based systems.
4. Case Study Bridge
To explain the previously discussed, the case study of the “Hollandse bridge” is used. Section 4.1 introduces the bridge, Section 4.2 presents the monitoring systems installed on the bridge, and Section 4.3 offers the details, in time, of the deterioration of the bridge.
4.1. Hollandse Bridge
The oldest prestressed highway bridge of Flevopolder in the Netherlands, “Hollandse bridge” [96], was chosen as the case study due to the various mitigation measures taken over time. The bridge has been operating since June of 1969, and from the very start, the traffic load has increased radically, resulting in functionality problems [96,97]. The development of the nearby city, Almere, augmented the traffic flow, and the bridge was overloaded in the 1980s. Various mitigation measures were taken during the nineties (from 1993 to 1999), such as widening the bridge’s deck. In 2007, the Dutch Organization for Applied Scientific Research decided that the bridge was unsafe to carry traffic loads over 12 tons and applied traffic restrictions. The decision led to tremendous economic losses for the county, which triggered the renovation of the bridge one year later (2008) and the installation of an SHM [96,97]. However, the continuous increase in the traffic load from 2011 to 2014 resulted in further actions, including the reconstruction of the existing bridge and the construction of a new one next to it.
4.2. Monitoring of the Bridge
The monitoring of the bridge started in 2008 during the renovation period. The authorities decided to install an SHM system, including sensors, cameras, and a weather station. The main scope of the installed SHM system was to provide data during this period regarding the bridge’s structural integrity. The total of 145 sensors includes 34 vibration sensors, 91 strain gauges, and 20 thermometers to measure deflections, displacements, strains, and temperature (Table 3). Also, there is a weather station that gathers respective data and a video camera that provides a continuous video stream of the actual traffic [97,98]. This is the first fundamental decision for a mitigation measure that enables the premature version of the CV-based SHM system.
Table 3.
Sensors’ characteristics of the bridge’s SHM system.
The available data of the SHM system consisted of short snapshots of strain and videos, which were manually transported from the site to the monitoring location at Leiden University. The collected data operate at a frequency of 100 Hz and are related to the traffic load and the environmental conditions of the bridge. Overall, 56 kB of data per second are stored, equivalent to approximately 5 GB per day and over 1.7 TB yearly. Also, the video camera produces a data stream in a similar range with a compressed video of 46 kB per second [99].
4.3. Deterioration
As mentioned, the traffic increase over time led to overloading the bridge and was the main cause of deterioration. Consequently, the bridge’s functionality efficiency became a concern, despite the consistent implementation of measures, as it struggled to accommodate the rising demands of increased traffic. This led the bridge’s structural integrity to deteriorate due to heavy loads in 2007. The crucial decision to build a second bridge next to the existing one came inevitably in 2019 due to a 123% increase compared to the 1990s’ traffic load. The future prediction of the traffic increase in 2030 is expected to exceed this rate and double [96].
InfraWatch (2008) [98] closely investigates monitoring data from Hollandse bridge and publishes records of measurements and reports. Based on those public data (strains), as well as estimations of future traffic loads [96] derived from the CV-based installed monitoring system, studies have indicated the most appropriate ML algorithm is vanilla long-short term memory (LSTM) [100] to predict the future trend of the bridge’s response, resilience, and sustainability [53]. The extension of the existing CV-based system to include those algorithms and consider scenarios of natural hazards or catastrophic events aims to build up the defense of the asset and expand its life cycle using the most efficient decision through its adaptive pathway.
5. Adaptive Pathway Benefiting from the Resilience of Monitoring Systems and Emerging Technologies for Hollandse Bridge
The EU JRC workshop on system thinking for critical infrastructure [101] developed operational frameworks and management planning, including APs, for a series of events based on the national risk profile in the Netherlands. According to the recent study by Werners et al. (2021) [11], the APs for Hollandse bridge are examined considering not only climate change and land management but also accounting for population growth and traffic, bridge performance, and continuous mitigation actions as well as updating of the monitoring system. The nine steps of the proposed framework adopted for the case-study bridge are summarized in Table 4.
Table 4.
Framework adapted for the Hollandse bridge.
In line with the national risk profile of the region [101], the asset’s vulnerabilities and the possible actions are highlighted. The complex risk resulting from the interaction of climate hazards, population, and traffic growth extends the bridge’s lifetime. Climate-change risk is projected for the near future (2025–2030), considering increased precipitation and water levels alongside erosivity and alterations in soil conditions [103,104]. On this ground, four goals are defined: (i) accommodating the increase in traffic and population along with climate hazardous events; (ii) efficient and reliable monitoring; (iii) continuous bridge-performance assessment and prediction; and (iv) the timely updating of the adopted management policies.
A series of all possible performance levels, events, mitigation measures, and scenarios for climate change are listed in Table 5 below. The performance of the bridge can be, for example, investigated using the Bridge Inspector’s Reference Manual (BIRM) [105], the Code of Practice (CoP) [106], or the Cost TU1406 standardized method at the European level [107,108].
Table 5.
The list of all plausible events, levels, and decisions related to population and traffic growth, bridge performance, mitigation, and SHM.
Table 5 also includes several performance classifications and SHM solutions for augmented resilience and augmented smart resilience. Figure 8 represents the developed AP map with a few plausible future pathways and actions, including adopting new technologies, such as AI, MLM, and DT. This map also illustrates transfer points between solutions and conditions forming the AP. The map shows that the potential for future adaptation reduces, given the current technology and investment level. Examining past decisions and evaluating the measures’ effectiveness is fundamental to selecting future actions and transfer points. Without a doubt, the records using CV-based SHM systems and AI technologies provide information to make conclusions on multiple levels. Considering the future projections of climate-change events, the reflective learning procedure, which Werners et al. (2021) [11] suggest, provides justifications for developing the future national safety and security strategy.
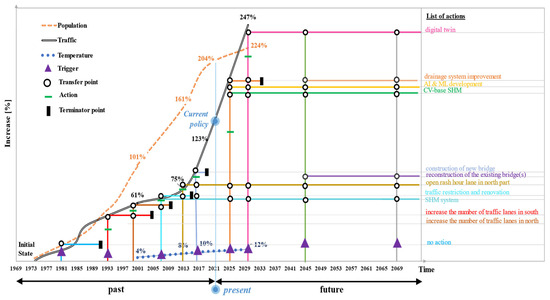
Figure 8.
Map of the future adaptive pathways of the Hollandse bridge.
Figure 9 demonstrates the already applied pathway and one of the selected plausible directions that can be implemented in the future. The distinct events considered, namely traffic and population increase, precipitation, and water level increase, present overlapping (hatched areas) and, through time, restrict the adaptation magnitude of the bridge to a limited range of options. This representation of the selected adaptive pathway is based on synchronized decisions, as listed in Table 6, where the list of chosen and plausible future events and the selected decision points are shown.
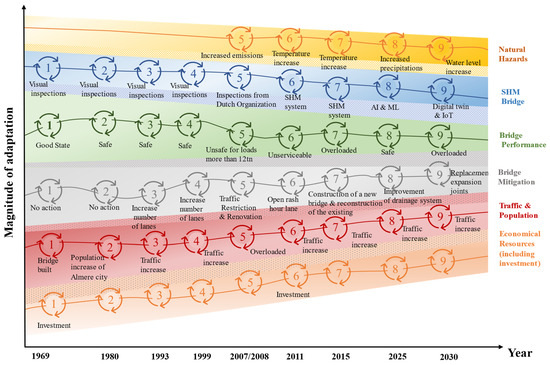
Figure 9.
The five selected and existing adaptative pathways for the bridge are red for population and traffic, green for performance, grey for mitigation measures, blue for SHM, and yellow for climate change.
Table 6.
List of chosen and plausible events and decision points.
The shadow-width of each adaptive pathway is its adaptive space. This space becomes narrower over time because of efforts by municipal managers to increase the robustness of the system. Consequently, the system risks becoming non-adaptive as it approaches the boundary of the adaptive space, with less flexibility to cope with stress. Over time, the system complexity, feedback, and connectivity increase, and thus, the adaptation spaces of pathways overlap to ensure that decision cycles for one pathway influence the adaptive space in other pathways. The line connecting the decision points is considered to be of great adaptive magnitude if it moves toward the top of the colored adaptive pathway area and to have less adaptive capacity if it is toward the bottom of the colored adaptive pathway area.
The plausible chosen pathway is flexible and dynamic, and it changes progressively following the occurrence of new events and situations, hazards, and monitoring data. The decisions of the pathway are:
Decision Point 1: The population was settled in the nearby city of Almere, and the bridge was constructed in 1969. At this moment, the bridge was in the initial state (good and fully operational level); thus, mitigation measurements were unnecessary.
Decision Point 2: A few years later (1980), the city’s population increased, resulting in increased traffic flow. However, this increase did not affect the bridge immediately, and there was no need for any action.
Decision Point 3: Almost thirteen years later (1993), the increase in Almere’s city population and traffic affected the bridge’s functionality. Mitigation measures were taken to set the traffic flow into normal conditions, including consideration of traffic at the south part of three lanes instead of two.
Decision Point 4: Around 1999, due to the continuous increase in traffic load, there was demand for further mitigation measures, even though the bridge was still in good condition. Under these circumstances, the bridge’s deck was widened by increasing the number of traffic lanes from two to three in the north part.
Decision Point 5: A few years later, around 2007 to 2008, based on the outcomes of the Dutch Organization for Applied Scientific Research report, the bridge was considered overloaded and unsafe for loads of more than 12 tons. This resulted in immediate actions, including traffic restrictions for heavy vehicles to pass and the bridge’s repair. Also, the SHM system was installed on the bridge during the repair period.
Decision Point 6: Three years later (2011), despite the bridge being repaired and monitored, the tremendous traffic increase led to its functionality in problematic conditions again. The bridge was considered unserviceable, and the rush-hour lane was opened north, increasing the number of lanes from three to four.
Decision Point 7: Traffic increase caused further unfavorable conditions to the bridge and provoked overloading again around 2013. The mitigation measures consisted of two components: (a) the construction of a new bridge next to the existing one (2014); and (b) the reconstruction of the old one.
Decision Point 8: Future decisions (2025) are expected due to predictions not only in traffic but also due to the risks of climate change [103]. Under the threat of those hazards, actions including improving the drainage system by mainly extending the preliminary CV-based SHM system with further development and updating the AI and MLM methods are inevitable.
Decision Point 9: Within this decade (2030), technical solutions are needed to maintain and upgrade the condition of the bridge (e.g., replacement of expansion joints, deck repairs) but also to protect the asset due to changes in water level by flood defense infrastructure. The continuous monitoring may also need extension using technological advancements (e.g., digital twins (DT)) to exploit the records for making future predictions with a lower uncertainty level of climate-change events.
The selection of the AP is based on a data-driven evaluation process. The process utilizes the RI and SI methodologies presented in Section 2.3. The indices are estimated for each of the selected mitigation actions, and the proposed equations in Section 2.3.1 and Section 2.3.2 calculate the aging periods of the asset. The calculation of the RI follows an iterative process, in which the preliminary estimated participation factors (βc) of the resilience components are optimized through a sensitivity analysis.
The performed sensitivity analysis defines the thresholds and the correlation of the RIs derived from the preliminary selected βc values, which were based on experts’ judgments. Once the thresholds were defined, the distribution type and function of the βc were also suggested to reduce uncertainties for predicting the RIs in hypothetical scenarios. The distribution function of the factors has proven to be the t-distribution with n-1 degrees of freedom [109]. The resilience curve is redesigned based on the participation factors’ predictions with a 95% confidence interval, as illustrated in Figure 10a.
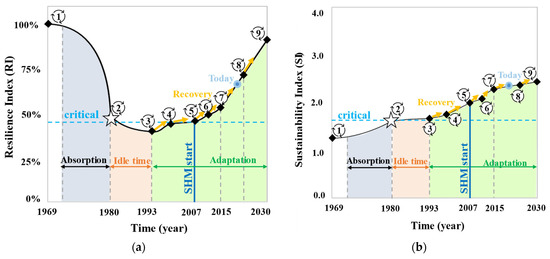
Figure 10.
Representation of the (a) resilience and (b) sustainability curves of the selected AP. The different resilience phases (i.e., the absorption, the idle time and the absorption) are represented with different colors grey, light orange and green.
The SI accounts for the five KPIs’ weight factors (Wf). Analogously to the participation factors, the preliminary estimation of the KPIs is based on experts’ judgments, and a sensitivity analysis follows for the optimization of the selected Wf. For the case-study bridge, the initial design is of fundamental importance to the life cycle and contributes 35% to the sustainability. The absorption period is estimated to participate 20% for chronic and cumulative effects. In cases where mitigation measures are to be taken, Wf of idle time and recovery periods are equally crucial for a redesign scenario, with each contributing 35%. Finally, the adaption period accounts for a lower level of 10% [53,109].
The resulting resilience and sustainability curves throughout the bridge’s aging periods are illustrated in Figure 8b and Figure 10a, respectively. Figure 10a presents the resilience index (RI) derived from Equation (1) in the vertical axis. Figure 10b represents the sustainability index (SI) derived from Equation (3). Further, the resilience and sustainability metrics for a time duration Δt were calculated. Both metrics are obtained by computing the area below the curves formed by the indices RI(t) or SI(t) for the considered duration Δt. Finally, Table 7 summarizes the computed indices and metrics of resilience and sustainability.
Table 7.
Resilience and sustainability indices and metrics of the selected AP.
6. Lessons Learned
This article presents lessons learned from the case study of the Hollandse bridge. Experience and evaluation of the adopted actions and policies of the bridge are crucial tools for enhancing adaptive capacity and resilience for the case-study bridge and similar structures. The evaluation process is based on the estimated resilience and sustainability curves along with their corresponding indices and metrics, indicating part of the adaptation capacity of the bridge from the contacted APs. Thus, the knowledge transfer process is expected to: (a) enhance knowledge (e.g., improve the methodology of monitoring, assessment, and management policies of the asset); (b) assist in identifying early triggers of deterioration (e.g., identify and reduce future risk); and (c) define proper measures for the maintenance of the asset (e.g., allocate resources).
The population increase in the city of Almere that induced the increase in the traffic flow was considered not to affect the bridge immediately. The traffic flow was still acceptable. Thus, there was no need to maintain the bridge. However, a few years later, the bridge’s functionality and structural integrity were affected by crucial socio-economic impacts in the country. The underestimation of the situation due to the lack of data from visual inspections can be avoided in the future with the installation of the SHM system on the bridge along with monitoring using CV-based systems.
Monitoring with a CV-based system helps increase safety levels during reconstruction periods and assists in further asset adaptation. According to the information and data of the case-study bridge, the reconstruction periods may be critical in terms of safety, as a high rate of uncertainty characterizes the material’s strength and the bridge’s structural integrity level. Moreover, evaluating the structural integrity through non-destructive tests (NDTs) can be time-consuming and lead to disruptions or catastrophes. When the SHM system was installed in 2007, the resilience indices showed a noticeable increase for the Hollandse bridge, denoting the space for further adaptation.
Based on previous experience derived from similar past actions or projects (e.g., deck widening, monitoring-system installation, monitoring-system maintenance), the duration of upcoming mitigation measures can be estimated or predicted along with their cost (e.g., installation of a monitoring system on the second bridge or deck widening, construction of a flyover bridge). Delays or earlier delivery are translated into cost underrun or overrun. Thus, probabilistic approaches can assist in minimizing the uncertainties of the duration of mitigation actions and cost (e.g., reconstruction of the bridge, need for expert staff or extra equipment) as well as for the estimation of an upcoming risk event (e.g., late delivery of strengthening equipment or lab soil quality/material strength results, etc.) to avoid long suspension of the project activities or the overall project.
Based on the continuous increase in traffic demands in the past (1980–2019), AI and ML model development along with monitoring systems are expected to estimate and predict both structural performance and functionality, avoiding future disruption of the bridge either due to the increasing traffic demands or the occurrence of extreme events.
Future risks of extreme events exacerbated by climate change, such as extreme temperatures (12% increase in temperature values in 2029), generate the need to improve or update the monitoring system. An increase in temperature variation may result in wrong measurements of deflections and, thus, in high uncertainties [110]. Therefore, monitoring with a CV-based system can minimize them. The evolution of the CV-based monitoring system from a premature basis of only one camera to a more sophisticated modern and smart system overlaps with mitigation measures for the bridge and the significant hazards due to climate change. Therefore, the SHM system is crucial for every chosen adaptive pathway.
Based on estimating the recovery period and cost of previous mitigation measures, the adopted management policies can be changed or updated, accounting for the resources needed, other limitations (i.e., legal framework, societal crisis), and the upcoming risk of an extreme event. The resilience indices increased with asset reconstruction in 2015.
Lastly, the measures taken, especially the SHM monitoring, assist in further adaptation of the asset under the new demands (societal, environmental, and economic). The proposed sustainability index represents this trend and illustrates that the sustainability metric has continuously increased smoothly upon the decision of mitigation measures (1980).
7. Conclusions
This article contributes to the state of the art by proposing a framework of flexible and smart APs for CTI benefiting from the resilience of innovative systems. Those innovative systems are CV-based coupled with emerging technologies, AI, and ML to reduce uncertainties, interpret data for response, and make future projections about risks and performance of structures. Based on the resilience aspect of the CV-based SHM systems, both in terms of software and hardware, APs are facilitated. Decision making over the lifetime of critical assets is based on the performance level, monitoring data, and resilience analysis, contributing to the asset’s flexible, dynamic, and adaptive management. Also, the simultaneous radical change in the environment and climate has increased the risk for existing assets. The fourth industrial revolution has brought into light methods to enhance the reliability of the SHM systems and measurements, permitting continuous recording and storing of large quantities of data that can be further used for future design and model updating.
The resilience of systems (e.g., infrastructure, monitoring, network) includes not only the absorption and recovery period in case of an event’s occurrence but also their ability to adapt and be sustainable in the long term. To develop alternative routes throughout the lifetime of an asset, as well as to furnish mitigation solutions against the threat of human or natural hazards, this study proposes metrics for the quantification of resilience and sustainability. These metrics can trigger actions that bring the asset to the climate-change era.
The proposed framework of APs is thoroughly discussed and developed for the case study of the Hollandse bridge, considering traffic and population growth, performance, mitigation measures, and climate-change risk. The role of CV-based systems in supporting the actions of APs is examined in the case study of the Hollandse bridge. Despite the complexity and overlapping of variables, updating the SHM systems with supreme technologies in every period narrows down the system’s adaptation space. It qualifies for many possible courses of action. By reflecting on the example of the Hollandse bridge, future planning of short- and long-term demands of assets should be based on the lessons learned and presented for this study and assisted by SHM methods that will infuse decisions forming the adaptive pathway for the future.
Author Contributions
Conceptualization, N.M.; methodology, N.M., D.V.A. and R.K; software, N.K.S.; validation, N.M., D.V.A. and R.K.; formal analysis, N.M., D.V.A., R.K. and N.K.S.; investigation, N.M., D.V.A., R.K. and N.K.S.; resources, N.M., D.V.A., R.K. and N.K.S.; data curation, N.M., D.V.A., R.K. and N.K.S.; writing—original draft preparation, N.M., D.V.A., R.K. and N.K.S.; writing—review and editing, N.M., D.V.A., R.K. and N.K.S.; visualization, N.K.S.; supervision, N.M. and D.V.A.; project administration, N.M.; funding acquisition, N.M. and R.K. All authors have read and agreed to the published version of the manuscript.
Funding
This research received no external funding.
Institutional Review Board Statement
Not applicable.
Informed Consent Statement
Not applicable.
Data Availability Statement
The data that support the findings of this study are available upon reasonable request.
Acknowledgments
We thank École Spéciale des Travaux Publics, ESTP, France for supporting this research. We thank the Designing Systems for Informed Resilience Engineering (DeSIRE) Programme supported by the Centre for Resilience Engineering of the four Universities of Technology of the Netherlands (4TU) and the University of Twente for supporting this research. We thank the James Watt School of Engineering, University of Glasgow, UK, and the Laboratory of Reinforced Concrete and Seismic Design of Structures, Civil Engineering Department, Democritus University of Thrace, Greece, for supporting this research.
Conflicts of Interest
The authors declare no conflict of interest.
References
- Gaitanidou, E.; Bellini, E.; Ferreira, P. European Resilience Management Guidelines, RESOLUTE. 2018. Available online: http://www.resolute-eu.org/files/RESOLUTE_D3-6-ERMG-final.pdf (accessed on 9 October 2022).
- Black, A.P. 2022 Bridge Report. 2022. Available online: https://artbabridgereport.org/ (accessed on 3 November 2022).
- Calvi, G.M.; Moratti, M.; O’Reilly, G.J.; Scattarreggia, N.; Monteiro, R.; Malomo, D.; Calvi, P.M.; Pinho, R. Once upon a Time in Italy: The Tale of the Morandi Bridge. Struct. Eng. Int. 2019, 29, 198–217. [Google Scholar] [CrossRef]
- Thomas, M.; Peter, L. India Bridge Collapse. Available online: https://www.bbc.co.uk/news/world-asia-india-63445154 (accessed on 25 December 2022).
- Brownjohn, J.M. Structural health monitoring of civil infrastructure. Philos. Trans. R. Soc. A Math. Phys. Eng. Sci. 2007, 365, 589–622. [Google Scholar] [CrossRef] [PubMed]
- Moore, M.; Phares, B.; Graybeal, B.; Rolander, D.; Washer, G.; Wiss, J. Reliability of Visual Inspection for Highway Bridges; Turner-Fairbank Highway Research Center: McLean, VA, USA, 2001. [Google Scholar]
- Zhao, H.-W.; Ding, Y.-L.; Li, A.-Q.; Chen, B.; Wang, K.-P. Digital modeling approach of distributional mapping from structural temperature field to temperature-induced strain field for bridges. J. Civ. Struct. Health Monit. 2023, 13, 251–267. [Google Scholar] [CrossRef]
- Zhao, H.; Ding, Y.; Li, A.; Chen, B.; Zhang, X. State-monitoring for abnormal vibration of bridge cables focusing on non-stationary responses: From knowledge in phenomena to digital indicators. Measurement 2022, 205, 112148. [Google Scholar] [CrossRef]
- Zhao, H.; Ding, Y.; Meng, L.; Qin, Z.; Yang, F.; Li, A. Bayesian Multiple Linear Regression and New Modeling Paradigm for Structural Deflection Robust to Data Time Lag and Abnormal Signal. IEEE Sens. J. 2023, 23, 19635–19647. [Google Scholar] [CrossRef]
- Makhoul, N.; Argyroudis, S. Tools for Resilience Assessment: Developments, Limitations and Future Needs. In Proceedings of the ICONHIC2019—2nd International Conference on Natural Hazards & Infrastructure, Chania, Greece, 23–26 June 2019. [Google Scholar]
- Werners, S.E.; Wise, R.M.; Butler, J.R.A.; Totin, E.; Vincent, K. Adaptation pathways: A review of approaches and a learning framework. Environ. Sci. Policy 2021, 116, 266–275. [Google Scholar] [CrossRef]
- Leach, M.; Scoones, I.; Stirling, A. Pathways to Sustainability: An Overview of the STEPS Centre Approach. 2007. Available online: https://opendocs.ids.ac.uk/opendocs/handle/20.500.12413/2441 (accessed on 5 December 2022).
- Maru, Y.T.; Sparrow, A.; Butler, J.R.; Banerjee, O.; Ison, R.; Hall, A.; Carberry, P. Towards appropriate mainstreaming of ‘Theory of Change’ approaches into agricultural research for development: Challenges and opportunities. Agric. Syst. 2018, 165, 344–353. [Google Scholar] [CrossRef]
- Omore, A.; Kidoido, M.; Twine, E.; Kurwijila, L.; O’Flynn, M.; Githinji, J. Using ‘theory of change’ to improve agricultural research: Recent experience from Tanzania. Dev. Pract. 2019, 29, 898–911. [Google Scholar] [CrossRef]
- Haasnoot, M.; Kwakkel, J.H.; Walker, W.E.; Maat, J.T. Dynamic adaptive policy pathways: A method for crafting robust decisions for a deeply uncertain world. Glob. Environ. Chang. 2013, 23, 485–498. [Google Scholar] [CrossRef]
- Wise, R.M.; Fazey, I.; Smith, M.S.; Park, S.E.; Eakin, H.C.; Van Garderen, E.A.; Campbell, B. Reconceptualising adaptation to climate change as part of pathways of change and response. Glob. Environ. Chang. 2014, 28, 325–336. [Google Scholar] [CrossRef]
- Bosomworth, K.; Leith, P.; Harwood, A.; Wallis, P.J. What’s the problem in adaptation pathways planning? The potential of a diagnostic problem-structuring approach. Environ. Sci. Policy 2017, 76, 23–28. [Google Scholar] [CrossRef]
- Munene, M.B.; Swartling, Å.G.; Thomalla, F. Adaptive governance as a catalyst for transforming the relationship between development and disaster risk through the Sendai Framework? Int. J. Disaster Risk Reduct. 2018, 28, 653–663. [Google Scholar] [CrossRef]
- Roy, J.; Tscharket, P.; Waisman, H.; Abdul Halim, S.; Antwi-Agyei, P.; Dasgupta, P.; Hayward, B.; Kanninen, M.; Liverman, D.; Okereke, C.; et al. Sustainable development, poverty eradication and reducing inequalities. In Global Warming of 1.5 °C: An IPCC Sp.; Masson-Delmotte, V., Zhai, P., Pörtner, H.O., Roberts, D., Skea, J., Shukla, P.R., Pirani, A., Moufouma-Okia, W., Péan, C., Pidcock, R., et al., Eds.; Cambridge University Press: Cambridge, UK, 2018. [Google Scholar]
- Werners, S.E.; Pfenninger, S.; van Slobbe, E.; Haasnoot, M.; Kwakkel, J.H.; Swart, R.J. Thresholds, tipping and turning points for sustainability under climate change. Curr. Opin. Environ. Sustain. 2013, 5, 334–340. [Google Scholar] [CrossRef]
- Kwakkel, J.H.; Haasnoot, M.; Walker, W.E. Comparing Robust Decision-Making and Dynamic Adaptive Policy Pathways for model-based decision support under deep uncertainty. Environ. Model. Softw. 2016, 86, 168–183. [Google Scholar] [CrossRef]
- Butler, J.R.A.; Bohensky, E.L.; Suadnya, W.; Yanuartati, Y.; Handayani, T.; Habibi, P.; Puspadi, K.; Skewes, T.D.; Wise, R.M.; Suharto, I.; et al. Scenario planning to leap-frog the Sustainable Development Goals: An adaptation pathways approach. Clim. Risk Manag. 2016, 12, 83–99. [Google Scholar] [CrossRef]
- Reeder, T.; Ranger, N. How Do You Adapt in an Uncertain World?: Lessons from the Thames Estuary 2100 Project; Washington DC, USA, 2011. Available online: http://eprints.lse.ac.uk/id/eprint/39979 (accessed on 30 October 2022).
- Colloff, M.J.; Doherty, M.D.; Lavorel, S.; Dunlop, M.; Wise, R.M.; Prober, S.M. Adaptation services and pathways for the management of temperate montane forests under transformational climate change. Clim. Chang. 2016, 138, 267–282. [Google Scholar] [CrossRef]
- Downing, T.E. Views of the frontiers in climate change adaptation economics. Wiley Interdiscip. Rev. Clim. Chang. 2012, 3, 161–170. [Google Scholar] [CrossRef]
- Hermans, L.M.; Haasnoot, M.; Maat, J.T.; Kwakkel, J.H. Designing monitoring arrangements for collaborative learning about adaptation pathways. Environ. Sci. Policy 2017, 69, 29–38. [Google Scholar] [CrossRef]
- USAID. Adapting to Coastal Climate Change: A Guidebook for Development Planners. 2009. Available online: https://pdf.usaid.gov/pdf_docs/pnado614.pdf (accessed on 13 November 2022).
- Jeuken, A.; Haasnoot, M.; Reeder, T.; Ward, P. Lessons learnt from adaptation planning in four deltas and coastal cities. J. Water Clim. Chang. 2015, 6, 711–728. [Google Scholar] [CrossRef]
- Nikkels, M.J.; Kumar, S.; Meinke, H. Adaptive Irrigation Infrastructure—Linking Insights from Human-Water Interactions and Adaptive Pathways. Curr. Opin. Environ. Sustain. 2019, 40, 37–42. [Google Scholar] [CrossRef]
- Makhoul, N. Review of data quality indicators and metrics, and suggestions for indicators and metrics for structural health monitoring. Adv. Bridg. Eng. 2022, 3, 17. [Google Scholar] [CrossRef]
- Makhoul, N. Bayesian Decision-Making Process Including Structural Health Monitoring Data Quality for Bridge Management. KSCE J. Civ. Eng. 2023. submitted. [Google Scholar]
- WCED. Our Common Future: Report of the World Commission on Environment and Development. Oxford. 1987. Available online: https://sustainabledevelopment.un.org/content/documents/5987our-common-future.pdf (accessed on 10 December 2022).
- Purvis, B.; Mao, Y.; Robinson, D. Three pillars of sustainability: In search of conceptual origins. Sustain. Sci. 2019, 14, 681–695. [Google Scholar] [CrossRef]
- Bruneau, M.; Chang, S.E.; Eguchi, R.T.; Lee, G.C.; O’Rourke, T.D.; Reinhorn, A.M.; Shinozuka, M.; Tierney, K.; Wallace, W.A.; Von Winterfeldt, D. A Framework to Quantitatively Assess and Enhance the Seismic Resilience of Communities. Earthq. Spectra 2003, 19, 733–752. [Google Scholar] [CrossRef]
- Nan, C.; Sansavini, G. A quantitative method for assessing resilience of interdependent infrastructures. Reliab. Eng. Syst. Saf. 2017, 157, 35–53. [Google Scholar] [CrossRef]
- Patriarca, R.; Bergström, J.; Di Gravio, G.; Costantino, F. Resilience engineering: Current status of the research and future challenges. Saf. Sci. 2018, 102, 79–100. [Google Scholar] [CrossRef]
- Ayyub, B.M. Systems Resilience for Multihazard Environments: Definition, Metrics, and Valuation for Decision Making. Risk Anal. 2014, 34, 340–355. [Google Scholar] [CrossRef]
- Ayyub, B.M. Practical Resilience Metrics for Planning, Design, and Decision Making. ASCE-ASME J. Risk Uncertain. Eng. Syst. Part A Civ. Eng. 2015, 1, 04015008. [Google Scholar] [CrossRef]
- Cimellaro, G.; Reinhorn, A.; Bruneau, M. Quantification of seismic resilience. In Proceedings of the 8th U.S. National Conference on Earthquake Engineering, San Francisco, CA, USA, 18–22 April 2006. [Google Scholar]
- Reed, D.A.; Kapur, K.C.; Christie, R.D. Methodology for Assessing the Resilience of Networked Infrastructure. IEEE Syst. J. 2009, 3, 174–180. [Google Scholar] [CrossRef]
- Cimellaro, G.P.; Reinhorn, A.M.; Bruneau, M. Framework for analytical quantification of disaster resilience. Eng. Struct. 2010, 32, 3639–3649. [Google Scholar] [CrossRef]
- Ouyang, M.; Dueñas-Osorio, L. Multi-dimensional hurricane resilience assessment of electric power systems. Struct. Saf. 2014, 48, 15–24. [Google Scholar] [CrossRef]
- Mosalam, K.M.; Alibrandi, U.; Lee, H.; Armengou, J. Performance-based engineering and multi-criteria decision analysis for sustainable and resilient building design. Struct. Saf. 2018, 74, 1–13. [Google Scholar] [CrossRef]
- Patel, D.A.; Lad, V.H.; Chauhan, K.A.; Patel, K.A. Development of Bridge Resilience Index Using Multicriteria Decision-Making Techniques. J. Bridg. Eng. 2020, 25, 04020090. [Google Scholar] [CrossRef]
- Ellingwood, B.R.; Cutler, H.; Gardoni, P.; Peacock, W.G.; van de Lindt, J.W.; Wang, N. The Centerville Virtual Community: A fully integrated decision model of interacting physical and social infrastructure systems. Sustain. Resilient Infrastruct. 2016, 1, 95–107. [Google Scholar] [CrossRef]
- Koliou, M.; van de Lindt, J.W.; McAllister, T.P.; Ellingwood, B.R.; Dillard, M.; Cutler, H. State of the research in community resilience: Progress and challenges. Sustain. Resilient Infrastruct. 2020, 5, 131–151. [Google Scholar] [CrossRef]
- Guidotti, R.; Chmielewski, H.; Unnikrishnan, V.; Gardoni, P.; McAllister, T.; van de Lindt, J. Modeling the resilience of critical infrastructure: The role of network dependencies. Sustain. Resilient Infrastruct. 2016, 1, 153–168. [Google Scholar] [CrossRef] [PubMed]
- Andrić, J.M.; Lu, D.-G. Fuzzy methods for prediction of seismic resilience of bridges. Int. J. Disaster Risk Reduct. 2017, 22, 458–468. [Google Scholar] [CrossRef]
- Lad, V.H.; Patel, D.A.; Chauhan, K.A.; Patel, K.A. Development of Fuzzy System Dynamics Model to Forecast Bridge Resilience. J. Bridg. Eng. 2022, 27, 04022114. [Google Scholar] [CrossRef]
- Frangopol, D.M.; Dong, Y.; Sabatino, S. Bridge life-cycle performance and cost: Analysis, prediction, optimisation and decision-making. Struct. Infrastruct. Eng. 2017, 13, 1239–1257. [Google Scholar] [CrossRef]
- Sabatino, S.; Frangopol, D.M.; Dong, Y. Sustainability-informed maintenance optimization of highway bridges considering multi-attribute utility and risk attitude. Eng. Struct. 2015, 102, 310–321. [Google Scholar] [CrossRef]
- Lounis, Z.; McAllister, T.P. Risk-Based Decision Making for Sustainable and Resilient Infrastructure Systems. J. Struct. Eng. 2016, 142, F4016005. [Google Scholar] [CrossRef]
- Achillopoulou, D.; Stamataki, N.; Psathas, A.; Iliadis, L.; Karabinis, A. Resilience Quantification based on Monitoring & Prediction data Using Artificial Intelligence (AI). In Proceedings of the IABSE Congress Nanjing 2022—Bridges & Structures: Connection, Integration and Harmonisation, Nanjing, China, 21–23 September 2022. [Google Scholar]
- Blagojević, N.; Didier, M.; Stojadinović, B. Simulating the role of transportation infrastructure for community disaster recovery. Proc. Inst. Civ. Eng.-Bridg. Eng. 2022, 175, 150–159. [Google Scholar] [CrossRef]
- Bocchini, P.; Frangopol, D.M. Optimal Resilience- and Cost-Based Postdisaster Intervention Prioritization for Bridges along a Highway Segment. J. Bridg. Eng. 2012, 17, 117–129. [Google Scholar] [CrossRef]
- Yang, D.Y.; Frangopol, D.M. Life-cycle management of deteriorating civil infrastructure considering resilience to lifetime hazards: A general approach based on renewal-reward processes. Reliab. Eng. Syst. Saf. 2019, 183, 197–212. [Google Scholar] [CrossRef]
- Ikpong, A.; Bagchi, A. New Method for Climate Change Resilience Rating of Highway Bridges. J. Cold Reg. Eng. 2015, 29, 04014013. [Google Scholar] [CrossRef]
- Barone, G.; Frangopol, D.M. Reliability, risk and lifetime distributions as performance indicators for life-cycle maintenance of deteriorating structures. Reliab. Eng. Syst. Saf. 2014, 123, 21–37. [Google Scholar] [CrossRef]
- Alam, J.; Dias-da-Costa, D.; Hadigheh, A. Time-variant Reliability Assessment of RC Bridge Structures Based on a Bayesian Updated Chloride-induced Corrosion Model. In Proceedings of the 29th Biennial National Conference of the Concrete Institute of Australia, Sydney, Australia, 8–11 September 2019; Concrete Institute of Australia: Sydney, Australia, 2020; Volume 2019, pp. 8–11. [Google Scholar]
- Yarveisy, R.; Gao, C.; Khan, F. A simple yet robust resilience assessment metrics. Reliab. Eng. Syst. Saf. 2020, 197, 106810. [Google Scholar] [CrossRef]
- Spencer, B.F.; Hoskere, V.; Narazaki, Y. Advances in Computer Vision-Based Civil Infrastructure Inspection and Monitoring. Engineering 2019, 5, 199–222. [Google Scholar] [CrossRef]
- Doebling, S.W.; Farrar, C.R.; Prime, M.B.; Shevitz, D.W. Damage Identification and Health Monitoring of Structural and Mechanical Systems from Changes in Their Vibration Characteristics: A Literature Review; Los Alamos National Lab: Washington, DA, USA, 1996. [Google Scholar] [CrossRef]
- Glisic, B. Concise Historic Overview of Strain Sensors Used in the Monitoring of Civil Structures: The First One Hundred Years. Sensors 2022, 22, 2397. [Google Scholar] [CrossRef] [PubMed]
- Selvakumaran, S.; Rossi, C.; Marinoni, A.; Webb, G.; Bennetts, J.; Barton, E.; Plank, S.; Middleton, C. Combined InSAR and Terrestrial Structural Monitoring of Bridges. IEEE Trans. Geosci. Remote Sens. 2020, 58, 7141–7153. [Google Scholar] [CrossRef]
- Kromanis, R.; Kripakaran, P. A multiple camera position approach for accurate displacement measurement using computer vision. J. Civ. Struct. Health Monit. 2021, 11, 661–678. [Google Scholar] [CrossRef]
- Dong, C.-Z.; Catbas, F.N. A review of computer vision–based structural health monitoring at local and global levels. Struct. Health Monit. 2021, 20, 692–743. [Google Scholar] [CrossRef]
- Kromanis, R.; Xu, Y.; Lydon, D.; del Rincon, J.M.; Al-Habaibeh, A. Measuring Structural Deformations in the Laboratory Environment Using Smartphones. Front. Built Environ. 2019, 5, 44. [Google Scholar] [CrossRef]
- Lydon, D.; Lydon, M.; Taylor, S.; Del Rincon, J.M.; Hester, D.; Brownjohn, J. Development and field testing of a vision-based displacement system using a low cost wireless action camera. Mech. Syst. Signal Process. 2019, 121, 343–358. [Google Scholar] [CrossRef]
- Xu, Y.; Brownjohn, J.; Kong, D. A non-contact vision-based system for multipoint displacement monitoring in a cable-stayed footbridge. Struct. Control Health Monit. 2018, 25, e2155. [Google Scholar] [CrossRef]
- Zaurin, R.; Catbas, F.N. Integration of computer imaging and sensor data for structural health monitoring of bridges. Smart Mater. Struct. 2010, 19, 015019. [Google Scholar] [CrossRef]
- Voordijk, H.; Kromanis, R. Technological mediation and civil structure condition assessment: The case of vision-based systems. Civ. Eng. Environ. Syst. 2022, 39, 48–65. [Google Scholar] [CrossRef]
- Salehi, H.; Burgueño, R. Emerging artificial intelligence methods in structural engineering. Eng. Struct. 2018, 171, 170–189. [Google Scholar] [CrossRef]
- Tyrtaiou, M.; Papaleonidas, A.; Elenas, A.; Iliadis, L. Accomplished Reliability Level for Seismic Structural Damage Prediction Using Artificial Neural Networks. In Proceedings of the International Conference on Engineering Applications of Neural Networks (EANN 2020), Halkidiki, Greece, 5–7 June 2020; Volume 2020, pp. 85–98. [Google Scholar] [CrossRef]
- Nian, H. Civil engineering stability inspection based on computer vision and sensors. Microprocess. Microsyst. 2021, 82, 103838. [Google Scholar] [CrossRef]
- Thai, H.-T. Machine learning for structural engineering: A state-of-the-art review. Structures 2022, 38, 448–491. [Google Scholar] [CrossRef]
- Sun, L.; Shang, Z.; Xia, Y.; Bhowmick, S.; Nagarajaiah, S. Review of Bridge Structural Health Monitoring Aided by Big Data and Artificial Intelligence: From Condition Assessment to Damage Detection. J. Struct. Eng. 2020, 146, 04020073. [Google Scholar] [CrossRef]
- Derras, B.; Makhoul, N. An overview of the Infrastructure seismic resilience assessment using Artificial Intelligence and machine-learning algorithms. In Proceedings of the ICONHIC 2022—3rd International Conference on Natural Hazards & infrastructures, Athens, Greece, 5–7 July 2022. [Google Scholar]
- Derras, B.; Makhoul, N. Artificial Intelligence for the amelioration of seismic resilience of bridges. In Proceedings of the IABSE Symposium Istanbul 2023, Long Span Bridges, Istanbul, Turkey, 26–28 April 2023. [Google Scholar]
- Achillopoulou, D.V.; Mitoulis, S.A.; Argyroudis, S.A.; Wang, Y. Monitoring of transport infrastructure exposed to multiple hazards: A roadmap for building resilience. Sci. Total Environ. 2020, 746, 141001. [Google Scholar] [CrossRef] [PubMed]
- Argyroudis, S.A.; Mitoulis, S.A.; Chatzi, E.; Baker, J.W.; Brilakis, I.; Gkoumas, K.; Vousdoukas, M.; Hynes, W.; Carluccio, S.; Keou, O.; et al. Digital technologies can enhance climate resilience of critical infrastructure. Clim. Risk Manag. 2022, 35, 100387. [Google Scholar] [CrossRef]
- Borah, S.; Al-Habaibeh, A.; Kromanis, R.; Kaveh, B. The resilience of vision-based technology for bridge monitoring: Measuring and analysing resilience of interdependent STE systems resilient sensing systems for infrastructure monitoring. In Interconnected: Resilience Innovations for Sustainable Development Goals, Proceedings of the Joint International Resilience Conference 2020, Virtual, 23–27 November 2020; Borah, S., Ed.; 4TU Centre for Resilience Engineering/Future Resilience Systems—SEC: Enschede, The Netherlands, 2020. [Google Scholar]
- Sousa, H.; Santos, L.O.; Makhoul, N. Next generation of Monitoring Systems towards Infrastructure Resilience. In Proceedings of the ICONHIC 2022—3rd International Conference on Natural Hazards & Infrastructure, Athens, Greece, 5–7 July 2022. [Google Scholar]
- Makhoul, N.; Achillopoulou, D.V.; Stamataki, N.K.; Kromanis, R. Image Processing for Structural Health Monitoring. In Data Driven Methods for Civil Structural Health Monitoring and Resilience; Noori, C.R.M., Noori, M., Rainieri, C., Domaneschi, M., Sarhosis, V., Eds.; CRC Press: Boca Raton, FL, USA, 2022; Volume 2023, pp. 279–296. [Google Scholar] [CrossRef]
- Makhoul, N.; Kromanis, R. Toward Enhancing Community Resilience: Life Cycle Resilience of Structural Health Monitoring Systems. In Life-Cycle of Structures and Infrastructure Systems, Proceedings of the Eighth International Symposium on Life-Cycle Civil Engineering (IALCCE 2023), Milan, Italy, 2–6 July 2023; Biondini, F., Frangopol, D.M., Eds.; CRC Press: Milan, Italy, 2023. [Google Scholar]
- Zonzini, F.; Carbone, A.; Romano, F.; Zauli, M.; De Marchi, L. Machine Learning Meets Compressed Sensing in Vibration-Based Monitoring. Sensors 2022, 22, 2229. [Google Scholar] [CrossRef]
- Gailhofer, P.; Herold, A.; Schemmel, J.P.; Scherf, C.S.; de Stebelski, C.U.; Köhler, A.R.; Braungardt, S. The Role of Artificial Intelligence in the European Green Deal; European Parliament: Luxembourg, Belgium, 2021. [Google Scholar]
- Luccioni, A.; Lacoste, A.; Schmidt, V. Estimating Carbon Emissions of Artificial Intelligence [Opinion]. IEEE Technol. Soc. Mag. 2020, 39, 48–51. [Google Scholar] [CrossRef]
- Matheson, R. Reducing the Carbon Footprint of Artificial Intelligence. MIT News. 2020. Available online: https://news.mit.edu/2020/artificial-intelligence-ai-carbon-footprint-0423 (accessed on 15 January 2023).
- Kern, E.; Hilty, L.M.; Guldner, A.; Maksimov, Y.V.; Filler, A.; Gröger, J.; Naumann, S. Sustainable software products—Towards assessment criteria for resource and energy efficiency. Futur. Gener. Comput. Syst. 2018, 86, 199–210. [Google Scholar] [CrossRef]
- Bolender, T.; Burvenich, G.; Dalibor, M.; Rumpe, B.; Wortmann, A. Self-Adaptive Manufacturing with Digital Twins. In Proceedings of the 2021 International Symposium on Software Engineering for Adaptive and Self-Managing Systems (SEAMS), Madrid, Spain, 18–24 May 2021; pp. 156–166. [Google Scholar] [CrossRef]
- Abuseta, Y.; Swesi, K. Design Patterns for Self Adaptive Systems Engineering. Int. J. Softw. Eng. Appl. 2015, 6, 11–28. [Google Scholar] [CrossRef]
- Calinescu, R.; Gerasimou, S.; Banks, A. Self-adaptive Software with Decentralised Control Loops. In Fundamental Approaches to Software Engineering: 18th International Conference, FASE 2015, Held as Part of the European Joint Conferences on Theory and Practice of Software, ETAPS 2015, London, UK, 11–18 April 2015; Springer: Berlin/Heidelberg, Germany; pp. 235–251. [CrossRef]
- Viroli, M.; Audrito, G.; Beal, J.; Damiani, F.; Pianini, D. Engineering Resilient Collective Adaptive Systems by Self-Stabilisation. ACM Trans. Model. Comput. Simul. 2018, 28, 1–28. [Google Scholar] [CrossRef]
- Kacimi, M.A.; Guenounou, O.; Brikh, L.; Yahiaoui, F.; Hadid, N. New mixed-coding PSO algorithm for a self-adaptive and automatic learning of Mamdani fuzzy rules. Eng. Appl. Artif. Intell. 2020, 89, 103417. [Google Scholar] [CrossRef]
- Malekloo, A.; Ozer, E.; AlHamaydeh, M.; Girolami, M. Machine learning and structural health monitoring overview with emerging technology and high-dimensional data source highlights. Struct. Health Monit. 2022, 21, 1906–1955. [Google Scholar] [CrossRef]
- Wegenwiki.nl. Hollandse Brug-Wegenwiki. Available online: https://cutt.ly/uFnOV4r (accessed on 29 September 2022).
- Verman, R. Deflections & Natural Frequencies as Parameters for Structural Health Monitoring: The Effect of Fatigue and Corrosion on the Deflections and the Natural Frequencies of Reinforced Concrete. 2017. Available online: https://doi.org/10.4233/uuid:45f42dab-8427-4113-ba56-50c9e7171a36 (accessed on 30 January 2023).
- InfraWatch. “Infrawatch.liacs.nl”. Available online: https://infrawatch.liacs.nl/ (accessed on 29 September 2022).
- Knobbe, A.; Koopman, A.; Kok, J.; Oblanden, B.; Bosma, C.; Koenders, E. Large Data Stream Processing for Bridge Management Systems. In Proceedings of the First Middle East Conderence on Smart Monitoring Assessment & Rehabilitation of Civil Structures, Dubai, UAE, 8–10 February 2011. [Google Scholar]
- Psathas, A.P.; Iliadis, L.; Achillopoulou, D.V.; Papaleonidas, A.; Stamataki, N.K.; Bountas, D.; Dokas, I.M. Autoregressive Deep Learning Models for Bridge Strain Prediction. In Proceedings of the International Conference on Engineering Applications of Neural Networks, (EANN 2022), Chersonissos, Greece, 17–20 June 2022; Volume 2022, pp. 150–164. [Google Scholar] [CrossRef]
- van de Guchte, C. OECD-EU JRC Workshop on System Thinking for Critical Infrastructure Resilience and Security. Available online: https://www.oecd.org/gov/risk/workshop-oecd-jrc-system-thinking-for-critical-infrastructure-resilience-and-security.htm?_ga=2.176107106.1340904040.1700142340-662802145.1700142339 (accessed on 29 September 2022).
- CDIAC. CO2 Emissions from Netherlands. Carbon Dioxide Information Analysis Center. Available online: https://cdiac.ess-dive.lbl.gov/trends/emis/nth.html# (accessed on 29 September 2022).
- Vergouwe, R. The National Flood Risk Analysis for the Netherlands; Rijkswaterstaat VNK Project Office: Brussels, Belgium, 2016. [Google Scholar]
- Panagos, P.; Ballabio, C.; Borrelli, P.; Meusburger, K.; Klik, A.; Rousseva, S.; Tadić, M.P.; Michaelides, S.; Hrabalíková, M.; Olsen, P.; et al. Rainfall erosivity in Europe. Sci. Total Environ. 2015, 511, 801–814. [Google Scholar] [CrossRef] [PubMed]
- Ryan, T.W.; Lloyd, C.E.; Pichura, M.S.; Tarasovich, D.M.; Fitzgerald, S. Bridge Inspector’s Reference Manual (BIRM); National Highway Institute (U.S.): Vienna, VA, USA, 2022. [Google Scholar]
- UK Roads Liaison Group. Well-Managed Highway Infrastructure: A Code of Practice; Department for Transport, Great Minister House: London, UK, 2016. [Google Scholar]
- COST TU1406. COST TU1406 WG1, WG2, WG3, WG4 TECHNICAL REPORT. 2019. Available online: https://www.tu1406.eu/ (accessed on 21 September 2022).
- Casas, J.R.; Matos, J.C. Quality specifications for roadway bridges in Europe: Overview of COST Action TU1406. In Bridge Maintenance, Safety, Management, Life-Cycle Sustainability and Innovations; CRC Press: Boca Raton, FL, USA, 2021; pp. 1985–1992. [Google Scholar] [CrossRef]
- Stamataki, N.; Achillopoulou, D. Sensitivity analysis on resilience components throughout the lifecycle of an asset. In Life-Cycle of Structures and Infrastructure Systems, Proceedings of the Eighth International Symposium on Life-Cycle Civil Engineering (IALCCE 2023), Milan, Italy, 2–6 July 2023; Biondini, F., Frangopol, D.M., Eds.; CRC Press: Milan, Italy, 2023. [Google Scholar]
- Nam, B.H.; Yeon, J.H.; Behring, Z. Effect of daily temperature variations on the continuous deflection profiles of airfield jointed concrete pavements. Constr. Build. Mater. 2014, 73, 261–270. [Google Scholar] [CrossRef]
Disclaimer/Publisher’s Note: The statements, opinions and data contained in all publications are solely those of the individual author(s) and contributor(s) and not of MDPI and/or the editor(s). MDPI and/or the editor(s) disclaim responsibility for any injury to people or property resulting from any ideas, methods, instructions or products referred to in the content. |
© 2023 by the authors. Licensee MDPI, Basel, Switzerland. This article is an open access article distributed under the terms and conditions of the Creative Commons Attribution (CC BY) license (https://creativecommons.org/licenses/by/4.0/).