
Highway Transportation, Health, and Social Equity: A Delphi-ANP Approach to Sustainable Transport Planning


Abstract
:1. Introduction
2. Literature Review
Applications of MCDM in Transportation
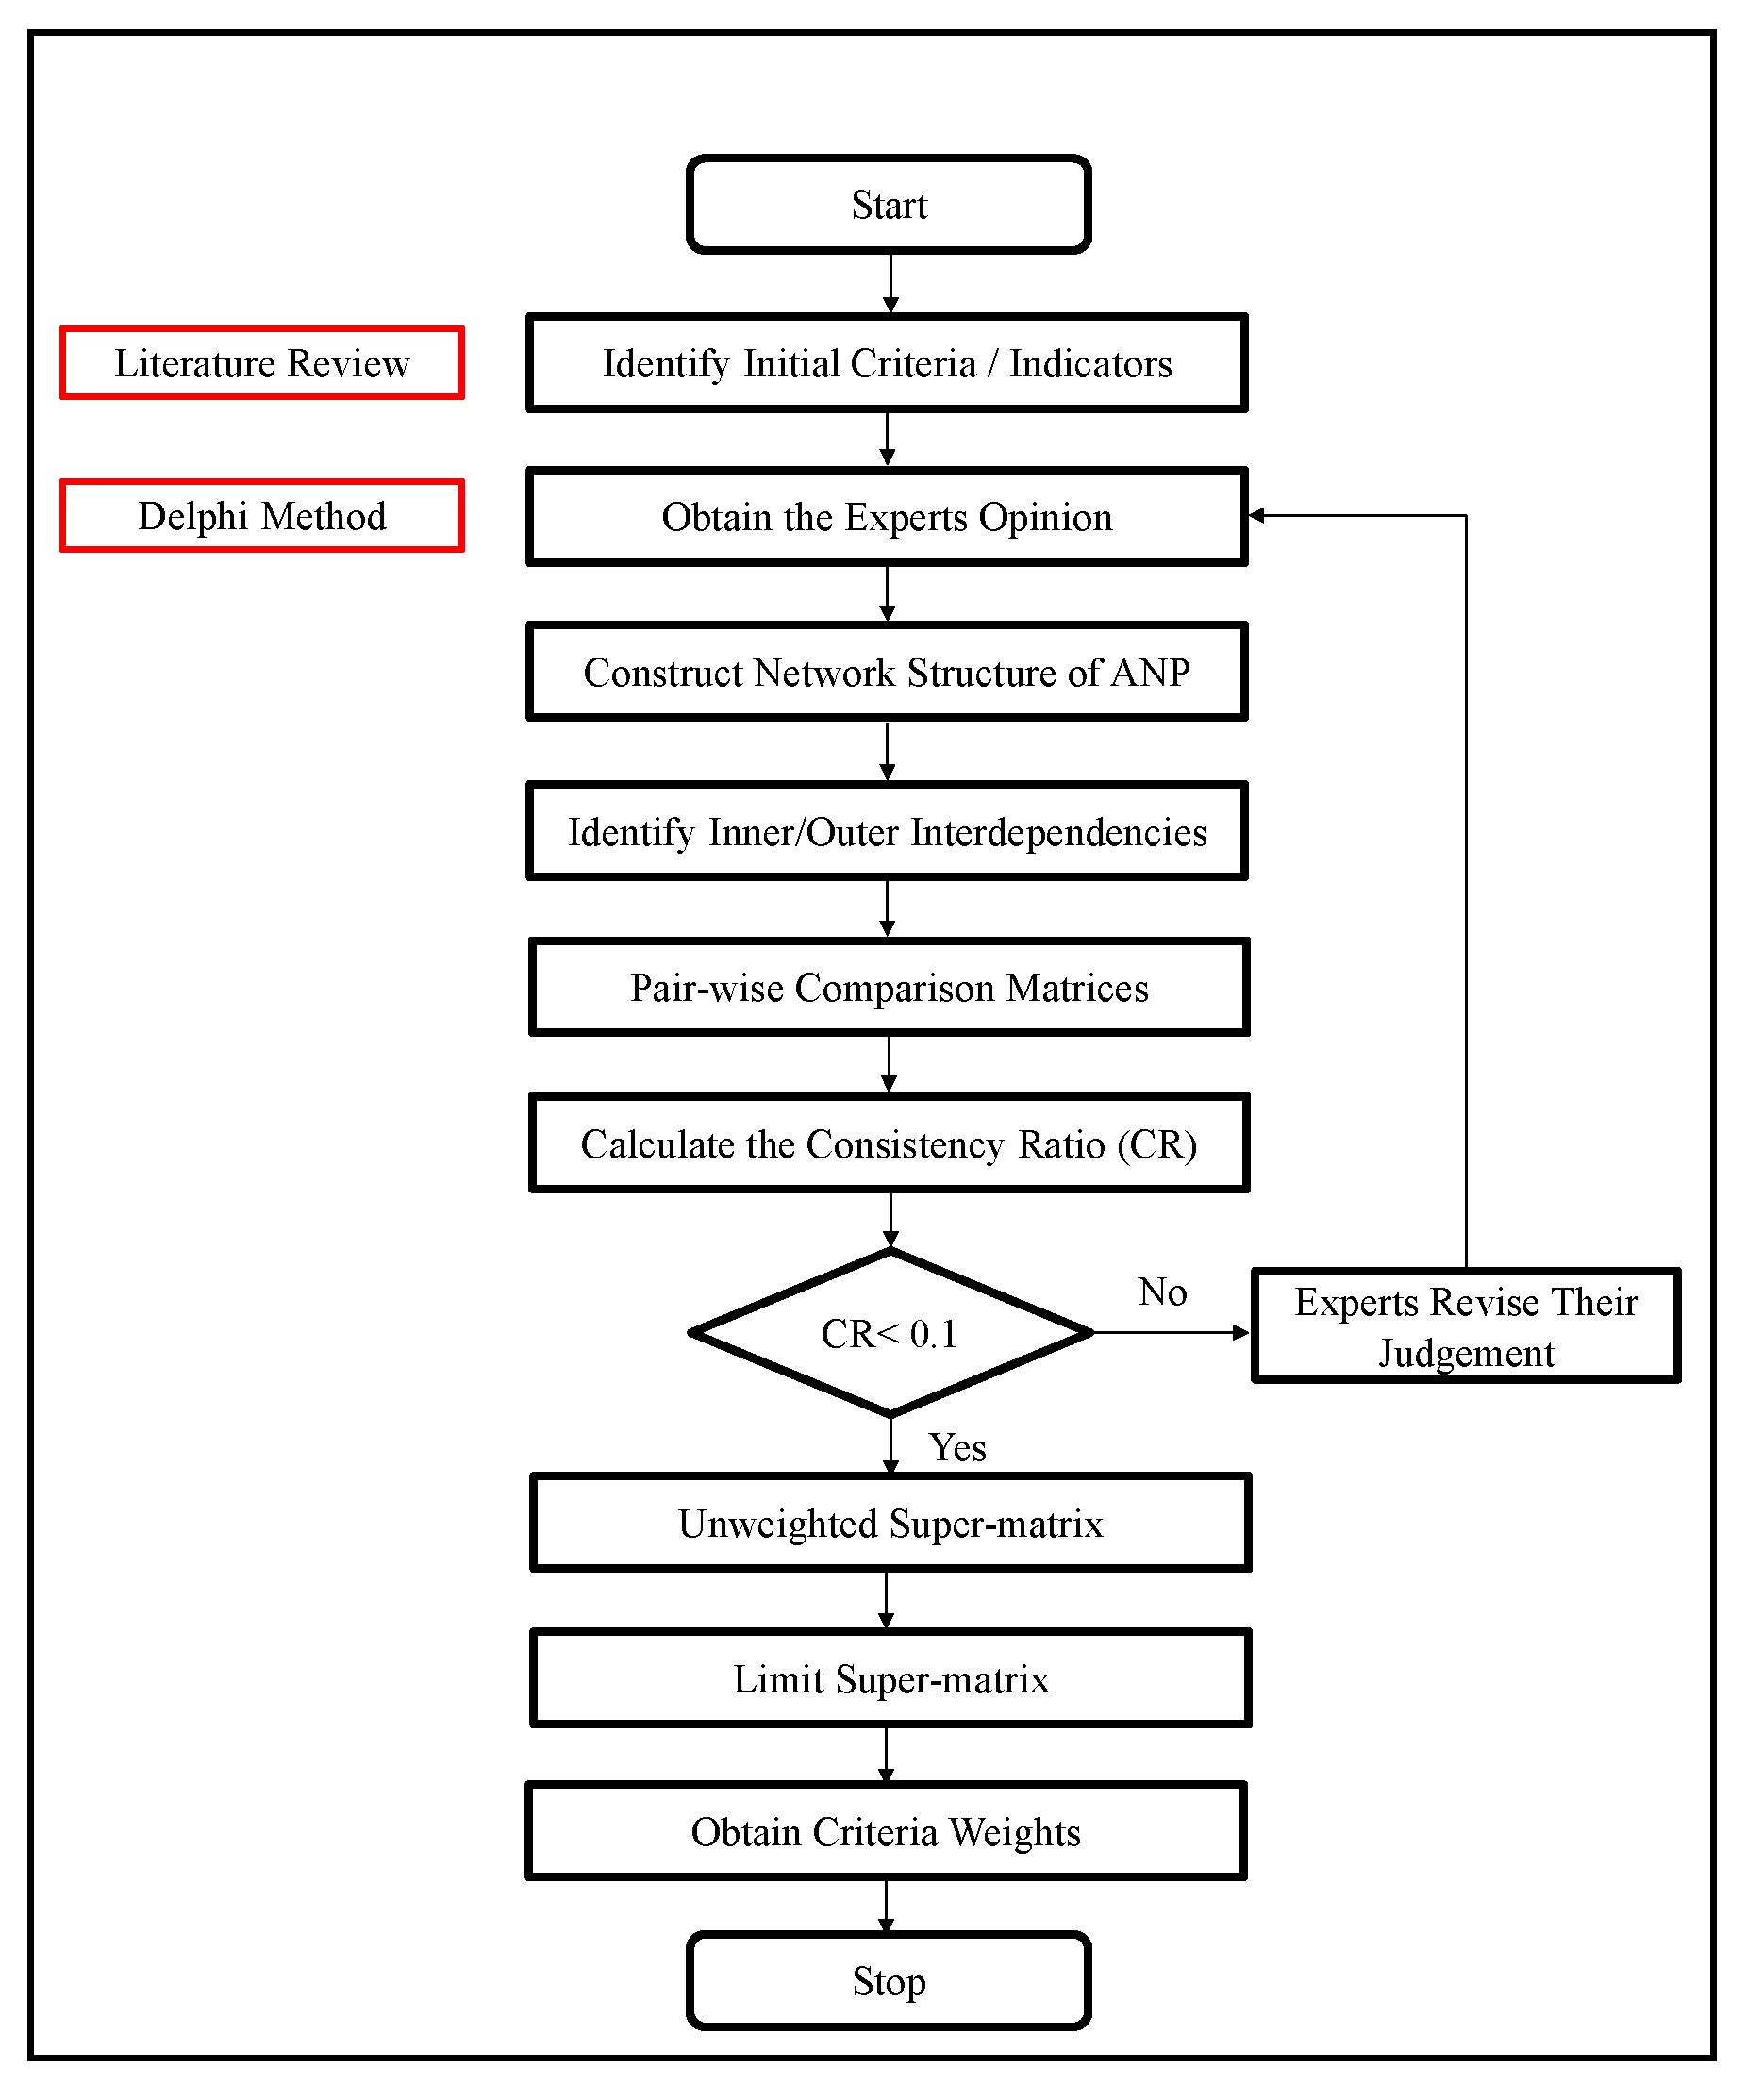
3. Materials and Methods
3.1. Delphi Method
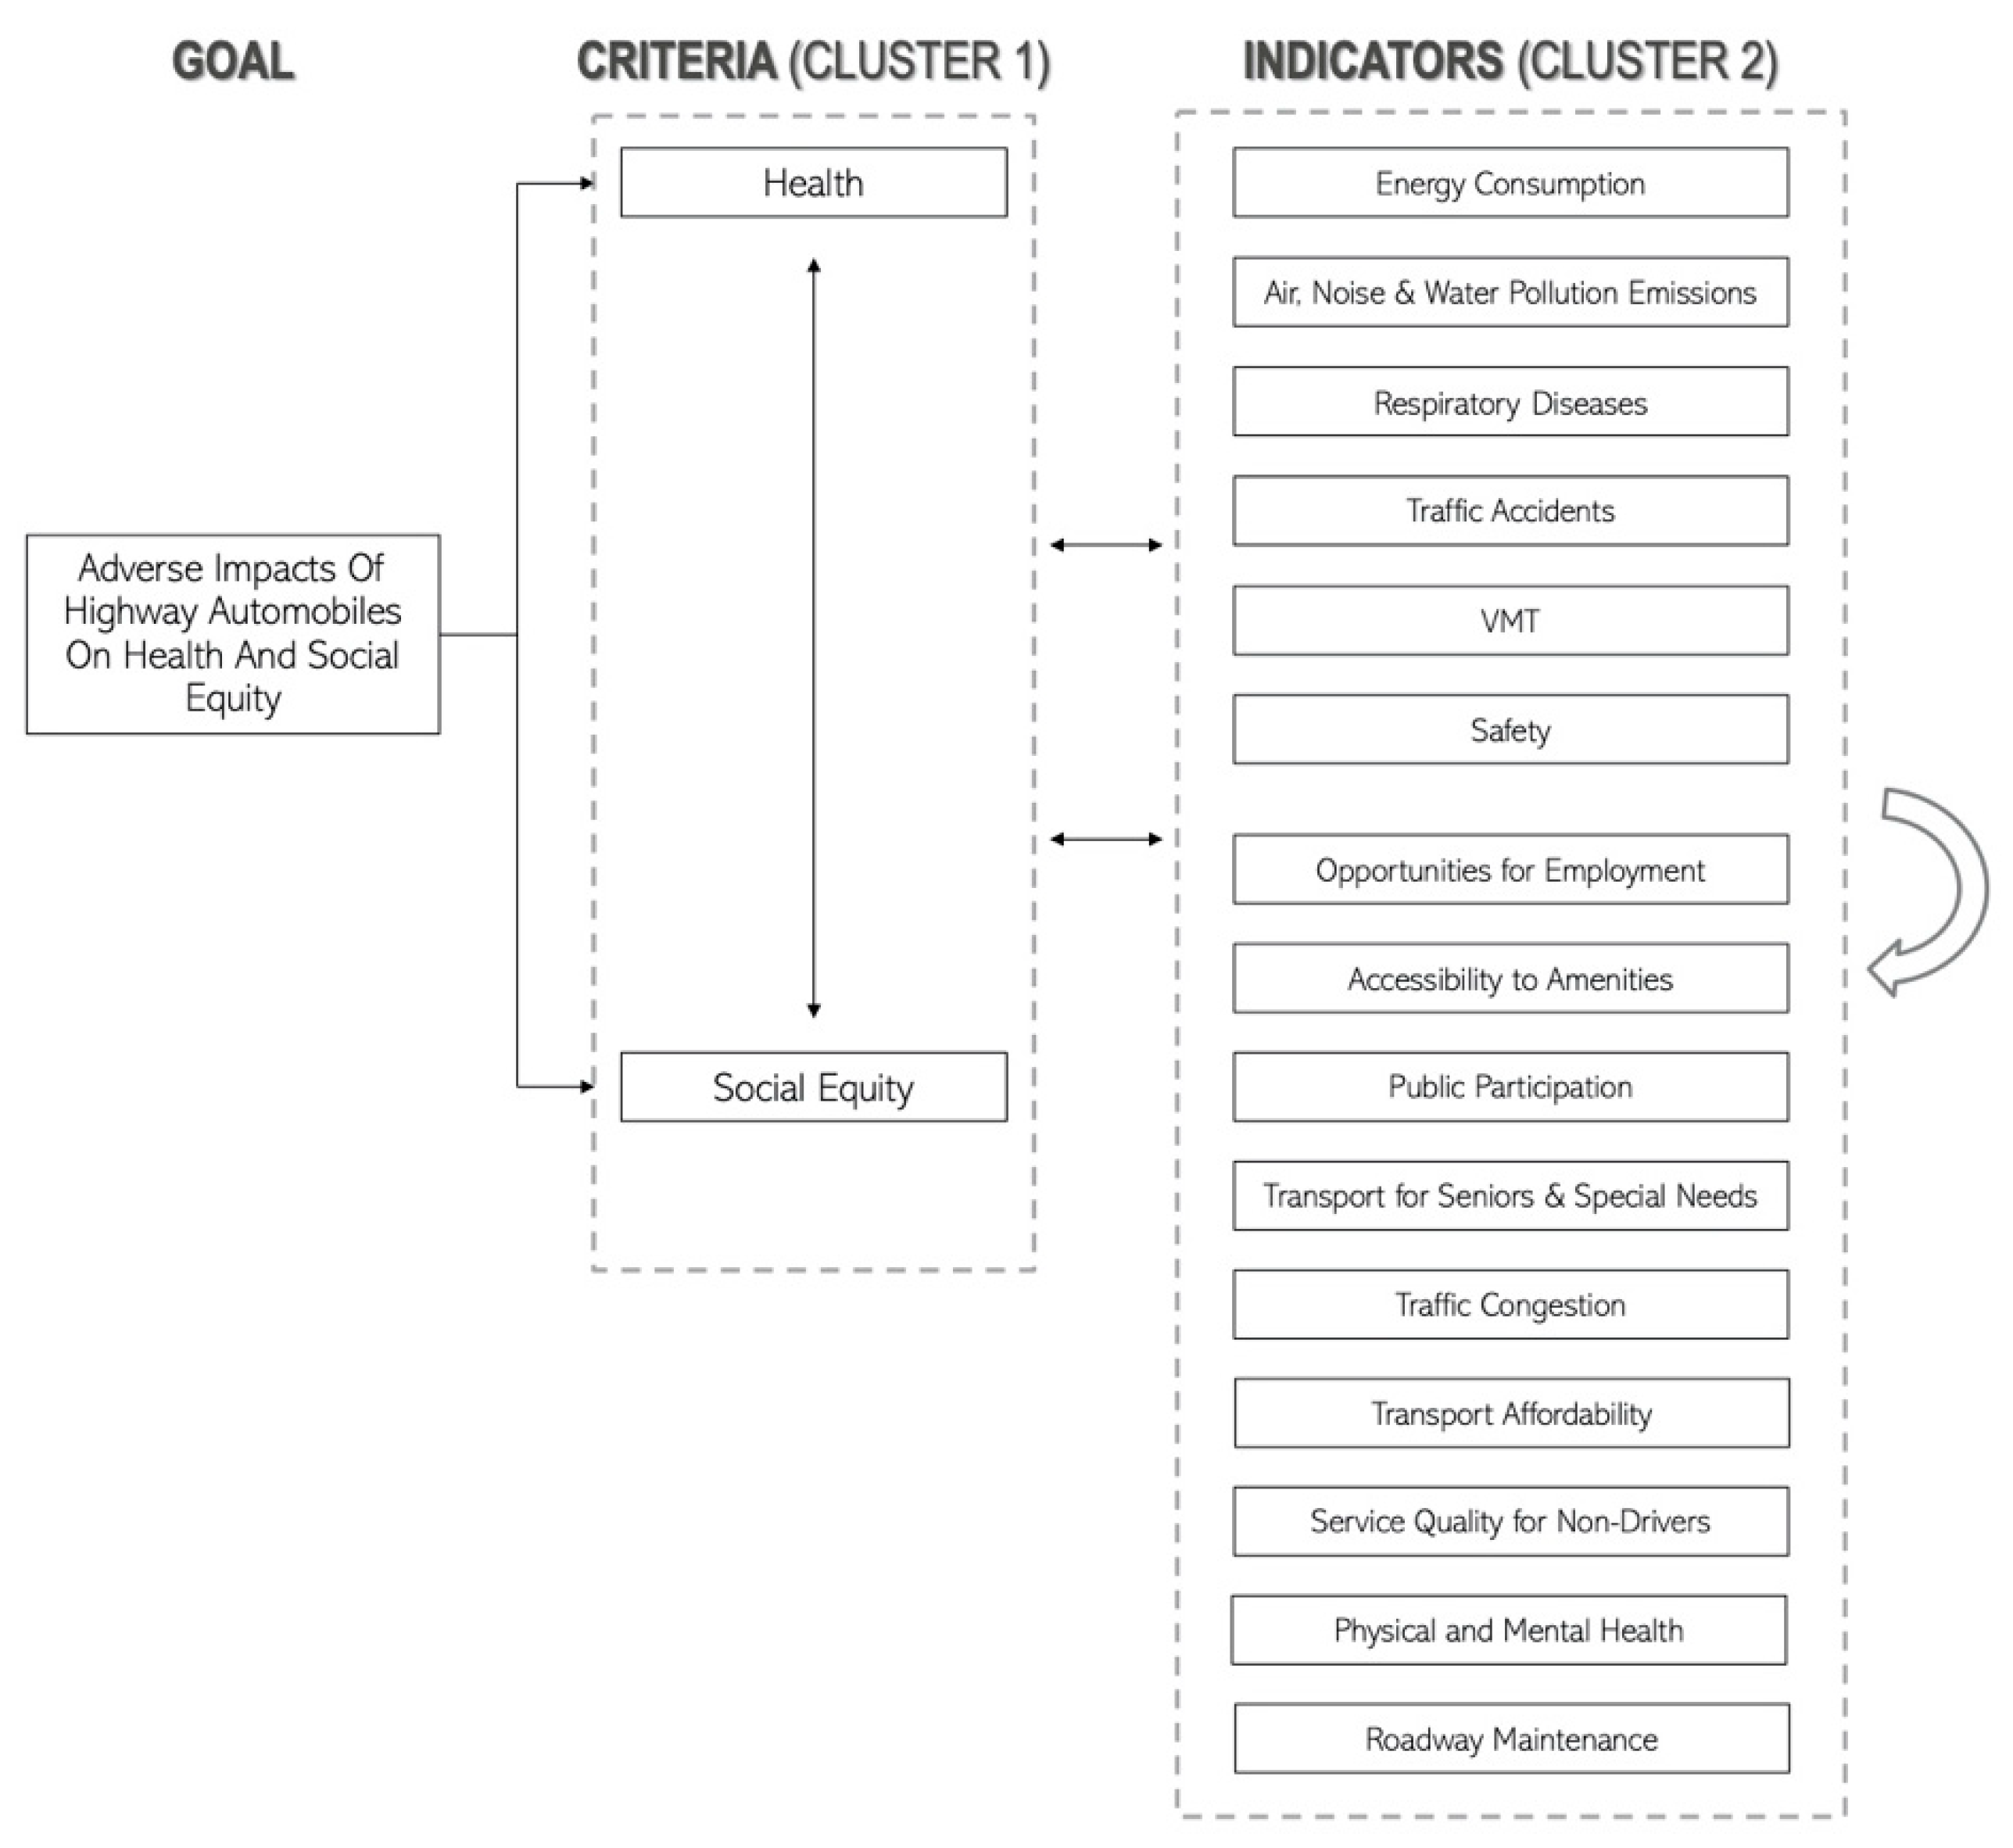
3.2. ANP Method
3.3. Data Sampling for the Expert Group
3.4. Survey Design
4. Results and Discussion
4.1. Delphi Analysis
4.2. ANP Analysis
5. Discussion
6. Conclusions
6.1. Future Implication and Research Contributions
6.2. Limitations
6.3. Contribution and Recommendations
Author Contributions
Funding
Institutional Review Board Statement
Informed Consent Statement
Data Availability Statement
Acknowledgments
Conflicts of Interest
Appendix A
| Indicators | Rating of Impact of Indicators | |
| Health | Social Equity | |
| Energy consumption—emission gases from vehicles | ||
| Land use | ||
| Noise pollution | ||
| Traffic accidents | ||
| Vehicle miles travelled (VMT) | ||
| Safety | ||
| Opportunities for employment | ||
| Accessibility to amenities | ||
| Public participation in transport decision | ||
| Transport for disabled | ||
| Traffic congestion—increased travel times | ||
| Respiratory diseases | ||
| Added- | ||
| Added- | ||
Appendix B
| Main Criteria | ||||||||||
| Criteria A | More Important Than | Equal | Less Important Than | Criteria B | ||||||
| Health | 9 | 7 | 5 | 3 | 1 | 3 | 5 | 7 | 9 | Social equity |
- -
- Energy consumption
| Indicators | ||||||||||
| Indicator A | More Important Than | Equal | Less Important Than | Indicator B | ||||||
| Energy consumption | 9 | 7 | 5 | 3 | 1 | 3 | 5 | 7 | 9 | Air, noise, and water pollution emissions |
| Indicators | ||||||||||
| Indicator A | More Important Than | Equal | Less Important Than | Indicator B | ||||||
| Energy consumption | 9 | 7 | 5 | 3 | 1 | 3 | 5 | 7 | 9 | Traffic accidents |
| Indicators | ||||||||||
| Indicator A | More Important Than | Equal | Less Important Than | Indicator B | ||||||
| Energy consumption | 9 | 7 | 5 | 3 | 1 | 3 | 5 | 7 | 9 | Vehicle miles traveled (VMT) |
| Indicators | ||||||||||
| Indicator A | More Important Than | Equal | Less Important Than | Indicator B | ||||||
| Energy consumption | 9 | 7 | 5 | 3 | 1 | 3 | 5 | 7 | 9 | Safety |
| Indicators | ||||||||||
| Indicator A | More Important Than | Equal | Less Important Than | Indicator B | ||||||
| Energy consumption | 9 | 7 | 5 | 3 | 1 | 3 | 5 | 7 | 9 | Opportunities for employment |
| Indicators | ||||||||||
| Indicator A | More Important Than | Equal | Less Important Than | Indicator B | ||||||
| Energy consumption | 9 | 7 | 5 | 3 | 1 | 3 | 5 | 7 | 9 | Accessibility to amenities |
| Indicators | ||||||||||
| Indicator A | More Important Than | Equal | Less Important Than | Indicator B | ||||||
| Energy consumption | 9 | 7 | 5 | 3 | 1 | 3 | 5 | 7 | 9 | Public participation in transport decisions |
| Indicators | ||||||||||
| Indicator A | More Important Than | Equal | Less Important Than | Indicator B | ||||||
| Energy consumption | 9 | 7 | 5 | 3 | 1 | 3 | 5 | 7 | 9 | Transport for seniors and special needs |
| Indicators | ||||||||||
| Indicator A | More Important Than | Equal | Less Important Than | Indicator B | ||||||
| Energy consumption | 9 | 7 | 5 | 3 | 1 | 3 | 5 | 7 | 9 | Traffic congestion |
| Indicators | ||||||||||
| Indicator A | More Important Than | Equal | Less Important Than | Indicator B | ||||||
| Energy consumption | 9 | 7 | 5 | 3 | 1 | 3 | 5 | 7 | 9 | Respiratory diseases |
| Indicators | ||||||||||
| Indicator A | More Important Than | Equal | Less Important Than | Indicator B | ||||||
| Energy consumption | 9 | 7 | 5 | 3 | 1 | 3 | 5 | 7 | 9 | Transport affordability |
| Indicators | ||||||||||
| Indicator A | More Important Than | Equal | Less Important Than | Indicator B | ||||||
| Energy consumption | 9 | 7 | 5 | 3 | 1 | 3 | 5 | 7 | 9 | Service quality for non-drivers |
| Indicators | ||||||||||
| Indicator A | More Important Than | Equal | Less Important Than | Indicator B | ||||||
| Energy consumption | 9 | 7 | 5 | 3 | 1 | 3 | 5 | 7 | 9 | Physical and mental health |
| Indicators | ||||||||||
| Indicator A | More Important Than | Equal | Less Important Than | Indicator B | ||||||
| Energy consumption | 9 | 7 | 5 | 3 | 1 | 3 | 5 | 7 | 9 | Roadway maintenance |
- -
- Air, noise, and water pollution emissions
| Indicators | ||||||||||
| Indicator A | More Important Than | Equal | Less Important Than | Indicator B | ||||||
| Air, noise, and water pollution emissions | 9 | 7 | 5 | 3 | 1 | 3 | 5 | 7 | 9 | Traffic accidents |
| Indicators | ||||||||||
| Indicator A | More Important Than | Equal | Less Important Than | Indicator B | ||||||
| Air, noise, and water pollution emissions | 9 | 7 | 5 | 3 | 1 | 3 | 5 | 7 | 9 | Vehicle miles Traveled (VMT) |
| Indicators | ||||||||||
| Indicator A | More Important Than | Equal | Less Important Than | Indicator B | ||||||
| Air, noise, and water pollution emissions | 9 | 7 | 5 | 3 | 1 | 3 | 5 | 7 | 9 | Safety |
| Indicators | ||||||||||
| Indicator A | More Important Than | Equal | Less Important Than | Indicator B | ||||||
| Air, noise, and water pollution emissions | 9 | 7 | 5 | 3 | 1 | 3 | 5 | 7 | 9 | Opportunities for employment |
| Indicators | ||||||||||
| Indicator A | More Important Than | Equal | Less Important Than | Indicator B | ||||||
| Air, noise, and water pollution emissions | 9 | 7 | 5 | 3 | 1 | 3 | 5 | 7 | 9 | Accessibility to amenities |
| Indicators | ||||||||||
| Indicator A | More Important Than | Equal | Less Important Than | Indicator B | ||||||
| Air, noise, and water pollution emissions | 9 | 7 | 5 | 3 | 1 | 3 | 5 | 7 | 9 | Public participation in transport decisions |
| Indicators | ||||||||||
| Indicator A | More Important Than | Equal | Less Important Than | Indicator B | ||||||
| Air, noise, and water pollution emissions | 9 | 7 | 5 | 3 | 1 | 3 | 5 | 7 | 9 | Transport for seniors and special needs |
| Indicators | ||||||||||
| Indicator A | More Important Than | Equal | Less Important Than | Indicator B | ||||||
| Air, noise, and water pollution emissions | 9 | 7 | 5 | 3 | 1 | 3 | 5 | 7 | 9 | Traffic congestion |
| Indicators | ||||||||||
| Indicator A | More Important Than | Equal | Less Important Than | Indicator B | ||||||
| Air, noise and water pollution emissions | 9 | 7 | 5 | 3 | 1 | 3 | 5 | 7 | 9 | Respiratory diseases |
| Indicators | ||||||||||
| Indicator A | More Important Than | Equal | Less Important Than | Indicator B | ||||||
| Air, noise, and water pollution emissions | 9 | 7 | 5 | 3 | 1 | 3 | 5 | 7 | 9 | Transport affordability |
| Indicators | ||||||||||
| Indicator A | More Important Than | Equal | Less Important Than | Indicator B | ||||||
| Air, noise, and water pollution emissions | 9 | 7 | 5 | 3 | 1 | 3 | 5 | 7 | 9 | Service quality for non-drivers |
| Indicators | ||||||||||
| Indicator A | More Important Than | Equal | Less Important Than | Indicator B | ||||||
| Air, noise, and water pollution emissions | 9 | 7 | 5 | 3 | 1 | 3 | 5 | 7 | 9 | Physical and mental health |
| Indicators | ||||||||||
| Indicator A | More Important Than | Equal | Less Important Than | Indicator B | ||||||
| Air, noise, and water pollution emissions | 9 | 7 | 5 | 3 | 1 | 3 | 5 | 7 | 9 | Roadway maintenance |
- -
- Traffic accidents
| Indicators | ||||||||||
| Indicator A | More Important Than | Equal | Less Important Than | Indicator B | ||||||
| Traffic accidents | 9 | 7 | 5 | 3 | 1 | 3 | 5 | 7 | 9 | Vehicle miles traveled (VMT) |
| Indicators | ||||||||||
| Indicator A | More Important Than | Equal | Less Important Than | Indicator B | ||||||
| Traffic accidents | 9 | 7 | 5 | 3 | 1 | 3 | 5 | 7 | 9 | Safety |
| Indicators | ||||||||||
| Indicator A | More Important Than | Equal | Less Important Than | Indicator B | ||||||
| Traffic accidents | 9 | 7 | 5 | 3 | 1 | 3 | 5 | 7 | 9 | Opportunities for employment |
| Indicators | ||||||||||
| Indicator A | More Important Than | Equal | Less Important Than | Indicator B | ||||||
| Traffic accidents | 9 | 7 | 5 | 3 | 1 | 3 | 5 | 7 | 9 | Accessibility to amenities |
| Indicators | ||||||||||
| Indicator A | More Important Than | Equal | Less Important Than | Indicator B | ||||||
| Traffic accidents | 9 | 7 | 5 | 3 | 1 | 3 | 5 | 7 | 9 | Public participation in transport decisions |
| Indicators | ||||||||||
| Indicator A | More Important Than | Equal | Less Important Than | Indicator B | ||||||
| Traffic accidents | 9 | 7 | 5 | 3 | 1 | 3 | 5 | 7 | 9 | Transport for seniors and special needs |
| Indicators | ||||||||||
| Indicator A | More Important Than | Equal | Less Important Than | Indicator B | ||||||
| Traffic accidents | 9 | 7 | 5 | 3 | 1 | 3 | 5 | 7 | 9 | Traffic congestion |
| Indicators | ||||||||||
| Indicator A | More Important Than | Equal | Less Important Than | Indicator B | ||||||
| Traffic accidents | 9 | 7 | 5 | 3 | 1 | 3 | 5 | 7 | 9 | Respiratory diseases |
| Indicators | ||||||||||
| Indicator A | More Important Than | Equal | Less Important Than | Indicator B | ||||||
| Traffic accidents | 9 | 7 | 5 | 3 | 1 | 3 | 5 | 7 | 9 | Transport affordability |
| Indicators | ||||||||||
| Indicator A | More Important Than | Equal | Less Important Than | Indicator B | ||||||
| Traffic accidents | 9 | 7 | 5 | 3 | 1 | 3 | 5 | 7 | 9 | Service quality for non-drivers |
| Indicators | ||||||||||
| Indicator A | More Important Than | Equal | Less Important Than | Indicator B | ||||||
| Traffic accidents | 9 | 7 | 5 | 3 | 1 | 3 | 5 | 7 | 9 | Physical and mental health |
| Indicators | ||||||||||
| Indicator A | More Important Than | Equal | Less Important Than | Indicator B | ||||||
| Traffic accidents | 9 | 7 | 5 | 3 | 1 | 3 | 5 | 7 | 9 | Roadway maintenance |
- -
- Vehicle miles traveled (VMT)
| Indicators | ||||||||||
| Indicator A | More Important Than | Equal | Less Important Than | Indicator B | ||||||
| Vehicle miles traveled (VMT) | 9 | 7 | 5 | 3 | 1 | 3 | 5 | 7 | 9 | Safety |
| Indicators | ||||||||||
| Indicator A | More Important Than | Equal | Less Important Than | Indicator B | ||||||
| Vehicle miles traveled (VMT) | 9 | 7 | 5 | 3 | 1 | 3 | 5 | 7 | 9 | Opportunities for employment |
| Indicators | ||||||||||
| Indicator A | More Important Than | Equal | Less Important Than | Indicator B | ||||||
| Vehicle miles traveled (VMT) | 9 | 7 | 5 | 3 | 1 | 3 | 5 | 7 | 9 | Accessibility to amenities |
| Indicators | ||||||||||
| Indicator A | More Important Than | Equal | Less Important Than | Indicator B | ||||||
| Vehicle miles traveled (VMT) | 9 | 7 | 5 | 3 | 1 | 3 | 5 | 7 | 9 | Public participation in transport decisions |
| Indicators | ||||||||||
| Indicator A | More Important Than | Equal | Less Important Than | Indicator B | ||||||
| Vehicle miles traveled (VMT) | 9 | 7 | 5 | 3 | 1 | 3 | 5 | 7 | 9 | Transport for seniors and special needs |
| Indicators | ||||||||||
| Indicator A | More Important Than | Equal | Less Important Than | Indicator B | ||||||
| Vehicle miles traveled (VMT) | 9 | 7 | 5 | 3 | 1 | 3 | 5 | 7 | 9 | Traffic congestion |
| Indicators | ||||||||||
| Indicator A | More Important Than | Equal | Less Important Than | Indicator B | ||||||
| Vehicle miles traveled (VMT) | 9 | 7 | 5 | 3 | 1 | 3 | 5 | 7 | 9 | Respiratory diseases |
| Indicators | ||||||||||
| Indicator A | More Important Than | Equal | Less Important Than | Indicator B | ||||||
| Vehicle miles traveled (VMT) | 9 | 7 | 5 | 3 | 1 | 3 | 5 | 7 | 9 | Transport affordability |
| Indicators | ||||||||||
| Indicator A | More Important Than | Equal | Less Important Than | Indicator B | ||||||
| Vehicle miles traveled (VMT) | 9 | 7 | 5 | 3 | 1 | 3 | 5 | 7 | 9 | Service quality for non-drivers |
| Indicators | ||||||||||
| Indicator A | More Important Than | Equal | Less Important Than | Indicator B | ||||||
| Vehicle miles traveled (VMT) | 9 | 7 | 5 | 3 | 1 | 3 | 5 | 7 | 9 | Physical and mental health |
| Indicators | ||||||||||
| Indicator A | More Important Than | Equal | Less Important Than | Indicator B | ||||||
| Vehicle miles traveled (VMT) | 9 | 7 | 5 | 3 | 1 | 3 | 5 | 7 | 9 | Roadway maintenance |
- -
- Safety
| Indicators | ||||||||||
| Indicator A | More Important Than | Equal | Less Important Than | Indicator B | ||||||
| Safety | 9 | 7 | 5 | 3 | 1 | 3 | 5 | 7 | 9 | Opportunities for employment |
| Indicators | ||||||||||
| Indicator A | More Important Than | Equal | Less Important Than | Indicator B | ||||||
| Safety | 9 | 7 | 5 | 3 | 1 | 3 | 5 | 7 | 9 | Accessibility to amenities |
| Indicators | ||||||||||
| Indicator A | More Important Than | Equal | Less Important Than | Indicator B | ||||||
| Safety | 9 | 7 | 5 | 3 | 1 | 3 | 5 | 7 | 9 | Public participation in transport decisions |
| Indicators | ||||||||||
| Indicator A | More Important Than | Equal | Less Important Than | Indicator B | ||||||
| Safety | 9 | 7 | 5 | 3 | 1 | 3 | 5 | 7 | 9 | Transport for seniors and special needs |
| Indicators | ||||||||||
| Indicator A | More Important Than | Equal | Less Important Than | Indicator B | ||||||
| Safety | 9 | 7 | 5 | 3 | 1 | 3 | 5 | 7 | 9 | Traffic congestion |
| Indicators | ||||||||||
| Indicator A | More Important Than | Equal | Less Important Than | Indicator B | ||||||
| Safety | 9 | 7 | 5 | 3 | 1 | 3 | 5 | 7 | 9 | Respiratory diseases |
| Indicators | ||||||||||
| Indicator A | More Important Than | Equal | Less Important Than | Indicator B | ||||||
| Safety | 9 | 7 | 5 | 3 | 1 | 3 | 5 | 7 | 9 | Transport affordability |
| Indicators | ||||||||||
| Indicator A | More Important Than | Equal | Less Important Than | Indicator B | ||||||
| Safety | 9 | 7 | 5 | 3 | 1 | 3 | 5 | 7 | 9 | Service quality for non-drivers |
| Indicators | ||||||||||
| Indicator A | More Important Than | Equal | Less Important Than | Indicator B | ||||||
| Safety | 9 | 7 | 5 | 3 | 1 | 3 | 5 | 7 | 9 | Physical and mental health |
| Indicators | ||||||||||
| Indicator A | More Important Than | Equal | Less Important Than | Indicator B | ||||||
| Safety | 9 | 7 | 5 | 3 | 1 | 3 | 5 | 7 | 9 | Roadway maintenance |
- -
- Opportunities for employment
| Indicators | ||||||||||
| Indicator A | More Important Than | Equal | Less Important Than | Indicator B | ||||||
| Opportunities for employment | 9 | 7 | 5 | 3 | 1 | 3 | 5 | 7 | 9 | Accessibility to amenities |
| Indicators | ||||||||||
| Indicator A | More Important Than | Equal | Less Important Than | Indicator B | ||||||
| Opportunities for employment | 9 | 7 | 5 | 3 | 1 | 3 | 5 | 7 | 9 | Public participation in transport decisions |
| Indicators | ||||||||||
| Indicator A | More Important Than | Equal | Less Important Than | Indicator B | ||||||
| Opportunities for employment | 9 | 7 | 5 | 3 | 1 | 3 | 5 | 7 | 9 | Transport for seniors and special needs |
| Indicators | ||||||||||
| Indicator A | More Important Than | Equal | Less Important Than | Indicator B | ||||||
| Opportunities for employment | 9 | 7 | 5 | 3 | 1 | 3 | 5 | 7 | 9 | Traffic congestion |
| Indicators | ||||||||||
| Indicator A | More Important Than | Equal | Less Important Than | Indicator B | ||||||
| Opportunities for employment | 9 | 7 | 5 | 3 | 1 | 3 | 5 | 7 | 9 | Respiratory diseases |
| Indicators | ||||||||||
| Indicator A | More Important Than | Equal | Less Important Than | Indicator B | ||||||
| Opportunities for employment | 9 | 7 | 5 | 3 | 1 | 3 | 5 | 7 | 9 | Transport affordability |
| Indicators | ||||||||||
| Indicator A | More Important Than | Equal | Less Important Than | Indicator B | ||||||
| Opportunities for employment | 9 | 7 | 5 | 3 | 1 | 3 | 5 | 7 | 9 | Service quality for non-drivers |
| Indicators | ||||||||||
| Indicator A | More Important Than | Equal | Less Important Than | Indicator B | ||||||
| Opportunities for employment | 9 | 7 | 5 | 3 | 1 | 3 | 5 | 7 | 9 | Physical and mental health |
| Indicators | ||||||||||
| Indicator A | More Important Than | Equal | Less Important Than | Indicator B | ||||||
| Opportunities for employment | 9 | 7 | 5 | 3 | 1 | 3 | 5 | 7 | 9 | Roadway maintenance |
- -
- Accessibility to amenities
| Indicators | ||||||||||
| Indicator A | More Important Than | Equal | Less Important Than | Indicator B | ||||||
| Accessibility to amenities | 9 | 7 | 5 | 3 | 1 | 3 | 5 | 7 | 9 | Public participation in transport decisions |
| Indicators | ||||||||||
| Indicator A | More Important Than | Equal | Less Important Than | Indicator B | ||||||
| Accessibility to amenities | 9 | 7 | 5 | 3 | 1 | 3 | 5 | 7 | 9 | Transport for seniors and special needs |
| Indicators | ||||||||||
| Indicator A | More Important Than | Equal | Less Important Than | Indicator B | ||||||
| Accessibility to amenities | 9 | 7 | 5 | 3 | 1 | 3 | 5 | 7 | 9 | Traffic congestion |
| Indicators | ||||||||||
| Indicator A | More Important Than | Equal | Less Important Than | Indicator B | ||||||
| Accessibility to amenities | 9 | 7 | 5 | 3 | 1 | 3 | 5 | 7 | 9 | Respiratory diseases |
| Indicators | ||||||||||
| Indicator A | More Important Than | Equal | Less Important Than | Indicator B | ||||||
| Accessibility to amenities | 9 | 7 | 5 | 3 | 1 | 3 | 5 | 7 | 9 | Transport affordability |
| Indicators | ||||||||||
| Indicator A | More Important Than | Equal | Less Important Than | Indicator B | ||||||
| Accessibility to amenities | 9 | 7 | 5 | 3 | 1 | 3 | 5 | 7 | 9 | Service quality for non-drivers |
| Indicators | ||||||||||
| Indicator A | More Important Than | Equal | Less Important Than | Indicator B | ||||||
| Accessibility to amenities | 9 | 7 | 5 | 3 | 1 | 3 | 5 | 7 | 9 | Physical and mental health |
| Indicators | ||||||||||
| Indicator A | More Important Than | Equal | Less Important Than | Indicator B | ||||||
| Accessibility to amenities | 9 | 7 | 5 | 3 | 1 | 3 | 5 | 7 | 9 | Roadway maintenance |
- -
- Public participation in transport decisions
| Indicators | ||||||||||
| Indicator A | More Important Than | Equal | Less Important Than | Indicator B | ||||||
| Public participation in transport decisions | 9 | 7 | 5 | 3 | 1 | 3 | 5 | 7 | 9 | Transport for seniors and special needs |
| Indicators | ||||||||||
| Indicator A | More Important Than | Equal | Less Important Than | Indicator B | ||||||
| Public participation in transport decisions | 9 | 7 | 5 | 3 | 1 | 3 | 5 | 7 | 9 | Traffic congestion |
| Indicators | ||||||||||
| Indicator A | More Important Than | Equal | Less Important Than | Indicator B | ||||||
| Public participation in transport decisions | 9 | 7 | 5 | 3 | 1 | 3 | 5 | 7 | 9 | Respiratory diseases |
| Indicators | ||||||||||
| Indicator A | More Important Than | Equal | Less Important Than | Indicator B | ||||||
| Public participation in transport decisions | 9 | 7 | 5 | 3 | 1 | 3 | 5 | 7 | 9 | Transport affordability |
| Indicators | ||||||||||
| Indicator A | More Important Than | Equal | Less Important Than | Indicator B | ||||||
| Public participation in transport decisions | 9 | 7 | 5 | 3 | 1 | 3 | 5 | 7 | 9 | Service quality for non-drivers |
| Indicators | ||||||||||
| Indicator A | More Important Than | Equal | Less Important Than | Indicator B | ||||||
| Public participation in transport decisions | 9 | 7 | 5 | 3 | 1 | 3 | 5 | 7 | 9 | Physical and mental health |
| Indicators | ||||||||||
| Indicator A | More Important Than | Equal | Less Important Than | Indicator B | ||||||
| Public participation in transport decisions | 9 | 7 | 5 | 3 | 1 | 3 | 5 | 7 | 9 | Roadway maintenance |
- -
- Transport for seniors and special needs
| Indicators | ||||||||||
| Indicator A | More Important Than | Equal | Less Important Than | Indicator B | ||||||
| Transport for seniors and special needs | 9 | 7 | 5 | 3 | 1 | 3 | 5 | 7 | 9 | Traffic congestion |
| Indicators | ||||||||||
| Indicator A | More Important Than | Equal | Less Important Than | Indicator B | ||||||
| Transport for seniors and special needs in transport decisions | 9 | 7 | 5 | 3 | 1 | 3 | 5 | 7 | 9 | Respiratory diseases |
| Indicators | ||||||||||
| Indicator A | More Important Than | Equal | Less Important Than | Indicator B | ||||||
| Transport for seniors and special needs | 9 | 7 | 5 | 3 | 1 | 3 | 5 | 7 | 9 | Transport affordability |
| Indicators | ||||||||||
| Indicator A | More Important Than | Equal | Less Important Than | Indicator B | ||||||
| Transport for seniors and special needs | 9 | 7 | 5 | 3 | 1 | 3 | 5 | 7 | 9 | Service quality for non-drivers |
| Indicators | ||||||||||
| Indicator A | More Important Than | Equal | Less Important Than | Indicator B | ||||||
| Transport for seniors and special needs | 9 | 7 | 5 | 3 | 1 | 3 | 5 | 7 | 9 | Physical and mental health |
| Indicators | ||||||||||
| Indicator A | More Important Than | Equal | Less Important Than | Indicator B | ||||||
| Transport for seniors and special needs | 9 | 7 | 5 | 3 | 1 | 3 | 5 | 7 | 9 | Roadway maintenance |
- -
- Traffic congestion
| Indicators | ||||||||||
| Indicator A | More Important Than | Equal | Less Important Than | Indicator B | ||||||
| Traffic congestion | 9 | 7 | 5 | 3 | 1 | 3 | 5 | 7 | 9 | Respiratory diseases |
| Indicators | ||||||||||
| Indicator A | More Important Than | Equal | Less Important Than | Indicator B | ||||||
| Traffic congestion | 9 | 7 | 5 | 3 | 1 | 3 | 5 | 7 | 9 | Transport affordability |
| Indicators | ||||||||||
| Indicator A | More Important Than | Equal | Less Important Than | Indicator B | ||||||
| Traffic congestion | 9 | 7 | 5 | 3 | 1 | 3 | 5 | 7 | 9 | Service quality for non-drivers |
| Indicators | ||||||||||
| Indicator A | More Important Than | Equal | Less Important Than | Indicator B | ||||||
| Traffic congestion | 9 | 7 | 5 | 3 | 1 | 3 | 5 | 7 | 9 | Physical and mental health |
| Indicators | ||||||||||
| Indicator A | More Important Than | Equal | Less Important Than | Indicator B | ||||||
| Traffic congestion | 9 | 7 | 5 | 3 | 1 | 3 | 5 | 7 | 9 | Roadway maintenance |
- -
- Respiratory diseases
| Indicators | ||||||||||
| Indicator A | More Important Than | Equal | Less Important Than | Indicator B | ||||||
| Respiratory diseases | 9 | 7 | 5 | 3 | 1 | 3 | 5 | 7 | 9 | Transport affordability |
| Indicators | ||||||||||
| Indicator A | More Important Than | Equal | Less Important Than | Indicator B | ||||||
| Respiratory diseases | 9 | 7 | 5 | 3 | 1 | 3 | 5 | 7 | 9 | Service quality for non-drivers |
| Indicators | ||||||||||
| Indicator A | More Important Than | Equal | Less Important Than | Indicator B | ||||||
| Respiratory diseases | 9 | 7 | 5 | 3 | 1 | 3 | 5 | 7 | 9 | Physical and mental health |
| Indicators | ||||||||||
| Indicator A | More Important Than | Equal | Less Important Than | Indicator B | ||||||
| Respiratory diseases | 9 | 7 | 5 | 3 | 1 | 3 | 5 | 7 | 9 | Roadway maintenance |
- -
- Transport affordability
| Indicators | ||||||||||
| Indicator A | More Important Than | Equal | Less Important Than | Indicator B | ||||||
| Transport affordability | 9 | 7 | 5 | 3 | 1 | 3 | 5 | 7 | 9 | Service quality for non-drivers |
| Indicators | ||||||||||
| Indicator A | More Important Than | Equal | Less Important Than | Indicator B | ||||||
| Transport affordability | 9 | 7 | 5 | 3 | 1 | 3 | 5 | 7 | 9 | Physical and mental health |
| Indicators | ||||||||||
| Indicator A | More Important Than | Equal | Less Important Than | Indicator B | ||||||
| Transport affordability | 9 | 7 | 5 | 3 | 1 | 3 | 5 | 7 | 9 | Roadway maintenance |
- -
- Service quality for non-drivers
| Indicators | ||||||||||
| Indicator A | More Important Than | Equal | Less Important Than | Indicator B | ||||||
| Service quality for non-drivers | 9 | 7 | 5 | 3 | 1 | 3 | 5 | 7 | 9 | Physical and mental health |
| Indicators | ||||||||||
| Indicator A | More Important Than | Equal | Less Important Than | Indicator B | ||||||
| Service quality for non-drivers | 9 | 7 | 5 | 3 | 1 | 3 | 5 | 7 | 9 | Roadway maintenance |
- -
- Physical and mental health
| Indicators | ||||||||||
| Indicator A | More Important Than | Equal | Less Important Than | Indicator B | ||||||
| Physical and mental health | 9 | 7 | 5 | 3 | 1 | 3 | 5 | 7 | 9 | Roadway maintenance |
Appendix C

| Indicator | Description |
|---|---|
| Health * | |
| Energy consumption—emission gases from vehicles | Energy consumption: includes energy types (renewable versus non-renewable), total and per capita energy consumption, and energy efficiency about different transportation modes (in this research, automobiles). Emission gases: reduce transportation-related emissions of air pollutants and greenhouse gases and provide efficient and alternative fuel vehicles. |
| Land use | Includes land consumption for transport infrastructure (roads, parking, etc.). The goal is to increase land use compactness, density, balance of interacting uses (compactness, density, balance), and preserve open spaces. |
| Noise pollution | Provide cost-effective measures that primarily reduce acute noise exposure and chronic noise exposure. |
| Traffic accidents | Includes fatality and injures of traffic accidents per capita or person/km. |
| Vehicle mile traveled (VMT) | Reduce activity that generates pollutant emissions (travel, trip length, mode split, emissions). |
| Safety | Apply road infrastructure safety management (RISM) measures to reduce the number of accidents and casualties. |
| Social Equity * | |
| Opportunities for employment | Improve connectivity between low-income and minority populations and major employment in terms of worker access to employment centers within a specific time by car. |
| Accessibility to amenities | Ensure accessibility to essential destinations for all communities that allows people to fulfill at least their basic needs. |
| Public participation in transport decisions | Includes public participation and sharing of information so that individuals can integrate their community values and needs into a transportation plan and thus help policymakers to make informed decisions. |
| Transport for disabled | Provide options that allow affordable and equitable transportation opportunities for all sections of society. |
| Traffic congestion—increased travel times | Includes reduced traffic and parking congestion, traffic calming and speed control, and per capita congestion costs (total time spent in traffic). |
References
- Al-Thawadi, F.E.; Banawi, A.-A.A.; Al-Ghamdi, S.G. Social impact assessment towards sustainable urban mobility in Qatar: Understanding behavioral change triggers. Transp. Res. Interdiscip. Perspect. 2021, 9, 100295. [Google Scholar] [CrossRef]
- Timmermans, C.; Alhajyaseen, W.; Reinolsmann, N.; Nakamura, H.; Suzuki, K. Traffic safety culture of professional drivers in the State of Qatar. IATSS Res. 2019, 43, 286–296. [Google Scholar] [CrossRef]
- Iyanna, S.; Bosangit, C.; Lazell, J.; Carrigan, M. A theories of practice perspective in understanding barriers to sustainable commuting: The case of United Arab Emirates. Int. J. Nonprofit Volunt. Sect. Mark. 2019, 24, e1668. [Google Scholar] [CrossRef]
- Brundtland, G.H. Our common future—Call for action. Environ. Conserv. 1987, 14, 291–294. [Google Scholar] [CrossRef]
- Ramani, T.L.; Zietsman, J. Sustainable transportation—Alternative perspectives and enduring challenges. Int. J. Urban Sci. 2016, 20, 318–333. [Google Scholar] [CrossRef]
- Liang, H.; Ren, J.; Lin, R.; Liu, Y. Alternative-fuel based vehicles for sustainable transportation: A fuzzy group decision supporting framework for sustainability prioritization. Technol. Forecast. Soc. Change 2019, 140, 33–43. [Google Scholar] [CrossRef]
- Boschmann, E.E.; Kwan, M.-P. Toward socially sustainable urban transportation: Progress and potentials. Int. J. Sustain. Transp. 2008, 2, 138–157. [Google Scholar] [CrossRef]
- Beiler, M.R.O.; Treat, C. Integrating GIS and AHP to Prioritize Transportation Infrastructure Using Sustainability Metrics. J. Infrastruct. Syst. 2015, 21, 04014053. [Google Scholar] [CrossRef]
- Khan, M.; Hussain, M.; Gunasekaran, A.; Ajmal, M.M.; Helo, P.T. Motivators of social sustainability in healthcare supply chains in the UAE—Stakeholder perspective. Sustain. Prod. Consum. 2018, 14, 95–104. [Google Scholar] [CrossRef]
- El-Sayegh Sameh, M.; Mansour Mahmoud, H. Risk Assessment and Allocation in Highway Construction Projects in the UAE. J. Manag. Eng. 2015, 31, 04015004. [Google Scholar] [CrossRef]
- Paleologos, E.; Al Nahyan, M.; Farouk, S. Risks and threats of desalination in the Arabian Gulf. IOP Conf. Ser. Earth Environ. Sci. 2018, 191, 012008. [Google Scholar] [CrossRef]
- Del Rio, M.; Hargrove, W.L.; Tomaka, J.; Korc, M. Transportation Matters: A Health Impact Assessment in Rural New Mexico. Int. J. Environ. Res. Public Health 2017, 14, 629. [Google Scholar] [CrossRef] [PubMed]
- Martínez-Bravo, M.d.M.; Martínez-del-Río, J.; Antolín-López, R. Trade-offs among urban sustainability, pollution and livability in European cities. J. Clean. Prod. 2019, 224, 651–660. [Google Scholar] [CrossRef]
- Loney, T.; Aw, T.-C.; Handysides, D.G.; Ali, R.; Blair, I.; Grivna, M.; Shah, S.M.; Sheek-Hussein, M.; El-Sadig, M.; Sharif, A.A.; et al. An analysis of the health status of the United Arab Emirates: The ‘Big 4’ public health issues. Glob. Health Action 2013, 6, 20100. [Google Scholar] [CrossRef]
- Bentley, M. An ecological public health approach to understanding the relationships between sustainable urban environments, public health and social equity. Health Promot. Int. 2014, 29, 528–537. [Google Scholar] [CrossRef] [PubMed]
- Almashhour, R.; Samara, F. Evaluating Livability Perceptions: Indicators to Evaluate Livability of a University Campus. Sustainability 2022, 14, 11872. [Google Scholar] [CrossRef]
- Adorno, G.; Fields, N.; Cronley, C.; Parekh, R.; Magruder, K. Ageing in a low-density urban city: Transportation mobility as a social equity issue. Ageing Soc. 2018, 38, 296. [Google Scholar] [CrossRef]
- Manaugh, K.; Badami, M.G.; El-Geneidy, A.M. Integrating social equity into urban transportation planning: A critical evaluation of equity objectives and measures in transportation plans in North America. Transp. Policy 2015, 37, 167–176. [Google Scholar] [CrossRef]
- Sanches, T.L.; Bento, N.V.S. Urban Metabolism: A Tool to Accelerate the Transition to a Circular Economy. Sustain. Cities Communities 2020, 860–876. [Google Scholar]
- Naganathan, H.; Chong, W.K. Evaluation of state sustainable transportation performances (SSTP) using sustainable indicators. Sustain. Cities Soc. 2017, 35, 799–815. [Google Scholar] [CrossRef]
- Lautso, K.; Toivanen, S. SPARTACUS System for Analyzing Urban Sustainability. Transp. Res. Rec. 1999, 1670, 35–46. [Google Scholar] [CrossRef]
- Nicolas, J.P.; Pochet, P.; Poimboeuf, H. Towards sustainable mobility indicators: Application to the Lyons conurbation. Transp. Policy 2003, 10, 197–208. [Google Scholar] [CrossRef]
- Zhou, J.; Shen, L.; Song, X.; Zhang, X. Selection and modeling sustainable urbanization indicators: A responsibility-based method. Ecol. Indic. 2015, 56, 87–95. [Google Scholar] [CrossRef]
- Haghshenas, H.; Vaziri, M. Urban sustainable transportation indicators for global comparison. Ecol. Indic. 2012, 15, 115–121. [Google Scholar] [CrossRef]
- Litman, T.; Burwell, D. Issues in sustainable transportation. Int. J. Glob. Environ. Issues 2006, 6, 331–347. [Google Scholar] [CrossRef]
- Jeon, C.M.; Amekudzi, A.A.; Guensler, R.L. Sustainability assessment at the transportation planning level: Performance measures and indexes. Transp. Policy 2013, 25, 10–21. [Google Scholar] [CrossRef]
- Sadeghi-Niaraki, A.; Varshosaz, M.; Kim, K.; Jung, J.J. Real world representation of a road network for route planning in GIS. Expert Syst. Appl. 2011, 38, 11999–12008. [Google Scholar] [CrossRef]
- Toth-Szabo, Z.; Várhelyi, A. Indicator Framework for Measuring Sustainability of Transport in the City. Procedia Soc. Behav. Sci. 2012, 48, 2035–2047. [Google Scholar] [CrossRef]
- Osorio-Tejada, J.L.; Llera-Sastresa, E.; Scarpellini, S. A multi-criteria sustainability assessment for biodiesel and liquefied natural gas as alternative fuels in transport systems. J. Nat. Gas Sci. Eng. 2017, 42, 169–186. [Google Scholar] [CrossRef]
- Duleba, S.; Moslem, S. Examining Pareto optimality in analytic hierarchy process on real Data: An application in public transport service development. Expert Syst. Appl. 2019, 116, 21–30. [Google Scholar] [CrossRef]
- Kumar, A.; Anbanandam, R. Development of social sustainability index for freight transportation system. J. Clean. Prod. 2019, 210, 77–92. [Google Scholar] [CrossRef]
- Miller, P.; de Barros, A.G.; Kattan, L.; Wirasinghe, S.C. Public transportation and sustainability: A review. KSCE J. Civ. Eng. 2016, 20, 1076–1083. [Google Scholar] [CrossRef]
- Mahmoudi, R.; Shetab-Boushehri, S.-N.; Hejazi, S.R.; Emrouznejad, A. Determining the relative importance of sustainability evaluation criteria of urban transportation network. Sustain. Cities Soc. 2019, 47, 101493. [Google Scholar] [CrossRef]
- López, C.; Ruíz-Benítez, R.; Vargas-Machuca, C. On the Environmental and Social Sustainability of Technological Innovations in Urban Bus Transport: The EU Case. Sustainability 2019, 11, 1413. [Google Scholar] [CrossRef]
- Mulvaney, C.A.; Watson, M.C.; Errington, G. Safety education impact and good practice: A review. Health Educ. 2011, 112, 15–30. [Google Scholar] [CrossRef]
- Zietsman, J.; Rilett, L.R. Sustainable Transportation: Conceptualization and Performance Measures; Citeseer: University Park, PA, USA, 2002. [Google Scholar]
- Hwang, C.-L.; Yoon, K. Methods for multiple attribute decision making. In Multiple Attribute Decision Making; Springer: Berlin/Heidelberg, Germany, 1981; pp. 58–191. [Google Scholar]
- Stojčić, M.; Zavadskas, E.K.; Pamučar, D.; Stević, Ž.; Mardani, A. Application of MCDM methods in sustainability engineering: A literature review 2008–2018. Symmetry 2019, 11, 350. [Google Scholar] [CrossRef]
- Wang, C.-N.; Yang, F.-C.; Vo, T.M.N.; Nguyen, V.T.T.; Singh, M. Enhancing Efficiency and Cost-Effectiveness: A Groundbreaking Bi-Algorithm MCDM Approach. Appl. Sci. 2023, 13, 9105. [Google Scholar] [CrossRef]
- Wang, C.-N.; Yang, F.-C.; Vo, N.T.M.; Nguyen, V.T.T. Enhancing Lithium-Ion Battery Manufacturing Efficiency: A Comparative Analysis Using DEA Malmquist and Epsilon-Based Measures. Batteries 2023, 9, 317. [Google Scholar] [CrossRef]
- Macharis, C.; De Witte, A.; Ampe, J. The multi-actor, multi-criteria analysis methodology (MAMCA) for the evaluation of transport projects: Theory and practice. J. Adv. Transp. 2009, 43, 183–202. [Google Scholar] [CrossRef]
- Phillis, Y.A.; Kouikoglou, V.S.; Verdugo, C. Urban sustainability assessment and ranking of cities. Comput. Environ. Urban Syst. 2017, 64, 254–265. [Google Scholar] [CrossRef]
- Yannis, G.; Kopsacheili, A.; Dragomanovits, A.; Petraki, V. State-of-the-art review on multi-criteria decision-making in the transport sector. J. Traffic Transp. Eng. (Engl. Ed.) 2020, 7, 413–431. [Google Scholar] [CrossRef]
- Nævestad, T.-O.; Laiou, A.; Rosenbloom, T.; Elvik, R.; Yannis, G. The role of values in road safety culture: Examining the valuation of freedom to take risk, risk taking and accident involvement in three countries. Transp. Res. Part F Traffic Psychol. Behav. 2022, 84, 375–392. [Google Scholar] [CrossRef]
- Seker, S.; Aydin, N. Sustainable Public Transportation System Evaluation: A Novel Two-Stage Hybrid Method Based on IVIF-AHP and CODAS. Int. J. Fuzzy Syst. 2020, 22, 257–272. [Google Scholar] [CrossRef]
- Barfod, M.B.; Salling, K.B. A new composite decision support framework for strategic and sustainable transport appraisals. Transp. Res. Part A Policy Pract. 2015, 72, 1–15. [Google Scholar] [CrossRef]
- Mustafa, H.; Tamer, E. Strategic Planning Based on Sustainability for Urban Transportation: An Application to Decision-Making. Sustainability 2020, 12, 3589. [Google Scholar] [CrossRef]
- Jones, S.; Tefe, M.; Appiah-Opoku, S. Proposed framework for sustainability screening of urban transport projects in developing countries: A case study of Accra, Ghana. Transp. Res. Part A 2013, 49, 21–34. [Google Scholar] [CrossRef]
- Jasti, P.C.; Ram, V.V. Sustainable benchmarking of a public transport system using analytic hierarchy process and fuzzy logic: A case study of Hyderabad, India. Public Transp. 2019, 11, 457–485. [Google Scholar] [CrossRef]
- Zou, L.; Dai, H.; Yao, E.; Jiang, T.; Guo, H. Research on Assessment Methods for Urban Public Transport Development in China. Comput. Intell. Neurosci. CIN 2014, 2014, 941347. [Google Scholar] [CrossRef]
- Cyril, A.; Mulangi, R.H.; George, V. Performance Optimization of Public Transport Using Integrated AHP–GP Methodology. Urban Rail Transit 2019, 5, 133–144. [Google Scholar] [CrossRef]
- Pedroso, G.; Bermann, C.; Sanches-Pereira, A. Combining the functional unit concept and the analytic hierarchy process method for performance assessment of public transport options. Case Stud. Transp. Policy 2018, 6, 722–736. [Google Scholar] [CrossRef]
- Mahmoud, M.; Hine, J. Using AHP to measure the perception gap between current and potential users of bus services. Transp. Plan. Technol. 2013, 36, 4–23. [Google Scholar] [CrossRef]
- Liang, L.; Wang, Z.; Li, J. The effect of urbanization on environmental pollution in rapidly developing urban agglomerations. J. Clean. Prod. 2019, 237, 117649. [Google Scholar] [CrossRef]
- Ullah, K.; Hamid, S.; Mirza, F.M.; Shakoor, U. Prioritizing the gaseous alternatives for the road transport sector of Pakistan: A multi criteria decision making analysis. Energy 2018, 165, 1072–1084. [Google Scholar] [CrossRef]
- Skulmoski, G.J.; Hartman, F.T.; Krahn, J. The Delphi method for graduate research. J. Inf. Technol. Educ. Res. 2007, 6, 1–21. [Google Scholar] [CrossRef] [PubMed]
- Bilişik, Ö.N.; Erdoğan, M.; Kaya, İ.; Baraçlı, H. A hybrid fuzzy methodology to evaluate customer satisfaction in a public transportation system for Istanbul. Total Qual. Manag. Bus. Excell. 2013, 24, 1141–1159. [Google Scholar] [CrossRef]
- Yousuf, M.I. Using expertsopinions through Delphi technique. Pract. Assess. Res. Eval. 2007, 12, 4. [Google Scholar]
- Kim, M.; Jang, Y.-C.; Lee, S. Application of Delphi-AHP methods to select the priorities of WEEE for recycling in a waste management decision-making tool. J. Environ. Manag. 2013, 128, 941–948. [Google Scholar] [CrossRef]
- Saaty, T.L. Decision Making with Dependence and Feedback: The Analytic Network Process; RWS publications Pittsburgh: Pittsburgh, PA, USA, 1996; Volume 4922. [Google Scholar]
- Mahmoudkelaye, S.; Taghizade Azari, K.; Pourvaziri, M.; Asadian, E. Sustainable material selection for building enclosure through ANP method. Case Stud. Constr. Mater. 2018, 9, e00200. [Google Scholar] [CrossRef]
- Sayyadi, R.; Awasthi, A. An integrated approach based on system dynamics and ANP for evaluating sustainable transportation policies. Int. J. Syst. Sci. Oper. Logist. 2020, 7, 182–191. [Google Scholar] [CrossRef]
- Yucelgazi, F.; Yitmen, İ. An ANP model for risk assessment in large-scale transport infrastructure projects. Arab. J. Sci. Eng. 2019, 44, 4257–4275. [Google Scholar] [CrossRef]
- Helmy, R.; Zullig, L.L.; Dunbar-Jacob, J.; Hughes, D.A.; Vrijens, B.; Wilson, I.B.; De Geest, S. ESPACOMP medication adherence reporting guidelines (EMERGE): A reactive-Delphi study protocol. BMJ Open 2017, 7, e013496. [Google Scholar] [CrossRef]
- Kim, T.-e.; Mallam, S. A Delphi-AHP study on STCW leadership competence in the age of autonomous maritime operations. WMU J. Marit. Aff. 2020, 19, 163–181. [Google Scholar] [CrossRef]
- Green, C.G.; Khan, M.A.; Badinelli, R. Use of the Delphi research technique to test a decision model in foodservice systems: A case study in food production. J. Am. Diet. Assoc. 1993, 93, 1307–1309. [Google Scholar] [CrossRef] [PubMed]
- Chen, L.; Ng, E.; Huang, S.-C.; Fang, W.-T. A self-evaluation system of quality planning for tourist attractions in Taiwan: An integrated AHP-Delphi approach from career professionals. Sustainability 2017, 9, 1751. [Google Scholar] [CrossRef]
- Saaty, T.L. There is no mathematical validity for using fuzzy number crunching in the analytic hierarchy process. J. Syst. Sci. Syst. Eng. 2006, 15, 457–464. [Google Scholar] [CrossRef]
- Özdemir, A.; Özkan, A.; Günkaya, Z.; Banar, M. Decision-making for the selection of different leachate treatment/management methods: The ANP and PROMETHEE approaches. Environ. Sci. Pollut. Res. 2020, 27, 19798–19809. [Google Scholar] [CrossRef] [PubMed]
- Chand, M.; Bhatia, N.; Singh, R.K. ANP-MOORA-based approach for the analysis of selected issues of green supply chain management. Benchmarking Int. J. 2018, 25, 642–659. [Google Scholar] [CrossRef]
- Alonso-Sáez, L.; Gasol, J.M.; Lefort, T.; Hofer, J.; Sommaruga, R. Effect of natural sunlight on bacterial activity and differential sensitivity of natural bacterioplankton groups in northwestern Mediterranean coastal waters. Appl. Environ. Microbiol. 2006, 72, 5806–5813. [Google Scholar] [CrossRef]
- Babaei, A.; Khedmati, M.; Jokar, M.R.A. A new model for evaluation of the passenger and freight transportation planning based on the sustainability and safety dimensions: A case study. Process Integr. Optim. Sustain. 2022, 6, 1201–1229. [Google Scholar] [CrossRef]
- Tiwari, G.; Jain, D. Accessibility and safety indicators for all road users: Case study Delhi BRT. J. Transp. Geogr. 2012, 22, 87–95. [Google Scholar] [CrossRef]
- Tob-Ogu, A.; Kumar, N.; Cullen, J. ICT adoption in road freight transport in Nigeria—A case study of the petroleum downstream sector. Technol. Forecast. Soc. Change 2018, 131, 240–252. [Google Scholar] [CrossRef]
- Abdel Wahed Ahmed, M.M.; Abd El Monem, N. Sustainable and green transportation for better quality of life case study greater Cairo–Egypt. HBRC J. 2020, 16, 17–37. [Google Scholar] [CrossRef]
- Bertolini, L.; Le Clercq, F.; Kapoen, L. Sustainable accessibility: A conceptual framework to integrate transport and land use plan-making. Two test-applications in the Netherlands and a reflection on the way forward. Transp. Policy 2005, 12, 207–220. [Google Scholar] [CrossRef]
| No. | Indicator | Previous Studies | |||||||||
|---|---|---|---|---|---|---|---|---|---|---|---|
| [19] | [20] | [21] | [22] | [23] | [24] | [25] | [26] | [27] | [28] | ||
| Health * | |||||||||||
| 1 | Energy consumption—emission gases from vehicles | X | X | X | X | X | X | X | X | X | X |
| 2 | Land use | X | X | X | X | X | X | X | |||
| 3 | Noise pollution | X | X | X | X | X | X | X | X | X | X |
| 4 | Traffic accidents | X | X | X | X | X | |||||
| 5 | Vehicle mile traveled (VMT) | X | X | X | X | ||||||
| 6 | Safety | X | X | X | X | X | X | X | X | ||
| Social Equity * | |||||||||||
| 7 | Opportunities for employment | X | X | X | X | X | |||||
| 8 | Accessibility to amenities | X | X | X | X | X | X | X | X | ||
| 9 | Public participation in transport decisions | X | X | ||||||||
| 10 | Transport for disabled | X | X | ||||||||
| 11 | Traffic congestion—increased travel times | X | X | ||||||||
| No. | Indicator | Previous Studies | |||||||||
| [29] | [30] | [31] | [32] | [33] | [34] | [35] | [36] | [25] | [18] | ||
| Health * | |||||||||||
| 1 | Energy consumption—emission gases from vehicles | X | X | X | X | X | X | X | X | X | X |
| 2 | Land use | X | X | ||||||||
| 3 | Noise pollution | X | X | X | X | X | |||||
| 4 | Traffic accidents | ||||||||||
| 5 | Vehicle mile traveled (VMT) | ||||||||||
| 6 | Safety | X | X | X | X | X | X | ||||
| Social Equity * | |||||||||||
| 7 | Opportunities for employment | X | X | X | X | X | X | ||||
| 8 | Accessibility to amenities | X | X | X | X | X | X | X | X | X | |
| 9 | Public participation in transport decisions | X | X | X | |||||||
| 10 | Transport for disabled | X | X | X | X | X | |||||
| 11 | Traffic congestion—increased travel times | X | X | X | X | X | |||||
| Scope of Study | Context | Method/s | Ref. |
|---|---|---|---|
| Development of Criteria for Evaluating Projects | Isfahan, Iran | MCDM AHP BWM | [33] |
| Oresund region | MDCM CBA | [46] | |
| A case study of Accra, Ghana | MCDM AHP | [48] | |
| Public Transport Systems | A university campus in a metropolitan city of Turkey | IVIF AHP CODAS | [45] |
| A case study of Hyderabad, India | MCDM AHP | [49] | |
| China | Fuzzy AHP | [50] | |
| Analysis of Service Performance | Kerala, India | AHP GP | [51] |
| A case study of São Paulo City, Brazil. | MCDM AHP | [52] | |
| Belfast, Northern Ireland | AHP WPI MANOVA | [53] | |
| Selection of Urban Transportation Alternatives Fuel | China | Fuzzy AHP Fuzzy TOPSIS Fuzzy MADA | [54] |
| Pakistan | MCDM AHP | [55] | |
| Spain | AHP | [29] |
| Expert | Education | Job Title | Years of Experience | Expertise |
|---|---|---|---|---|
| 1 | PhD | Academia | <20 years | Sustainable community planning, land use and environmental planning and urban economic development |
| 2 | PhD | Academia | <20 years | Urban traffic operations and control and public health–transport systems interactions |
| 3 | PhD | Academia | 10–20 years | Spatial planning, urban planning and design, land use and development regulations, and sustainability planning and design. |
| 4 | Master | Industry | 10 years | Transportation, infrastructure, and utilities |
| 5 | Master | Industry | 10–20 years | Managing projects and advising on concepts and strategies to create sustainable developments. |
| 6 | Master | Industry | 10 years | Government communications and international relations. |
| 7 | PhD | Academia | <20 years | Sustainable construction management |
| 8 | Master | Industry | 10–20 years | Transportation, infrastructure, and utilities |
| Importance | Definition | Explanation |
|---|---|---|
| 1 | Equal importance | Two criteria/sub-criteria contribute equally to the level immediately above |
| 3 | Moderate importance | Judgment slightly favors one criterion/sub-criterion over another |
| 5 | Strong importance | Judgment strongly favors one criterion/sub-criterion over another |
| 7 | Very strong importance | One criterion/sub-criterion is favored very strongly over another |
| 9 | Absolute/extreme importance | There is evidence affirming that one criterion/sub-criterion is favored over another |
| 2, 4, 6, 8 | Immediate values between above scale values | Absolute judgment cannot be given, and a compromise is required |
| No. | Indicators Formed by Experts | Mean () | Standard Deviation (s) | Coefficient of Variation (CV) |
|---|---|---|---|---|
| 1 | Energy consumption | 4.75 | 0.50 | 0.11 |
| 2 | Air, noise, and water pollution emissions | 4.75 | 0.50 | 0.11 |
| 3 | Traffic accidents | 4.75 | 0.50 | 0.11 |
| 4 | Vehicle miles traveled (VMT) | 3.25 | 0.50 | 0.15 |
| 5 | Safety | 5.00 | 0.00 | 0.00 |
| 6 | Opportunities for employment | 3.75 | 0.50 | 0.13 |
| 7 | Accessibility to amenities | 4.50 | 0.58 | 0.13 |
| 8 | Public participation in transport decision | 3.50 | 0.58 | 0.16 |
| 9 | Transport for seniors and special needs | 4.25 | 0.50 | 0.12 |
| 10 | Traffic congestion | 4.75 | 0.50 | 0.11 |
| 11 | Respiratory diseases | 5.00 | 0.00 | 0.00 |
| 12 | Transport affordability | 3.50 | 0.58 | 0.16 |
| 13 | Service quality for non-drivers | 2.50 | 0.58 | 0.23 |
| 14 | Physical and mental health | 3.50 | 0.58 | 0.16 |
| 15 | Roadway maintenance | 4.50 | 0.58 | 0.13 |
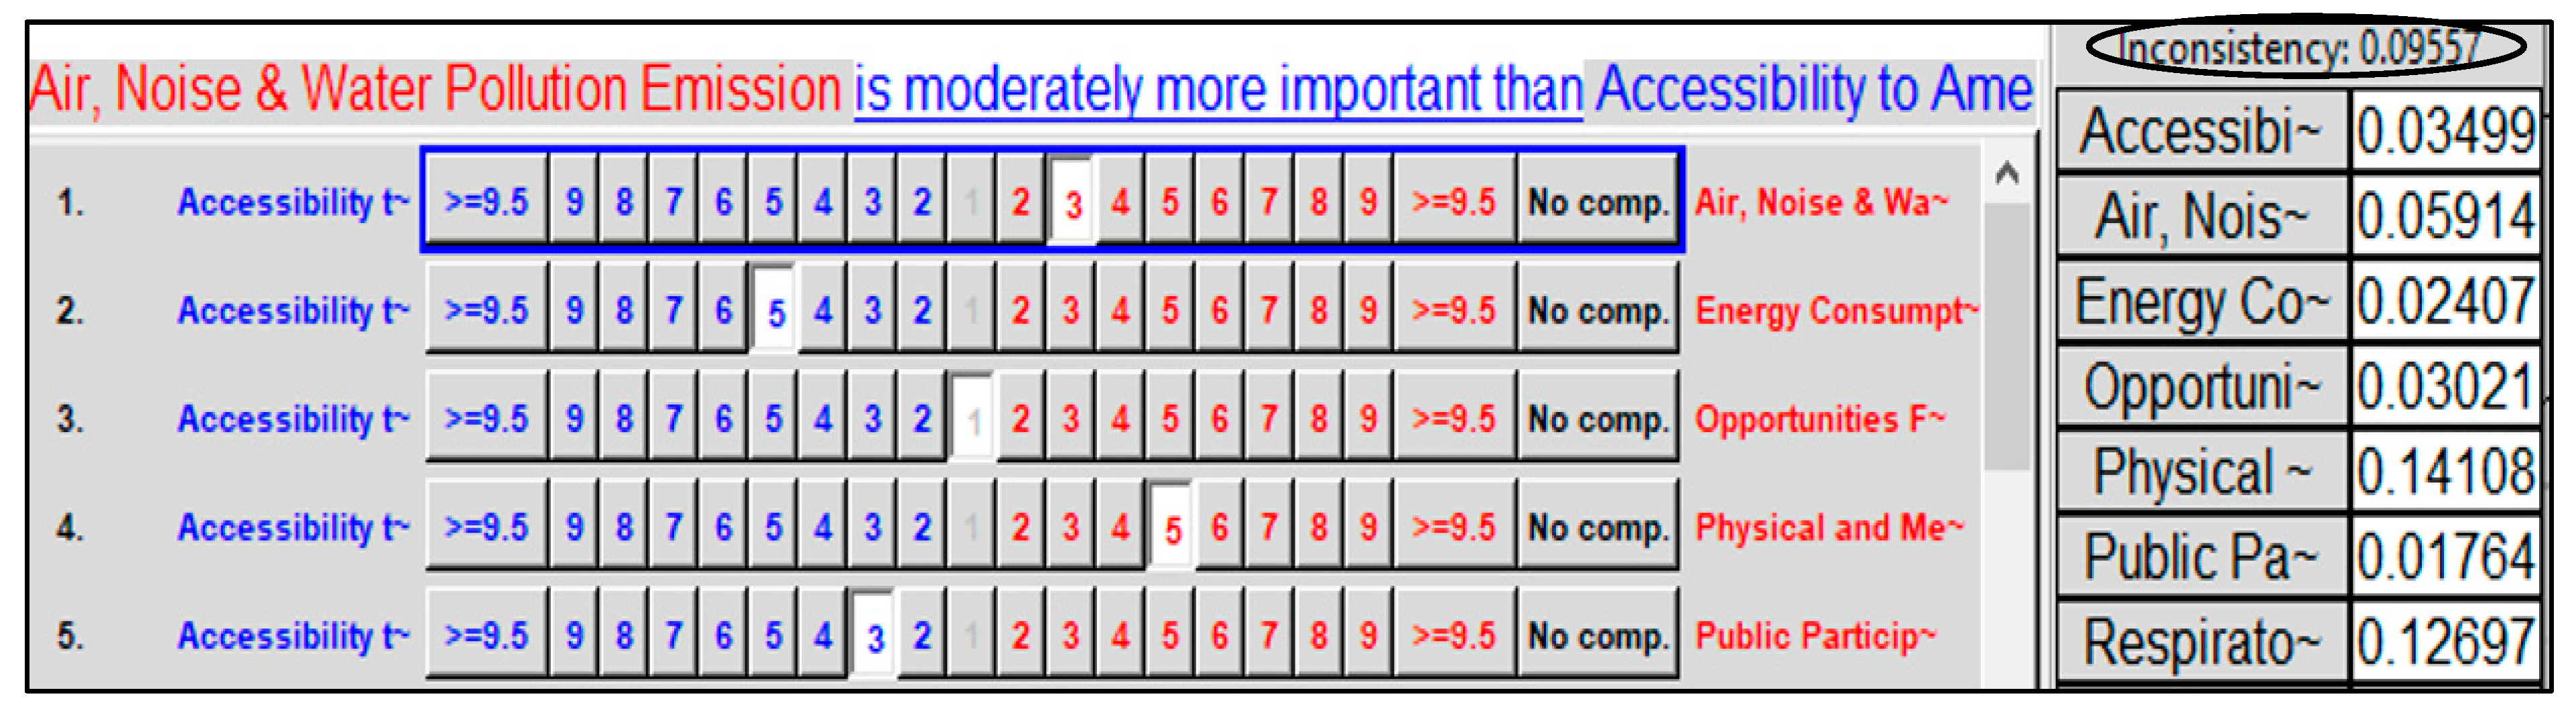
| First Trial Inconsistency | Second Trial Inconsistency |
|---|---|
| 0.13 | 0.096 |
| Energy Consumption | Air, noise and water pollution emissions | Traffic Accidents | Vehicle Miles Travelled (VMT) | Safety | Opportunities for Employment | Accessibility to Amenities | Public participation in transport decision | Transport for seniors and special needs | Traffic Congestion | Respiratory diseases | Transport affordability | Service quality for non- drivers | Physical and mental health | Roadway maintenance | |
|---|---|---|---|---|---|---|---|---|---|---|---|---|---|---|---|
| Energy consumption | 0.01205 | 0.01205 | 0.01205 | 0.01205 | 0.01205 | 0.01205 | 0.01205 | 0.01205 | 0.01205 | 0.01205 | 0.01205 | 0.01205 | 0.01205 | 0.01205 | 0.01205 |
| Air, noise, and water Pollution emissions | 0.02951 | 0.02951 | 0.02951 | 0.02951 | 0.02951 | 0.02951 | 0.02951 | 0.02951 | 0.02951 | 0.02951 | 0.02951 | 0.02951 | 0.02951 | 0.02951 | 0.02951 |
| Traffic accidents | 0.08110 | 0.08110 | 0.08110 | 0.08110 | 0.08110 | 0.08110 | 0.08110 | 0.08110 | 0.08110 | 0.08110 | 0.08110 | 0.08110 | 0.08110 | 0.08110 | 0.08110 |
| Vehicle miles travelled (VMT) | 0.00501 | 0.00501 | 0.00501 | 0.00501 | 0.00501 | 0.00501 | 0.00501 | 0.00501 | 0.00501 | 0.00501 | 0.00501 | 0.00501 | 0.00501 | 0.00501 | 0.00501 |
| Safety | 0.09296 | 0.09296 | 0.09296 | 0.09296 | 0.09296 | 0.09296 | 0.09296 | 0.09296 | 0.09296 | 0.09296 | 0.09296 | 0.09296 | 0.09296 | 0.09296 | 0.09296 |
| Opportunities for employment | 0.01512 | 0.01512 | 0.01512 | 0.01512 | 0.01512 | 0.01512 | 0.01512 | 0.01512 | 0.01512 | 0.01512 | 0.01512 | 0.01512 | 0.01512 | 0.01512 | 0.01512 |
| Accessibility to amenities | 0.01753 | 0.01753 | 0.01753 | 0.01753 | 0.01753 | 0.01753 | 0.01753 | 0.01753 | 0.01753 | 0.01753 | 0.01753 | 0.01753 | 0.01753 | 0.01753 | 0.01753 |
| Public participation in transport decisions | 0.00882 | 0.00882 | 0.00882 | 0.00882 | 0.00882 | 0.00882 | 0.00882 | 0.00882 | 0.00882 | 0.00882 | 0.00882 | 0.00882 | 0.00882 | 0.00882 | 0.00882 |
| Transport for seniors and special needs | 0.03355 | 0.03355 | 0.03355 | 0.03355 | 0.03355 | 0.03355 | 0.03355 | 0.03355 | 0.03355 | 0.03355 | 0.03355 | 0.03355 | 0.03355 | 0.03355 | 0.03355 |
| Traffic congestion | 0.01434 | 0.01434 | 0.01434 | 0.01434 | 0.01434 | 0.01434 | 0.01434 | 0.01434 | 0.01434 | 0.01434 | 0.01434 | 0.01434 | 0.01434 | 0.01434 | 0.01434 |
| Respiratory diseases | 0.06351 | 0.06351 | 0.06351 | 0.06351 | 0.06351 | 0.06351 | 0.06351 | 0.06351 | 0.06351 | 0.06351 | 0.06351 | 0.06351 | 0.06351 | 0.06351 | 0.06351 |
| Transport affordability | 0.01311 | 0.01311 | 0.01311 | 0.01311 | 0.01311 | 0.01311 | 0.01311 | 0.01311 | 0.01311 | 0.01311 | 0.01311 | 0.01311 | 0.01311 | 0.01311 | 0.01311 |
| Service quality for non-drivers | 0.01354 | 0.01354 | 0.01354 | 0.01354 | 0.01354 | 0.01354 | 0.01354 | 0.01354 | 0.01354 | 0.01354 | 0.01354 | 0.01354 | 0.01354 | 0.01354 | 0.01354 |
| Physical and mental health | 0.07060 | 0.07060 | 0.07060 | 0.07060 | 0.07060 | 0.07060 | 0.07060 | 0.07060 | 0.07060 | 0.07060 | 0.07060 | 0.07060 | 0.07060 | 0.07060 | 0.07060 |
| Roadway maintenance | 0.02913 | 0.02913 | 0.02913 | 0.02913 | 0.02913 | 0.02913 | 0.02913 | 0.02913 | 0.02913 | 0.02913 | 0.02913 | 0.02913 | 0.02913 | 0.02913 | 0.02913 |
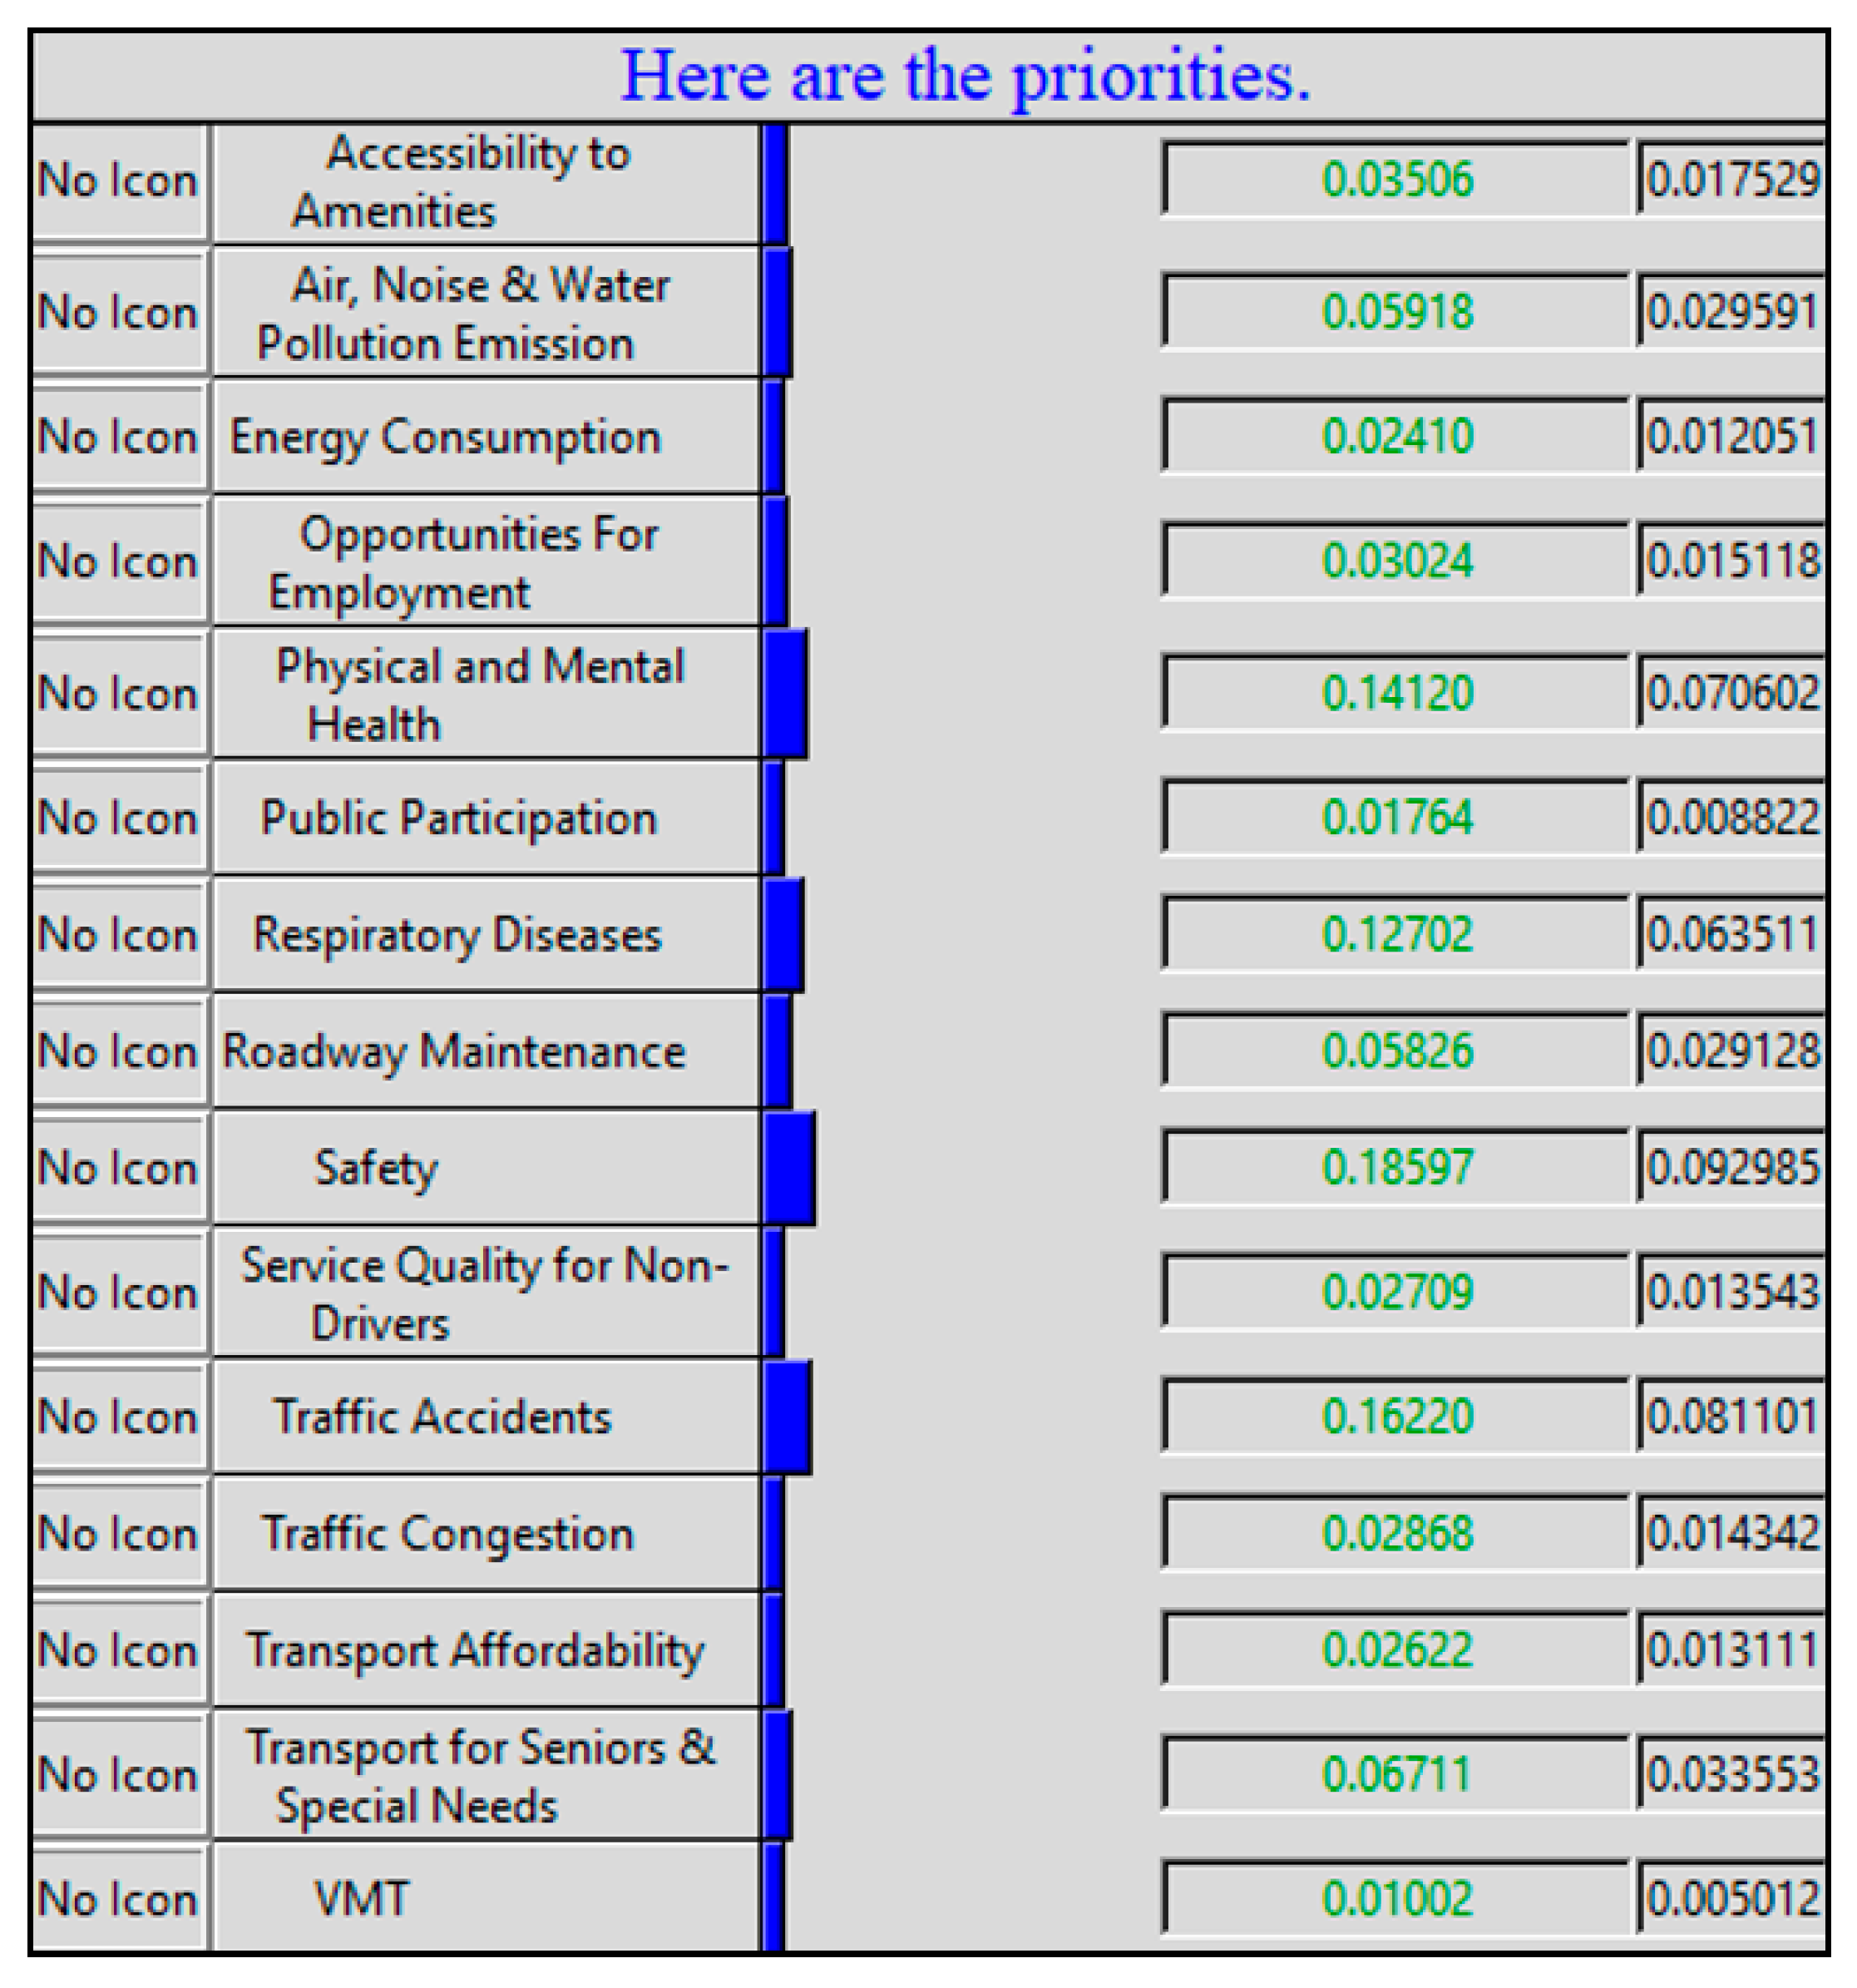
| Indicator Ranking | Indicator | Indicator Priority |
|---|---|---|
| #1 | Safety | 0.0930 |
| #2 | Traffic accidents | 0.0811 |
| #3 | Physical and mental health | 0.0831 |
| #4 | Respiratory diseases | 0.0706 |
| #5 | Transport for seniors and special needs | 0.0336 |
| #6 | Air, noise, and water pollution emissions | 0.0296 |
| #7 | Roadway maintenance | 0.0291 |
| #8 | Accessibility to amenities | 0.0175 |
| #9 | Opportunities for employment | 0.0151 |
| #10 | Traffic congestion | 0.0143 |
| #11 | Service quality for non-drivers | 0.0135 |
| #12 | Transport affordability | 0.0131 |
| #13 | Energy consumption | 0.0121 |
| #14 | Public participation in transport decisions | 0.0088 |
| #15 | Vehicle miles traveled (VMT) | 0.0050 |
Disclaimer/Publisher’s Note: The statements, opinions and data contained in all publications are solely those of the individual author(s) and contributor(s) and not of MDPI and/or the editor(s). MDPI and/or the editor(s) disclaim responsibility for any injury to people or property resulting from any ideas, methods, instructions or products referred to in the content. |
© 2023 by the authors. Licensee MDPI, Basel, Switzerland. This article is an open access article distributed under the terms and conditions of the Creative Commons Attribution (CC BY) license (https://creativecommons.org/licenses/by/4.0/).
Share and Cite
Almashhour, R.; AlQahtani, M.; Ndiaye, M. Highway Transportation, Health, and Social Equity: A Delphi-ANP Approach to Sustainable Transport Planning. Sustainability 2023, 15, 16084. https://doi.org/10.3390/su152216084
Almashhour R, AlQahtani M, Ndiaye M. Highway Transportation, Health, and Social Equity: A Delphi-ANP Approach to Sustainable Transport Planning. Sustainability. 2023; 15(22):16084. https://doi.org/10.3390/su152216084
Chicago/Turabian StyleAlmashhour, Raghad, Mohamed AlQahtani, and Malick Ndiaye. 2023. "Highway Transportation, Health, and Social Equity: A Delphi-ANP Approach to Sustainable Transport Planning" Sustainability 15, no. 22: 16084. https://doi.org/10.3390/su152216084
APA StyleAlmashhour, R., AlQahtani, M., & Ndiaye, M. (2023). Highway Transportation, Health, and Social Equity: A Delphi-ANP Approach to Sustainable Transport Planning. Sustainability, 15(22), 16084. https://doi.org/10.3390/su152216084