Abstract
Digital finance (DF) is the engine driving financial inclusion worldwide, but the current uneven development of DF across regions would hinder this process. Based on cross-sectional data from 288 prefecture-level cities for the representative years 2011, 2014, 2017, and 2020, this paper uses geographic detector methods, social network analysis, and geographical and temporal weighted regression (GTWR) to explore the key drivers of urban DF, revealing and forecasting the DF network structural evolution and its driving mechanism. The results show that (1) economic level, traditional financial level, internet popularity, innovation level, and government intervention are the key drivers of DF development. (2) During the decade, the proportion of high-intensity urban interconnections increased from 3.3% to 12.3%. Most cities are at a low level of intensity, showing a polarization trend. (3) The cities with high betweenness centrality are concentrated in the megacities and the number is stable at 5. The structure of network communities is relatively stable, with the number reduced to 10. Cities with the greatest possibility of connection are located in the Pearl River Delta (PRD) and the Yangtze River Delta (YRD), accounting for 60% of the total. (4) The drivers of DF development present significant spatial heterogeneity over time. The traditional financial level shows a positive and continuous promoting effect, while government intervention plays a negative role.
1. Introduction
Since 2010, the G20 has been committed to improving financial inclusion in developing countries and emerging economies to reduce poverty [1]. They advocate for expanding the coverage and penetration of financial services such as payments, transfers, savings, credit, securities, and insurance through digital technologies, and these scenarios are collectively referred to as digital finance. DF could make up for the shortcomings of traditional banking systems and provide access to financial products and services to a wider range of people. The Global Findex Database 2021, published by the World Bank, suggests that 24% of adults worldwide are still excluded from the traditional financial system, showing that the popularization and development of digital finance still need to be improved. Taking China as an example, the country’s digital financial undertakings have passed the era of savage growth and entered a new stage of expansion in both breadth and depth. Vast territory and differentiation in regional resource endowments have led to uneven levels of DF development in China. Figuring out the driving forces of this development gap and analyzing the spatial interconnection between cities can help to achieve financially inclusive growth and provide lessons learnt for developing countries.
DF originated in the study of inclusive finance, which refers to providing financial services to all social classes and groups with financial needs in an affordable way [2]. With the boom of digital information technology, financial inclusion has ushered in a revolutionary opportunity. The concept of DF inclusion, which refers to all actions to promote financial inclusion through the use of DF services, was first introduced at the G20 Summit in 2016 and has attracted extensive attention in academic circles [3]. Scholars would naturally focus on the inclusive growth of DF due to its stronger accessibility compared to the traditional banking system, and they have been relatively consistent in finding positive effects. Some point out that DF complements traditional finance, leading to greater financial inclusion [4,5]. For instance, as a typical product of digital financial innovation, P2P lending improves the availability of credit [6,7]. With the deepening of related research, extensive studies have been conducted on the boosting effects of DF. Due to its low cost and wide coverage, DF plays a positive role in several aspects of social production and life, such as manufacturing upgrading, financial efficiency, carbon emission reduction, green innovation, entrepreneurial probability, and household consumption [8,9,10,11,12,13]. In addition, the spatial effects of DF draw scholars’ concern. For instance, DF can efficiently push the upgrading of local industrial structures, but the surrounding areas would suffer as a result [14]. In terms of green development, the boosting effect of DF is characterized by temporary and spatial spillover [15]. When it comes to the high quality of economic growth among cities, the contribution of DF demonstrates a downward trend across the years [16]. In addition, DF’s impact on rural areas is greatest in the middle and eastern seaboard cities, decreasing to the northeast and southwest [17]. However, what scholars have missed is that DF has its own laws of development, and the forces and mechanisms that drive the industry remain to be explored.
Although DF breaks the geographical and spatial restrictions and provides the possibility of inter-regional flow of resources [18], the characteristics of centralization and agglomeration have indeed not changed [19]. The imbalance of DF development is also becoming more pronounced. In China, the eastern provinces have all reached medium and above levels, with strong agglomeration effects and no obvious hierarchical differences, while the central region has the most unbalanced development [20,21]. However, an unbalanced network has an amplification mechanism and is more vulnerable to external shocks [22]. Financial crises have taught us that we live in an interconnected world, and no financial system is exempted [23]. Since classical economic theories are unable to explain and even predict the collapse of the financial system, scholars have gradually begun to utilize the idea of complexity to explain financial issues. Concepts such as networks, centrality, contagion, and resilience are attracting increasing attention [24]. Transforming the financial system into a network is essential for investigating the relationship among the members [25]. Nowadays, financial networks are becoming increasingly complex; during the period of COVID-19, financial markets tend to be more connected [26]. In addition, emerging markets are becoming key nodes in the G20 financial network [27]. Characteristic analysis is the focus of network research. In identifying and predicting contagion within financial networks, the approach of studying interconnection and centrality is pretty effective [28]. Markose et al. [29] reconstructed the CDS network and found that financial risk is highly concentrated in firms that take the lead in terms of network centrality and connectivity. Chinazzi et al. [30] find that being central in the financial network makes those emerging economies more vulnerable in a crisis. The central position could also lead to positive feedback, such as higher urban economic growth [31]. The gravity model has long been widely used in network research [32]. The gravitation of the urban system determines the extension direction of the urban network [33]. By establishing a modified gravity model, Chen et al. [34] found that there are no bidirectional spillovers in digital financial networks and the connections between various parts are loose. In the coupling coordination network of DF and technological innovation, the inflow segment is mainly located in the less developed regions in the southwest, while the outflow segment and the bidirectional spillover segment are located in the eastern developed regions [35]. In addition, Zhao et al. [20] point out that cities that are lagging behind in development are more likely to fall into an attraction–attraction relationship. The general conclusion of the gravity model is that geography matters. When it comes to DF interconnections between cities, it seems that geographic location should be less of an issue as digital technologies have broken down spatial constraints. But is this really the case? This paper argues that it remains uncertain.
The existing studies mainly focused on the DF’s developmental effects, and little attention has been paid to its driving forces and mechanism. In addition, there is a lack of discussion on the spatiotemporal evolution of urban DF, particularly those that focus on interconnections between cities. In response to the above two limitations, this paper utilizes geographic detectors to explore the key drivers that affect DF development instead of subjective decisions and establishes a comprehensive index of DF development. After that, the gravity model was applied to construct an urban DF network, and its evolutionary characteristics were portrayed and predicted. Finally, the GTWR method was used to analyze changes in the influence of key drivers across both temporal and geographic dimensions. Our work contributes to helping bridge the DF development gap between cities as well as achieving financial inclusion.
This study is organized as follows. Section 1 includes the background and literature review. Section 2 briefly describes the data and methods. Section 3 presents empirical results and analysis. Section 4 reveals the discussions and limitations. Finally, Section 5 provides conclusions and implications.
2. Data and Methods
2.1. Data Source and Index System
2.1.1. Data Source
On the one hand, this study takes into account the rapid development of DF in the last 10 years. On the other hand, due to the large lack of data before 2011, time sections of 2011, 2014, 2017, and 2020 are selected as representative years. In view of the changes in regional administrative divisions and data availability, 288 prefecture-level cities and above were selected as research units. The data in our work are mainly included in the 2011–2020 China City Statistical Yearbook and the bulletin of each regional government, and the data on the level of DF inclusion are from the China Digital Financial Inclusion Index measured by the Peking University in cooperation with Ant Financial Services (https://tech.antfin.com/research/data, accessed on 8 August 2022). The individual missing values were filled in by linear interpolation.
2.1.2. Index System
Considering the availability of data and drawing on relevant studies, this paper considers that the main dimensions affecting the comprehensive level of urban DF are inclusive level, economic quality, city scale, and development potential (Table 1). Among them, the inclusive level is represented by the Digital Financial Inclusion Index.

Table 1.
Possible driving factors of DF.
(1) The quality of urban economy, which is mainly measured by four sub-factors. The first one is the economic level; it has a profound impact on the prosperity of regional DF, and we chose the per capita GDP to represent it. The second factor is industrial structure, which tends to show the transfer of the primary to the secondary and the tertiary industry, and the proportion of the service industry will rise, thus affecting the development trend of DF. We selected the ratio of the added value of the tertiary industry to GDP to express it. The next is the traditional financial level; traditional financial services have a profound impact on the DF and act as the basic support strength. We use the per capita loan amount to express the development level. The last one is the opening-up level. The continuous inflow and use of foreign capital can not only bring direct capital support to regional economic growth but also affect the development of DF through various ways, such as knowledge spillovers, advanced technologies, and management concepts. This paper adopts the actual utilization of foreign capital to represent this index.
(2) The measurement factors of city scale are as follows. Demographic factors are one of the main drivers, which will naturally have a long-term effect on the DF. We apply the end of year’s population. Internet popularity reflects the cities’ digitalization and plays a cornerstone role in the DF. The number of Internet users is used for measurement.
(3) Measurement of development potential includes some sub-factors. Innovation level, which affects both the digital technology and financial industry, is represented by the number of patents granted. Education level reflects the quality of the urban population and then affects the popularity of DF; thus, students in colleges and middle schools are used to express this index. Government intervention plays a prominent role in solving urban development problems, and the DF industry cannot develop without government support; therefore, government fiscal expenditure/GDP is applied.
2.2. Research Methods
2.2.1. Geographic Detector
In previous studies, it is not rigorous and objective to directly introduce urban GDP, total population, and another index into the gravity model [21,34,47]. Therefore, this paper hopes to explore the macro factors that are strongly correlated with urban DF. Due to the natural inclusiveness of DF, the comprehensive level of urban DF should match its inclusive level, which means that the two should have similar spatial distribution. Geographic detectors can effectively detect the driving forces of variables [48]. We use a factor detector to measure the degree of explanatory power driving the DF. The detection result is represented by a q value, ranging from [0, 1]. The greater the q value, the more powerful the explanatory power of driver X. The formula is as follows:
where h = 1, 2, 3…, L means partition of the explained variable Y and drivers X, Nh means the partition h, and N means the number of units of partition h. mean the variance of Y in the partition h and the overall partition, respectively.
2.2.2. Modified Gravity Model
It is the basis of SNA to construct an urban digital financial connection strength matrix by gravity model. Urban population and regional GDP in the traditional gravity model can hardly fully reflect the comprehensive level of urban DF. In addition, China’s Digital Financial Inclusion Index is mainly from Alipay users. This index can reflect the DF development at the micro level, but the data come from only one digital financial institution. Therefore, this paper revises the gravity model based on the DF comprehensive level and the empirical coefficient. The revision process is as follows:
(1) Construct a comprehensive index of DF level. Owing to the differences in resource endowment, government preference, and economic quality of each city, there is a huge gap between urban development, which cannot be measured by a single index. In this paper, stronger explanatory factors are screened by the geographic detector, and the comprehensive index system is established from four aspects which are inclusive level, economic quality, city scale, and development potential based on the macro and micro perspectives. The overall index system can accurately reflect the comprehensive level of urban DF, which can make up for the defects of the original model.
(2) Calculate the comprehensive level score. Principal component analysis (PCA) is to replace the original indicators with a new set of linearly independent composite indicators with the help of orthogonal transformation and to reflect the original information as much as possible. Considering the feasibility of PCA, this paper uses SPSS to conduct Bartlett’s sphericity test and KMO test. Then, the eigenvalue and the degrees of factors’ variance contribution are calculated. Retain the public factors with eigenvalues reaching 1 and cumulative variance contribution rates above 70% to obtain the original score of DF comprehensive level . Since has positive and negative values, this paper adjusts to (0, 1000) to obtain the modified values :
(3) Modify the gravity coefficient . Cities with higher levels of DF tend to occupy a more dominant position in city associations. In this paper, we denote by the contribution of city i in the digital financial connection between cities i and j.
(4) Based on the above modification scheme to the original model, the formula of the modified one is as follows:
where means the intensity of DF interconnection between cities i and j. is the modified gravity coefficient. are the urban DF comprehensive level scores. means the geographical distance matrix.
2.2.3. Social Network Analysis
The SNA is helpful in studying the urban spatial network. The strength matrix of urban DF connection derived from the gravity model is the basis of this part. With the help of Gephi and ArcGis, this paper makes a visual analysis of the betweenness centrality and community structure:
(1) Betweenness centrality. The node at the center of the network has the advantage of information and control over resources. In a network, a node can be considered to be in a significant position if it is on the path between many other two points because it could control the interactions between another two nodes. Betweenness centrality could well measure this ability of a node as a controller, and the formula is as follows:
where means the betweenness centrality and means shortest paths’ number from city j to k that generate a connection.
(2) Community structure. The evolution of the community structure helps to analyze the closeness of the internal substructure and the intensity of interaction between nodes. Newman [49] proposes a model to investigate the network community based on modularity optimization, which showed advantages in both computation time and community quality. The formula is as follows:
where means the weight of the edge between nodes i and j. is the sum of the edge weights attached to node i, and is the community to which node i belongs. Function equals 1 if u = v, if not equals 0.
(3) Connection forecasting. Development direction measurement can provide guidance for the construction of future networks. Among the complex methods, link forecasting is mainly studying the complementation of missing information and structure changes in the network. It focuses on forecasting the missing edges and the future link formation; therefore, it can be well used for the measurement of the possibility of connection between nodes. This paper uses the two common metrics for link prediction to measure.
The first metric is assigned to the CN index, which focuses on structural similarity by investigating node-local information. The principle is that the more common neighbors two nodes share, the more similar those two nodes are, with a higher possibility of new interconnection between them. The formula is as follows:
The second one is RA. This metric counts the number of resources received by a node. The calculated value reveals the node’s similarity. Before calculation, we assume that the node’s resources are evenly distributed among the neighbors. Below is the formula:
2.2.4. Geographically and Temporally Weighted Regression
The inclusion of the temporal dimension in spatial analysis has generated extensive research interest [50]. The GTWR model could well investigate the local effects of explanatory variables in both geographic and temporal dimensions, with parameter values varying with the geographic and temporal change, which in turn can reflect the spatiotemporal heterogeneity of explanatory variables on the explained variables. Below is the formula:
where represents the value of sample i, and represents the spatiotemporal coordinates of sample i. means regression coefficient, means the value of variable k, and the represents residual. means variable k’s regression parameter. We adopted the AICc law and adaptive bandwidth in the model.
3. Analysis of Urban Digital Financial Network
3.1. Five Core Drivers Are Detected
Urban digital financial level is subject to the combined effect of multiple factors. In this section, the inclusive level is used as the explanatory variable, and the explanatory power is detected for a total of nine indicators in three dimensions: economic quality, city scale, and development potential, and the following q values are obtained (Table 2). All indicators passed the 1% significance test at four years.
Table 2.
Factor detection results.
In the dimension of economic quality, the q value of economic level increases steadily and occupies the highest level among all factors, reflecting its most significant influence on the DF. The q value of industrial structure is at a low level in all four years, indicating that its influence is less significant. The q value of the traditional finance level is also maintained generally at a high level, and its influence on DF is trending upward. Although the q value of the opening-up level is generally not low, its influence is gradually weakening, probably because foreign capital is not overly involved in the DF industry.
In the dimension of city scale, although the q value of demographic information shows an overall growth trend, it maintains at a very low level, probably due to the fact that cities with large populations do not necessarily have a hardware and software foundation for DF development. This indicates its weak influence on the DF and corroborates that the introduction of the population directly into the gravity model in previous studies lacks basis and is not rigorous enough and also proves the necessity and rationality of factor detection in this paper. The q value of internet popularity increased significantly and eventually reached a high level from 2014 to 2020, indicating that its influence is increasing.
In the dimension of development potential, the q values of innovation level and government intervention not only show an upward trend but also have a high overall level. The education level q value is always maintained at a low level, indicating a low level of influence.
The driving factors affecting the urban DF vary under different years. However, in general, economic level, traditional financial level, Internet popularity, innovation level, and government intervention have a consistent and stronger explanatory power compared to other factors, indicating that they have a stronger impact on the DF.
3.2. Evolution of Urban Digital Financial Network
3.2.1. Connection Intensity Is at a Low Level, Showing a Multi-Polar Trend
Based on the results of the geographic detector, we construct the DF comprehensive index system (see Table 3). Before conducting PCA, the data passed the Bartlett’s sphericity test and KMO test, and the results were 0.686 and 0.000, respectively. After the modified gravity modeling calculations, the matrix of DF connection intensity between cities for four years was obtained and visualized (Figure 1).
Table 3.
Final index system of DF comprehensive level.
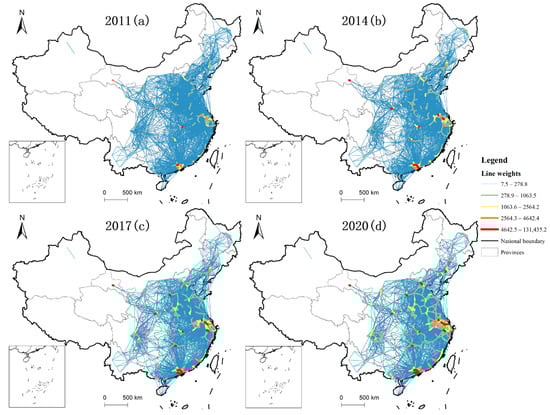
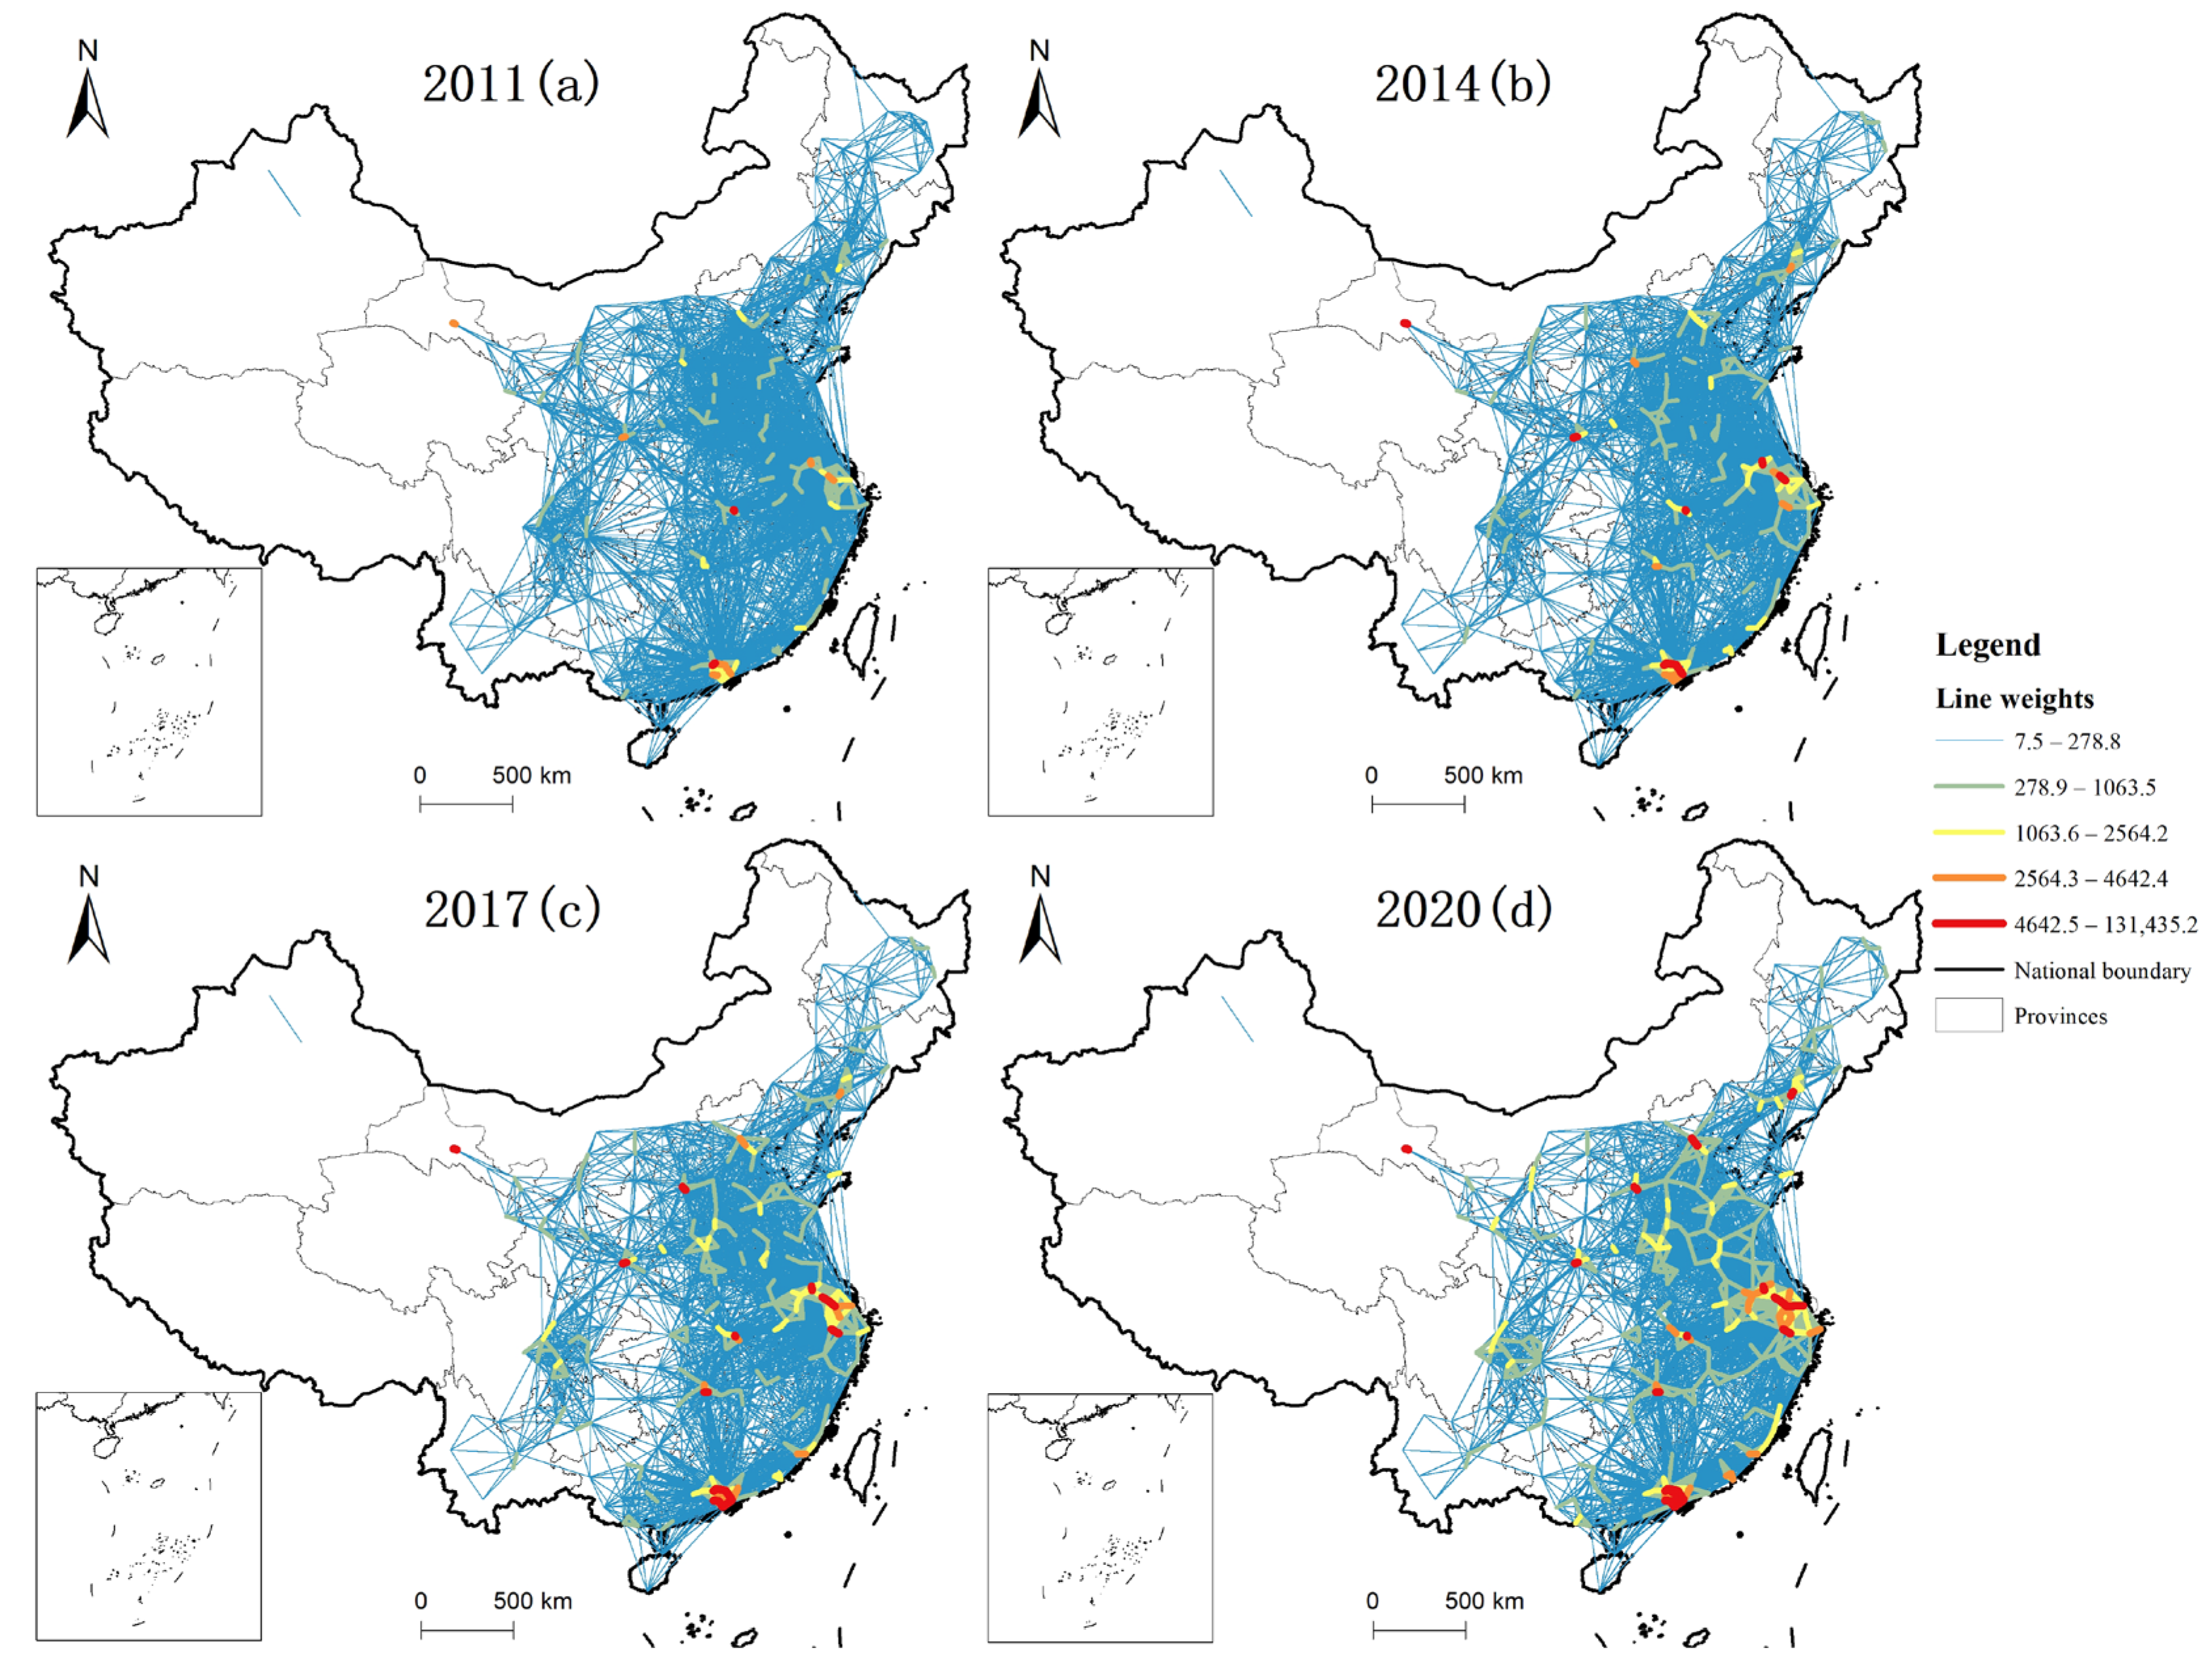
Figure 1.
Connection intensity of urban DF in 2011 (a), 2014 (b), 2017 (c), and 2020 (d).
As shown in the figure, the DF connection intensity of most cities in China is at a low level and exhibits a significant multi-polar trend, but the overall level of the connection intensity has increased significantly and the growth rate is considerable. In 2011, 2014, 2017, and 2020, the number of cities with a weak association accounted for 96.7%, 94.4%, 92.2% and 88.7%, respectively. Although the overall number shows a downward trend, the fact of weak connection between most cities does not change. As can be seen from the figure, the Hangzhou–Shanghai–Suzhou area and the Guangdong province with Shenzhen as the core have formed two dense and huge networks. Beijing is the core city of the northern region network, while Wuhan is in central China. However, the network in western China remains sparse, densely connected areas concentrated in developed provincial capitals such as Xi’an, Chongqing, Chengdu, and Guiyang, but the intensity of their interconnections with surrounding cities is currently at a low level. The network evolution in the northeast is similar to that in the west, with few high-intensity connection belts visible, and only Shenyang maintaining strong ties with neighboring cities. The growth rate of the total intensity of urban digital financial connections is 68.8%, 48.6%, and 42.8% from 2011 to 2014, 2014 to 2017, and 2017 to 2020, respectively. DF has been booming during this decade, and the growth rate is showing a downtrend but is still at a high level. This result is also in line with the reality. With the widespread popularity of online payment such as Alipay and digital technologies such as QR codes around 2010, DF ushered in explosive growth. However, the slowing down of growth rate in recent years indicates that with the maturity of the DF market, the industry is transitioning from high-speed growth to a normal growth stage.
3.2.2. Cities with Higher Betweenness Centrality Are Concentrated in the Megacities
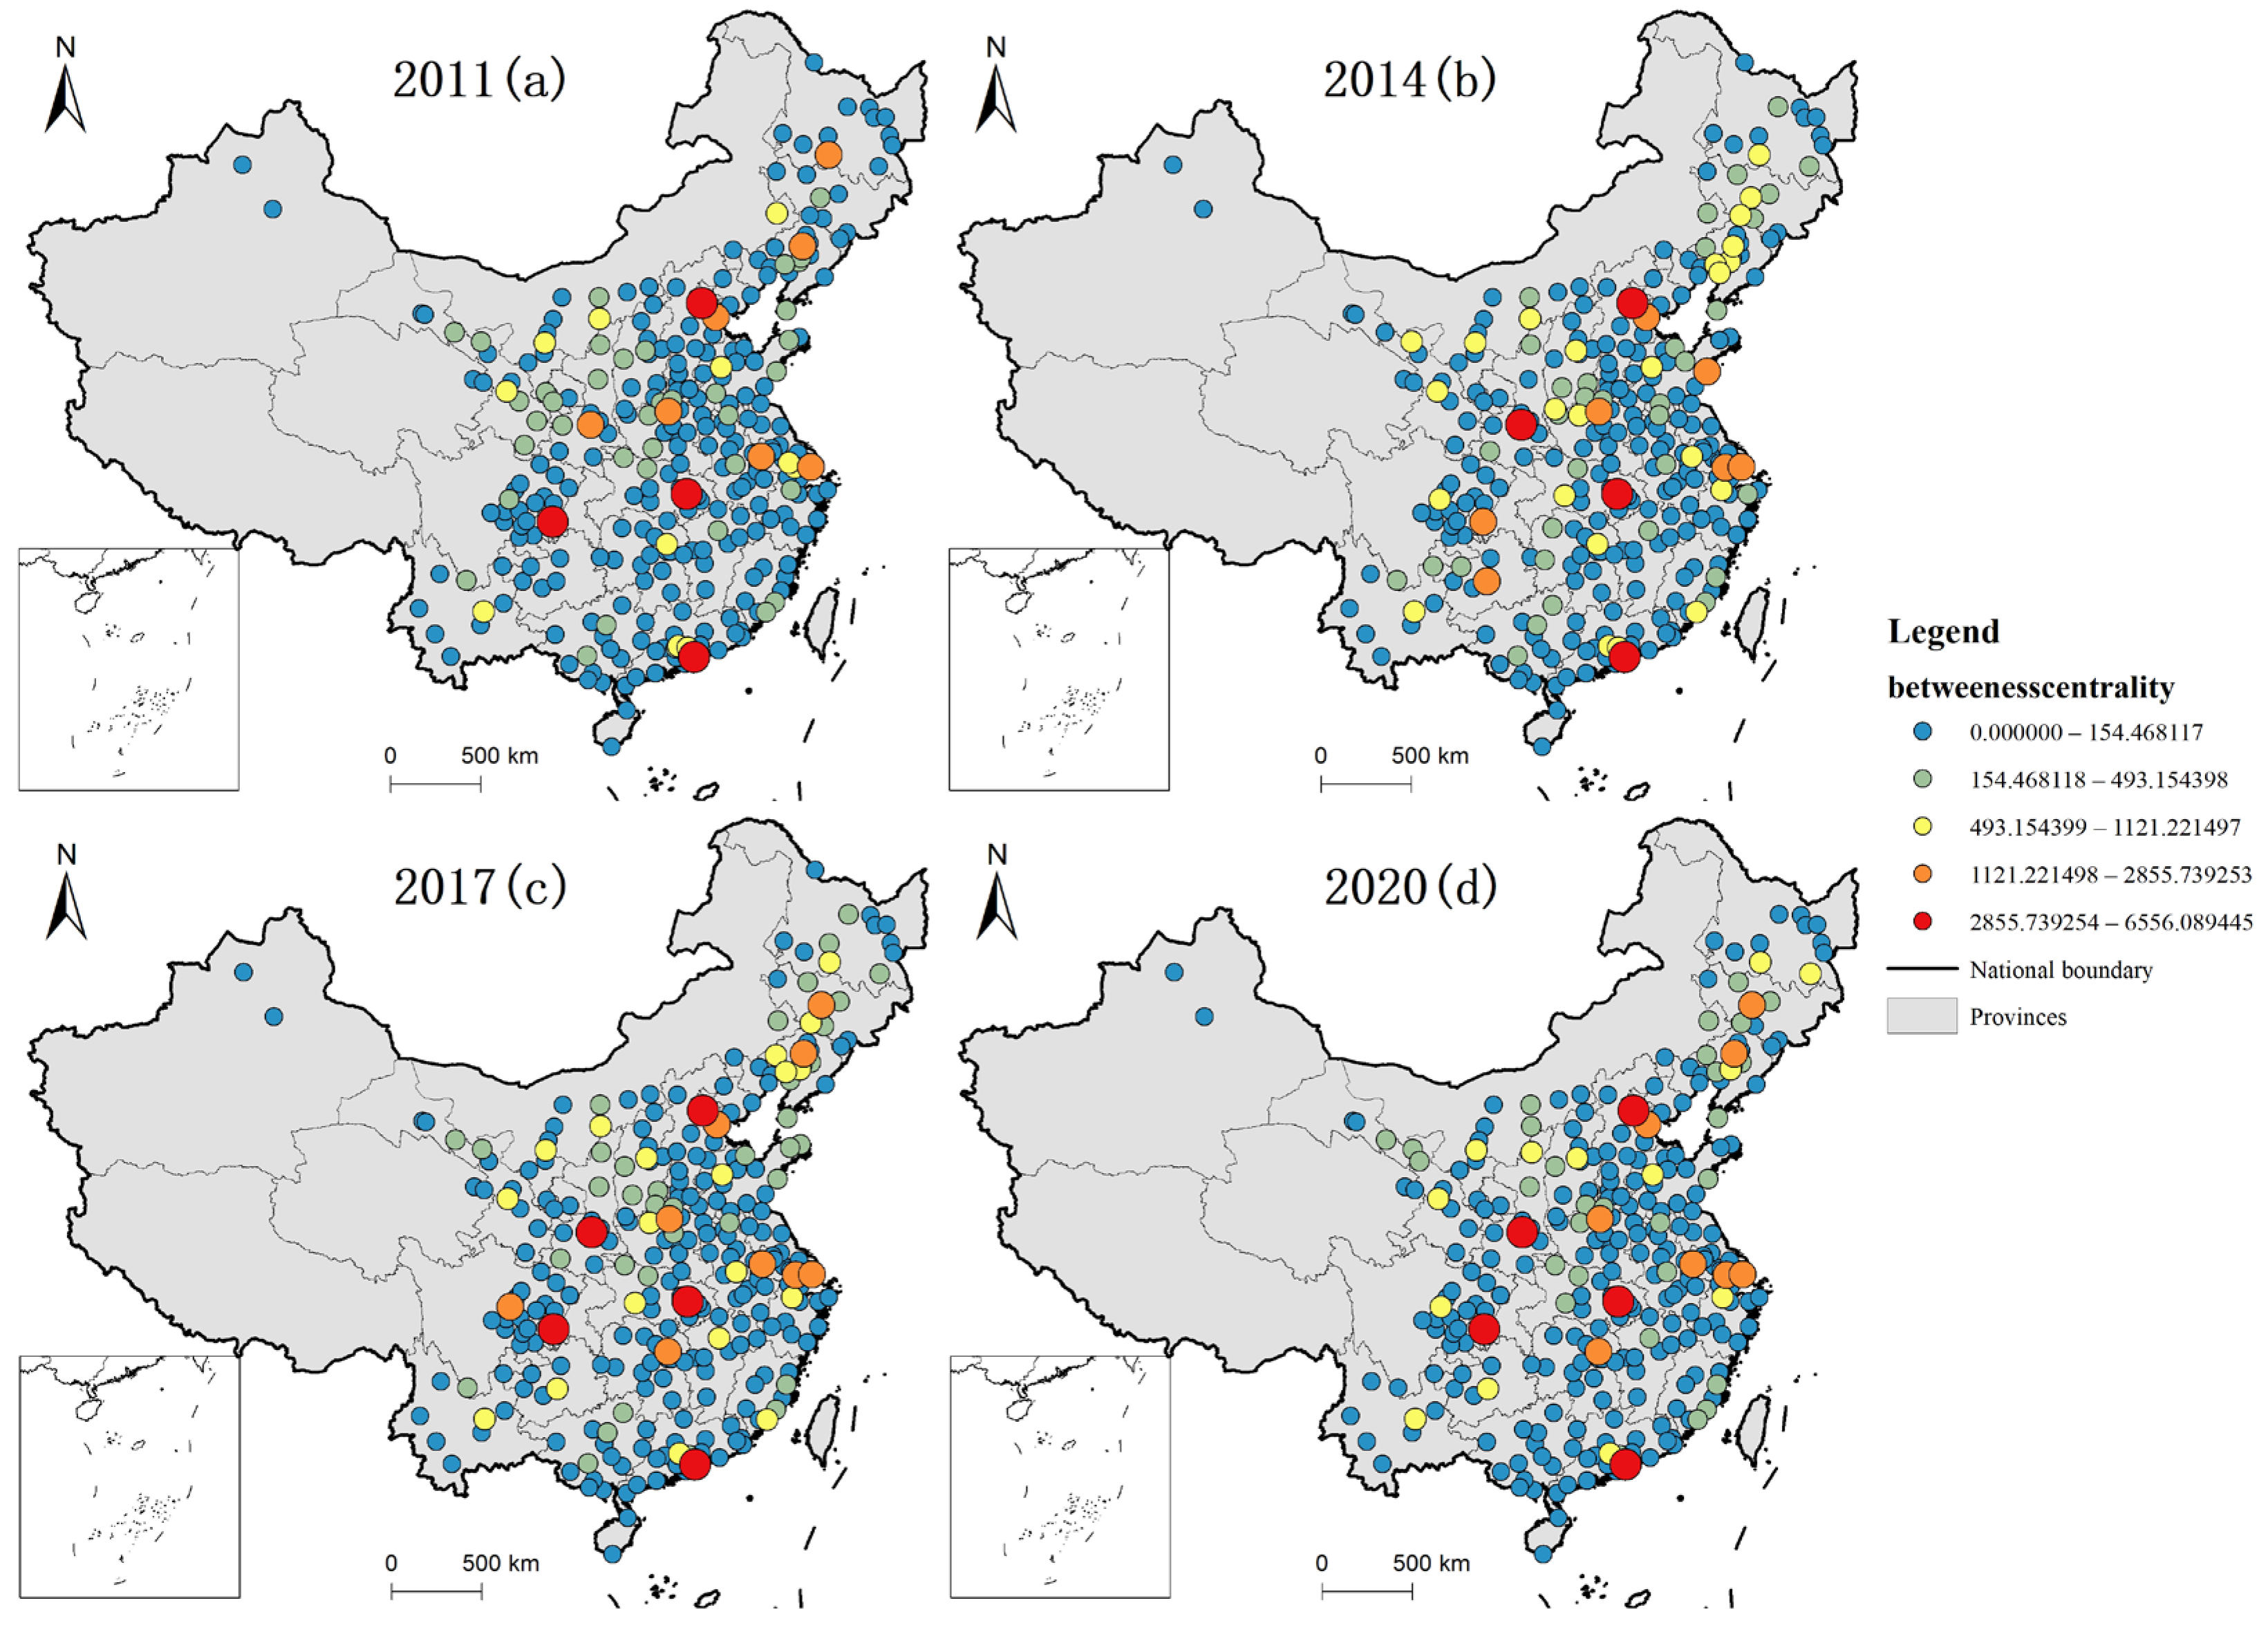
In a social network, if a node plays an important role in mediating information, it occupies a rela–tively central position; if the node no longer transmits information, or if it does not exist in the network, then the information transmission will be interrupted or forced to travel a long way. In general, cities with a high degree of betweenness centrality are mainly concentrated in the megacities of various regions, and all of them have maintained a high intermediary status for a long time (Figure 2). The first echelon (red part) includes Beijing, Shenzhen, Wuhan, Chongqing, and Xi’an, while the second echelon (orange part) includes Shanghai, Suzhou, Nanjing, Changsha, Zhengzhou, Tianjin, and Shenyang.
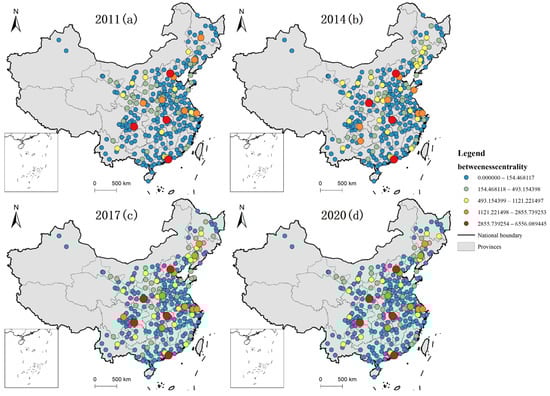
Figure 2.
Betweenness centrality of each city in the DF network in 2011 (a), 2014 (b), 2017 (c), and 2020 (d).
It has formed a pattern with Beijing as the main intermediary city in the north, Xi’an and Chongqing in the southwest, Wuhan in middle China, and Shanghai and Shenzhen in the east coast region. In addition, some medium-level cities (yellow part) are degrading to lower levels, while the number of high-level cities (orange and red part) is stable. This means that high-level cities have always maintained a higher degree of control over digital resources, and there is a trend of further strengthening from the numerical perspective, which reflects the Matthew effect to some extent. This brings us to the essence of DF that digital technologies have facilitated the backward regions due to their detachment from geographical boundaries and near-zero marginal costs, allowing residents in different regions to share digital inclusion. However, fair opportunities do not mean fair results, the final development status of different regions still depends on various hardware and software conditions of local support for digital financial services.
3.2.3. Community Structure Shows a Stable State
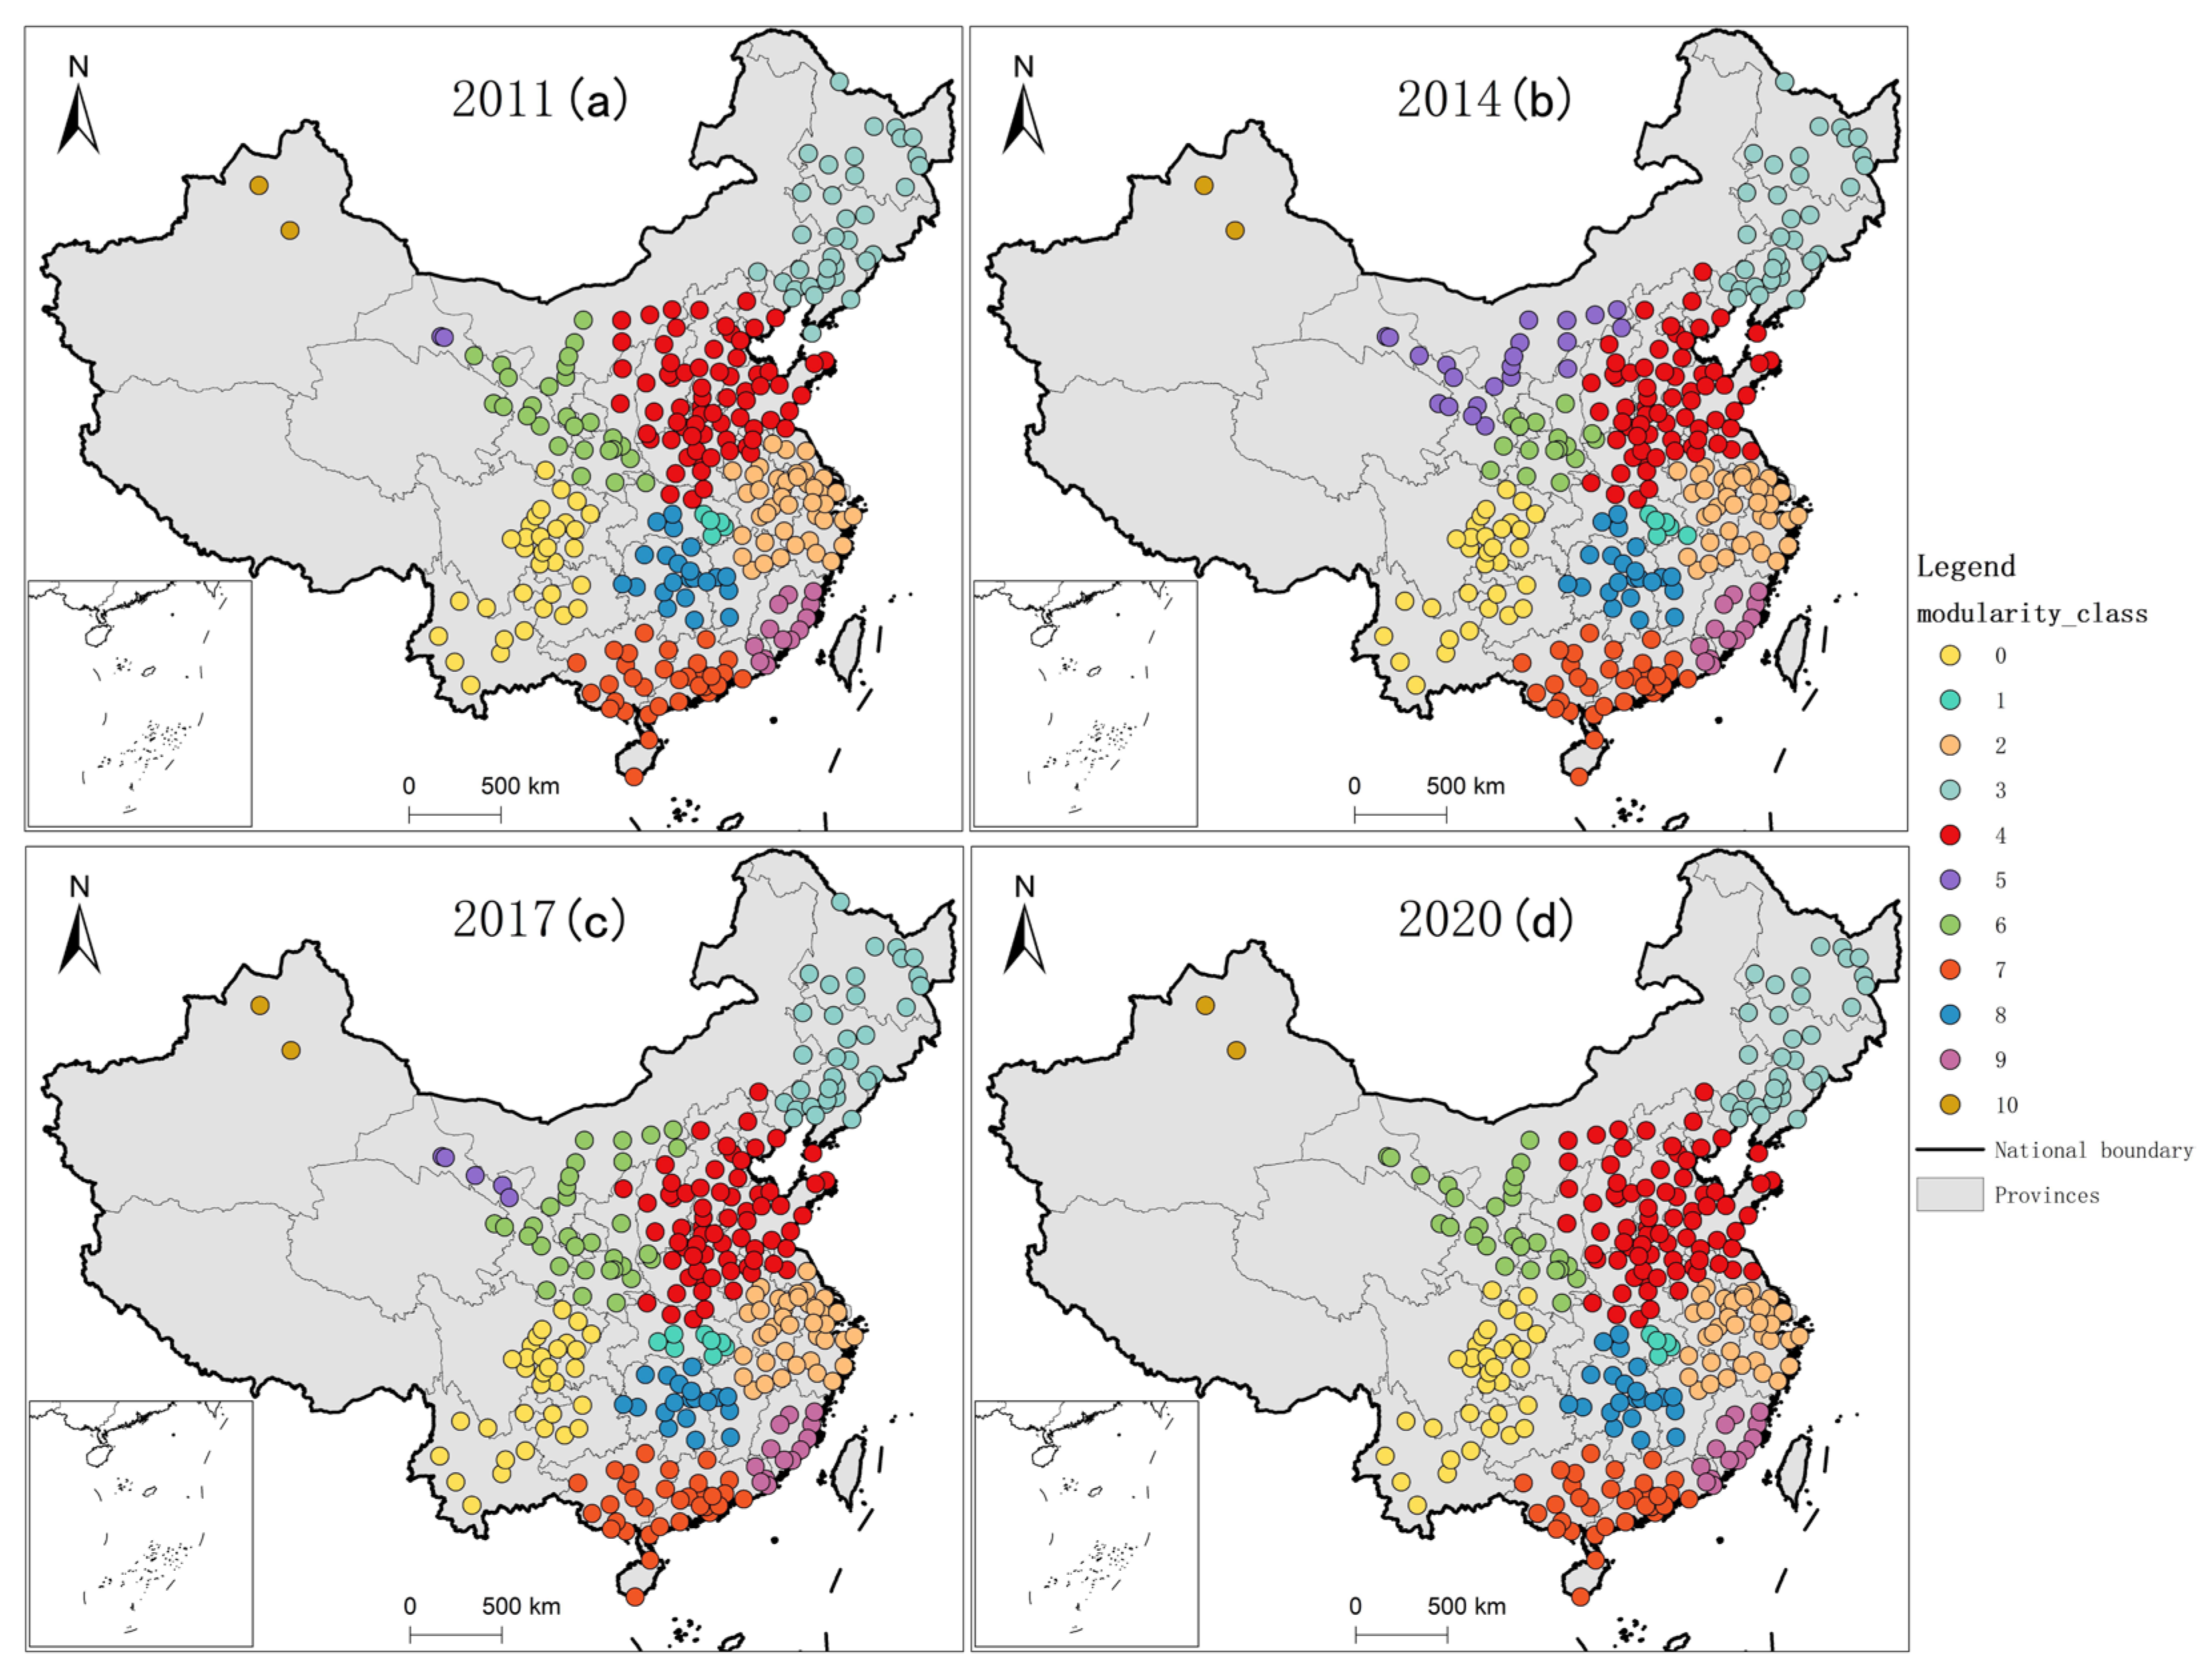
The modularity results for the four years in this paper are 0.769, 0.769, 0.772, and 0.765, indicating excellent community segmentation results, with higher node similarity within the community and lower outside. The number of communities in 2011, 2014, 2017, and 2020 is 11, 11, 11, and 10, respectively, showing a stable community structure. As can be seen from Figure 3, the community of developed coastal regions like the YRD (orange part) and the PRD (light purple part) is surprisingly stable, with little change in internal urban composition. The evolution of the community structure focuses on major cities in Inner Mongolia, Gansu, and Shanxi provinces, which have shifted between two communities in 2011, 2014, and 2017, and finally merged into one large community in 2020 (green part). The reason may be that these cities are geographically close and the digital financial industry starts later than those in developed areas, so they finally reach a similar level in the golden decade of DF development. In addition, the internal structure of large communities is relatively stable. The northeast (grey part) and southwest (yellow part) communities barely changed, probably because the three northeastern provinces were once the base of China’s heavy industry, at one point accounting for 98% of the total. This leads to a weak digital base and a difficult economic transition, which eventually presents a similar level of DF development. While the southwest community is located on the Yunnan–Guizhou Plateau, where the language is similar and the transportation is connected, which will generate more interconnections. It is worth noticing that unlike the major communities above, which consist of dozens of cities, there are two particular small communities that consistently exist. One of them is located in the Xinjiang region (brown part), due to its remote and independent geographical location. The other is a small community of five to seven cities (light blue), led by Wuhan, sandwiched between large communities. In general, the community structure of the DF connection network in Chinese cities shows high internal cooperation.
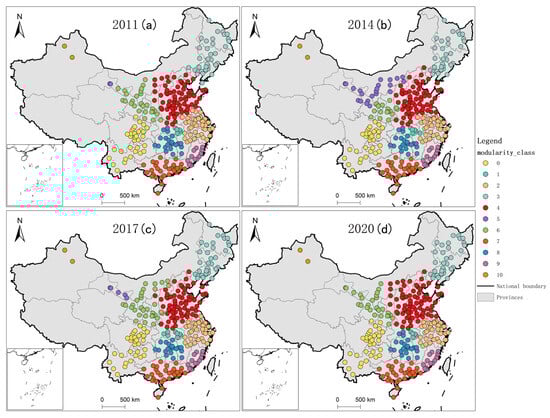
Figure 3.
The modularity of the DF network which reveals the community evolution in 2011 (a), 2014 (b), 2017 (c), and 2020 (d).
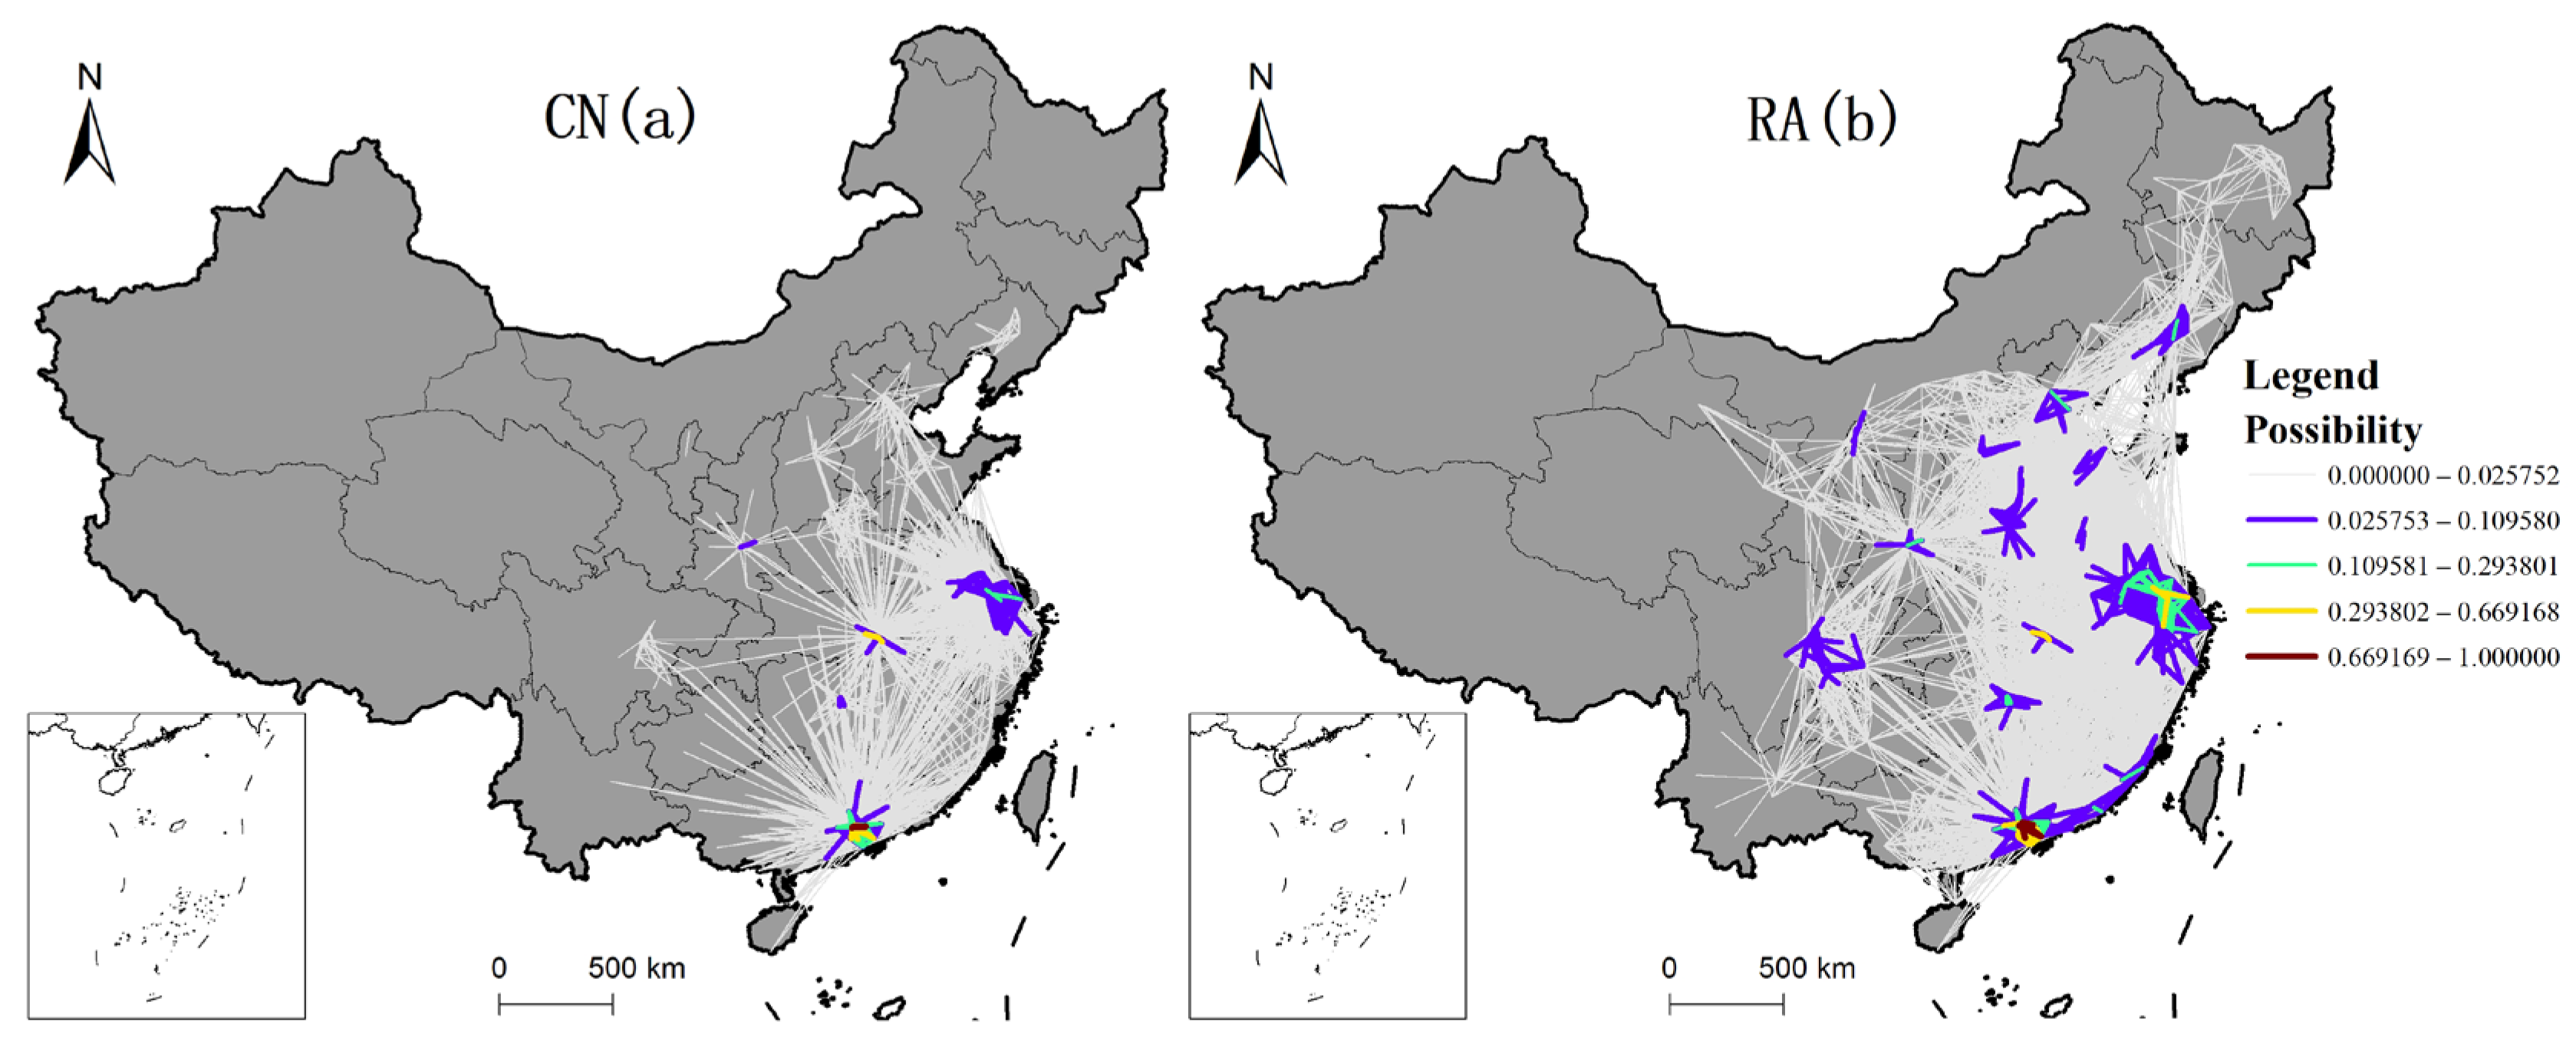
3.2.4. Regions with the Greatest Possibility of Connection Are Located in the PRD and the YRD
In order to better display the possibility of a connection between nodes in different cities, we present the degree of connection possibility between nodes by the proportion of the possibility of each edge in total possibilities. Figure 4 clearly reveals that the regions with the greatest possibility of connection forecasted by the two indicators are located in the PRD and the YRD, which are the most economically and technologically active areas in China. This is consistent with the conclusion above that DF has the characteristics of agglomeration and centralization.
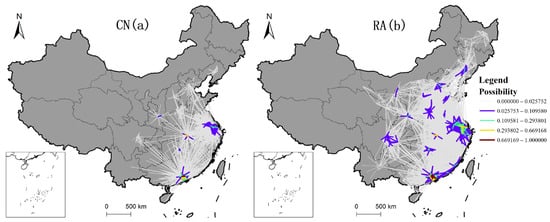
Figure 4.
(a) Revealing the cities’ structural similarity in network based on local information. (b) Showing the result of the number of resources received by a node.
CN index shows that cities that could generate new connections are most likely to be located in Guangdong, Jiangsu, and Hubei provinces. Cities in Guangdong province will form closer cooperation circles around Shenzhen and Guangzhou, with the connection possibility of Foshan and Dongguan reaching the extreme. The three cities of Suzhou, Wuxi, and Changzhou in Southern Jiangsu will be inseparably linked to each other. Wuhan, the largest city in central China, will become more connected to cities in Hubei province.
RA index predicted more significant possibilities than CN. In addition to the three provinces predicted by CN, it also includes capital cities in the western and northern regions, such as Beijing, Jinan, Shenyang, Xi’an, Zhengzhou, Chengdu, Chongqing, and Changsha. This suggests that there may be a strong potential for cooperation between these cities and neighboring cities. Furthermore, when comparing it with the 2020 DF network (Figure 1) and the RA index results, a striking similarity is observed between the actual connection relationships and the detected connection possibilities, both of which are concentrated in the most economically developed and vigorous regions of China—the YRD and the PRD. According to the forecasting index, the internal connection of these two regions will be even tighter and closer (about 60% of the total probability), indicating that megacities and provincial capitals have significant spillover and radiation effects. Once again, the prediction shows that DF development presents a Matthew effect.
3.3. Drivers of DF Development Vary by Region and Time
3.3.1. Model Feasibility
In order to figure out the driving mechanism of DF development, the DF comprehensive index is chosen as the dependent variable, while the economic level, innovation level, government intervention, internet popularity, and traditional financial level are chosen as independent variables for GTWR regression. Before that, in order to eliminate the possibility of pseudo regression, the multicollinearity test of all variables is conducted in this paper. The variance inflation factor of the tested variables is all less than 10, which meets regression requirements. Regarding the goodness of fit, both and corrected are higher than 0.98, showing that GTWR regression could perfectly present the influence of the independent variable in this paper.
3.3.2. Spatiotemporal Differentiation of Driving Factors’ Influence
The effect of various drivers on the DF comprehensive index in different periods is spatially differentiated (Figure 5). Specifically, it can be seen as follows:

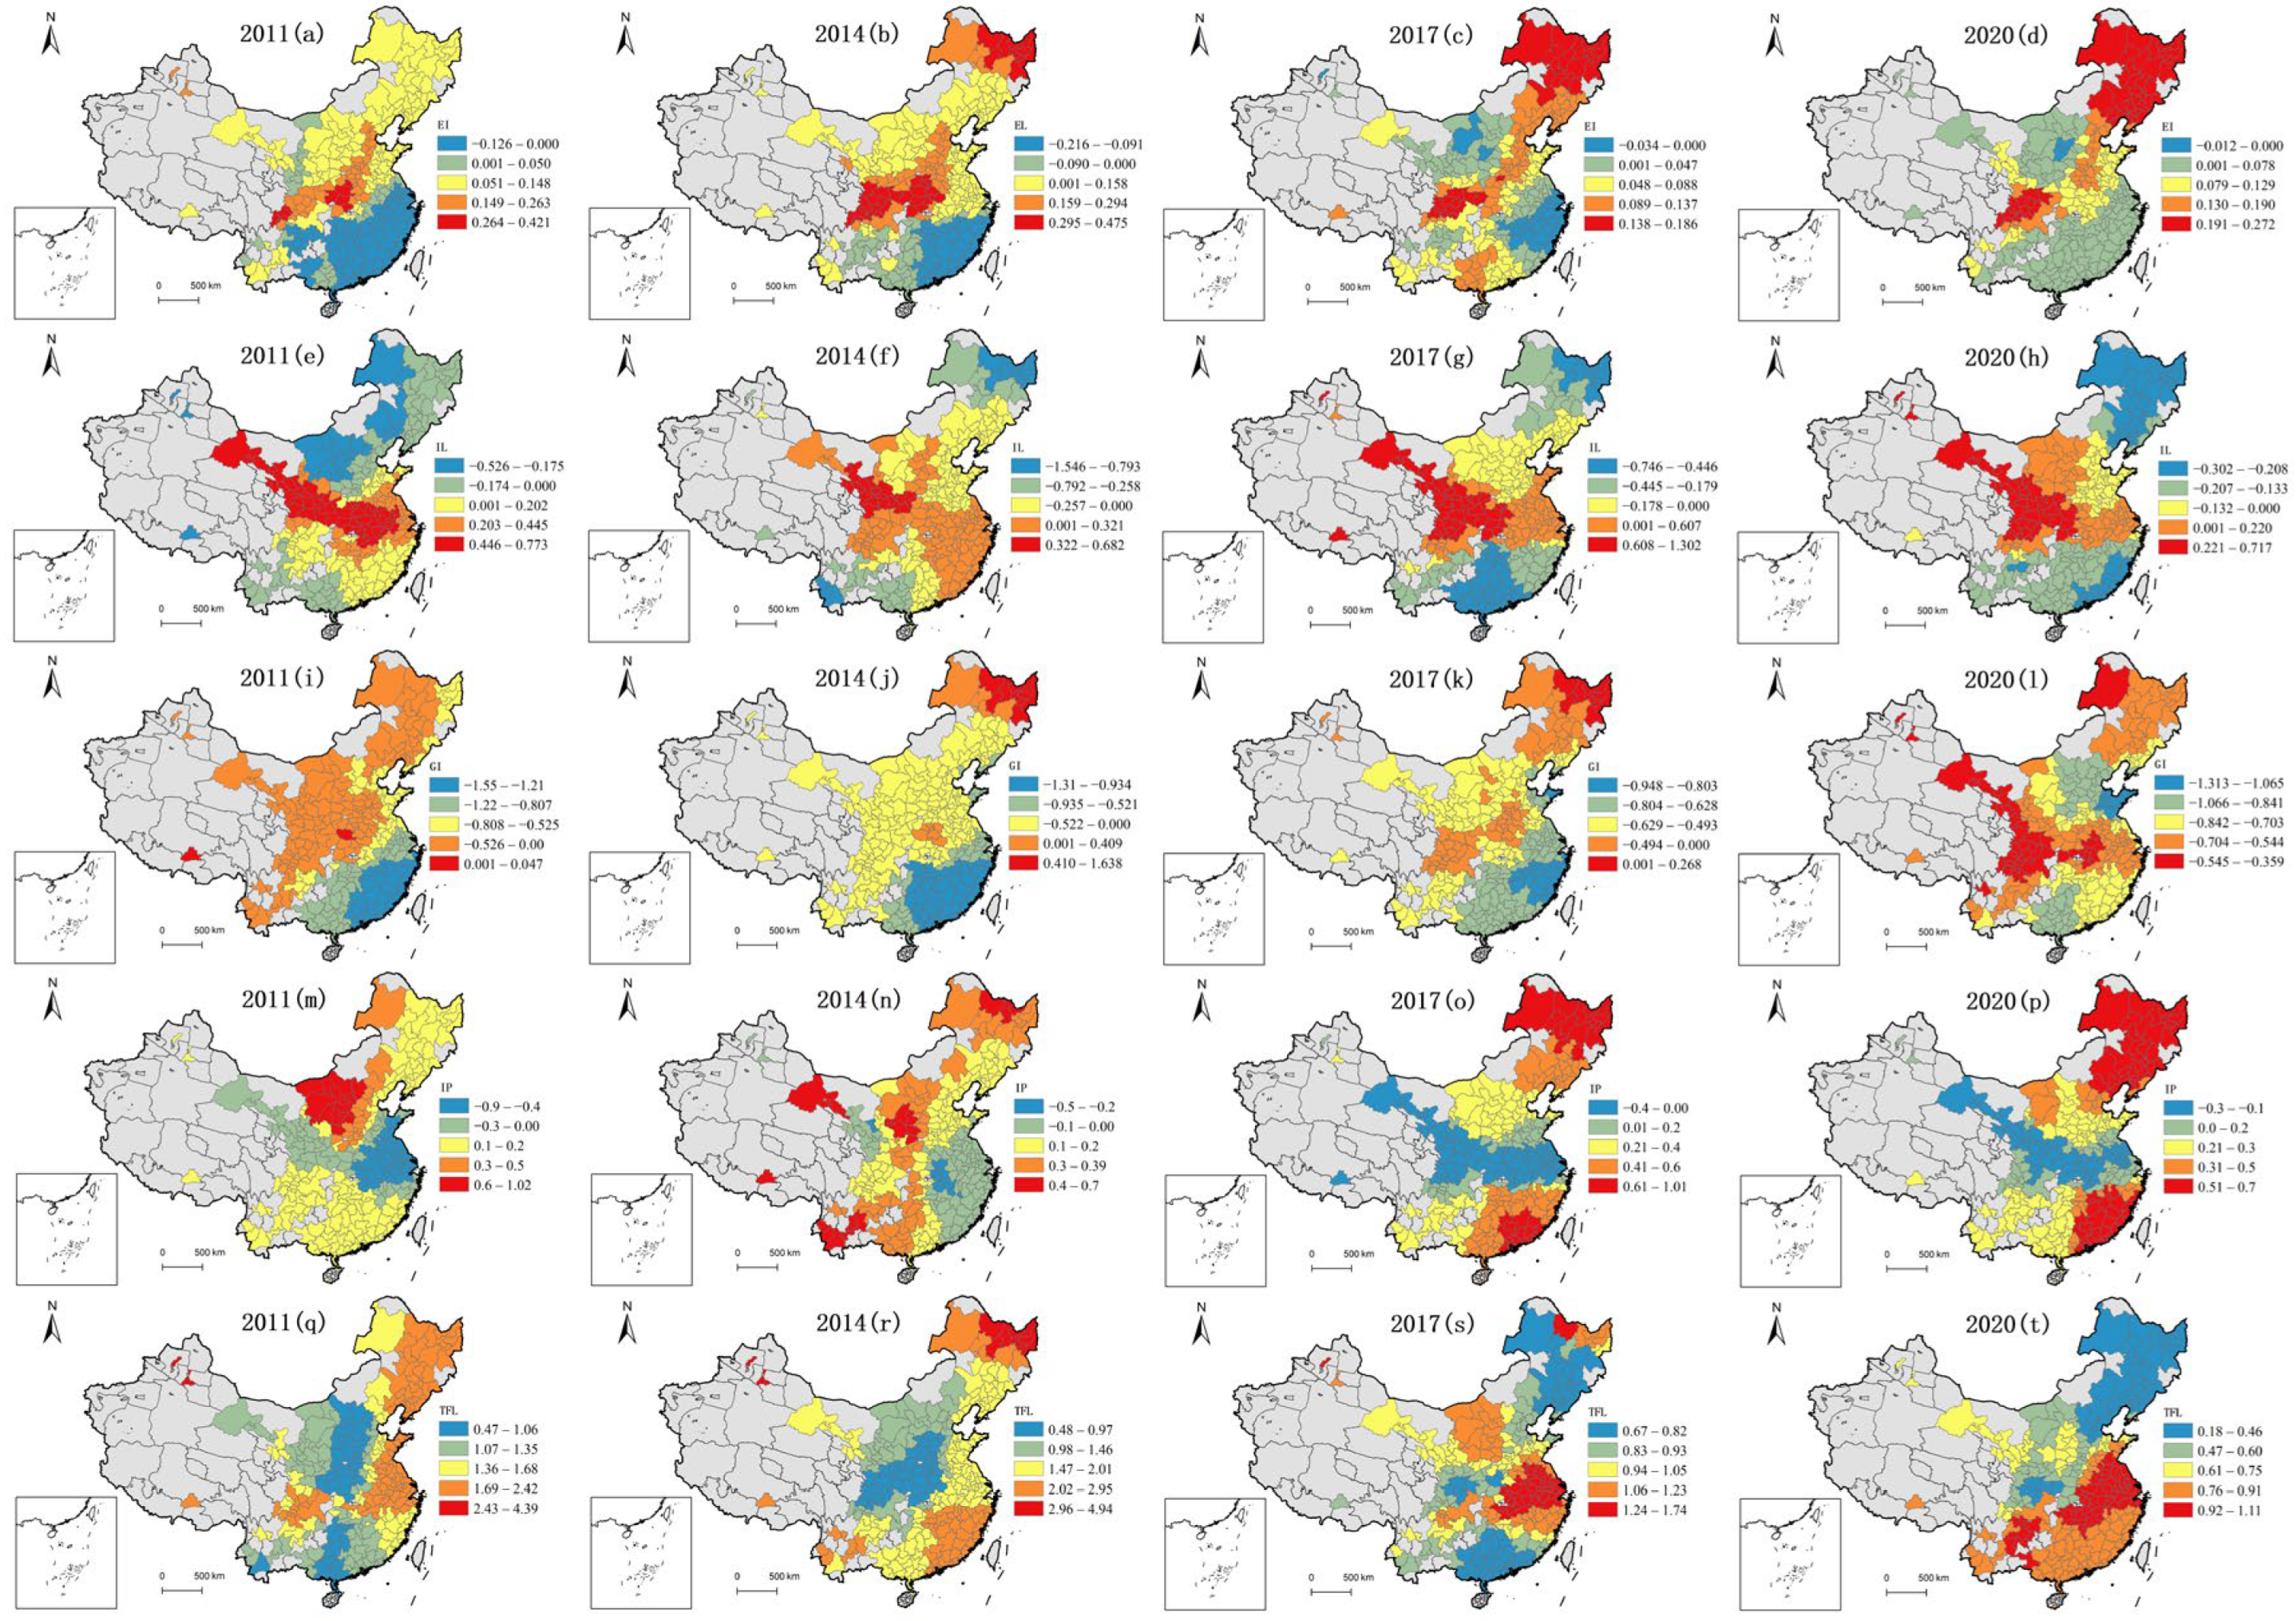
Figure 5.
4-year comparison of regression coefficients for core drivers. Pictures (a–d) represent the regression coefficient of the economic level, (e–h) the innovation level, (i–l) the number of government interventions, (m–p) internet popularity, and (q–t) of the traditional financial level.
(1) The spatial and temporal non-stationarity of the economic level is weakened, and the overall influence is positive, but the effect intensity is weakening (Pictures a–d). The positive high-value area (red part) is concentrated in Sichuan–Chongqing provinces and three northeast provinces, showing an expanding trend. The spatial pattern of the negative high-value area is relatively stable, and it is concentrated in the eastern coastal area. The low absolute value area shifts from the north to the central region.
(2) The spatial and temporal non-stationarity of the innovation level is weakened, the negative effect intensity is also gradually weakened, and the spatial distribution has a certain stability (Pictures e–h). In the four years, the positive effect regions are concentrated in Gansu, Sichuan, and Chongqing provinces, which shows obvious agglomeration characteristics. The negative effect regions are mainly in Inner Mongolia province and some cities in Northeast China. The low absolute value regions are mainly in the southcentral region.
(3) The spatial and temporal non-stationarity of government intervention is weakened, and it has a continuous negative effect on most cities in the country, but the intensity is gradually weakening (Pictures i–l). The positive area is mainly distributed in some cities in three northeast provinces, while the negative effect areas are located in the eastern coastal provinces before 2017. The overall influence shows a high level in the northwest and a low level in the southeast.
(4) The spatial and temporal non-stationarity of internet popularity is weakened, and the main effect is positive and enhanced (Pictures m–p). The most affected region gradually shifts from the western areas to the northeast and coastal regions. The negative effect area is concentrated in Gansu, Shanxi, Sichuan, and Henan provinces, showing an obvious spatial distribution of strips. According to the regression coefficient, the effect intensity of Internet popularity is high in the northern and eastern coastal provinces while low in the middle across the country.
(5) The spatial and temporal non-stationarity of the traditional financial level is weakened, showing a positive impact on all cities in the four years, and the intensity of the impact is gradually weakened but still maintains a high level for most cities (Pictures q–t). The positive high-value area is mainly concentrated in the Jiangsu, Zhejiang, Anhui, and Fujian provinces, and the positive low-value region is transferred from the central and southwest to the three northeast provinces. On the whole, spatial change has the characteristics of polarization and dispersion.
4. Discussion
4.1. Exploration of the Evolution of Urban DF Network
This paper mainly explored the key driving forces and mechanisms of the DF industry and its network evolutionary characteristics. According to the results of the network connection intensity during the decade, the proportion of high-intensity increased from 3.3% to 12.3% and most cities are still at a low level of connection. In terms of geographic variation, similar to the discussion by Chen et al. [34], DF network connections are denser and closer on the east coast than in the west. The reasons for this situation are manifold, including differences in urban resource endowments, unbalanced development, industrial structure, and policy preferences [51]. However, we believe that the most important is because the essence of DF is still finance itself, development of financial products and services cannot exist in isolation from economic activities. Although digital technology promotes the equality of access to financial services, the nature of its service entity makes it still follow the law of centralized development [3]. In the search for cities with high betweenness centrality, both our study and Li et al.’s [35] have concluded that these cities, such as Beijing, Shanghai, and Shenzhen, are mainly located in the eastern developed economic belt. While DF allows residents in different regions to share digital inclusion, fair opportunities do not mean fair development. Developed cities have been able to maintain control over digital financial resources and continue to act as a bridge to neighboring regions due to their first-mover advantage [18]. Thus, even though some cities have achieved remarkable progress, they cannot threaten the status of these developed cities.
In addition, Zhao et al. [20] found that there are three sub-communities within the YRD region. However, in this paper, the YRD region (orange part in Figure 3) is shown as a whole large community with a very stable structure and almost no change in its internal members. The reason for this difference may be due to the fact that at the national level, the YRD region is a typical economically developed region and digital innovation technology cluster, and its digital finance development is in a leading position in the country, and neighboring cities are unable and incapable of catching up [34]. There also exists an interesting and noteworthy small community of five cities led by Wuhan (light blue part in Figure 3), which is sandwiched between a number of larger communities. Its formation may be attributed to the concept of the Wuhan Metropolitan Area proposed by the government in 2002. After nearly 20 years of development, Wuhan has become the biggest city in the central area and the center of economy, technology, and education [52]. Furthermore, in the previous section, this paper concludes that Wuhan has long been a high betweenness centrality city in the central region, so it can effectively radiate its influence to neighboring cities and thus improve their DF development, making them independent from the neighboring communities. The results of the network connection forecasting actually corroborate our discussion once again that DF has significant agglomeration and centralization characteristics [47]. Because the level of internal information sharing, resource integration, and policy support is higher in the developed coastal regions than in the inland regions, the gap in digital financial interconnection and development tends to further expand.
4.2. The Drivers Present Significant Spatial Heterogeneity over Time
Based on the temporal and spatial distribution of the drivers’ regression coefficients, this part summarizes the leading driving forces for the development of DF in major regions.
(1) For the developed eastern coastal provinces, the driving force has shifted from the innovation level in 2011 to 2014 to the Internet popularity in 2017 to 2020. The reason is that, when digital technology is emerging, as China’s major economic center and with abundant talent, technology, and capital reserve, the eastern coastal areas can rapidly apply it to financial innovation, such as P2P mode and third-party quick payment methods. These new digital financial models have undoubtedly promoted the development of DF. However, DF cannot be separated from the digital users as the foundation, so the deeper expansion of users becomes the dominant driving force later.
(2) For central and southwest provinces with slower growth, the dominant driving force from 2011 to 2020 is the level of economic and innovation. This is because DF ultimately needs to serve the real economy and cannot exist without economic activities, so economic growth can give positive feedback to DF. Moreover, judging from the experience of the coastal provinces, innovation could be a powerful driver for industrial development and play a continuous and positive role in the less developed areas.
(3) For the three northeastern provinces of Heilongjiang, Jilin, and Liaoning, whose economy is in a transition period, economic level and Internet popularity have played a significant and continuous role over the past decade. This is because the three provinces used to serve as a national heavy industry base, with weak light industry infrastructure such as digital technology, and the economic development has lagged behind in the last 20 years, leading to a lower starting point for the DF industry. Therefore, economic development and internet popularization can effectively promote the DF industry.
(4) At the national level, we obtained similar conclusions to previous studies that the traditional financial level shows a positive and continuous promoting effect [21], while government intervention plays a negative role. This is because the development of financial services cannot exist without actual financial institutions. The service support by traditional finance remains the cornerstone. The government intervention showed a continuous negative effect, which is in line with reality. Due to the rapid growth of the DF industry and the existence of loopholes in industrial regulation, illegal behaviors such as providing high-interest loans to teenagers who are attending school, illegal fund-raising, and naked lending inevitably emerged [53], which have aroused widespread concern among the media and the public. In 2016, P2P platforms began to collapse in large numbers, and the executives fled overseas with the money they raised, which was a wake-up call for the government. Therefore, the government began implementing strict supervision measures on Internet companies while introducing regulatory legislation and raising the entry threshold for Internet finance business, which hindered the process of DF development.
This study makes contributions to the current research on the DF topic. First, we figure out the key drivers that influence DF development by a geographic detector instead of subjective judgments, which represents one of the attempts to fill this void. This helps to analyze the urban shortcomings and the aspects that need to be improved when it encounters the bottleneck of DF development. Second, we innovatively study the development process of DF from a network perspective and find some similar and different results in the evolution characteristics of network structure. Our work will not only help local governments give play to their comparative advantages and formulate relevant policies according to local conditions but also help cities accurately identify their role and clarify their position in the network. The ultimate goal is to achieve the DF’s internal balanced development and to provide beneficial experiences for other countries, especially developing countries.
Furthermore, acknowledging the limitations of our work is necessary. First, data availability is always an issue for large-sample city studies, and we had to exclude some cities with incomplete statistics. Second, since the time dimension is too short, temporal stationarity discussion is open to questions. Third, in the search for driving factors, important variables such as capital stock, international trade, labor force productivity, and endogenous technology were not included in the study due to the difficulty in obtaining them. Future research could extend to a more complete sample of cities, a longer time dimension, and exploration of more potential drivers. In addition, a panel data study with long-time dimensions helps to present the details of network evolution, and the nonlinear effects of other factors on DF development are also needed. Finally, multiplex networks could be introduced to this topic.
5. Conclusions and Implications
5.1. Main Conclusions
In this article, we utilized a geographic detector to explore the key drivers that affect DF development and establish a comprehensive index of DF development. After that, an urban DF network was constructed and the evolutionary characteristics were portrayed and predicted by SNA methods. Finally, the GTWR regression presented changes in key drivers’ influence across both temporal and geographic dimensions. The findings are as follows:
(1) The result of the geographic detector shows that the factors affecting the DF level in different years are altered. But generally speaking, economic level, traditional financial level, Internet popularity, innovation level, and government intervention have stronger explanatory power compared with other factors; therefore, these are the key drivers of urban DF.
(2) The DF connection intensity of most cities in China is at a low level and exhibits a significant multi-polar trend, but the overall level of the connection intensity has increased significantly and the growth rate is considerable.
(3) Cities with high betweenness centrality are concentrated in the megacities of various regions. Some medium-level cities are degrading to lower levels, while the number of high-level cities is stable which means the high-level cities have always maintained a higher degree of control over digital resources, and there is a trend of further strengthening.
(4) The number of communities in 2011, 2014, 2017, and 2020 is 11, 11, 11, and 10, respectively, indicating a stable community structure. The structural evolution is mainly focused on the cities of Inner Mongolia, Gansu, and Shanxi provinces, with little change in urban composition within coastal communities. Five to seven small communities, led by Wuhan, exist independently among many large communities.
(5) The regions with the most possibility of connection forecasted by the two indicators are located in the PRD and the YRD. RA index predicted more regions than CN, mainly concentrated in the western and northern provincial capitals, such as Beijing, Jinan, Shenyang, and Xi’an. The internal connection of the regions above will be even closer, which shows a significant Matthew effect.
(6) GTWR regression results show that the leading drivers for the DF development in eastern coastal provinces have changed from the innovation level from 2011 to 2014 to the Internet popularity from 2017 to 2020. In the central and southwestern provinces, the leading drivers are economic development and innovation from 2011 to 2020. For Northeast China, the economic development and Internet popularity have shown significant and sustained positive effects over the decade. At the national level, the traditional financial level shows a positive and continuous promoting effect, while government intervention plays a negative role.
5.2. Implications
Based on the above study, for the sake of exploring the promotion path of urban DF development, this article puts forward the following suggestions:
(1) The awareness of sharing, collaboration, and sustainability is enhanced. Imbalanced DF development between east–west and north–south regions will lead to the widening of the gap between the rich and the poor, social injustice, and other problems, and such a development model will ultimately be unsustainable. Therefore, the megacities should act as intermediary cities, promote the positive interaction of DF among neighboring cities, strengthen exchanges and cooperation, and minimize the obstacles caused by geographical characteristics and differences in endowments. The establishment of a sharing platform with both central cities and developed areas as pillars is promoted, and a mechanism is constructed for developed areas to support backward areas and central cities to support other cities.
(2) Local governments should streamline administration and delegate power, give full play to local advantages and favorable conditions, and formulate targeted policies. For example, social regulation and public supervision should be strengthened, and appropriate support should be given to Internet finance companies. Moreover, the eastern provinces governments should continue to support the popularization of the Internet, while the central and western provinces and Northeast China should still regard economic growth as the primary goal. Only in this way can the rapid development of DF in all regions be effectively guaranteed.
(3) The infrastructure of the traditional finance system is enhanced. Due to its characteristics of being free from geographical constraints and having almost zero marginal cost, digital technology promotes the development of backward and sparsely populated areas, so that residents in different areas can share financial information. However, the essence of DF is still finance itself. Financial products and services cannot exist without actual financial institutions. Therefore, the support of traditional financial patterns in various regions is the cornerstone of sound DF development.
Author Contributions
Conceptualization, R.D.; data curation, K.W., W.X. and Y.H.; formal analysis, S.S. and L.D.; investigation, S.S. and S.C.; methodology, R.D. and S.S.; resources, S.S., Y.Z. and J.L.; validation, S.S., Y.Z. and L.D.; visualization, R.D. and S.S.; writing—original draft, R.D. and S.S.; writing—review and editing, R.D. All authors have read and agreed to the published version of the manuscript.
Funding
This work was supported by the Guizhou University of Finance and Economics Regional economic high-quality development research provincial innovation team.
Institutional Review Board Statement
Not applicable.
Informed Consent Statement
Not applicable.
Data Availability Statement
The data presented in this study are available upon request from the corresponding author.
Acknowledgments
We thank the editors and the anonymous reviewers for their valuable comments and suggestions.
Conflicts of Interest
The authors declare no conflict of interest.
References
- Culpeper, R. The Role of the G20 in Enhancing Financial Inclusion; Heinrich Böll Stiftung (The Green Political Foundation) Publication: Berlin, Germany, 2012; pp. 1–22. [Google Scholar]
- Ozili, P.K. Impact of Digital Finance on Financial Inclusion and Stability. Borsa Istanb. Rev. 2018, 18, 329–340. [Google Scholar] [CrossRef]
- Guo, F.; Wang, J.; Wang, F.; Kong, T.; Zhang, X.; Cheng, Z. Measuring China’s Digital Financial Inclusion: Index Compilation and Spatial Characteristics. China Econ. Q. 2020, 19, 1401–1418. [Google Scholar] [CrossRef]
- Ren, B.; Li, L.; Zhao, H.; Zhou, Y. The Financial Exclusion in the Development of Digital Finance—A Study Based on Survey Data in the Jingjinji Rural Area. Singap. Econ. Rev. 2018, 63, 65–82. [Google Scholar] [CrossRef]
- Ozili, P.K. Financial Inclusion Research around the World: A Review. Forum Soc. Econ. 2021, 50, 457–479. [Google Scholar] [CrossRef]
- Mi, J.J.; Zhu, H. Can Funding Platforms’ Self-Initiated Financial Innovation Improve Credit Availability? Evidence from China’s P2P Market. Appl. Econ. Lett. 2017, 24, 396–398. [Google Scholar] [CrossRef]
- Rosavina, M.; Rahadi, R.A.; Kitri, M.L.; Nuraeni, S.; Mayangsari, L. P2P Lending Adoption by SMEs in Indonesia. Qual. Res. Financ. Mark. 2019, 11, 260–279. [Google Scholar] [CrossRef]
- Chen, S.; Zhang, H. Does Digital Finance Promote Manufacturing Servitization: Micro Evidence from China. Int. Rev. Econ. Financ. 2021, 76, 856–869. [Google Scholar] [CrossRef]
- Li, J.; Wu, Y.; Xiao, J.J. The Impact of Digital Finance on Household Consumption: Evidence from China. Econ. Model. 2020, 86, 317–326. [Google Scholar] [CrossRef]
- Li, X.; Shao, X.; Chang, T.; Albu, L.L. Does Digital Finance Promote the Green Innovation of China’s Listed Companies? Energy Econ. 2022, 114, 106254. [Google Scholar] [CrossRef]
- Liu, S.; Koster, S.; Chen, X. Digital Divide or Dividend? The Impact of Digital Finance on the Migrants’ Entrepreneurship in Less Developed Regions of China. Cities 2022, 131, 103896. [Google Scholar] [CrossRef]
- Wang, Q.; Yang, J.; Chiu, Y.; Lin, T.-Y. The Impact of Digital Finance on Financial Efficiency. Manag. Decis. Econ. 2020, 41, 1225–1236. [Google Scholar] [CrossRef]
- Xue, Q.; Feng, S.; Chen, K.; Li, M. Impact of Digital Finance on Regional Carbon Emissions: An Empirical Study of Sustainable Development in China. Sustainability 2022, 14, 8340. [Google Scholar] [CrossRef]
- Liang, M. Research on the Impact of Chinese Digital Inclusive Finance on Industrial Structure Upgrade—Based on Spatial Dubin Model. Open J. Stat. 2020, 10, 863. [Google Scholar] [CrossRef]
- Guo, H.; Gu, F.; Peng, Y.; Deng, X.; Guo, L. Does Digital Inclusive Finance Effectively Promote Agricultural Green Development?—A Case Study of China. Int. J. Environ. Res. Public Health 2022, 19, 6982. [Google Scholar] [CrossRef] [PubMed]
- Lv, C.; Song, J.; Lee, C.-C. Can Digital Finance Narrow the Regional Disparities in the Quality of Economic Growth? Evidence from China. Econ. Anal. Policy 2022, 76, 502–521. [Google Scholar] [CrossRef]
- Qiu, J.; Chen, W.; Tao, R.; Wang, C. The Temporal and Spatial Evolution of Digital Inclusive Finance and Its Boosting Effect on Rural Revitalization in China. Preprints 2022, 2022070274. [Google Scholar] [CrossRef]
- Liao, G.; Li, Z.; Wang, M.; Albitar, K. Measuring China’s urban digital finance. Quant. Financ. Econ. 2022, 6, 385–404. [Google Scholar] [CrossRef]
- Ye, C.; Sun, C.; Chen, L. New Evidence for the Impact of Financial Agglomeration on Urbanization from a Spatial Econometrics Analysis. J. Clean. Prod. 2018, 200, 65–73. [Google Scholar] [CrossRef]
- Zhao, Y.; Zhang, G.; Zhao, H. Spatial Network Structures of Urban Agglomeration Based on the Improved Gravity Model: A Case Study in China’s Two Urban Agglomerations. Complexity 2021, 2021, 6651444. [Google Scholar] [CrossRef]
- Liu, X.; Zhu, J.; Guo, J.; Cui, C. Spatial association and explanation of China’s digital financial inclusion development based on the network analysis method. Complexity 2021, 2021, 6649894. [Google Scholar] [CrossRef]
- Schweitzer, F.; Fagiolo, G.; Sornette, D.; Vega-Redondo, F.; Vespignani, A.; White, D.R. Economic Networks: The New Challenges. Science 2009, 325, 422–425. [Google Scholar] [CrossRef]
- Hautsch, N.; Schaumburg, J.; Schienle, M. Financial Network Systemic Risk Contributions. Rev. Financ. 2015, 19, 685–738. [Google Scholar] [CrossRef]
- Battiston, S.; Farmer, J.D.; Flache, A.; Garlaschelli, D.; Haldane, A.G.; Heesterbeek, H.; Hommes, C.; Jaeger, C.; May, R.; Scheffer, M. Complexity Theory and Financial Regulation. Science 2016, 351, 818–819. [Google Scholar] [CrossRef]
- Bardoscia, M.; Barucca, P.; Battiston, S.; Caccioli, F.; Cimini, G.; Garlaschelli, D.; Saracco, F.; Squartini, T.; Caldarelli, G. The Physics of Financial Networks. Nat. Rev. Phys. 2021, 3, 490–507. [Google Scholar] [CrossRef]
- Chu, A.M.; Chan, L.S.; So, M.K. Stochastic Actor-oriented Modelling of the Impact of COVID-19 on Financial Network Evolution. Stat 2021, 10, e408. [Google Scholar] [CrossRef] [PubMed]
- Zhang, W.; Zhuang, X.; Li, Y. Dynamic Evolution Process of Financial Impact Path under the Multidimensional Spatial Effect Based on G20 Financial Network. Phys. Stat. Mech. Its Appl. 2019, 532, 121876. [Google Scholar] [CrossRef]
- Samitas, A.; Kampouris, E.; Polyzos, S. Covid-19 Pandemic and Spillover Effects in Stock Markets: A Financial Network Approach. Int. Rev. Financ. Anal. 2022, 80, 102005. [Google Scholar] [CrossRef]
- Markose, S.; Giansante, S.; Shaghaghi, A.R. ‘Too Interconnected to Fail’Financial Network of US CDS Market: Topological Fragility and Systemic Risk. J. Econ. Behav. Organ. 2012, 83, 627–646. [Google Scholar] [CrossRef]
- Chinazzi, M.; Fagiolo, G.; Reyes, J.A.; Schiavo, S. Post-Mortem Examination of the International Financial Network. J. Econ. Dyn. Control 2013, 37, 1692–1713. [Google Scholar] [CrossRef]
- Huang, Y.; Hong, T.; Ma, T. Urban Network Externalities, Agglomeration Economies and Urban Economic Growth. Cities 2020, 107, 102882. [Google Scholar] [CrossRef]
- Anderson, J.E. The Gravity Model. Annu. Rev. Econ. 2011, 3, 133–160. [Google Scholar] [CrossRef]
- Fan, Y.; Zhang, S.; He, Z.; He, B.; Yu, H.; Ye, X.; Yang, H.; Zhang, X.; Chi, Z. Spatial Pattern and Evolution of Urban System Based on Gravity Model and Whole Network Analysis in the Huaihe River Basin of China. Discret. Dyn. Nat. Soc. 2018, 2018, 3698071. [Google Scholar] [CrossRef]
- Chen, Y.; Nie, B.; Huang, Z.; Zhang, C. Spatial relevancy of digital finance in the urban agglomeration of Pearl River Delta and the influence factors. Electron. Res. Arch. 2023, 31, 4378–4405. [Google Scholar] [CrossRef]
- Li, J.; Ye, S.; Wang, S. Spatial Network Analysis on the Coupling Coordination of Digital Finance and Technological Innovation. Sustainability 2023, 15, 6354. [Google Scholar] [CrossRef]
- Huang, R.; Kale, S.; Paramati, S.R.; Taghizadeh-Hesary, F. The Nexus between Financial Inclusion and Economic Development: Comparison of Old and New EU Member Countries. Econ. Anal. Policy 2021, 69, 1–15. [Google Scholar] [CrossRef]
- Shen, Y.; Hu, W.; Hueng, C.J. Digital Financial Inclusion and Economic Growth: A Cross-Country Study. Procedia Comput. Sci. 2021, 187, 218–223. [Google Scholar] [CrossRef]
- Ren, X.; Zeng, G.; Gozgor, G. How Does Digital Finance Affect Industrial Structure Upgrading? Evidence from Chinese Prefecture-Level Cities. J. Environ. Manag. 2023, 330, 117125. [Google Scholar] [CrossRef]
- Hasan, M.M.; Yajuan, L.; Khan, S. Promoting China’s Inclusive Finance through Digital Financial Services. Glob. Bus. Rev. 2022, 23, 984–1006. [Google Scholar] [CrossRef]
- Quinn, D.; Schindler, M.; Toyoda, A.M. Assessing Measures of Financial Openness and Integration. IMF Econ. Rev. 2011, 59, 488–522. [Google Scholar] [CrossRef]
- Thathsarani, U.S.; Wei, J.; Samaraweera, G. Financial Inclusion’s Role in Economic Growth and Human Capital in South Asia: An Econometric Approach. Sustainability 2021, 13, 4303. [Google Scholar] [CrossRef]
- Tram, T.X.H.; Lai, T.D.; Nguyen, T.T.H. Constructing a Composite Financial Inclusion Index for Developing Economies. Q. Rev. Econ. Financ. 2023, 87, 257–265. [Google Scholar] [CrossRef]
- Kanungo, R.P.; Gupta, S. Financial Inclusion through Digitalisation of Services for Well-Being. Technol. Forecast. Soc. Change 2021, 167, 120721. [Google Scholar] [CrossRef]
- Jiang, Z.; Ma, G.; Zhu, W. Research on the Impact of Digital Finance on the Innovation Performance of Enterprises. Eur. J. Innov. Manag. 2022, 25, 804–820. [Google Scholar] [CrossRef]
- Cao, S.; Nie, L.; Sun, H.; Sun, W.; Taghizadeh-Hesary, F. Digital Finance, Green Technological Innovation and Energy-Environmental Performance: Evidence from China’s Regional Economies. J. Clean. Prod. 2021, 327, 129458. [Google Scholar] [CrossRef]
- Morgan, P.J.; Huang, B.; Trinh, L.Q. The Need to Promote Digital Financial Literacy for the Digital Age. In The Future of Work and Education for the Digital Age; G20 Insights; ADBI Press: Tokyo, Japan, 2019; pp. 36–52. [Google Scholar]
- Chai, D.; Du, J.; Yu, Z.; Zhang, D. City Network Mining in China’s Yangtze River Economic Belt Based on “Two-Way Time Distance” Modified Gravity Model and Social Network Analysis. Front. Phys. 2022, 10, 1018993. [Google Scholar] [CrossRef]
- Duan, Q.; Tan, M. Using a Geographical Detector to Identify the Key Factors That Influence Urban Forest Spatial Differences within China. Urban For. Urban Green. 2020, 49, 126623. [Google Scholar] [CrossRef]
- Newman, M.E. Equivalence between Modularity Optimization and Maximum Likelihood Methods for Community Detection. Phys. Rev. E 2016, 94, 052315. [Google Scholar] [CrossRef] [PubMed]
- Fotheringham, A.S.; Crespo, R.; Yao, J. Geographical and Temporal Weighted Regression (GTWR). Geogr. Anal. 2015, 47, 431–452. [Google Scholar] [CrossRef]
- Chu, H.; Ning, Y.; Qie, X. Measurement and Spatial Correlation Analysis of the Development Level of the Digital Economy in the Yangtze River Delta Urban Agglomeration. Sustainability 2023, 15, 13329. [Google Scholar] [CrossRef]
- Zeng, C.; Liu, Y.; Stein, A.; Jiao, L. Characterization and spatial modeling of urban sprawl in the Wuhan Metropolitan Area, China. Int. J. Appl. Earth Obs. Geoinf. 2015, 34, 10–24. [Google Scholar] [CrossRef]
- Peng, X.; Luo, X.; Li, J. Meaning construction and judicial identification: Difficulties and countermeasures of criminal regulation of illegal fundraising behavior on online P2P lending platforms. Int. J. Leg. Discourse 2019, 4, 47–68. [Google Scholar] [CrossRef]
Disclaimer/Publisher’s Note: The statements, opinions and data contained in all publications are solely those of the individual author(s) and contributor(s) and not of MDPI and/or the editor(s). MDPI and/or the editor(s) disclaim responsibility for any injury to people or property resulting from any ideas, methods, instructions or products referred to in the content. |
© 2023 by the authors. Licensee MDPI, Basel, Switzerland. This article is an open access article distributed under the terms and conditions of the Creative Commons Attribution (CC BY) license (https://creativecommons.org/licenses/by/4.0/).