Article

Impacts of Grazing on Vegetation and Soil Physicochemical Properties in Northern Yinshan Mountain Grasslands

1
Yinshanbeilu National Field Research Station of Steppe Eco-Hydrological System, China Institute of Water Resources and Hydropower Research, Beijing 100038, China
2
River and Lake Protection Center of Ordos, Ordos 017010, China
3
Weather Station of Ordos, Ordos 017010, China
*
Authors to whom correspondence should be addressed.
Sustainability 2023, 15(22), 16028; https://doi.org/10.3390/su152216028
Submission received: 14 September 2023 / Revised: 13 November 2023 / Accepted: 14 November 2023 / Published: 16 November 2023
(This article belongs to the Special Issue Agricultural and Natural Ecosystems Restoration after Disturbances)

Abstract

:
The grasslands at the northern foot of the Yinshan Mountains are an integral component of the northern grassland ecosystem in China. The ecosystem in this region has low stability and poor resistance to disturbance. In this study, experiments were conducted to evaluate the possible changes in vegetation community structure and soil physicochemical properties due to overgrazing in the grasslands. Completely randomized group experiments were designed with grazing intensity as the single-factor study was conducted using natural grassland located in Xilamuren (in Inner Mongolia, northern China) as the study area. Three blocks were created, each having four plots of different grazing intensities and each block having an area of 100 m × 100 m. The experiments were conducted to evaluate the possible variances both in the structure of the vegetation community and the soil physicochemical properties resulting from overgrazing in the grasslands at the northern foot of Yinshan Mountain. The results were as follows: The importance values of dominant species, such as Heteropappus altaicus and Artimisia gmelinii, exhibited varying degrees of change with an increase in the grazing intensity. The surface vegetation cover decreased significantly with an increase in the grazing intensity. The increasing grazing intensity led to a significant increase in the content of very coarse sand grains in the soil. Severe grazing increased the exposed surface area, intensified the effects of blowing wind and scouring action of water, and led to the coarsening of topsoil particles. At 0–5 cm depth, the bulk density of soil exhibited an increasing tendency with an increase in the grazing intensity. The organic matter content of the soil in the heavily grazed plots decreased by 11.74%, 11.00%, and 14.08%, respectively, when compared to that in the 0–40 cm soil layer with no grazing, light grazing, and moderate grazing. The results emphasized the importance of managing grazing intensity for soil and vegetation restoration. Thus, the effects of short-term grazing (for example, 5 years) on vegetation community composition and species diversity may be less pronounced. This study contributes to our understanding of pasture management and the restoration of grassland species diversity.

1. Introduction

Grassland is a terrestrial ecosystem with perennial herbaceous plants as the major producers, and it has both production and ecological functions. Thus, grasslands not only provide natural resources for human survival and development but also perform several ecological functions, such as soil and water conservation and biodiversity preservation [1]. Grasslands have been extensively exploited in the past decades due to more focus on the production value, mineral value, and recreational value of grasslands [2]. In other words, relatively fewer emphases have been laid on the ecological value of grasslands. Particularly, humans have not given enough importance to the ecohydrological and soil conservation functions played by the grasslands as natural systems [3]. More than 80% of the global grasslands are situated in semi-arid and arid areas, where the water cycle is significantly influenced by substrate conditions and climate. The regional rainfall–infiltration–runoff–evaporation water cycle also comprises minor processes within the eco-hydrological cycle of the soil–vegetation complex system [4]. Water is a critical factor for maintaining ecosystems in semi-arid and arid areas. Over the past few years, alterations in the number of water resources and their spatiotemporal distribution caused by climate change have further accentuated the spatial mismatch between water resources and productivity in semi-arid and arid areas [5,6]. The rising population pressure and the continuous exploitation of soil and water resources have led to a decrease in grassland productivity, degradation of ecohydrological function, and land desertification. According to the relevant statistics, the total output value of China’s livestock industry has been steadily increasing at a mean rate of 7% per annum since the 21st century [7,8]. However, the area of natural grassland degradation in China is increasing at an annual rate of 2 million ha. According to the First National Water Conservation Census Soil and Water Conservation Bulletin, China’s total soil loss area is 2,449,100 km2. In addition, the soil loss area in China’s major grasslands in pastoral regions is 2,299,900 km2, accounting for 77.99% of the national soil loss area [9]. It is evident that soil erosion in grasslands has become a significant concern that restricts the development of a high-quality regional livestock economy.
The northern grassland, located north of the Yinshan Mountains in China’s Inner Mongolia, has a specific geographical location and forms a major part of the arid and semi-arid ecosystems. It is both a transition zone from the Yinshan Mountains to the Mongolian Plateau and a transition area from a semi-arid to an arid zone climate [10]. The ecosystem stability in this region is low, with poor resistance to disturbance and slow recovery after disturbance. However, this region is one of the most important bases of modern animal husbandry in China. Natural and anthropogenic factors, including agricultural reclamation, high-intensity industrial development, and frequent production and construction activities have led to the severe sanding of pastures. In the past 30 years, domestic and foreign researchers have conducted several studies on ecohydrology and soil erosion control in desert grassland areas to elucidate the effect of grazing on vegetation succession-related processes. Previous studies have revealed the cycling patterns of the elements in the ecosystem, such as carbon, nitrogen, and water, and elucidated the mechanisms of wind erosion and nutrient transport in grassland soils [11,12]. Livestock grazing and human use in continuous grazing areas result in surface soil hardening and induced soil erosion. Another opinion is that grazing could increase the microbial content. It is beneficial to supply consistent nutrition in the middle-to-late growth stage of plants when more organic matter is decomposed by stronger microbial activity [13,14,15]. However, relatively few studies have been conducted to address the differences in grassland vegetation and the grazing-influenced mechanism of coarse-grained soil. The rainfall in the northern Yin Mountain grasslands is unevenly distributed throughout the year, with frequent heavy rainfall in the region. Therefore, surface runoff often leads to floods within a short time, and erosion gullies of different morphologies are formed on the grassland slopes. In addition, the hazards caused by erosion are becoming increasingly serious [16].
Most of the previous studies on reasonable grassland carrying capacity were based on the growth and development needs of livestock and the limitations of grassland productivity [17] but ignored the potential effects of overgrazing on grassland productivity. In this context, this study investigated the Xilamuren grassland of Inner Mongolia, the study area, which is located in the north of the mountains. The test plots with varying grazing intensities were established. Moreover, both field investigations and indoor experiments were undertaken to study the influences of grazing on surface plant communities and soil physicochemical features in a grassland. Overall, the findings of this study can inform holistic grassland use and the formulation of a sustainable development policy.

2. Material and Methods

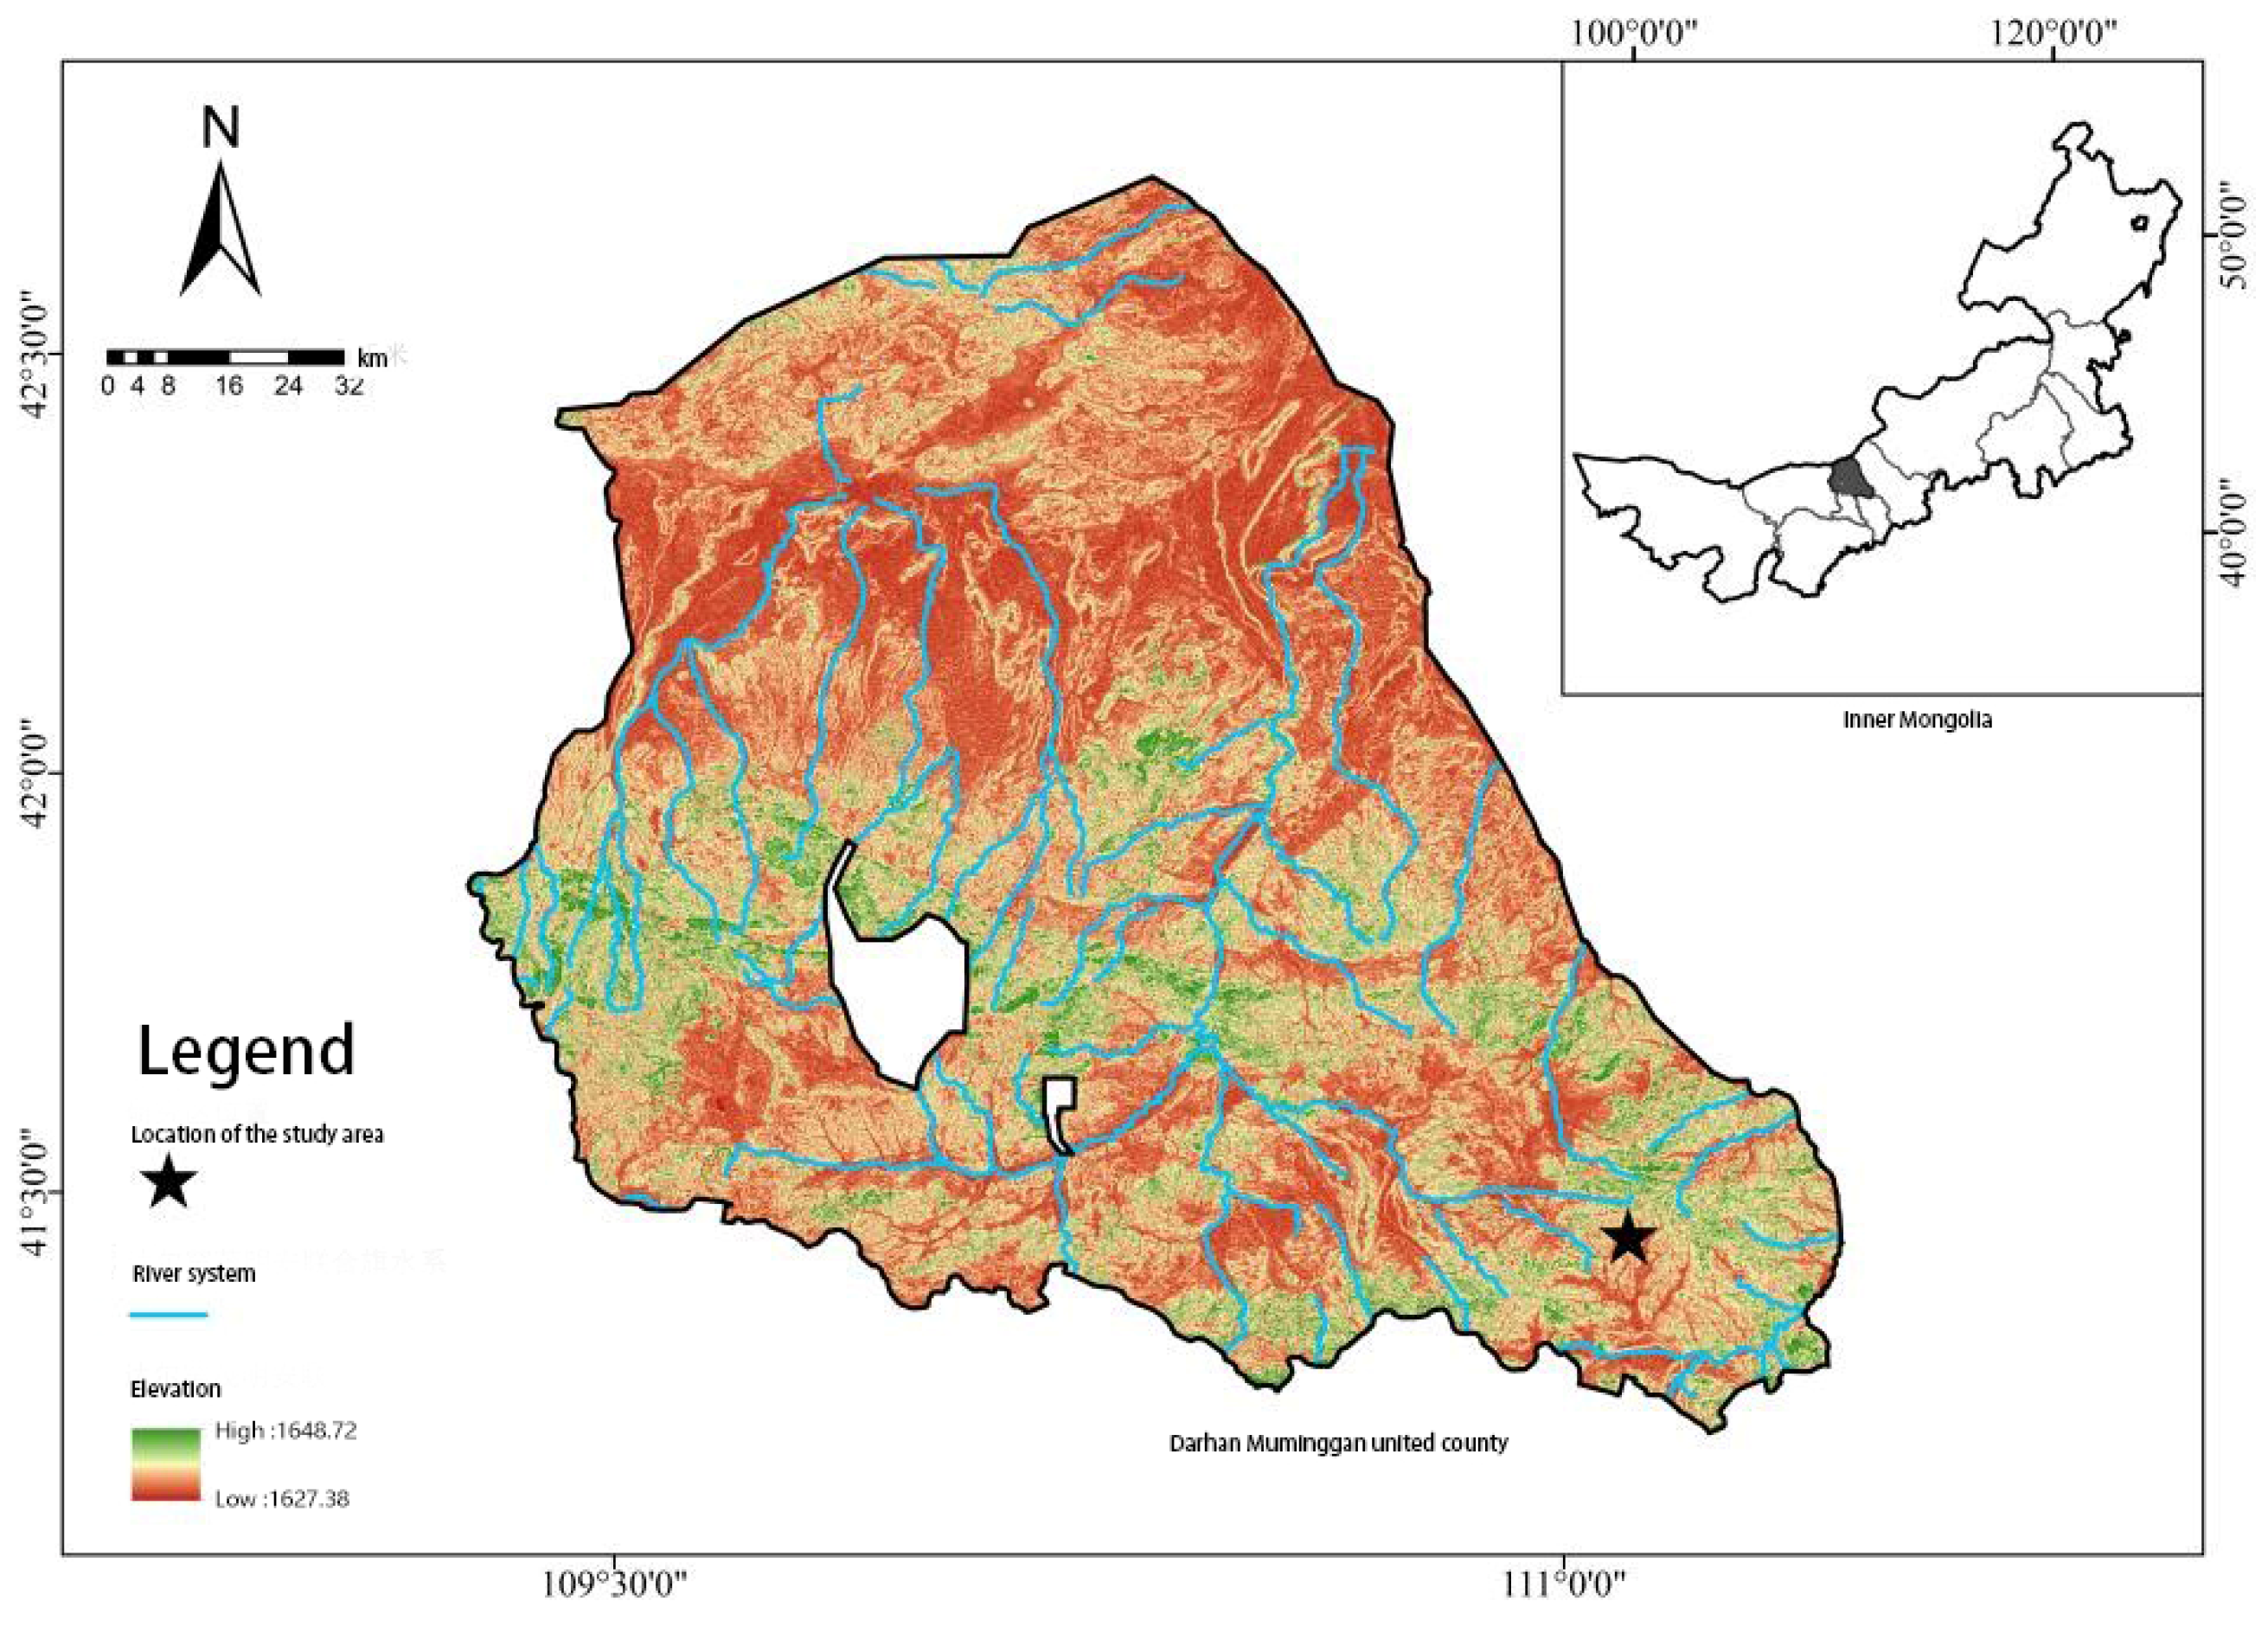
2.1. Research Area Overview

The test area is situated in the Xilamuren Grassland, Zaohe Town, Dalhan Maomingan United Banner, Baotou City, Inner Mongolia (Figure 1), with geographic coordinates of 41°12′–41°31′ N, 111°00′–111°20′ E. The landscape is low with gentle hills and slopes ranging from 3° to 5°. Possessing a temperate semi-arid continental climate, the region has a mean precipitation of 283 m per annum (precipitation mainly ranging from July to September). In addition, the multi-year average wind speed is 4.5 m/s, dominated by north and northwest winds mainly concentrated in March–May. The zonal soil in the test area is chestnut calcium soil, with an effective soil layer having an average thickness of 40 cm and 20–40 cm of calcium accumulation layer below, with exposed bedrock in local areas. The vegetation community in the test area is dominated by perennial and dry herbaceous plants such as Stipa krylovii, Cleistogenes squarrosa, Convolvulus ammannii, and Heteropappus altaicus.

2.2. Experiment Design

2.2.1. Sample Plot Setup

After conducting a thorough background investigation, which included assessing grazing capacity and grass yield, the Hiramuren grassland emerged as the most representative research area. Hiramuren grasslands are natural grasslands, with consistent topography and soil conditions that have not been grazed for a long time. A completely randomized block test was designed with grazing intensity as a single factor. Three zones were chosen, each with four plots having different grazing intensities. Each plot covered an area of 100 m × 100 m. The sample plots were constructed in 2016, and the gradients of grazing in this study were set following the Chinese agricultural industry livestock carrying capacity standards. For this purpose, previous studies [18,19] on the livestock-carrying capacity of desert grasslands in Inner Mongolia were referred. The actual grazing conditions in the study area included heavy grazing (HG, three sheep units/hm2), moderate grazing (MG, two sheep units/hm2), light grazing (LG, one sheep unit/hm2), and no grazing (CK, 0 sheep units/hm2). The actual grazing time of the local herders was from May to October due to the unique climatic conditions in the study area. This study adopted the same grazing system as the local herders to ensure the representativeness and accuracy of the study methods. The sheep were supplied with food from 7 a.m. till 7 p.m. and then driven back to the sheep pens for rest. In addition, once designated, the sheep in each plot were not replaced.

2.2.2. Vegetation Survey and Methods

Three fixed sample strips for vegetation survey were set up in each grazing plot along the vertical contour direction. The vegetation survey was conducted from June to September 2021, and 11 quadrats (1 m × 1 m) were randomly selected at each sample strip. A total of 132 sample squares were surveyed. The sample cover was evaluated in detail during the vegetation survey. In addition, the height, cover, and multiplicity of species within the sample plots were measured, followed by flush mowing. The above-ground biomass obtained during the survey was transported to the lab, dried at 65 °C for 24 h, and weighed. The natural height of the vegetation was measured with a straightedge, and the vegetation cover was visually measured. Finally, the number of plants per unit area was recorded. We also referred to the studies and the Flora of China for the identification of the vegetation species.

2.2.3. Soil Sampling and Determination Methods

In this study, the maximum sampling depth was set at 40 cm because the roots of herbaceous vegetation in the experimental area were mainly concentrated at 0–30 cm soil depth. The soil sampling was conducted along with the vegetation survey. The soil sampling points were randomly and uniformly chosen around the vegetation sampling points. Thus, nine sampling points were chosen for every plot. Subsequently, the samples were collected from 30–40 cm, 20–30 cm, 10–20 cm, 5–10 cm, and 0–5 cm, using ring knives and aluminum boxes. For the determination of soil moisture, three samples were collected from each of the sampling points, mixed, and placed within the indoor environment for shade drying. Thus, a total of 180 soil samples were collected. The ring knife method was adopted to determine the bulk weight of soil [20]. The soil particle size was determined by a Malvern laser particle size diffractometer and classified according to the USDA particle size classification system.
Simultaneously, a soil infiltration survey was conducted around the vegetation sampling points to complement the vegetation sample survey. Soil infiltration rate and stabilization rate were measured using a homemade double-ring method. These rings were 30 cm high and 2 mm thick, with an inner infiltration ring diameter of 0.30 m and an outer ring diameter of 0.60 m. Both the rings had a height of 0.20 m [21]. The vegetation and dead matter debris on the flat surface were cleaned before the measurement. Later, the double rings were driven smoothly into the soil to ensure that the exposed soil surface height was 15 cm. The outer ring was provided with water to facilitate the downward flow of water from the inner ring once the test commenced. The infiltration time of the same height (1 cm) of water was recorded during the measurement. If more than five consecutive values of time taken for infiltration of water are the same, it indicates the steady state of the soil. The steady infiltration rate is the mean value of these five infiltration rates.

2.3. Test Methods for Soil Chemical Properties

Subsequently, the chemical properties of the soils were determined. Briefly, the treated air-dried soils were passed through 2 mm and 0.149 mm soil sieves for nutrient determination. The total soil nitrogen was determined using the semi-micro Kjeldahl method [22]. The sulfuric acid–perchloric acid–molybdenum–antimony anti-spectrophotometric method was employed to determine the total soil phosphorus [23]. The soil’s total potassium was analyzed using the alkali fusion-flame photometric method [24]. The soil organic matter was determined using the potassium dichromate–sulfuric acid digestion method [25].

2.4. Data Processing and Statistical Analysis

The alpha diversity index was employed to assess vegetation diversity. Shannon–Wiener diversity index, Patrick species richness index, Pielou evenness index, and Simpson dominance index were selected for analysis and are given by the following equations.
Patrick   species   richness   index :   S
Simpson   dominance   index :   S P = 1 P i 2
Shannon - Wiener   diversity   index :   H = P i I nP i
Pielou   evenness   index :   J sw = H / I n S
P i = N i / N with Ni representing the importance value of the ith plant in the sample, N indicating the sum of the importance values of the plants within the sample, and S representing the number of species within the sample plot.
The importance value is calculated as
Importance   value = ( R C + R H + R A ) / 3
R C = t h e   c o v e r a g e   o f   a   s p e c i e s s u m   o f   t h e   c o v e r a g e   o f   a l l   s p e c i e s
R H = t h e   h e i g h t   o f   a   s p e c i e s s u m   o f   t h e   h e i g h t   o f   a l l   s p e c i e s
R A = t h e   a b u n d a n c e   o f   a   s p e c i e s s u m   o f   t h e   a b u n d a n c e   o f   a l l   s p e c i e s
In this study, the statistical analysis was conducted using SPSS 24.0 software. The data on ecological indicators of vegetation communities, soil capacitance, and soil infiltration features at varying grazing intensities were subjected to one-way ANOVA, with the F-test and p-value used to assess statistical significance. Subsequently, the LSD approach was used for multiple comparisons.

3. Results

3.1. Effect of Grazing on the Composition of Vegetation Community and Importance Values

The seven dominant species in the study area were Heteropappus altaicus, Carex duriuscula, Stipa krylovii, Cleistogenes squarrosa, Artimisia gmelinii, Agropyron cristatum, and Convolvulus ammannii (Table 1). In ungrazed natural grasslands, the importance values of these seven species were 24.90%, 14.75%, 14.28%, 12.15%, 12.15%, 11.74%, and 10.65%, respectively. With the increase in grazing intensity, the importance value of Heteropappus altaicus decreased from 24.90% to 9.88%, and that of Artimisia gmelinii decreased from 12.15% to 4.93%. Artimisia gmelinii was no longer present in plots subjected to heavy grazing. The importance values of three species, namely, Stipa krylovii (increased from 14.28% to 18.45%), Cleistogenes squarrosa (increased from 12.15% to 18.08%), and Agropyron cristatum (from 11.74% to 16.33%), exhibited an increasing trend with the increasing grazing intensity. Although the importance value of each dominant species varied by different degrees at different grazing intensities, there was no significant change in the position of each dominant species relative to the other within the community. On the other hand, the increasing grazing intensity altered the original habitat conditions or competitive relationships. Species such as Arenaria juncea, Iris tenuifolin, Haplophyllum dauricum, Ptilotrichum canescens, and Iris lactea, which were present in the ungrazed sample sites, were no longer present in the HG sampling sites. Some species that were never observed in the ungrazed plots appeared in the HG plots, such as Potentilla bifurca, Potentilla betonicaefolia, Sonchus brachyotus, Youngia tenuicaulis, and Caragana stenophylla.

3.2. Effect of Grazing on the Vegetation Community Characteristics

The direct target of grazing is vegetation. Therefore, the influence of grazing on vegetation can be visually characterized by vegetation cover, height, biomass, and diversity indicators. Table 2 shows the community characteristics of the ecological indicators of vegetation at different grazing intensities. The vegetation cover of the ungrazed sample site was 43%. The light grazing intensity had relatively little effect on vegetation cover, with the cover remaining unchanged (41%). However, with the increasing grazing intensity, there was a significant decline in surface vegetation affected by livestock foraging. Therefore, the vegetation cover showed a significant decreasing trend. The surface cover of HG land was only 30%. The effect of grazing on plant height was more intuitive. The mean vegetation height in the grazed plots decreased by about 50% when compared to that in the non-grazed plots (10.35 cm). No obvious differences in vegetation height were observed between the light and moderately grazed plots. Grazing also had a significant effect on the plant biomass above the ground. Plant biomass was significantly lower in the grazed plots (38.19–49.89 g) than in the ungrazed plots (86.97 g). In terms of alpha species diversity, grazing significantly altered the species richness of the grassland. Moderate and light grazing may result in a slight decrease in species richness. When livestock numbers were lower, livestock foraging was more biased towards habitat preferences, leading to repeated feeding on individual species. On the other hand, heavy grazing may result in a slight increase in species, which is related to the change in the original vegetation cover structure due to heavy grazing, ultimately leading to changes in the original competitive relationships and an increase in the species numbers. However, it is impossible to accurately determine the effects of grazing on the biodiversity of grassland based on the number of species alone. In terms of the evenness of species distribution, no obvious differences were observed between the Shannon–Wiener and Pielou indices. Generally, the variation in the Simpson index within the community was not significant. In addition, the dominant species in the community played a significant role. Thus, grazing significantly affected the growth status of surface vegetation during its 5-year duration, thereby altering the vegetation cover and grass production in the region. However, grazing did not exert an important influence on species diversity.

3.3. Influence of Grazing on the Surface Soil Composition

The destruction of the surface vegetation resulted in the direct exposure of the soil layers beneath the ground surface. In this study, surface soils (5–10 cm and 0–5 cm) from each plot subjected to different grazing intensities were sampled for soil particle size analysis (Table 3). According to the U.S. standard particle classification system, the mechanical composition of the soil (<2 mm-size fraction) includes clay particles (particle size < 0.002 mm), fines (particle size 0.002 to <0.05 mm), very fine sand (0.05 to <0.10 mm), fine sand (0.10 to <0.25 mm), medium sand (0.25 to <0.5 mm), coarse sand (0.5 to <1 mm), and very coarse sand (1 to <2 mm). In the study area, the soil was predominantly sand grains (about 45–70%), followed by meal grains and clay grains (3%). The fraction of very coarse sand grains in the soil was enhanced significantly with the increasing grazing intensity. The very coarse sand fraction was only 1.22% in the non-grazed sample but 11.80% in the HG sample (an increase of nearly ten times). The increasing grazing intensity led to an overall increasing trend of the coarse and medium sand fractions, with their values increasing from 6.86% and 9.93% to 15.10% and 14.63%, respectively. Overall, a trend of MG > LG > HG was observed. The fractions of fine and very fine sand grains showed an overall decreasing trend, with their values decreasing from 16.17% and 17.41% to 14.10% and 13.50%, respectively. Overall, a trend of MG < HG < LG was observed. The overall trend of powder content decreased significantly with the increasing grazing intensity. The soil powder content was 45.61% in the CK sample and 39.10% in the LG sample (a decrease of 6.51%). The content of fines was 37.53% in the MG sample, a decrease of 8.08% compared with that in the CK sample. In addition, the powder content of the HG sample was 36.33%, i.e., 9.28% lower than that in the CK sample. The clay particles accounted for a relatively small proportion of soil collected from each location. However, the clay particle fraction demonstrated a decreasing trend (2.80% to 1.85%) with increasing grazing intensity. Thus, grazing can alter the composition of the topsoil. Grazing can lead to significant changes in the growth of surface vegetation, thereby affecting the ground cover. In addition, severe grazing can increase the exposed surface area and intensify the effects due to blowing wind and the scouring action of water, leading to the coarsening of topsoil.

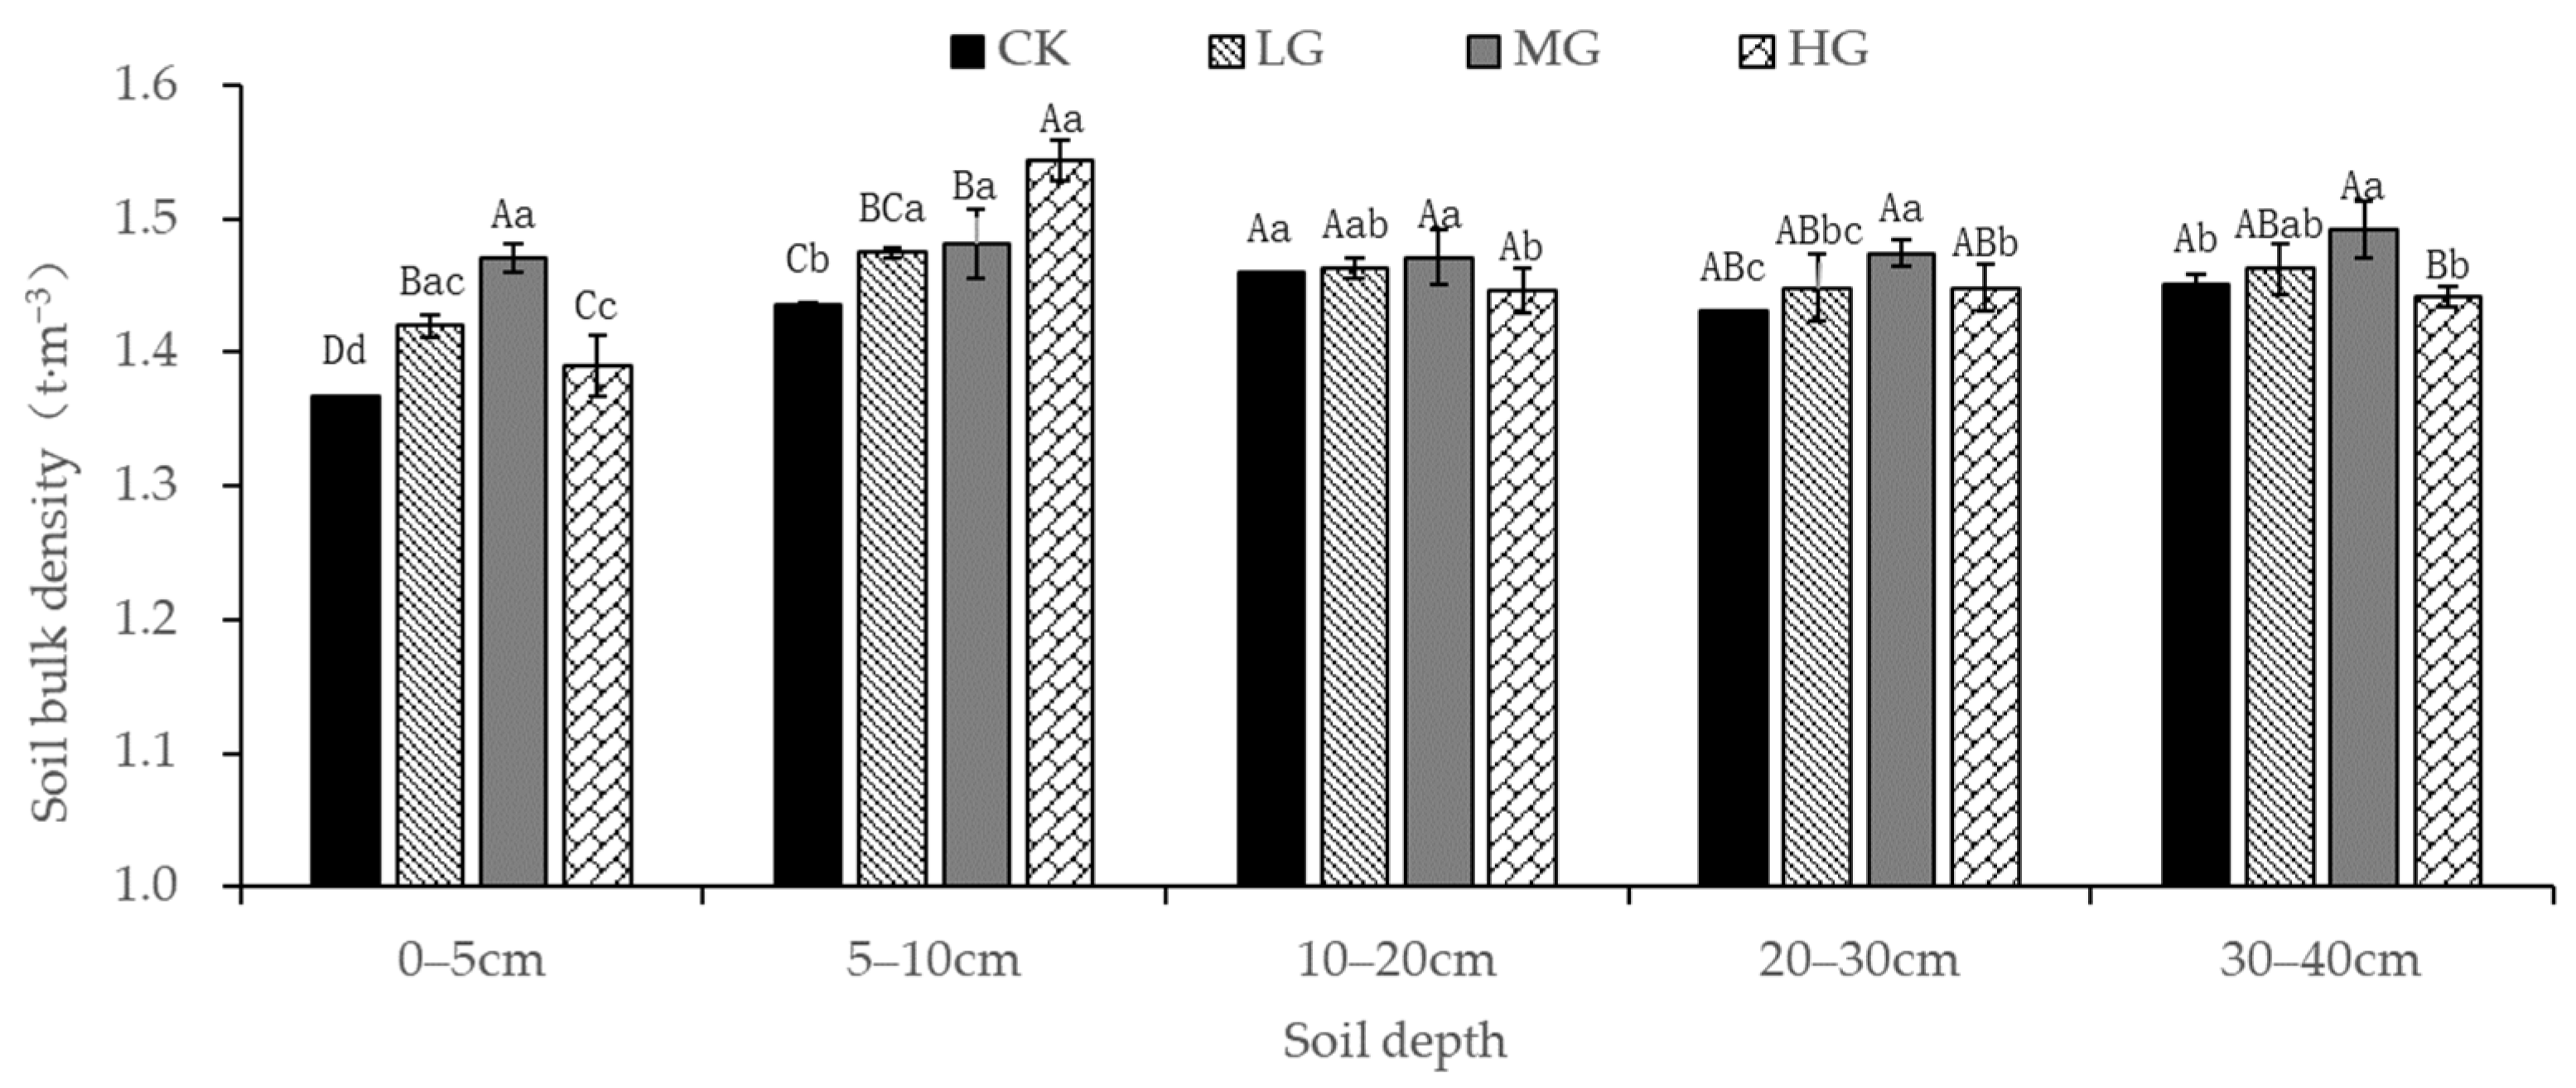
3.4. Influence of Grazing on the Soil Bulk Density

As previously shown, livestock trampling in continuous grazing areas results in surface soil slumping. To verify this, the bulk density and porosity of soil samples from plots subjected to different grazing intensities were measured in this study. In the study area, the soil bulk density ranged from 1.37 to 1.54 t·m3 (Figure 2). At a soil depth of 0–5 cm, an increase in grazing intensity increased the soil bulk density from 1.37 to 1.47 t·m−3. However, the soil bulk density of 1.39 t·m−3 in the HG sample site may be related to the coarse-graining of the topsoil following the destruction of vegetation. Compared with CK soil, the content of very coarse sand in HG soil was 11.80%, i.e., an increase of 10.58%. The increase in the coarse particle fraction may have led to an increase in the soil pore content, leading to reduced bulk density. However, it may also be related to the foraging behavior of livestock. As the plant species with good palatability may be dispersed in any location, the livestock trampled area is also random and dispersed. At a depth of 5–10 cm, the soil bulk density of the grazing plots still significantly exceeded that of the CK plots. The density of HG plots (1.54 t·m−3), as well as LG and MG sample plots (1.47 and 1.48 t·m−3, respectively), was not significantly different. At a soil depth of 10–20 cm, no obvious difference in the bulk density among the grazing plots (1.45 to 1.46 t·m−3) was observed. The bulk density did not show a significant variational trend among the grazing plots with an increase in soil depth. Therefore, the grazing effect only had a certain degree of impact on the soil bulk density. However, this effect was mainly observed at a soil depth of 0–10 cm. Particularly, heavy grazing intensity may cause anomalies in the bulk density at a depth of 0–5 cm. However, the influence of grazing intensity on the bulk density of the soil layers below 10 cm was limited.

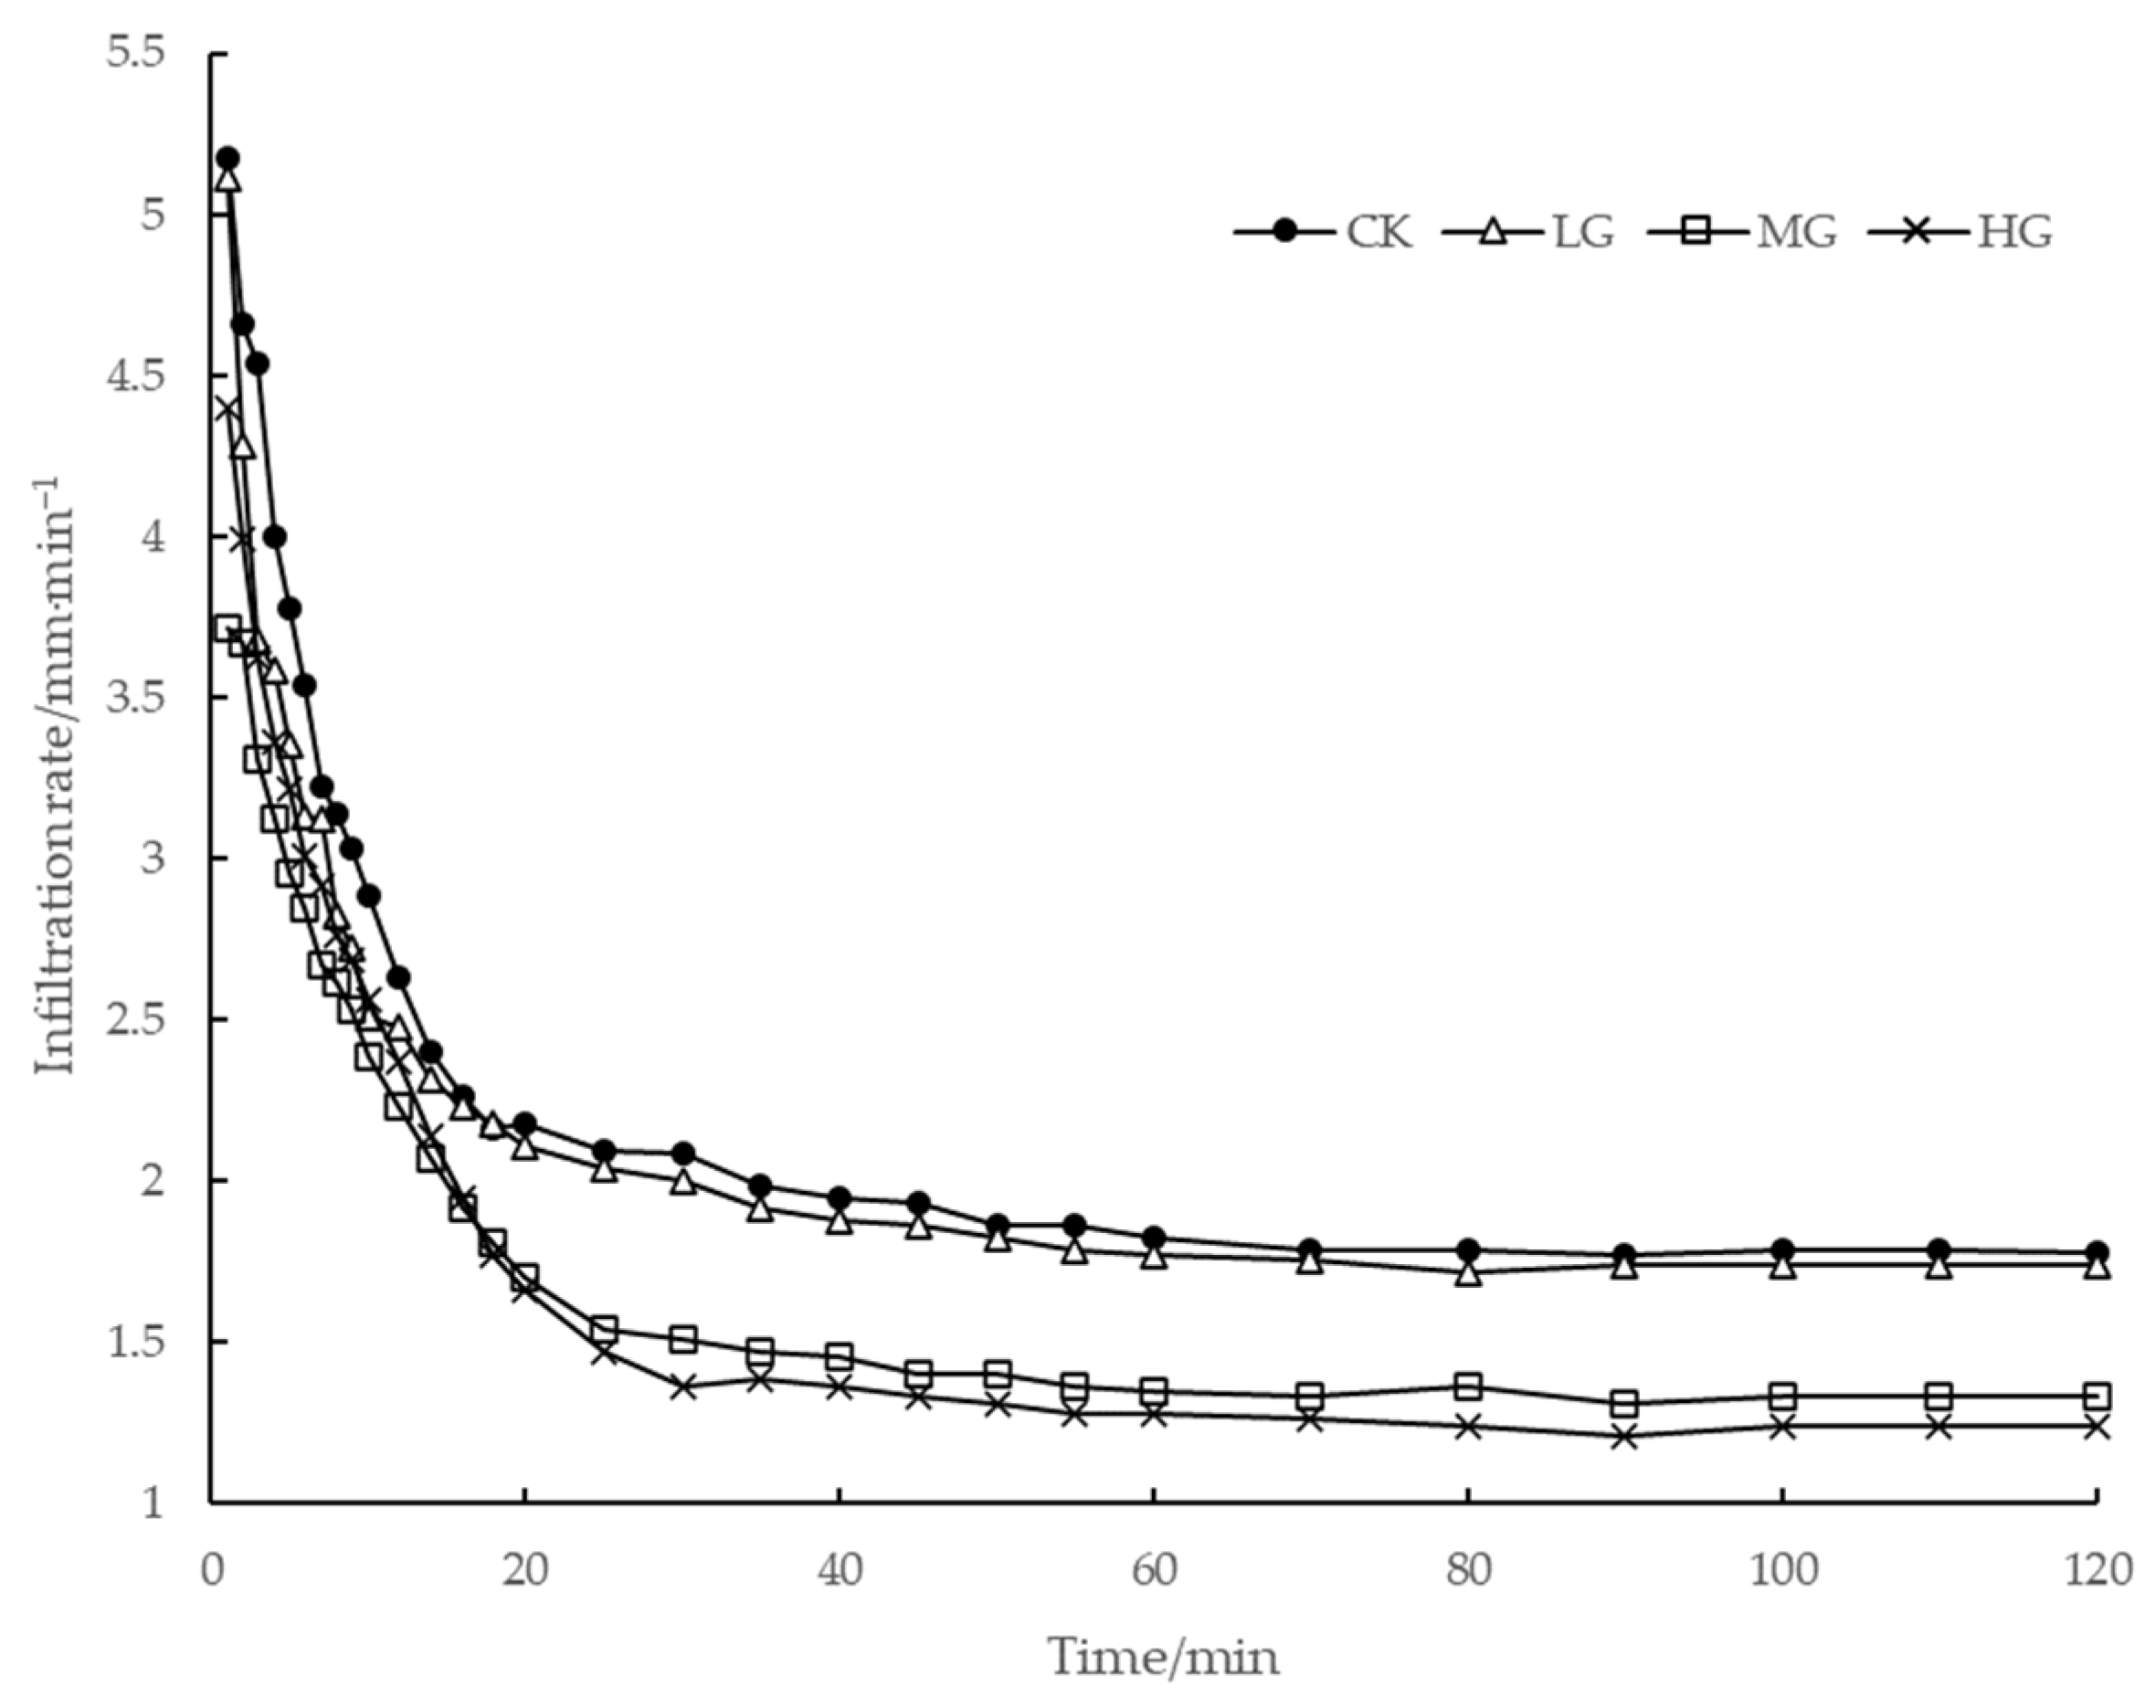
3.5. Influence of Grazing on the Soil Infiltration Performance

Figure 3 illustrates the soil infiltration process at different grazing intensities. A decrease in soil infiltration rate in plots subjected to different grazing intensities exhibited an approximate L-shaped curve, demonstrating a rapid initial infiltration, a sudden decline in the infiltration rate at 0–18 min, a fluctuating decline in the infiltration rate at 18–60 min, and a stable infiltration rate after 60 min. In addition, the curves can be broadly grouped into two categories: (1) CK plots and LG plots. The infiltration curves of both plots were close to each other and followed a similar pattern. The time taken for the initial infiltration (0–14 min) in both plots was almost the same. However, the steady infiltration rate in the CK plot was slightly higher than that in the LG plot. (2) HG and MG plots. Both plots had similar infiltration patterns. However, the time required for the initial infiltration in these two plots was reduced by 4–6 minutes compared to that in the CK and LG plots. The time required to reach the stable infiltration stage in HG and MG plots was close to that of CK and LG plots. The primary rate of infiltration in the HG plot exceeded that in the MG plot, while the curve of the stable infiltration stage was lower than that in the MG plot. The initial infiltration rate of soil at different grazing intensities ranged from 3.71 to 5.17 mL/min (Figure 4), with the highest initial infiltration rate (5.17 mL/min) in the CK sampling site. The initial infiltration rate in the CK sampling site does not differ significantly from that in the LG sampling site, while the lowest initial infiltration rate of 3.17 mL/min was observed in the MG sampling site. The steady infiltration rate of soil at different grazing intensities ranged from 1.24 to 1.76 mL/min, with the highest steady infiltration rate (1.76 mL/min) in the CK sampling site. The average infiltration rates in LG and CK obviously exceeded those in HG and MG. Therefore, it can be stated that light grazing does not have a significant influence on the soil infiltration performance. However, moderate grazing intensity and high grazing intensity significantly reduced the initial and steady infiltration rates, leading to a reduced overall soil infiltration capacity, making the surface more susceptible to runoff.

3.6. Effect of Grazing on the Soil Nutrients

Figure 5a shows the variational trend in the soil organic matter content, which ranged from 18.86 to 30.89 g/kg. The mean soil organic matter in the CK sampling site (27.79 g/kg) significantly exceeded that in the grazed sampling site, while the mean soil organic matter in the HG sampling site was the lowest (23.98 g/kg). Additionally, the difference in organic matter content between MG and LG was not significant. Considering the vertical profile, the soil organic matter was relatively high (27.67–30.89 g/kg) at a soil depth of 5–10 cm. However, the soil organic matter exhibited a decreasing trend with increasing soil depth, and the lowest value was observed at 30–40 cm. Moreover, the organic matter content in the CK plots significantly exceeded that in the grazed plots across all soil depths. The HG plots always had lower organic matter levels. The organic matter content at 0–40 cm was reduced by 11.74%, 11.00%, and 14.08% in the LG, MG, and HG samples when compared with that in the no-grazing sample. This is because of the reduction in surface biomass due to grazing, resulting in insufficient organic matter sources.
The total nutrients in the soil indicate the turnover of soil organic matter. The total soil nitrogen content in the study area ranged from 0.94 to 1.58 g/kg (Figure 5b). The mean value of total soil nitrogen in the CK sample (1.36 g/kg) significantly exceeded that in the grazed samples, while the lowest mean value was observed in the HG sample (1.20 g/kg). However, no significant difference was observed in the total soil nitrogen of the MG and LG samples. In terms of vertical profile, total soil nitrogen was relatively higher at 5–10 cm (1.43–1.58 g/kg). With the increasing soil depth, the total soil nitrogen in all the sampling sites exhibited a decreasing trend, and the lowest value was observed at 30–40 cm. The total soil potassium in the study area ranged between 19.10 and 25.63 g/kg. The mean value of the total soil potassium in the CK sample (24.91 g/kg) significantly exceeded that in the grazed sample, while the lowest mean value was observed in the HG sample (19.66 g/kg). No significant difference in the total soil potassium was observed between MG and LG samples. Considering the vertical profile, total soil potassium was relatively higher at 0–5 cm (20.66–25.63 g/kg). With the increasing depth, the total potassium content of the soil at all the sampling locations exhibited a decreasing trend, with the lowest value observed at 30–40 cm. The total soil phosphorus content in different soil layers of each grazed sampling site ranged from 0.36 to 0.63 g/kg. Overall, the total phosphorus content exhibited a decreasing tendency with increasing soil depth. However, the total soil phosphorus content did not exhibit a significant trend with depth.

4. Discussion

Livestock foraging caused by grazing disturbances directly affects the growth and development of surface plants. Livestock foraging practices influence the composition, structure, as well as diversity of the species in the community, indicated by changes in the community biomass [26]. Continuous overgrazing leads to the destruction of the vegetation structure, resulting in a significant decrease in the grassland community cover, height, and above-ground biomass, alterations in grassland plant species composition, and a decrease in biodiversity and richness [27,28]. The findings of this study revealed that a higher grazing intensity led to an increase in the richness index from 8.91 to 9.64, a decrease in biomass from 86.97 g to 42.15 g, and a decrease in the cover from 43% to 30%. The following findings were observed from the preliminary investigation and experiments on the relative cover of subspecies at each sampling site with different grazing intensities: (1) the increasing livestock grazing intensity led to a reduced preference for the plant species, such as Agropyron cristatum, Leymus chinensis, Cleistogenes squarrosa, and Stipa krylovii, as well as plant dwarfing; and (2) the number and cover of plant species with poor palatability and indicator species of grassland succession, such as Convolvulus ammannii and Artimisia frigida, exhibited an increasing trend with increasing grazing intensity. Grazing led to an increase in the species richness index, as well as an overall decrease in the biomass and cover within the sampling plots subjected to different grazing intensities. Numerous studies have confirmed that livestock grazing and the over-trampling of grasslands led to community fragmentation and miniaturization [29,30,31]. With the increase in grazing intensity, the community biomass above ground decreased rapidly, thereby affecting vegetation composition, growth, and reproduction, and leading to changes in the grassland environment, soil structure, and nutrients [32,33,34]. As a result, some plant species demonstrate under-compensatory growth due to reduced light energy utilization, which eventually restricts the normal growth of plants [35,36,37]. This leads to reduced vegetation cover, height, and biomass. However, moderate disturbance inhibits the competition of dominant species for environmental resources and provides opportunities for invasive plant species, especially driving the growth of pre-existing species [38]. Therefore, these new species can survive in moderately disturbed environments, leading to improvements in the species richness index of that environment [39,40].
Grazing altered the degree of soil compaction, thereby affecting soil runoff processes and erosion rates [41]. Significant differences in the bulk density, porosity, and saturated hydraulic conductivity of grasslands were observed at different grazing intensities. The grazed areas had higher bulk densities than the ungrazed areas and were prone to surface consolidation and runoff. Most studies on the soil infiltration processes in grasslands have revealed that the status of vegetation cover affected soil infiltration rates. Overgrazing significantly affected all factors that were highly sensitive to grazing effects, such as soil infiltration processes, soil water holding capacity, saturated hydraulic conductivity, and soil bulk density. Significant differences between the soil infiltration and the flow and transport processes in soil were previously observed under continuous long-term grazing and rotational grazing treatments [42]. Bare patches were often found on the surface of HG plots. The perennial windy environment of the grassland, the loss of heavy clay particles, and severe soil coarsening further reduce the soil water-holding capacity [43,44]. With the increasing grazing intensity, the cumulative effect of continuous livestock trampling exhibited a tendency for soil compaction, resulting in reduced soil hydraulic conductivity [45]. These factors eventually reduce soil infiltration performance and increase soil erosion. This study confirmed that the average infiltration rate (0.98 mm/min) was significantly lower in the HG sampling sites than in other sample sites.
Studies by Mary et al. revealed that the effect of livestock trampling altered the mechanical stability, porosity, and hydraulic and aeration functions of topsoil, which ultimately reduced the water infiltration rate [46,47,48,49,50]. According to Jinbo Li et al. [51], grazing exclusion can increase soil water content, with the longer exclusion time producing more significant effects, especially in the topsoil. It is evident that the infiltration processes that occur at the soil–grass interface are highly susceptible to the effects of grazing intensity. These effects vary across regions and grazing gradients, and the results from previous studies on this aspect are inconsistent. The alterations in soil physical properties in this study were mainly observed in the surface layer, which may be connected with the soil conditions and the grazing duration in the study area. In addition, this may also be related to the trampling intensity of the grazing objects considered in this study. The grazing object selected for the study was sheep, and the effect of the trampling force on the surface of the soil was transmitted towards the shallow soil layer only [52]. In addition, the same parent material of the deeper soils may lead to insignificant differences in the bulk density. Studies in similar areas have demonstrated that grazing can reduce soil nutrient and microbial enzyme activities, leading to declining soil quality, significant changes in herbaceous biodiversity, and an increasing abundance of invasive species [53,54]. As a result, the same conclusion has been drawn from this study.

5. Conclusions

This study showed that grazing had a significant influence on the vegetation community characteristics of north Yinshan Mountain grasslands. Grazing significantly altered the vegetation cover, biomass, and height, and also influenced the community species composition to a certain extent. Light grazing had a relatively minimal effect on the mechanical composition, infiltration performance, and nutrient content of the soil. However, heavy grazing led to the coarsening and compacting of grassland soils, as well as a reduction in the soil infiltration properties and nutrient content. This effect was most pronounced and direct in the top soil layer (0–10 cm). The effects of short-term grazing (i.e., 5 years) on vegetation community composition and species diversity may be less pronounced. This study contributes to our understanding of the pasture management and restoration of grassland species diversity.

Author Contributions

Data curation, Z.Y., P.M. and J.G.; funding acquisition, Y.Z.; methodology, P.M.; project administration, Y.Z.; validation, Z.Y., P.M., Y.Z. and J.G.; writing—original draft, Z.Y. and J.G.; writing—review and editing, Z.Y. All authors have read and agreed to the published version of the manuscript.

Funding

This study was supported by the Fundamental Research Funds for China Institute of Water Resource and Hydropower Research (MK2021J06), the National Natural Science Foundation of China (No. 42177347), the Major Science and Technology Projects of Inner Mongolia Autonomous Region (2021ZD0008), “Science for a Better Development of Inner Mongolia” Program of the Bureau of Science and Technology of the Inner Mongolia Autonomous Region (KJXM-EEDS-2020005), the Major Science and Technology Projects of Inner Mongolia Autonomous Region (2020ZD0009), and Yinshanbeilu Grassland Eco-hydrology National Observation and Research Station, China Institute of Water Resources and Hydropower Research (Grant NO.YSS202104).

Institutional Review Board Statement

Not applicable.

Informed Consent Statement

Not applicable.

Data Availability Statement

Data are contained within the article.

Conflicts of Interest

The authors declare no competing interest.

References

  1. Guo, Y.; Hou, L.; Zhang, Z.; Zhang, J.; Cheng, J.; Wei, G.; Lin, Y. Soil microbial diversity during 30 years of grassland restoration on the Loess Plateau, China: Tight linkages with plant diversity. Land Degrad. Dev. 2019, 30, 1172–1182. [Google Scholar] [CrossRef]
  2. Liu, M.; Dries, L.; Heijman, W.; Huang, J.; Zhu, X.; Hu, Y.; Chen, H. The Impact of Ecological Construction Programs on Grassland Conservation in Inner Mongolia, China. Land Degrad. Dev. 2018, 29, 326–336. [Google Scholar] [CrossRef]
  3. Guo, Q. Responses of grassland ecosystem productivity to altered precipitation regime: A review. Chin. J. Appl. Ecol. 2019, 30, 2201–2210. [Google Scholar]
  4. Wilcox, K.R.; Shi, Z.; Gherardi, L.A.; Lemoine, N.P.; Koerner, S.E.; Hoover, D.L.; Bork, E.; Byrne, K.M.; Cahill, J., Jr.; Collins, S.L.; et al. Asymmetric responses of primary productivity to precipitation extremes: A synthesis of grassland precipitation manipulation experiments. Glob. Chang. Biol. 2017, 23, 4376–4385. [Google Scholar] [CrossRef]
  5. Browning, D.M.; Maynard, J.J.; Karl, J.W.; Peters, D.C. Breaks in MODIS time series portend vegetation change: Verification using long-term data in an arid grassland ecosystem. Ecol. Appl. 2017, 27, 1677–1693. [Google Scholar] [CrossRef]
  6. Fay, P.A.; Kaufman, D.M.; Nippert, J.B.; Carlisle, J.D.; Harper, C.W. Changes in grassland ecosystem function due to extreme rainfall events: Implications for responses to climate change. Glob. Chang. Biol. 2010, 14, 1600–1608. [Google Scholar] [CrossRef]
  7. Wang, G.; Yang, C.; Wang, M. Measurement and Spatial Distribution of the Development Level of Animal Husbandry’s Modernization in China. J. Huazhong Agric. Univ. (Soc. Sci. Ed.) 2018, 6, 7–13+150–151. [Google Scholar]
  8. Shi, S.D. Output value and production situation of animal husbandry in China. China Anim. Husb. 2016, 14, 42–43. [Google Scholar]
  9. Ministry of Water Resources of the People’s Republic of China. Bulletin on soil and water conservation of the first national water conservancy census. Soil Water Conserv. China 2013, 11, 2–3. [Google Scholar]
  10. Ren, J. Pratacul Turalthesarus; Agricultural Press of China: Beijing, China, 2008; p. 851. [Google Scholar]
  11. Meng, Z.; Dang, X.; Gao, Y.; Ren, X.; Ding, Y.; Wang, M. Interactive effects of wind speed, vegetation coverage, and soil moisture in controlling wind erosion in a temperate desert steppe, Inner Mongolia of China. Arid Zone Sci. Engl. 2018, 10, 14. [Google Scholar] [CrossRef]
  12. Xu, A.; Xu, D.; Liu, J. Point pattern analysis of dominant populations based on null models in the desert steppe in Ningxia. Acta Ecol. Sin. 2020, 40, 4180–4187. [Google Scholar]
  13. Liao, H.; Tuvshintogtokh, I.; Guo, T.; Zhao, J. Effects of Grazing Exclusion on the Vegetation Community Composition and the Community Stability of Dry Steppe and Mountain Steppe Ecosystems in Mongolia. Acta Sci. Nat. Univ. Pekin. 2020, 56, 471–478. [Google Scholar]
  14. Donovan, M.; Monaghan, R. Impacts of grazing on ground cover, soil physical properties, and soil loss via surface erosion: A novel geospatial modeling approach. J. Environ. Manag. 2021, 287, 112206. [Google Scholar] [CrossRef] [PubMed]
  15. Wang, B.; Wu, L.; Chen, D.; Wu, Y.; Hu, S.; Li, L.; Bai, Y. Grazing simplifies soil micro-food webs and decouples their relationships with ecosystem functions in grasslands. Glob. Chang. Biol. 2020, 26, 960–970. [Google Scholar] [CrossRef] [PubMed]
  16. Hao, W.U.; Yang, T.; Gao, Y.; Yao, G.; Dang, X.; Zhang, G. Dynamic distribution characteristics of soil microorganisms under different grazing intensities in Stipa klemenzii desert grassland. J. Arid Land Resour. Environ. 2016, 30, 180–185. [Google Scholar]
  17. Guo, J.; Dong, Z.; Li, J.; Wang, H.; Liu, T. Effects of Grazing intensity on Soil Physical Properties and Soil Erosion and Sediment Yield in Desert Steppe. Chin. J. Grassl. 2019, 41, 74–82. [Google Scholar]
  18. Zhu, L.; Qin, F.; Yang, C.; Ma, X. Drive-Mechanism of Land Erosion in the Cross Redion Between Farmland and Grassland in Vinshan Mountain. Res. Soil Water Conserv. 2008, 15, 34–37. [Google Scholar]
  19. Xu, M. A review of grassland carrying capacity: Perspective and dilemma for research in China on “forage-livestock balance”. Acta Prataculturae Sin. 2014, 23, 321–329. [Google Scholar]
  20. Wang, M.J.; Ma, C.S. A study on methods of estimating the carrying capacity of grassland. Grassl. China 1994, 5, 19–22. [Google Scholar]
  21. Wei, Z.; Han, G.; Yang, J.; Lv, X. The Response of Stipa breviflora Community to Stocking Rate. Chin. J. Grassl. 2000, 6, 1–5. [Google Scholar]
  22. Clancy, K.; Alba, V.M. Temperature and Time of Day Influence on Double-Ring Infiltrometer Steady-State Infiltration Rates. Soil Sci. Soc. Am. J. 2011, 75, 241–245. [Google Scholar] [CrossRef]
  23. Bremner, J.M.; Tabatabai, M.A. Use of an ammonia electrode for determination of ammonia in Kjedahl Analysis. Commun. Soil Sci. Plant Anal. 1972, 3, 159–165. [Google Scholar] [CrossRef]
  24. Murphy, J.; Riley, J.P. A modified single solution method for determination of phosphate in natural waters. Anal. Chim Acta 1962, 27, 31–36. [Google Scholar] [CrossRef]
  25. Nelson, L.B.; Heidel, H. Soil Analysis Methods as Used in the Iowa State College Soil Testing Laboratory. Iowa State Coll. Agric. Bull. 1952, 57, 1–31. [Google Scholar]
  26. Keeney, D.R.; Nelson, D.W. Nitrogen-inorganic forms. In Methods of Soil Analysis, Part 2, 2nd ed.; Page, A.L., Miller, R.H., Keeney, D.R., Eds.; Agronomy Monograph; ASA and SSSA: Madison, WI, USA, 1982; Volume 9, pp. 643–698. [Google Scholar]
  27. Jiang, X.; Yang, Z.; Wang, G. The influence of disturbance on community structure and plant diversity of alpine meadow. Acta Bot. Boreali-Occident. Sin. 2003, 23, 1479–1485. [Google Scholar]
  28. Wang, M.J.; Zhao, M.L.; Cui, G.W.; Han, G.D. Effect of Grazing Intensities on Vegetation and Soil in Meadow Steppe. Acta Agrestia Sin. 2010, 18, 758–762. [Google Scholar]
  29. Wang, H.Y.; Dong, Z.; Guo, J.Y. Organic carbon storage properties in Stipa breviflora desert steppe vegetation soil systems under different grazing intensities. Acta Ecol. Sin. 2016, 36, 4617–4625. [Google Scholar]
  30. Curtin, C.G.; Sayre, N.F.; Lane, B.D. Transformations of the Chihuahuan Borderlands: Grazing, fragmentation, and biodiversity conservation in desert grasslands. Environ. Sci. Policy 2002, 5, 55–68. [Google Scholar] [CrossRef]
  31. Almeida, M.; Azeda, C.; Guiomar, N.; Pinto-Correia, T. The effects of grazing management in montado fragmentation and heterogeneity. Agrofor. Syst. 2016, 90, 69–85. [Google Scholar] [CrossRef]
  32. Das, D.; Jha, N.K.; Maikhuri, R.K. Fragmentation of Pastoral Grazing Landscape and Herd Migratory Routes: A Case Study from Indian Central Himalaya. Res. Lab. Agric. Biotechnol. Biochem. 2015, 9, 18–23. [Google Scholar] [CrossRef]
  33. Ding, H.-J.; Han, G.-D.; Wang, Z.-W.; Wang, C.-X.; Zhang, R.-Y.; Hu, J.-Y. Effect of Different Stocking Rates on Plant Community Characteristics in Stipa breviflora Desert Steppe. Chin. J. Grassl. 2014, 36, 55–60. [Google Scholar]
  34. Dong, Q.M.; Zhao, X.Q.; Yu-Shou, M.A.; Shi, J.J.; Wang, Y.L.; Li, S.-X.; Yang, S.H.; Shen, L. Effect of Grazing Intensity on Community Character and Aboveground Present Biomass of Alpine Mixed-sown Pasture. J. Grassl. 2012, 20, 10–16. [Google Scholar]
  35. Yang, D.; Han, G.; Hu, Y. Effects of grazing intensity on plant diversity and aboveground biomass of Stipa baicalensis grassland. Chin. J. Ecol. 2006, 25, 1470–1475. [Google Scholar]
  36. Huang, C.; Zhang, Y.; Zhao, M.L.; Han, G.D. Effects of different grazing intensities on vegetation characteristics of desert steppe. Pratacultural Sci. 2013, 30, 1814–1818. [Google Scholar]
  37. Zhang, F.; Yang, Y.; Qiao, J.R.; Jia, L.X.; Zhao, T.Q.; Zhao, M.L. Effects of Utilization Ways on Species Diversity, Functional Traits and Aboveground Biomass in Stipagrandis Steppe. Chin. J. Grassl. 2019, 41, 1–8. [Google Scholar]
  38. Schönbach, P.; Wan, H.; Gierus, M.; Bai, Y.; Müller, K.; Lin, L.; Susenbeth, A.; Taube, F. Grassland responses to grazing: Effects of grazing intensity and management system in an Inner Mongolian steppe ecosystem. Plant Soil 2011, 340, 103–115. [Google Scholar] [CrossRef]
  39. Duan, M.J.; Gao, Q.Z.; Wan, Y.F.; Li, Y.; Guo, Y.Q.; Danjiu, L.B.; Luosang, J.C. Effect of grazing on community characteristics and species diversity of Stipa purpurea alpine grassland in Northern Tibet. Acta Ecol. Sin. 2010, 30, 3892–3900. [Google Scholar]
  40. Yang, L.; Han, M.; Li, J. Plant diversity change in grassland communities along a grazing disturbance gradient in the northeast China transect. Chin. J. Plant Ecol. 2001, 25, 110–114. [Google Scholar]
  41. Zhao, L.; Zhong, H.; Zhao, M. Effect of Enclosure and Grazed Management on Aboveground Biomass and Species Diversity in Sandy Grasslands of Horain Sandy Land, Eastern Inner Mongolia, China. Ecol. Environ. Sci. 2018, 27, 1783–1790. [Google Scholar]
  42. Neff, J.C.; Reynolds, R.L.; Belnap, J.; Lamothe, P. Multi-decadal impacts of grazing on soil physical and biogeochemical properties in southeast Utah. Ecol. Appl. 2005, 15, 87–95. [Google Scholar] [CrossRef]
  43. Russell, J.R.; Betteridge, K.; Costall, D.A.; Mackay, A.D. Cattlet reading effects on sediment loss and water infiltration. J. Range Manag. 2001, 54, 184–190. [Google Scholar] [CrossRef]
  44. Zhang, M.; Guo, J.; Dong, Z.; Hongli, L.I.; Jinrong, L.I.; Zhou, X.; Han, X.; Chen, P. Simulation of Runoff and Sediment Yield in Desert Steppe with Different Grazing lntensities. J. Soil Water Conserv. 2018, 32, 41–46. [Google Scholar]
  45. Wang, Q.; Meng, Z.; Wang, J.; Dang, X.; Zhang, X.; Wang, Z.; Zhao, Q.; Zhang, J. Response of the vegetation soil under almost-natural restoration in the Xilamuren grassland. Acta Ecol. Sin. 2017, 37, 1159–1167. [Google Scholar]
  46. Gao, Y.; Han, X.; Wang, S. The effects of grazing on grassland soils. Acta Ecol. Sin. 2004, 24, 790–797. [Google Scholar]
  47. Negrón, M.; López, I.; Drner, J. Consequences of intensive grazing by dairy cows of contrasting live weights on volcanic ash topsoil structure and pasture dynamics. Soil Tillage Res. 2019, 189, 88–97. [Google Scholar] [CrossRef]
  48. Reszkowska, A.; Krümmelbein, J.; Gan, L.; Peth, S.; Horn, R. Influence of grazing on soil water and gas fluxes of two Inner Mongolian steppe ecosystems. Soil Tillage Res. 2011, 111, 180–189. [Google Scholar] [CrossRef]
  49. Hughes, J.D.; Packer, I.J.; Michalk, D.L.; Dowling, P.M.; King, W.M.; Brisbane, S.; Millar, G.D.; Priest, S.M.; Kemp, D.R.; Koen, T.B. Sustainable grazing systems for the Central Tablelands of New South Wales. 4. Soil water dynamics and runoff events for differently-managed pasture types. Aust. J. Exp. Agric. 2006, 46, 483–494. [Google Scholar] [CrossRef]
  50. Mapfumo, E.; Chanasyk, D.S.; Willms, W.D. Simulating daily soil water under foothills fescue grazing with the soil and water assessment tool model (Alberta, Canada). Hydrol. Process. 2010, 18, 2787–2800. [Google Scholar] [CrossRef]
  51. Li, J.; Yao, N.; Zhao, Y.; Fan, T.; Zhang, J.; Lan, Z.; Yi, J.; Si, B. Characteristics of soil water distribution and evaluation of recharge rate under different grazing history in the Xilin Gol Steppe. Chin. J. Plant Ecol. 2018, 42, 1033–1042. [Google Scholar] [CrossRef]
  52. Zhang, Y.; Hang, J.; Li, Z. A Study of the Effects of Different Grazing Intensities on Soil Physical Properties. Acta Agrestia Sin. 2002, 10, 74–78. [Google Scholar]
  53. Zhang, X.; Zhang, W.; Sai, X.; Chun, F.; Li, X.; Lu, X.; Wang, H. Grazing altered soil aggregates, nutrients, and enzyme activities in a Stipa kirschnii steppe of Inner Mongolia. Soil Tillage Res. 2022, 219, 105327. [Google Scholar] [CrossRef]
  54. Roberts, A.J.; Johnson, N.C. Effects of Mob-Grazing on Soil and Range Quality Vary with Plant Species and Season in a Semiarid Grassland. Rangel. Ecol. Manag. 2021, 79, 139–149. [Google Scholar] [CrossRef]
Figure 1. Geographical location of the study site.
Sustainability 15 16028 g001
Figure 2. Variational characteristics of the soil bulk density at varying grazing intensities (Mean ± SE). Note: F-test and p-value were used to test statistical significance. Capital letters illustrate differences among multiple grazing intensity groups for the same soil depth (p < 0.05). Small letters represent differences among varying soil depths for the same grazing intensity (p < 0.05). Significant differences between variables are marked by diverse letters; otherwise, differences between variables are insignificant.
Sustainability 15 16028 g002
Figure 3. Variation in the soil infiltration rate with time at different grazing intensities.
Sustainability 15 16028 g003
Figure 4. Soil infiltration rates at different grazing intensities. Note: Letters indicate differences among different grazing intensity groups for the same index (p < 0.05). Different letters indicate significant differences between variables; otherwise, the differences between variables are insignificant.
Sustainability 15 16028 g004
Figure 5. Soil chemical characteristics. (a) Soil Organic matter content. (b) Total soil nitrogen content. (c) Total soil potassium content. (d) Total soil phosphorus content. Note: Small letters represent differences among varying soil depths for the same grazing intensity (p < 0.05). Significant differences between variables are marked by diverse letters; otherwise, differences be-tween variables are insignificant.
Sustainability 15 16028 g005
Table 1. Plant community composition and importance values.
Name of the PlantsImportance Values (%)
CKLGMGHG
Heteropappus altaicus24.918.3417.559.88
Carex duriuscula14.75-10.9415.94
Stipa krylovii14.2819.2515.2118.45
Cleistogenes squarrosa12.1522.4616.8918.08
Artimisia gmelinii12.156.194.93-
Agropyron cristatum11.7413.8316.2316.33
Convolvulus ammannii10.658.4710.212.34
Leymus chinensis9.849.049.889.42
Kochia prostrata9.335.726.934.11
Allium tenuissimum7.925.764.088.32
Androsace incana7.12--4.39
Arenaria juncea6.74---
Melilotoides ruthenica6.494.83.214.84
Iris tenuifolin5.548.156.04-
Haplophyllum dauricum4.99---
Linum perenne4.994.972.294.07
Gentiana dahurica3.6--2.64
Hedysarum brachypterum3.593.254.044.09
Ptilotrichum canescens3.56---
Astragalus.discolor3.334.033.433.88
Artimisia frigida3.045.752.914.98
Iris lactea2.77---
Table 2. Characteristics of ecological indicators of plant communities at different grazing intensities (mean ± SE).
Community CharacteristicsCKLGMGHGFp
Cover (%)43 ± 3 a41 ± 3 a37 ± 3 b30 ± 3 c35.5080.000
Height (cm)10.35 ± 6.22 a5.93 ± 3.89 b5.82 ± 4.25 b4.46 ± 3.37 c33.2350.000
Above-ground biomass (g)86.97 ± 9.53 a49.89 ± 6.74 b38.19 ± 5.60 c42.15 ± 11.83 b32.3710.000
Patrick species richness index8.91 ± 2.23 b8.28 ± 1.21 c8.82 ± 2.12 b9.64 ± 1.37 a0.9780.413
Simpson dominance index0.79 ± 0.08 a0.75 ± 0.11 b0.78 ± 0.07 a0.78 ± 0.02 a0.5150.674
Shannon–Wiener diversity index1.69 ± 0.27 a1.41 ± 0.21 b1.62 ± 0.19 b1.68 ± 0.12 a4.8500.006
Pielou evenness index0.79 ± 0.09 a0.67 ± 0.07 b0.76 ± 0.07 a0.77 ± 0.03 a5.6020.003
Note: F-test and p-value were used to test significance. Letters indicate differences among different grazing intensity groups for the same indicator (p < 0.05). Significant differences between variables are marked by different letters. Otherwise, the differences between variables are insignificant.
Table 3. Soil particle size distribution characteristics at different grazing intensities (mean ± SE).
Grazing IntensitiesSoil DepthSandFinesClay Particles
Very Coarse SandCoarse SandMedium SandFine SandVery Fine Sand
CK0–51.22 ± 0.19 b6.86 ± 0.79 c9.93 ± 1.81 b16.17 ± 1.64 a17.41 ± 1.56 a45.61 ± 5.06 a2.80 ± 0.49 a
LG0–52.13 ± 0.23 b10.52 ± 1.64 b13.26 ± 3.07 a16.65 ± 1.45 a16.10 ± 1.94 a39.10 ± 6.33 b2.23 ± 0.41 b
MG0–52.93 ± 0.67 b15.10 ± 1.96 a14.63 ± 3.54 a14.10 ± 3.70 c13.50 ± 0.41 b37.53 ± 4.72 c2.20 ± 0.38 b
HG0–511.80 ± 1.37 a9.70 ± 1.60 b9.57 ± 1.08 b15.61 ± 0.82 b15.13 ± 1.76 b36.33 ± 1.47 c1.85 ± 0.13 c
Note: HG means heavy grazing (3 sheep units/hm2), MG means moderate grazing (2 sheep units/hm2), LG means light grazing (1 sheep unit/hm2), and CK means no grazing plots. The F-test and p-value were used to test statistical significance. Letters indicate differences among different grazing intensity groups for the same indicator (p < 0.05).
Disclaimer/Publisher’s Note: The statements, opinions and data contained in all publications are solely those of the individual author(s) and contributor(s) and not of MDPI and/or the editor(s). MDPI and/or the editor(s) disclaim responsibility for any injury to people or property resulting from any ideas, methods, instructions or products referred to in the content.

