

Quantitative, Qualitative and Thermal Aspects of Rainwater Retention on Wetland Roofs


 ,
,
Abstract
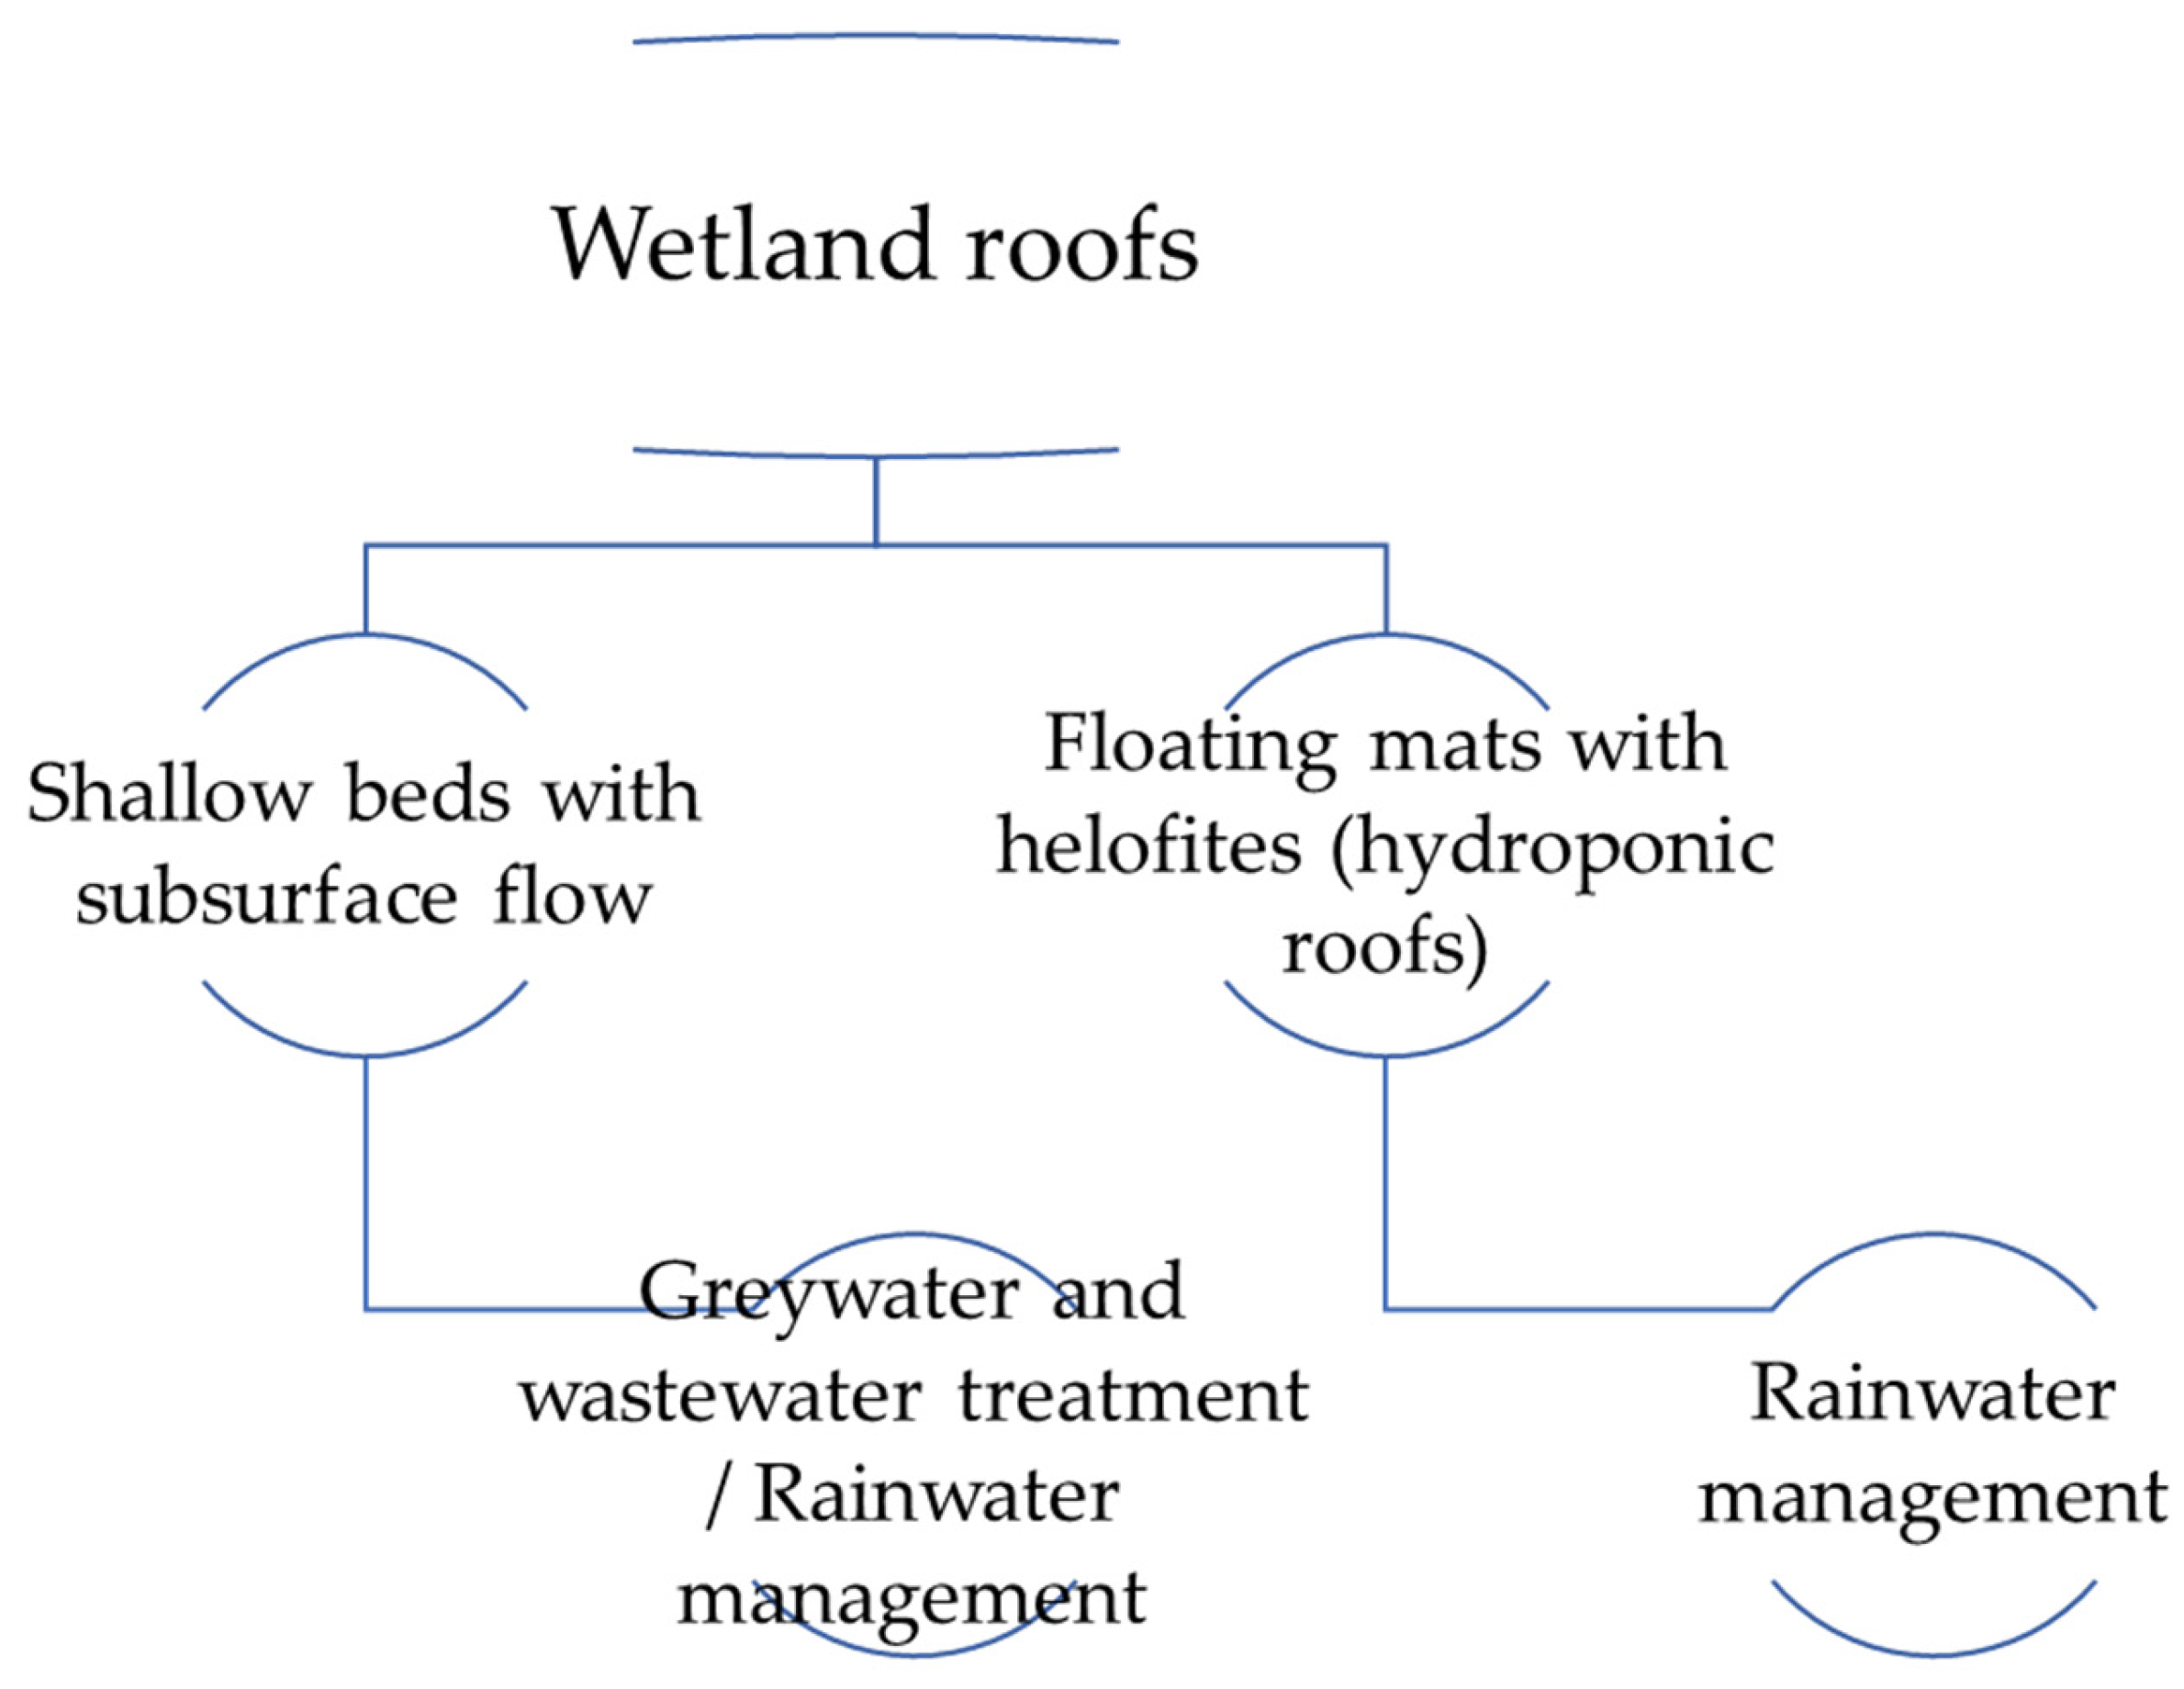
:1. Introduction
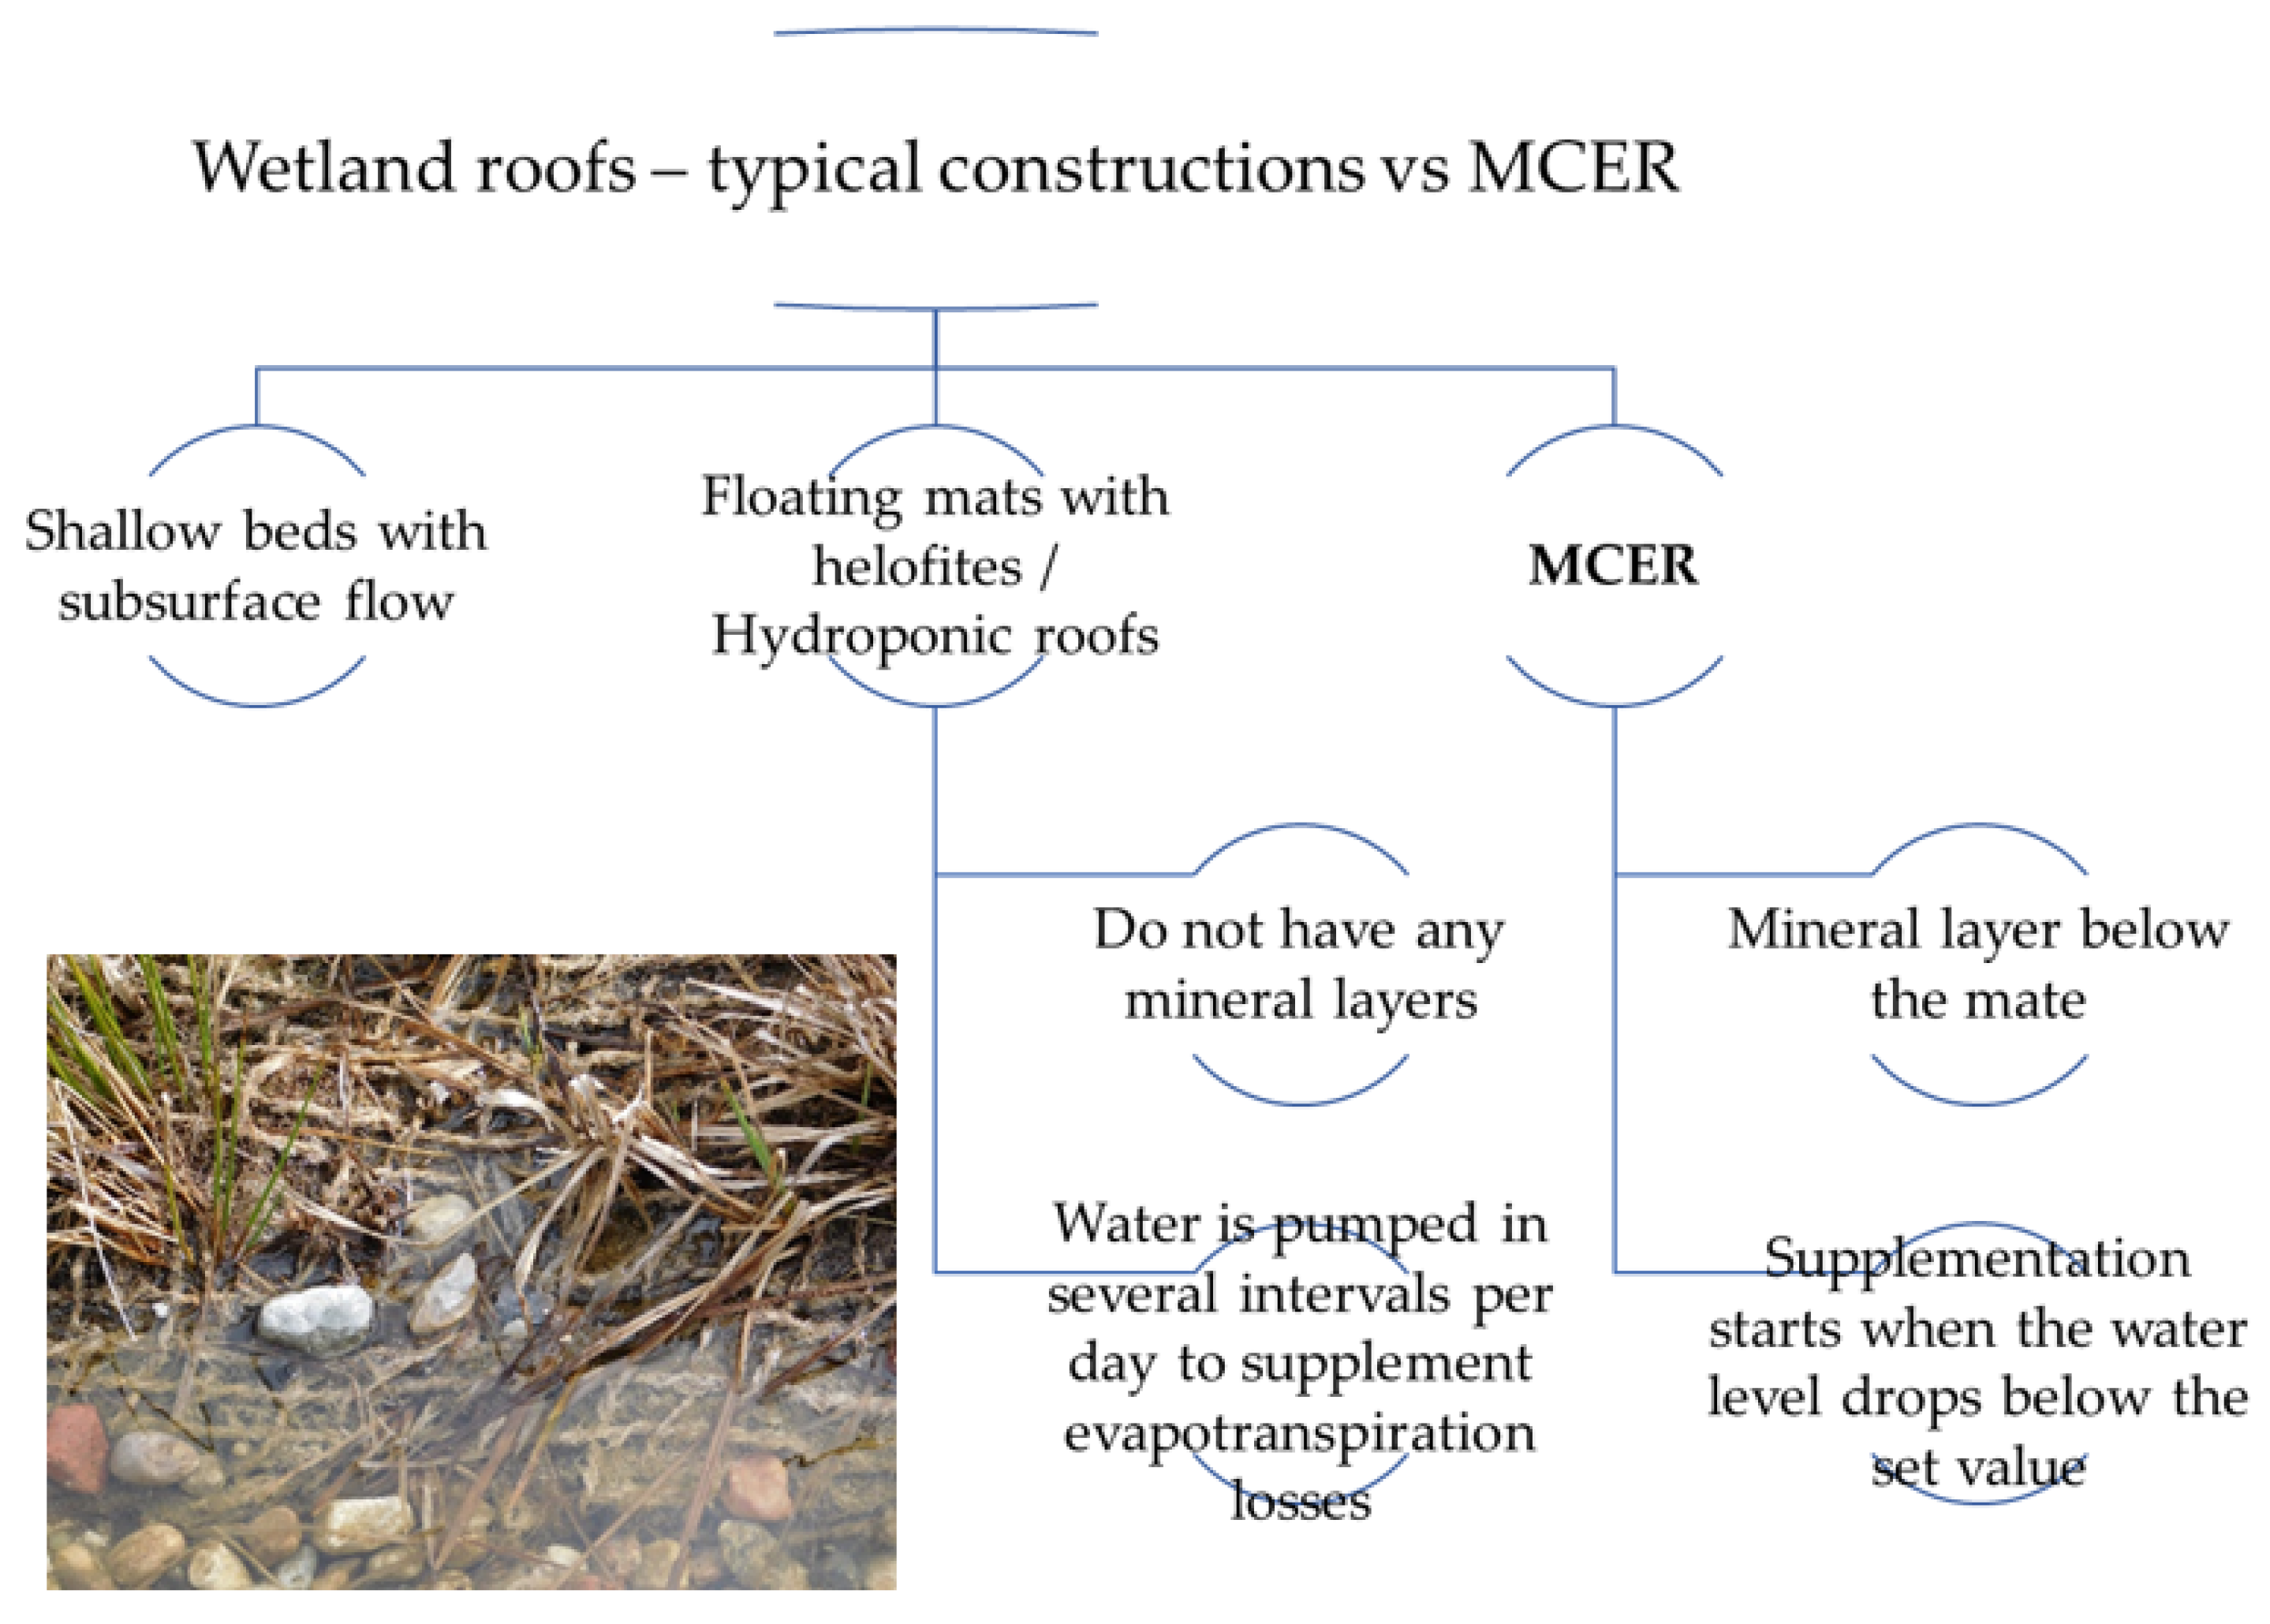
2. Materials and Methods
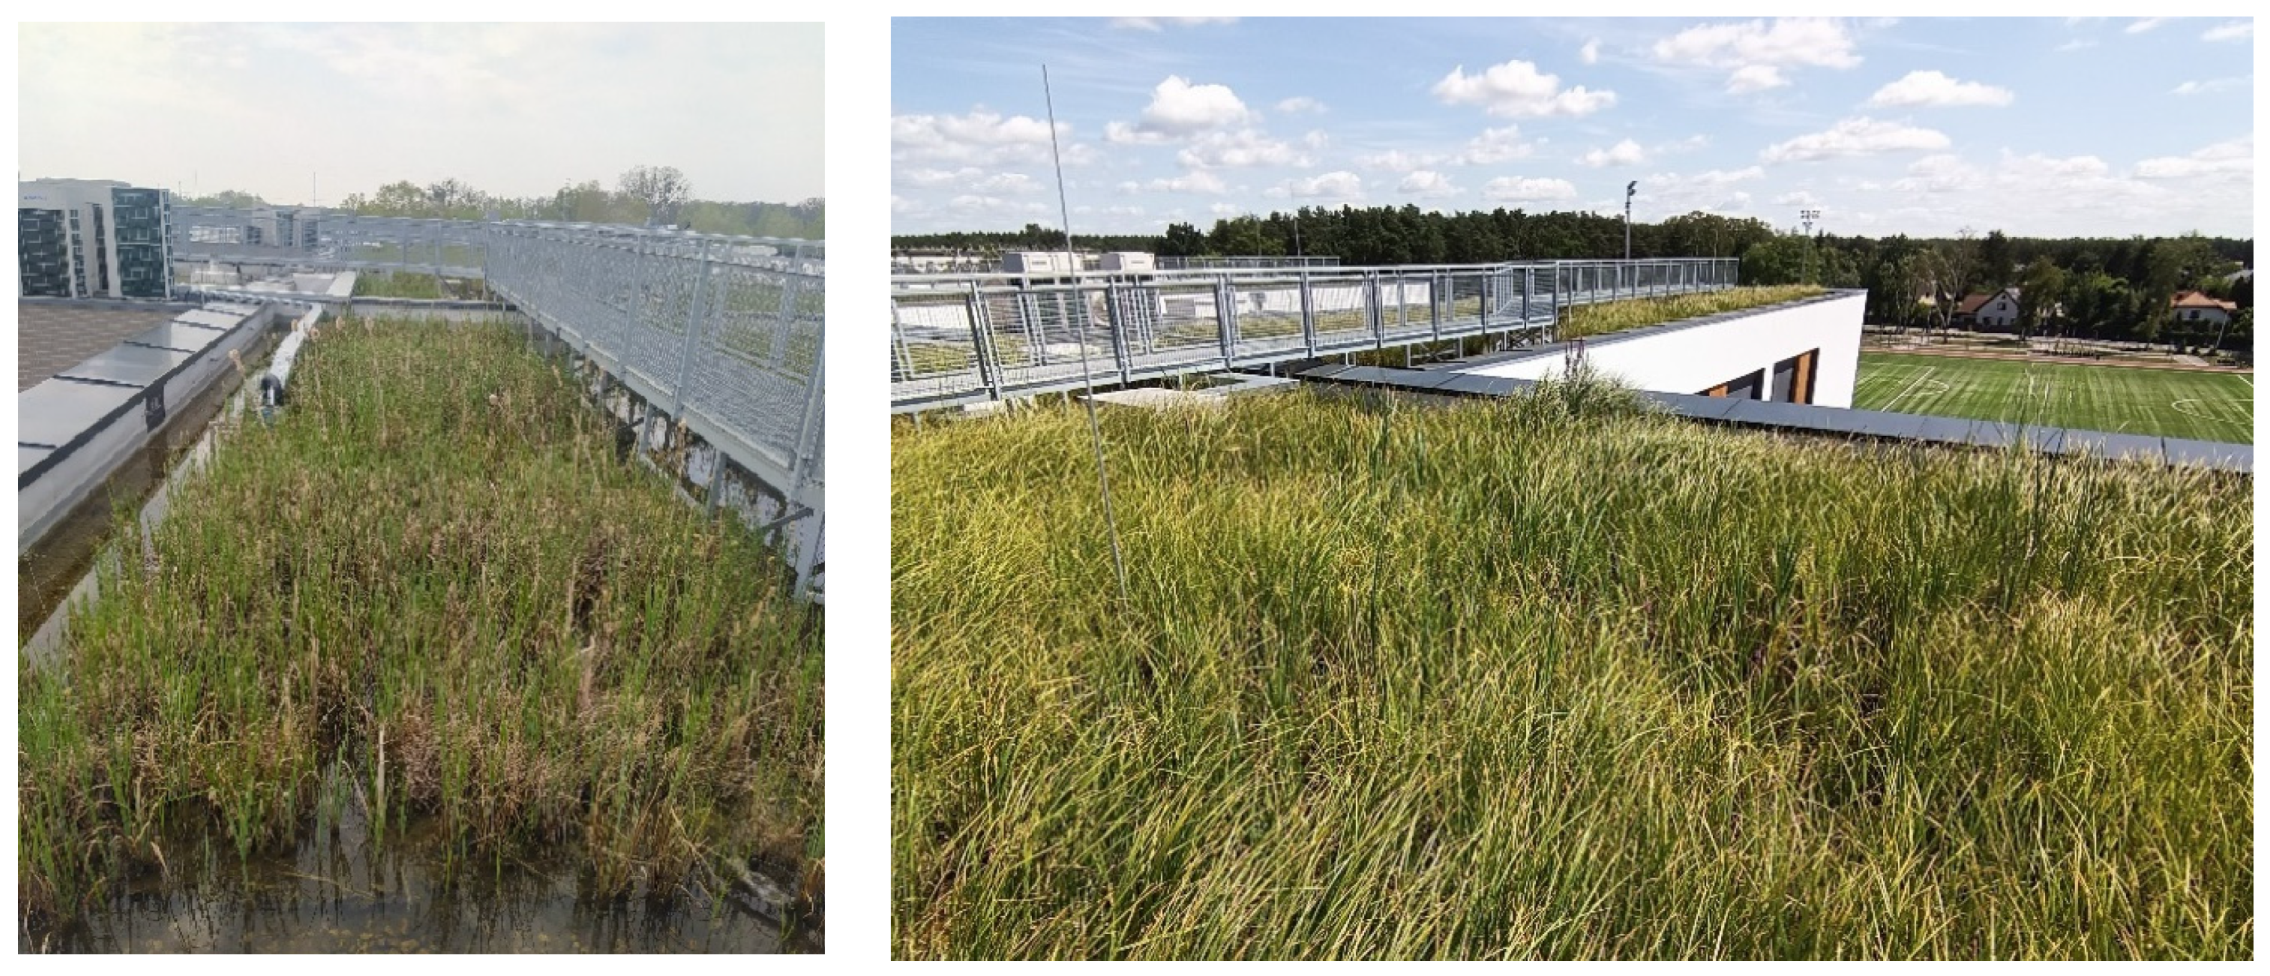
2.1. Site Description
2.2. Automatic Monitoring, Water Sampling and Analysis
3. Results and Discussion
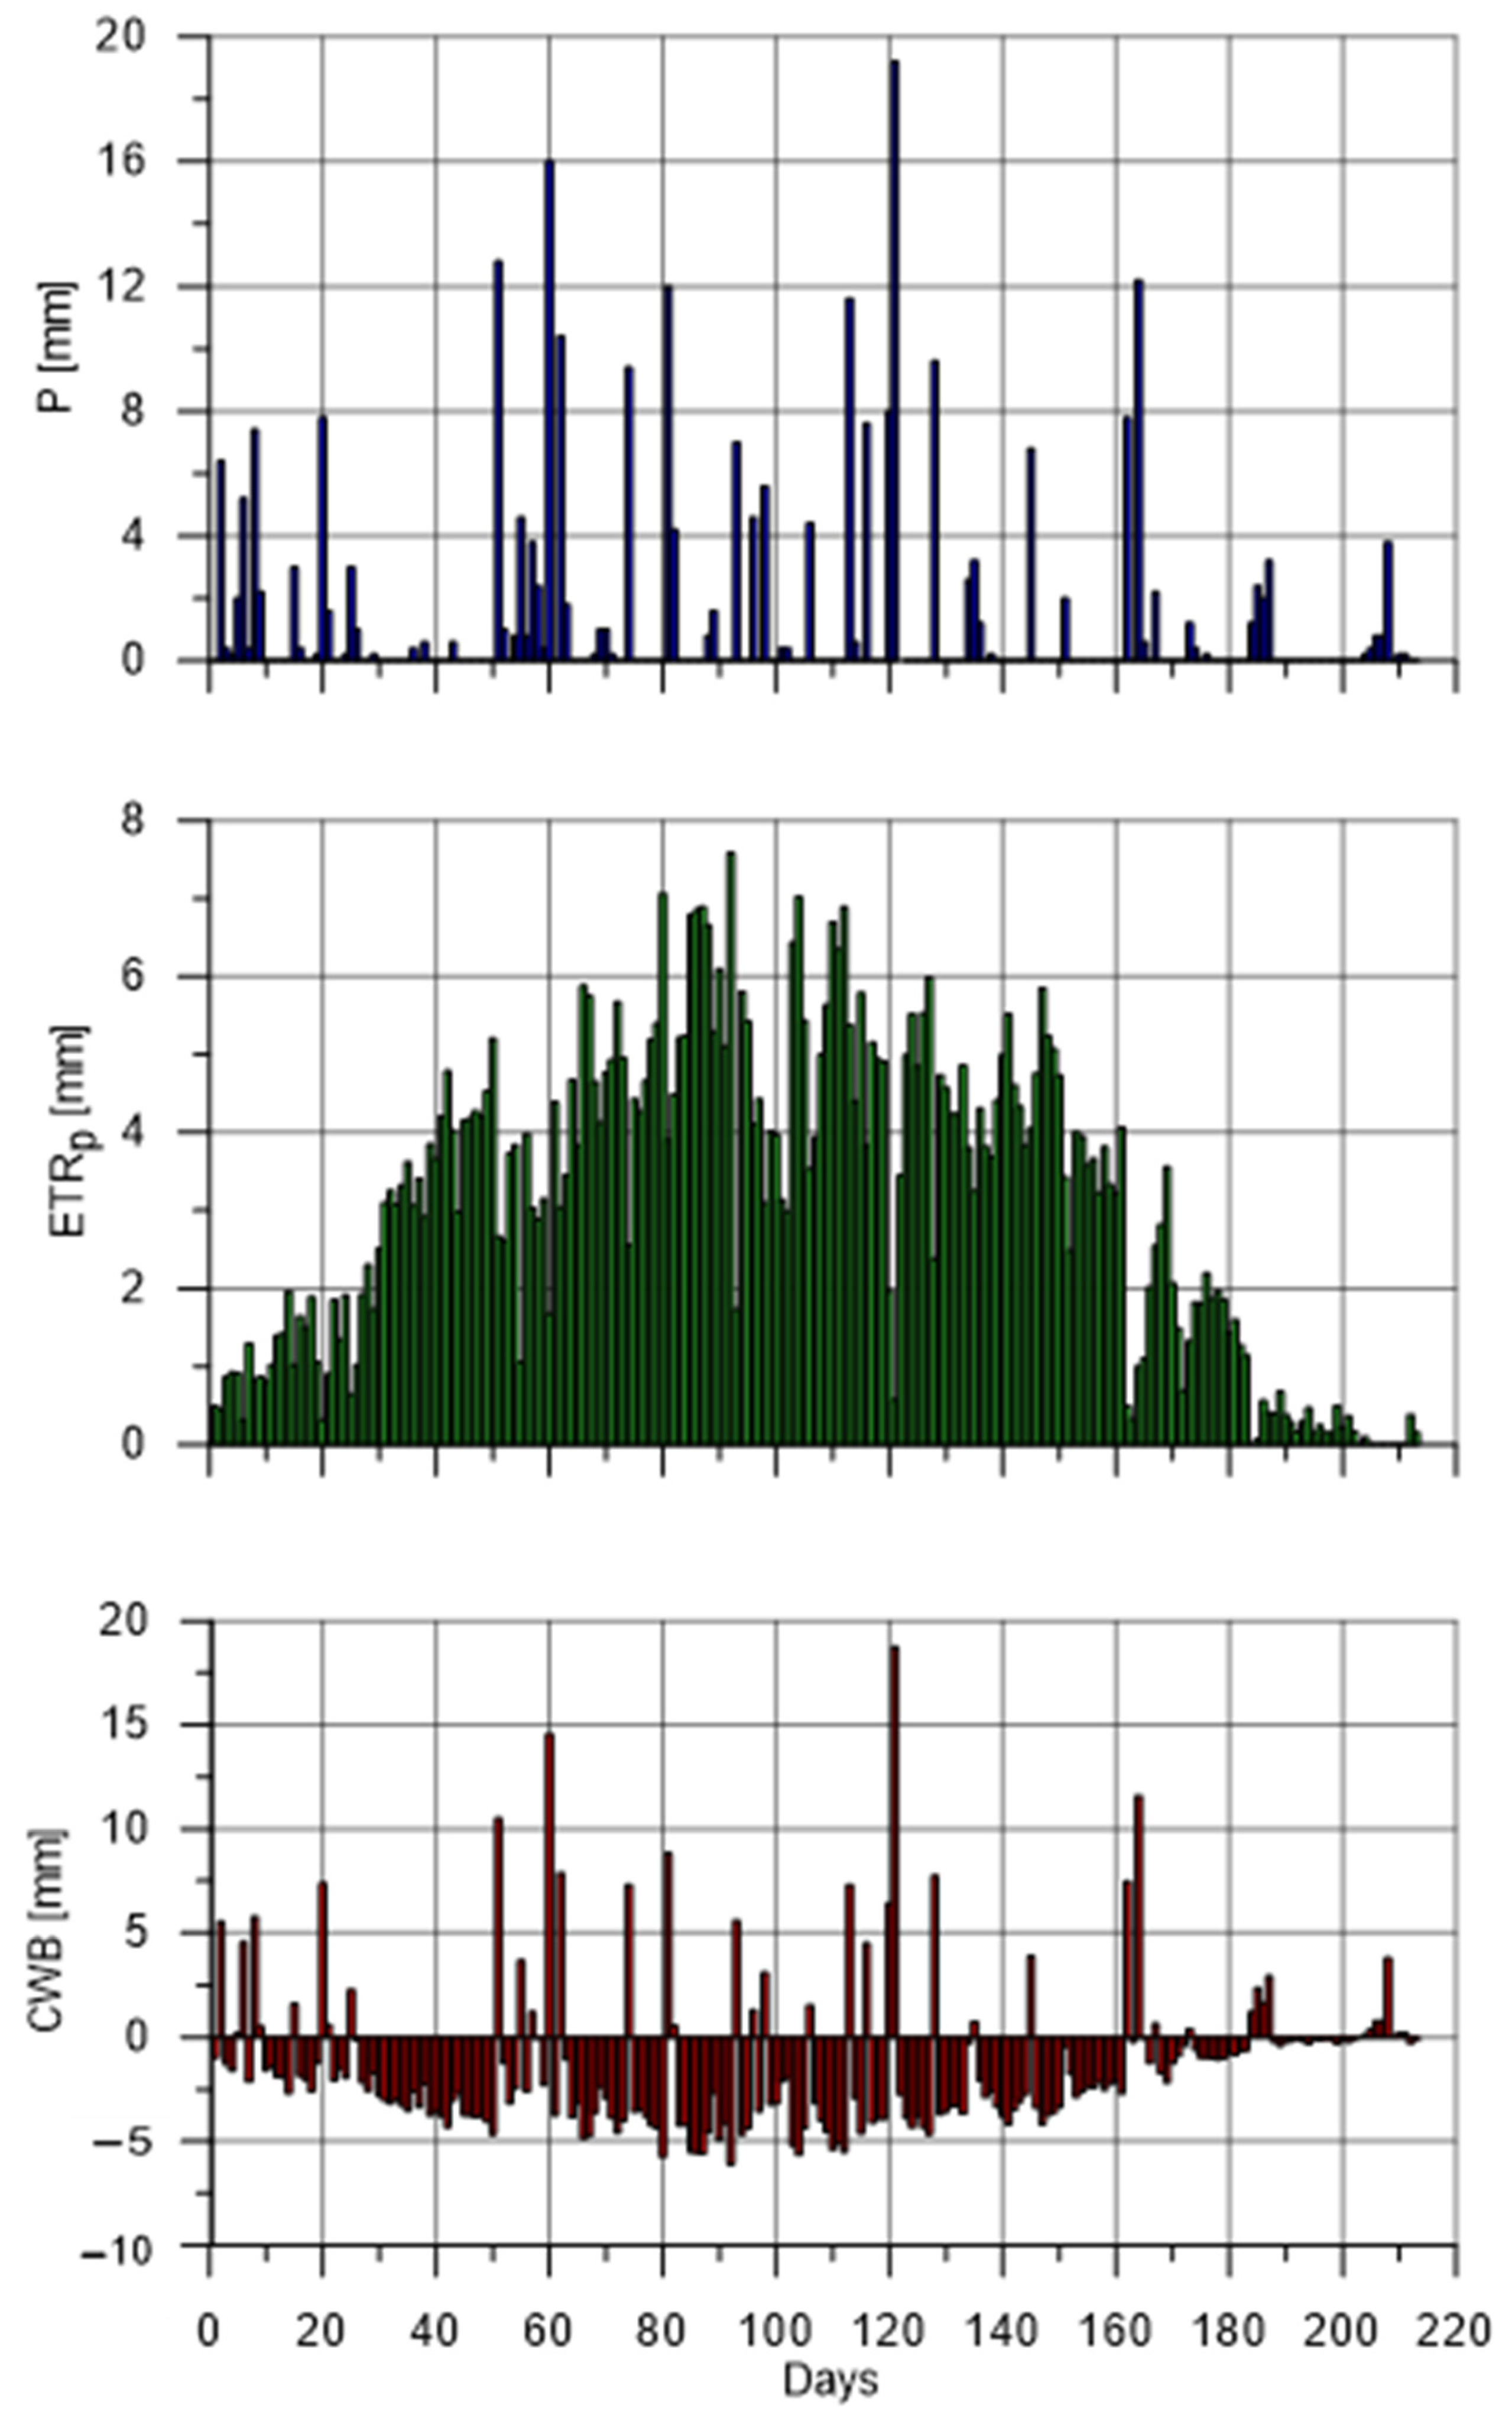
3.1. Weather Conditions of the Growing Season
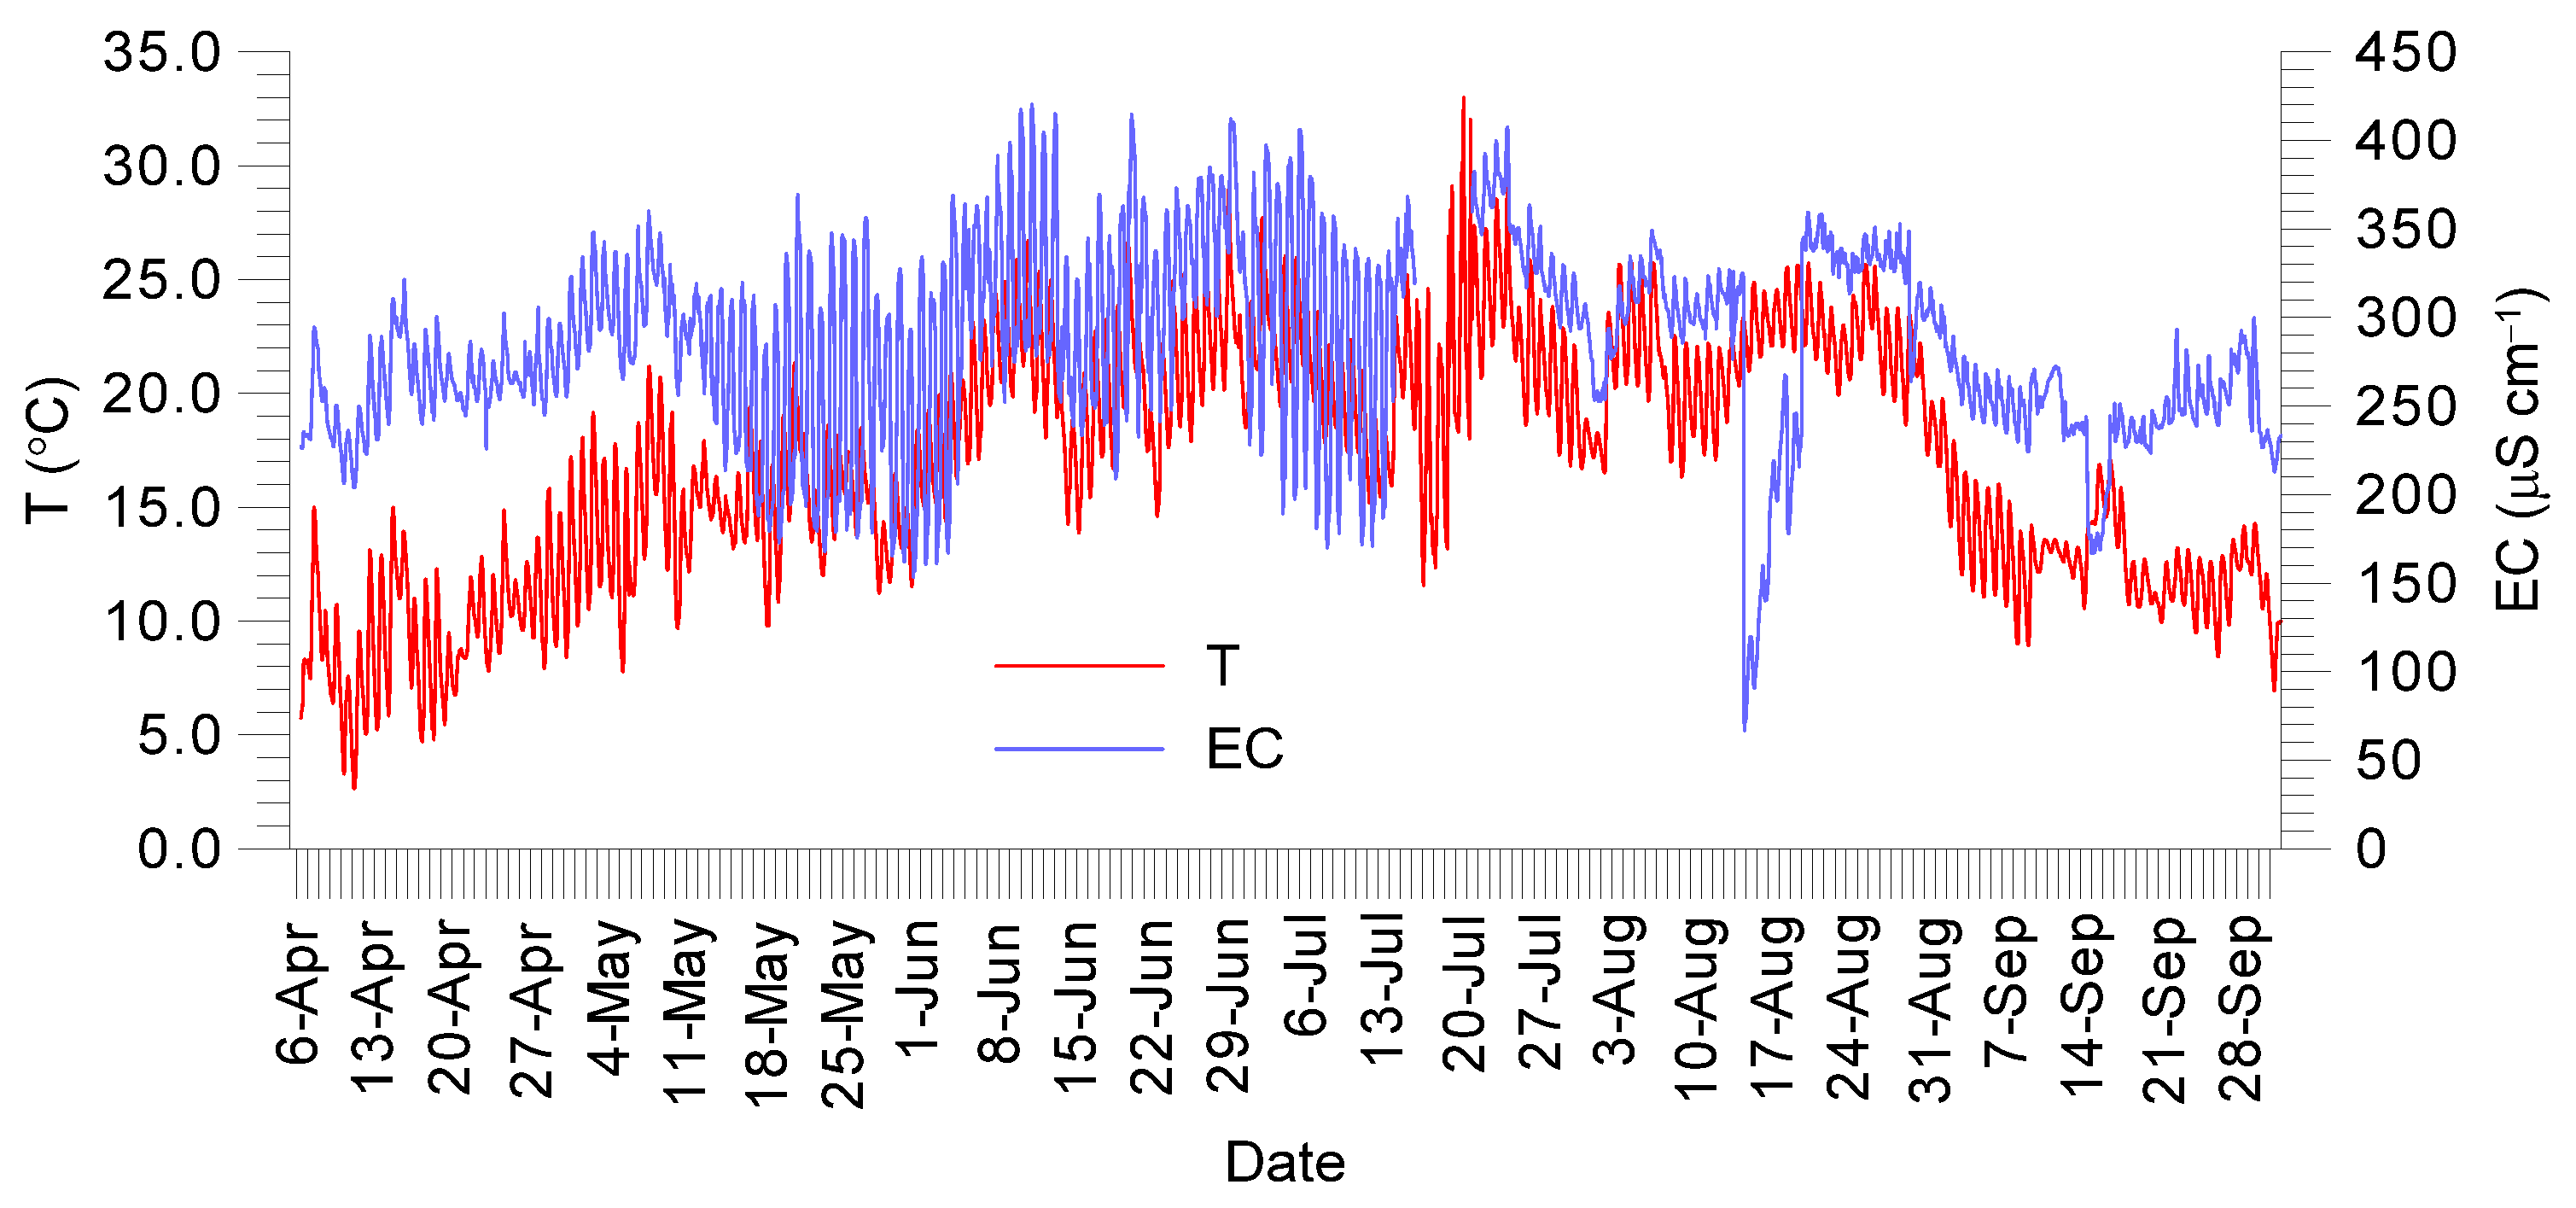
3.2. Automatic Water Quality Monitoring
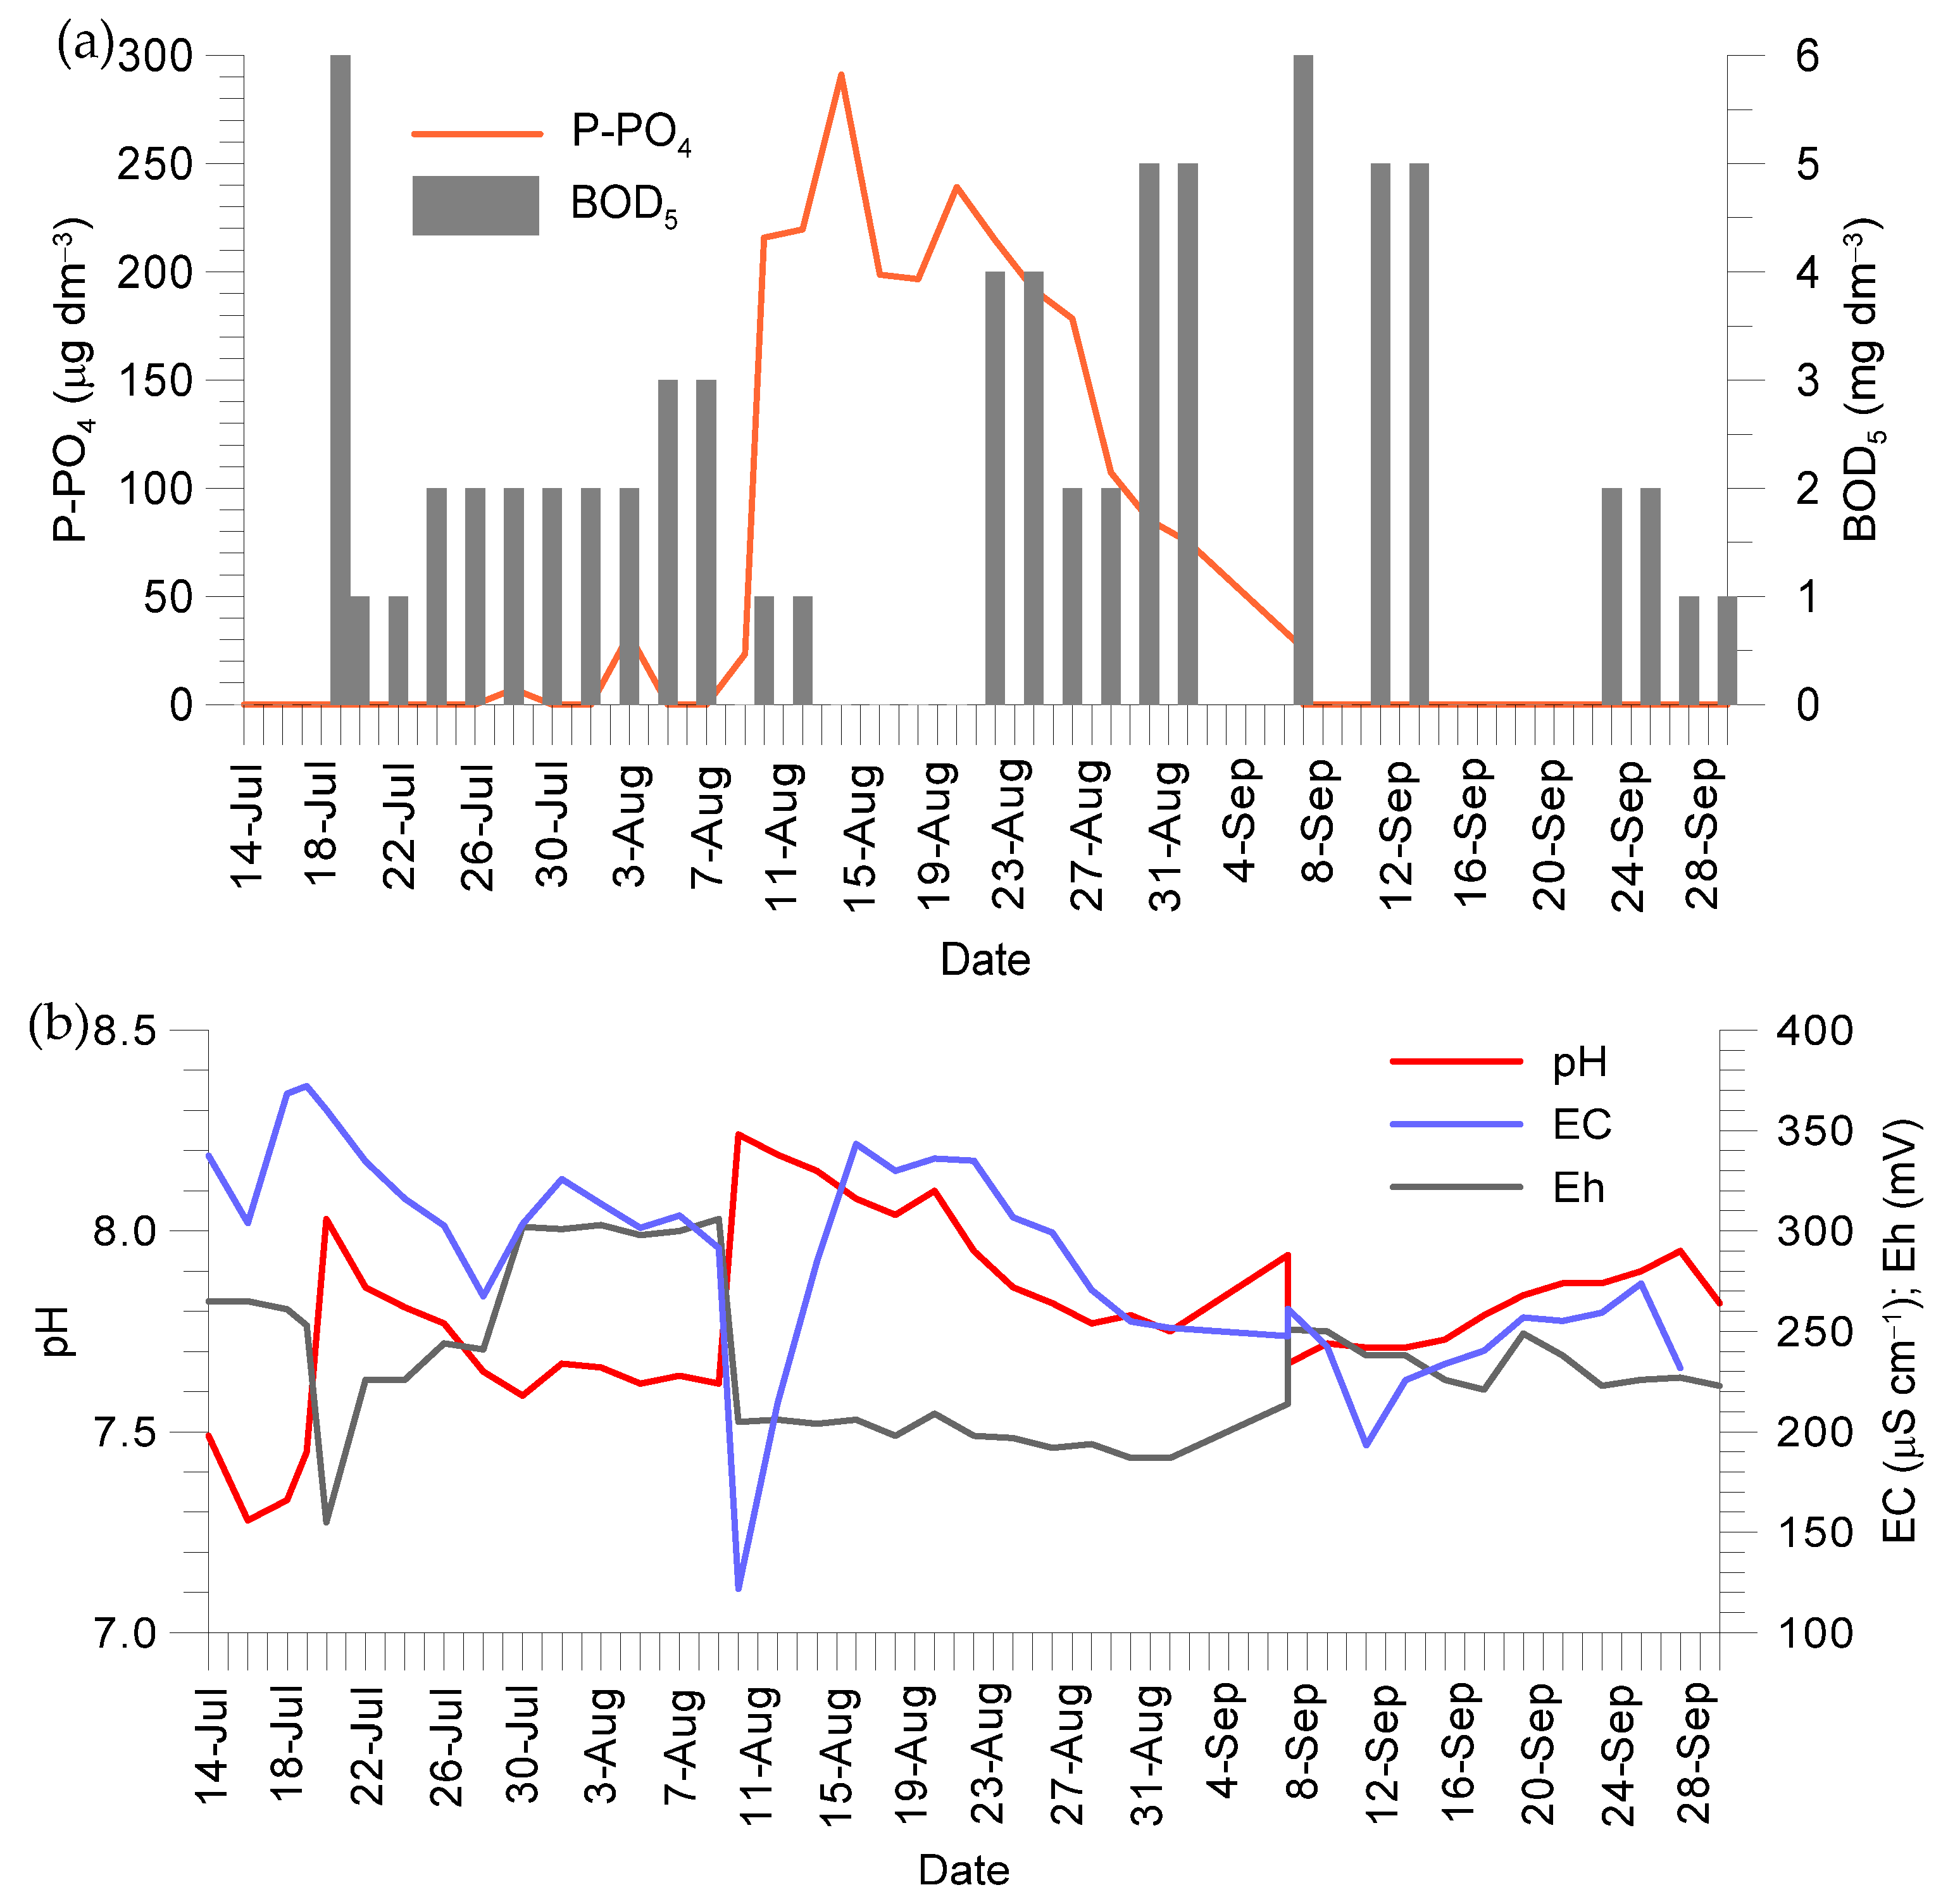
3.3. Sampled Water Quality Monitoring
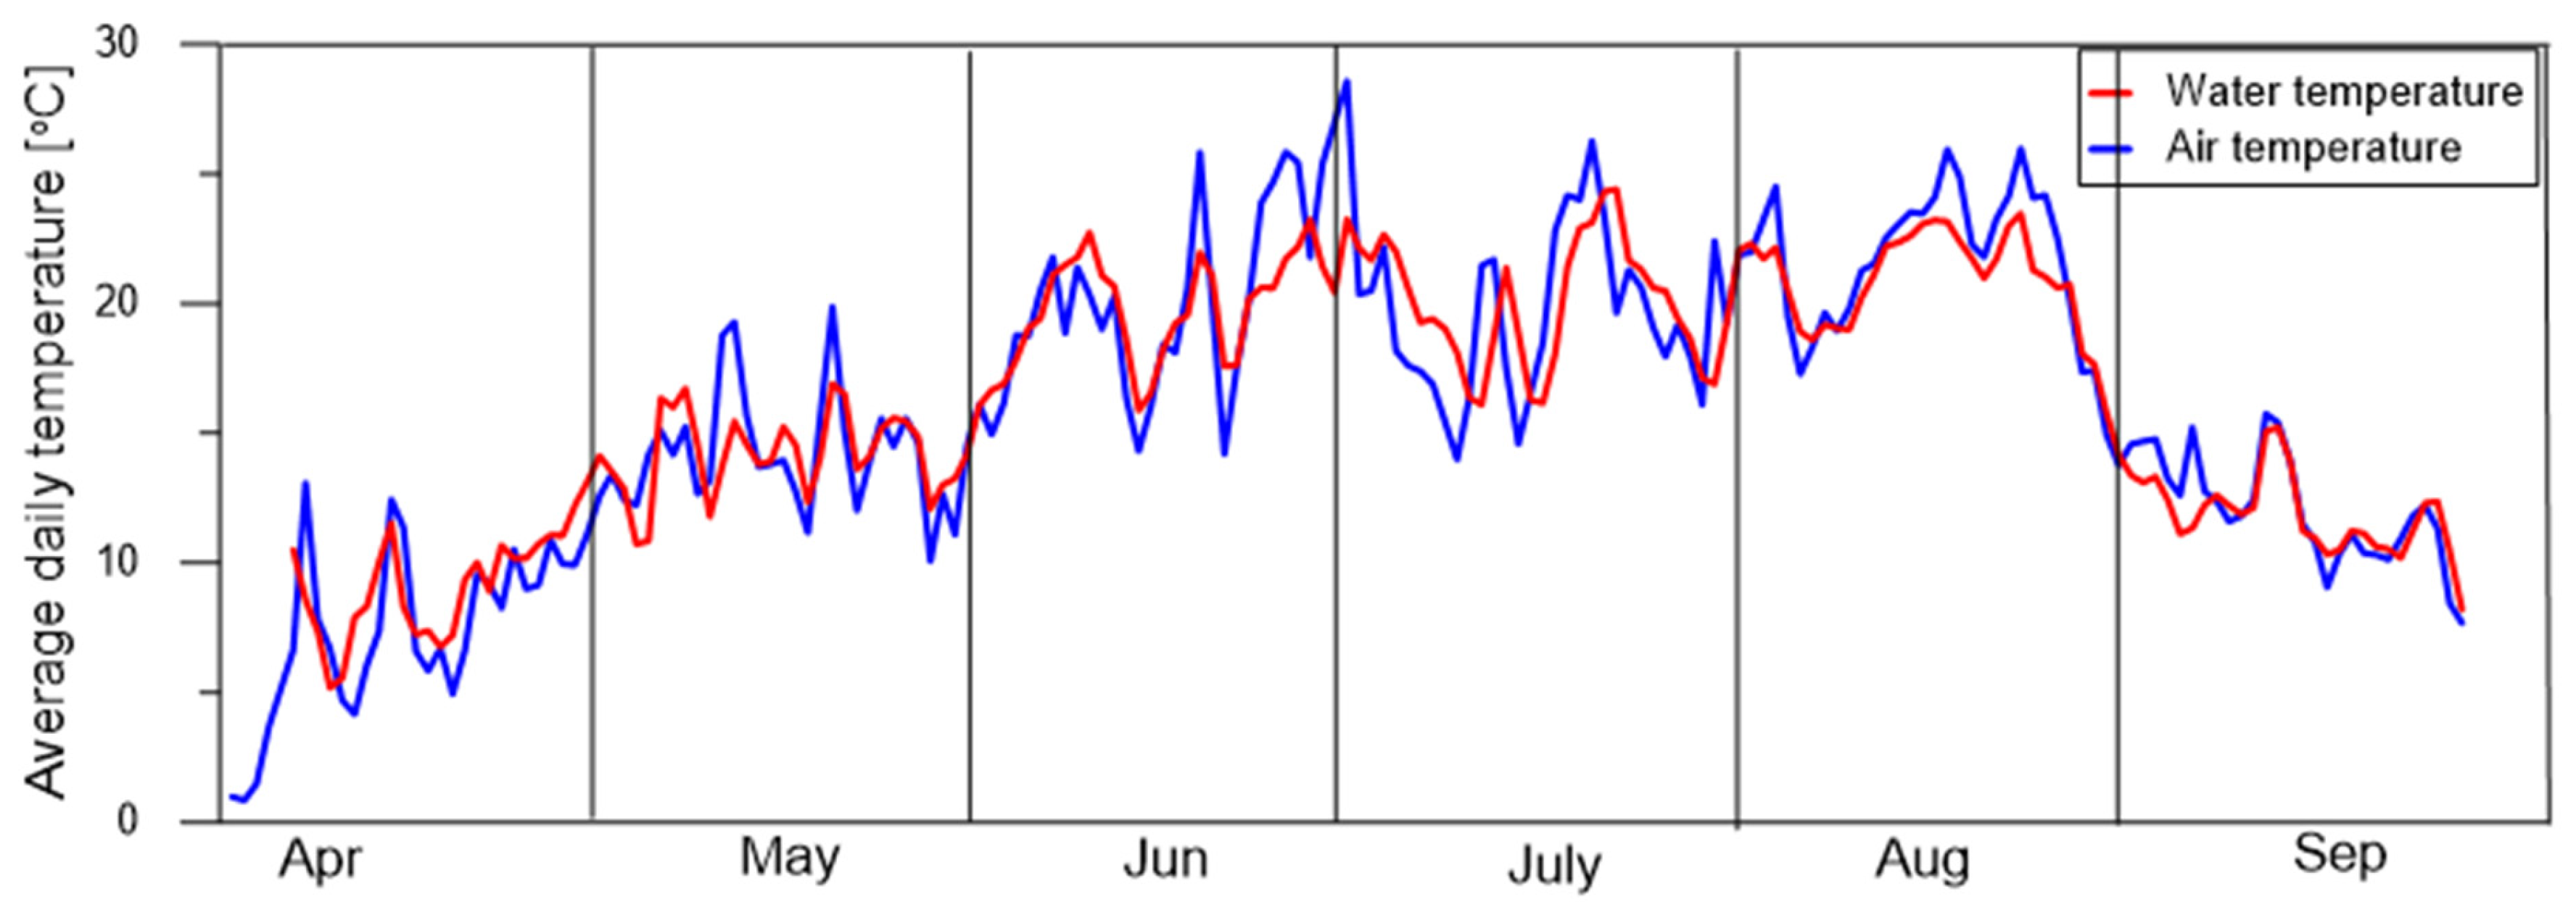
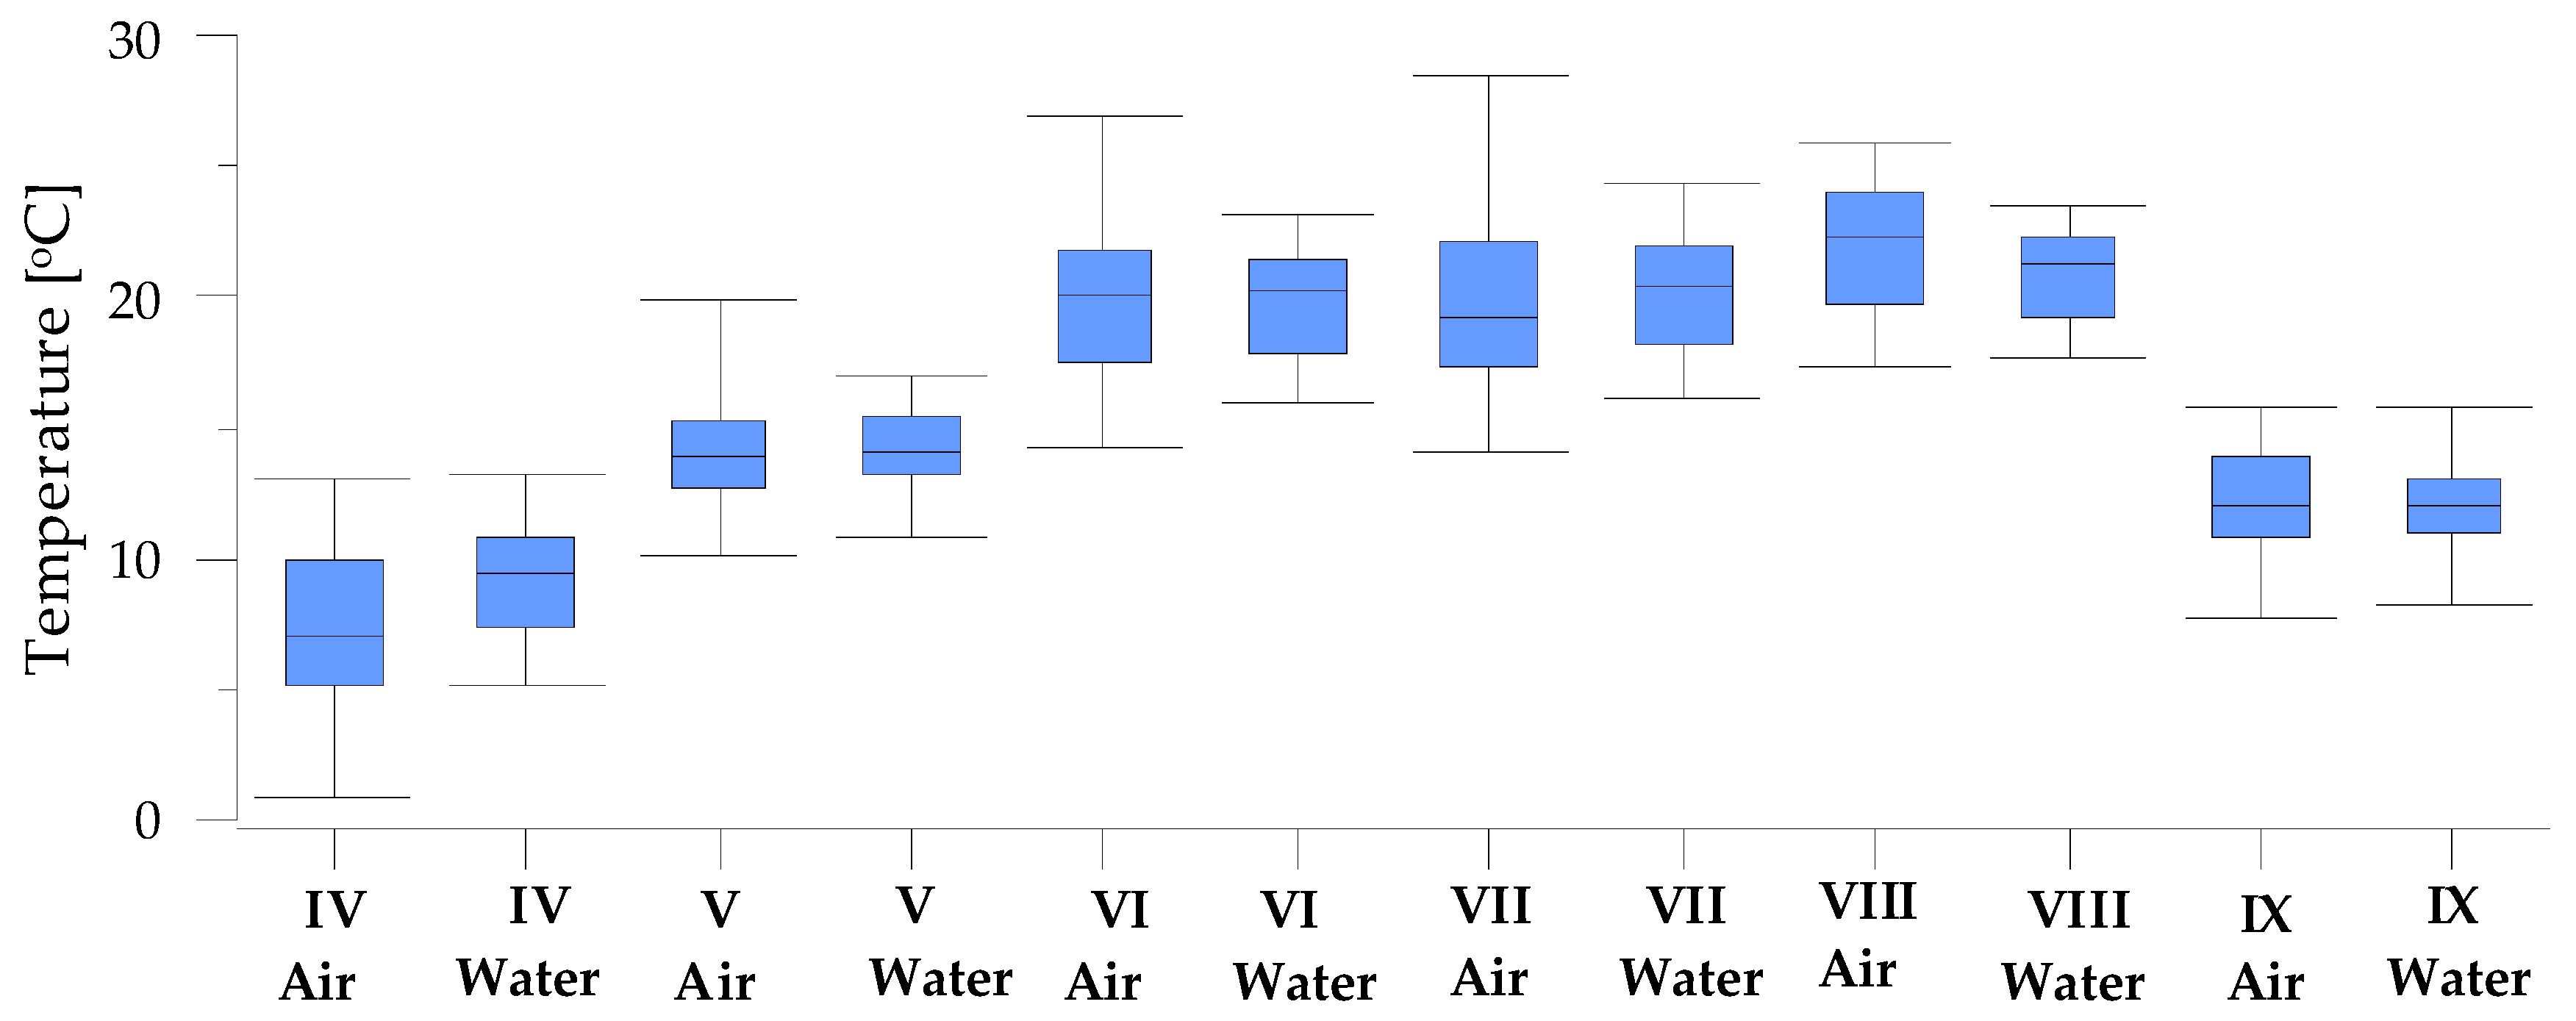
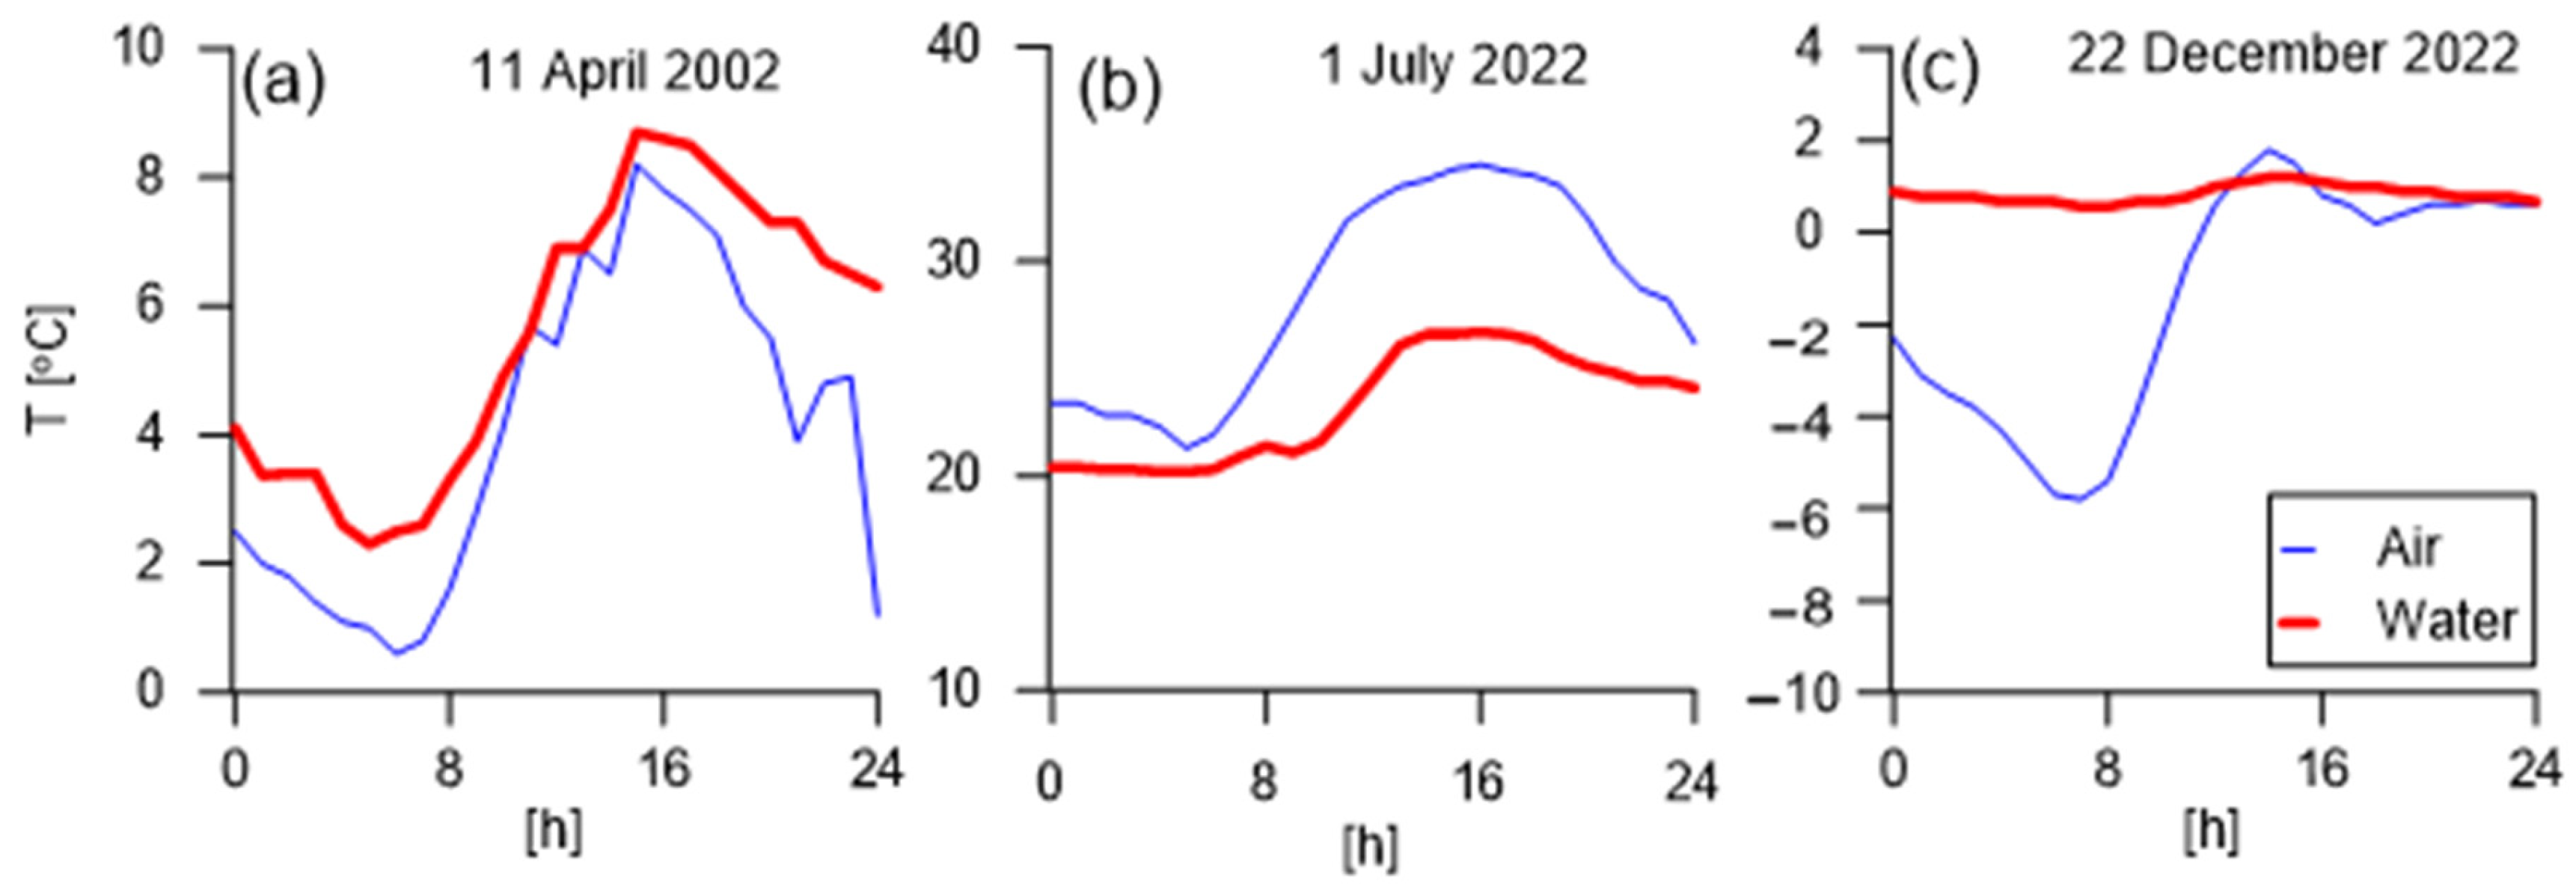
3.4. Analysis of the Water Temperature
4. Conclusions
Author Contributions
Funding
Institutional Review Board Statement
Data Availability Statement
Conflicts of Interest
References
- European Commission. The EU biodiversity strategy to 2030. In Bringing Nature Back into Our Lives; COM: Brussels, Belgium, 2020. [Google Scholar]
- European Commission. Forging a Climate-Resilient Europe—The New EU Strategy on Adaptation to Climate Change; COM: Brussels, Belgium, 2021. [Google Scholar]
- Carter, T.L.; Rasmussen, T.C. Hydrologic Behavior of Vegetated Roofs. J. Am. Water Resour. Assoc. JAWRA 2006, 42, 1261–1274. [Google Scholar] [CrossRef]
- Hilten, R.N.; Lawrence, T.M.; Tollner, E.W. Modeling Stormwater Runoff from Green Roofs with HYDRUS-1D. J. Hydrol. 2008, 358, 288–293. [Google Scholar] [CrossRef]
- Sun, X. Exposure to Abnormally Hot Temperature and the Demand for Commercial Health Insurance. Front. Public Health 2022, 10, 842665. [Google Scholar] [CrossRef]
- Koc, C.B. Evaluating the Cooling Effects of Green Infrastructure: A Systematic Review of Methods, Indicators and Data Sources. Sol. Energy 2018, 166, 486–508. [Google Scholar] [CrossRef]
- Baryła, A.; Gnatowski, T.; Karczmarczyk, A.; Szatyłowicz, J. Changes in Temperature and Moisture Content of an Extensive-Type Green Roof. Sustainability 2019, 11, 2498. [Google Scholar] [CrossRef]
- Bullock, A.; Acreman, M. The Role of Wetlands in the Hydrological Cycle. Hydrol. Earth Syst. Sci. 2003, 7, 358–389. [Google Scholar] [CrossRef]
- Knapp, S.; Schmauck, S.; Zehnsdorf, A. Biodiversity Impact of Green Roofs and Constructed Wetlands as Progressive Eco-Technologies in Urban Areas. Sustainability 2019, 11, 5846. [Google Scholar] [CrossRef]
- Karczmarczyk, A.; Baryła, A.; Fronczyk, J.; Bus, A.; Mosiej, J. Phosphorus and Metals Leaching from Green Roof Substrates and Aggregates Used in Their Composition. Minerals 2020, 10, 112. [Google Scholar] [CrossRef]
- Kożuchowski, P. Multifunkcjonalny dach w Markach. Zieleń Miejska 2019, 12, 34–35. [Google Scholar]
- Gąsiorowski, M. Ogród Bagienny na Dachu. Korzyści, Konstrukcja, Rośliny; Murator Plus: Warszawa, Poland, 2020; Available online: https://www.muratorplus.pl/technika/dachy/ogrod-bagienny-na-dachu-dlaczego-warto-tworzyc-ogrody-bagienne-na-miejskich-dachach-aa-4uoU-5n9L-taQi.html (accessed on 20 September 2023).
- Stefanakis, A. The Role of Constructed Wetlands as Green Infrastructure for Sustainable Urban Water Management. Sustainability 2019, 11, 6981. [Google Scholar] [CrossRef]
- Song, U.; Kim, E.; Bang, J.H.; Son, D.J.; Waldman, B.; Lee, E.J. Wetlands Are an Effective Green Roof System. Build. Environ. 2013, 66, 141–147. [Google Scholar] [CrossRef]
- Voyde, E.; Fassman, E. Quantifying Evapotranspiration Rates for New Zealand Green Roofs. J. Hydrol. Eng. 2010, 15, 395–403. [Google Scholar] [CrossRef]
- Pereyra, M.Z. Design and Development of Two Novel Constructed Wetlands: The Duplex-Constructed Wetland and the Constructed Wetroof. Ph.D. Thesis, Wageningen University and Research, Wageningen, The Netherlands, 2015. [Google Scholar]
- Nguyen, V.-T. Influence of Plant Types, Bed Media and Feeding Patterns on Wastewater Treatment Performance of Wetland Roofs. J. Water Process Eng. 2021, 40, 101972. [Google Scholar] [CrossRef]
- Rahman, K.Z.; Chen, X.; Blumberg, M.; Bernhard, K.; Müller, R.A.; Mackenzie, K.; Trabitzsch, R.; Moeller, L. Effect of Hydraulic Loading Rate on Treatment Performance of a Pilot Wetland Roof Treating Greywater from a Household. Water 2023, 15, 3375. [Google Scholar] [CrossRef]
- Thanh, B.X.; Hai Van, P.T.; Tin, N.T.; Hien, V.T.D.; Dan, N.P.; Koottatep, T. Performance of Wetland Roof with Melampodium Paludosum Treating Septic Tank Effluent. Desalin. Water Treat. 2014, 52, 1070–1076. [Google Scholar] [CrossRef]
- Thon, A.; Kircher, W.; Thon, I. Constructed Wetlands on Roofs as a Module of Sanitary Environmental Engineering to Improve Urban Climate and Benefit of the On Site Thermal Effects. Klaipėdos Valstyb. Kolegijos Moksl. Period. Leidinys Miest. Zeldynų Formav. 2010, 1, 191–196. Available online: https://arboristai.lt/articles/ekologija/207-straipsniai24/336-constructed-wetlands-on-roofs-as-a-module-of-sanitary-environmental-engeneering-to-improve-urban-climate-and-benefit-of-the-on-site-thermal-effects-apeldintas-stogas-kaip-ekologins-aplinkos-krimo-modelis-pagerinti-miesto-klimat-ir-naudingai-panau (accessed on 20 September 2023).
- Biswal, B.K.; Balasubramanian, R. Constructed Wetlands for Reclamation and Reuse of Wastewater and Urban Stormwater: A Review. Front. Environ. Sci. 2022, 10, 836289. [Google Scholar] [CrossRef]
- GBS 2020; Green Building Standard. National Association for the Support of Sustainable Building: Warsaw, Poland, 2020. Available online: http://greenbuildingstandard.eu/green-building-standard/ (accessed on 20 September 2023).
- BREEAM 1990; Building Research Establishment Environmental Assessment Methodology. Building Research Establishment (BRE Group): Watford, UK, 1990. Available online: https://bregroup.com/ (accessed on 20 September 2023).
- Walkowiak, D.K. Isco Open Channel Flow Measurement Handbook, 6th ed.; Teledyne ISCO: Lincoln, NE, USA, 2008. [Google Scholar]
- Bac, S.; Rojek, M. Metodyka Oceny Stosunków Wodnych Obszarów Rolniczych Na Podstawie Danych Klimatycznych. Zesz Nauk ART Olszt 1977, 21, 13–24. [Google Scholar]
- Allen, R.G.; Pereira, L.S.; Raes, D.; Smith, M. Crop Evapotranspiration (Guidelines for Computing Crop Water Requirements). FAO Irrig. Drain. Pap. 1998, 56, 301. Available online: https://www.fao.org/3/X0490E/x0490e00.htm (accessed on 20 September 2023).
- Szejba, D. Evapotranspiration of Grasslands and Pastures in North-Eastern Part of Poland. In Evapotranspiration-Remote Sensing and Modeling; Irmak, A., Ed.; InTech: Lahore, Pakistan, 2012; ISBN 978-953-307-808-3. Available online: http://www.intechopen.com/books/evapotranspiration-remote-sensing-andmodeling/evapotranspiration-of-grasslands-and-pastures-in-north-eastern-part-of-poland (accessed on 21 September 2023).
- Hargreaves, G.; Allen, R. History and Evaluation of Hargreaves Evapotranspiration Equation. J. Irrig. Drain. Eng. 2003, 129, 53–63. [Google Scholar] [CrossRef]
- Brandyk, T.; Szatyłowicz, J. The Influence of Meadow Abandonment on Physical Properties and Water Conditions of Peat Soils. In Restoration of Carbon Sequestration Capacity and Biodiversity in Abandoned Grassland on Peatland in Poland; Wydawnictwo Akademii Rolniczej im: Poznań, Poland, 2002; pp. 77–93. [Google Scholar]
- Zehnsdorf, A.; Willebrand, K.C.U.; Trabitzsch, R.; Knechtel, S.; Blumberg, M.; Müller, R.A. Wetland Roofs as an Attractive Option for Decentralized Water Management and Air Conditioning Enhancement in Growing Cities—A Review. Water 2019, 11, 1845. [Google Scholar] [CrossRef]
- Abtew, W. Evapotranspiration Measurements and Modeling for Three Wetland Systems in South Florida. Am. Water Resour. Assoc. 1996, 32, 465–473. [Google Scholar] [CrossRef]
- Kraft, H. Verdungstungsleistung von Limnophyten Bei Der Abwasserreinigung in Hydrobotanischen Kläranlagen (Efficiency of Limnophytes in Waste Water Treatment in Hydrobotan Sewage Treatment Plants). Wasser-Abwasser-Schung 1984, 17, 12–15. [Google Scholar]
- Berretta, C. Moisture Content Behaviour in Extensive Green Roofs During Dry Periods: The Influence of Vegetation and Substrate Characteristics. J. Hydrol. 2014, 511, 374–386. [Google Scholar] [CrossRef]
- Li, Y.; Babcock, R. Green Roofs Against Pollution and Climate Change. A Review. Agron. Sustain. Dev. 2014, 34, 695–705. [Google Scholar] [CrossRef]
- Beysens, D.; Lekouch, I.; Muselli, M.; Mileta, M.; Milimouk-Melnytchouk, I.; Šojat, V. Physical and chemical properties of dew and rain water in the Dalmatian Coast, Croatia. In Proceedings of the International Conference on Fog, Fog Collection and Dew, Münster, Germany, 25–30 July 2010; Available online: http://meetings.copernicus.org/fog2010 (accessed on 20 September 2023).
- Ekmekyapar, F. Ecotoxicological and Inorganic Chemicals’ Characterization of Rainwater in an Urban Residential Area. Desalin. Water Treat. 2015, 56, 1291–1298. [Google Scholar] [CrossRef]
- Zubala, T. Assessment of the Variability of Rainwater Quality and the Functioning of Retention Reservoirs in the Urban Area. Rocz. Ochr. Śr. 2020, 22, 840–858. Available online: https://www.ros.edu.pl/index.php/en/component/content/article/864-059-ros-v22-r2020.html?Itemid=299 (accessed on 20 September 2023).
- Huang, Q.; Wang, Z.; Wang, C.; Wang, S.; Jin, X. Phosphorus Release in Response to pH Variation in the Lake Sediments with Different Ratios of Iron-bound P to Calcium-bound P. Chem. Speciat. Bioavailab. 2005, 17, 55–61. [Google Scholar] [CrossRef]
- Kowal, A.L.; Leszczyńska, D. Zastosowanie Ciągłego Monitoring Do Kontroli Jakości Wód. Ochr. Śr. PZITS Wroc. 1984, 435, 23–27. [Google Scholar]
- Kölling, M. Comparison of different methods for redox potential determination in natural waters. Chapter 4. In Redox; Schüring, J., Schulz, H.D., Fisch, W.R., Böttcher, J., Duijnisveld, W.H.M., Eds.; Redox Springer: Berlin/Heidelberg, Germany, 2020. [Google Scholar] [CrossRef]
- Sigg, L. Redox Potential Measurements in Natural Waters: Significance, Concepts and Problems. In Redox: Fundamentals, Processes and Applications; Schüring, J., Schulz, H.D., Fischer, W.R., Böttcher, J., Duijnisveld, W.H.M., Eds.; Springer: Berlin/Heidelberg, Germany, 2000; pp. 1–12. ISBN 978-3-662-04080-5. [Google Scholar]
- Shrestha, A.K.; Basnet, N. The Correlation and Regression Analysis of Physicochemical Parameters of River Water for the Evaluation of Percentage Contribution to Electrical Conductivity. J. Chem. 2018, 2018, 8369613. [Google Scholar] [CrossRef]
- Douterelo, I. Phosphate Dosing in Drinking Water Distribution Systems Promotes Changes in Biofilm Structure and Functional Genetic Diversity. Front. Microbiol. 2020, 11, 599091. [Google Scholar] [CrossRef]
- Land, M. How Effective Are Created or Restored Freshwater Wetlands for Nitrogen and Phosphorus Removal? A Systematic Review. Environ. Evid. 2016, 5, 9. [Google Scholar] [CrossRef]
- Gao, P.; Zhang, C. Study on Phosphorus Removal Pathway in Constructed Wetlands with Thermally Modified Sepiolite. Sustainability 2022, 14, 12535. [Google Scholar] [CrossRef]
- Preiner, S.; Dai, Y.; Pucher, M.; Reitsema, R.E.; Schoelynck, J.; Meire, P.; Hein, T. Effects of Macrophytes on Ecosystem Metabolism and Net Nutrient Uptake in a Groundwater Fed Lowland River. Sci. Total Environ. 2020, 721, 137620. [Google Scholar] [CrossRef]
- Zehnsdorf, A.; Blumberg, M.; Müller, R.A. Helophyte Mats (Wetland Roofs) with High Evapotranspiration Rates as a Tool for Decentralised Rainwater Management–Process Stability Improved by Simultaneous Greywater Treatment. Water Supply 2019, 19, 808–814. [Google Scholar] [CrossRef]
- Dolan, B.; Bovard, B.; Foht, E. Comparison of heat flux reduction in a Wetland modular rooftop garden system and a xeric rooftop garden system in Southwest Florida. In Proceedings of the 12th International Symposium on Biogeochemistry of Wetlands, Coral Springs, FL, USA, 23–26 April 2018. 70p. [Google Scholar]

| Period | kc | Period | kc |
|---|---|---|---|
| April—1st decade | 0.51 | July—1st decade | 1.24 |
| April—2nd decade | 0.73 | July—2nd decade | 1.24 |
| April—3rd decade | 0.89 | July—3rd decade | 1.25 |
| May—1st decade | 1.02 | August—1st decade | 1.28 |
| May—2nd decade | 1.11 | August—2nd decade | 1.32 |
| May—3rd decade | 1.17 | August—3rd decade | 1.40 |
| June—1st decade | 1.21 | September—1st decade | 1.50 |
| June—2nd decade | 1.23 | September—2nd decade | 1.64 |
| June—3rd decade | 1.23 | September—3rd decade | 1.84 |
| Month | Temperature [°C] | |||
|---|---|---|---|---|
| Minimum | Maximum | Average | Average 1991–2020 * | |
| April | −2.3 | 21.1 | 7.4 | 8.60 |
| May | 2.9 | 27.1 | 14.2 | 13.40 |
| June | 6.4 | 33.2 | 19.9 | 17.50 |
| July | 10.0 | 34.5 | 19.7 | 18.80 |
| August | 10.4 | 32.3 | 21.9 | 18.50 |
| September | 1.5 | 21.6 | 12.2 | 13.80 |
| Month | Daily Precipitation Minimum/Maximum [mm] | Total Precipitation [mm] | No. Days with Precipitation | Average 1991–2020 * |
|---|---|---|---|---|
| April | 0.2/7.8 | 41.6 | 15 | 36.4 |
| May | 0.4/16.0 | 44.2 | 12 | 63.6 |
| June | 0.2/10.4 | 42.6 | 10 | 70 |
| July | 0.4/19.2 | 79.4 | 12 | 88.1 |
| August | 0.2/9.6 | 25.6 | 7 | 66.5 |
| September | 0.2/12.2 | 24.6 | 8 | 57.4 |
| SS | BOD5 | P-PO4 | EC | pH | Eh | Color | |
|---|---|---|---|---|---|---|---|
| SS | 1.00000 | 0.14894 | 0.23107 | 0.38730 | −0.24847 | 0.22593 | 0.30461 |
| BOD5 | 0.14894 | 1.00000 | −0.07121 | 0.11119 | −0.44949 | 0.00662 | 0.25591 |
| P-PO4 | 0.23107 | −0.07121 | 1.00000 | −0.03876 | 0.66416 | −0.52715 | 0.12794 |
| EC | 0.38730 | 0.11119 | −0.03876 | 1.00000 | −0.22029 | 0.06229 | 0.73836 |
| pH | −0.24847 | −0.44949 | 0.66416 | −0.22029 | 1.00000 | −0.65196 | −0.22260 |
| Eh | 0.22593 | 0.00662 | −0.52715 | 0.06229 | −0.65196 | 1.00000 | −0.02628 |
| Color | 0.30461 | 0.25591 | 0.12794 | 0.73836 | −0.22260 | −0.02628 | 1.00000 |
Disclaimer/Publisher’s Note: The statements, opinions and data contained in all publications are solely those of the individual author(s) and contributor(s) and not of MDPI and/or the editor(s). MDPI and/or the editor(s) disclaim responsibility for any injury to people or property resulting from any ideas, methods, instructions or products referred to in the content. |
© 2023 by the authors. Licensee MDPI, Basel, Switzerland. This article is an open access article distributed under the terms and conditions of the Creative Commons Attribution (CC BY) license (https://creativecommons.org/licenses/by/4.0/).
Share and Cite
Karczmarczyk, A.; Baryła, A.; Szejba, D.; Miechowicz, B.; Amroziński, R.; Ciuraj, M. Quantitative, Qualitative and Thermal Aspects of Rainwater Retention on Wetland Roofs. Sustainability 2023, 15, 16018. https://doi.org/10.3390/su152216018
Karczmarczyk A, Baryła A, Szejba D, Miechowicz B, Amroziński R, Ciuraj M. Quantitative, Qualitative and Thermal Aspects of Rainwater Retention on Wetland Roofs. Sustainability. 2023; 15(22):16018. https://doi.org/10.3390/su152216018
Chicago/Turabian StyleKarczmarczyk, Agnieszka, Anna Baryła, Daniel Szejba, Barbara Miechowicz, Radosław Amroziński, and Marcin Ciuraj. 2023. "Quantitative, Qualitative and Thermal Aspects of Rainwater Retention on Wetland Roofs" Sustainability 15, no. 22: 16018. https://doi.org/10.3390/su152216018
APA StyleKarczmarczyk, A., Baryła, A., Szejba, D., Miechowicz, B., Amroziński, R., & Ciuraj, M. (2023). Quantitative, Qualitative and Thermal Aspects of Rainwater Retention on Wetland Roofs. Sustainability, 15(22), 16018. https://doi.org/10.3390/su152216018