Article

Innovative Thermal Renders Incorporating Oyster Shells for Sustainable Insulation

1
CERIS, DECivil, Instituto Superior Técnico, University of Lisbon, 1049-001 Lisbon, Portugal
2
CERENA, Instituto Superior Técnico, University of Lisbon, 1049-001 Lisbon, Portugal
3
Itecons, 3030-289 Coimbra, Portugal
4
CERIS, University of Coimbra, 3030-790 Coimbra, Portugal
5
Nofima, Norwegian Institute of Food Fisheries and Aquaculture Research, 9019 Tromsø, Norway
*
Author to whom correspondence should be addressed.
Sustainability 2023, 15(22), 15952; https://doi.org/10.3390/su152215952
Submission received: 19 October 2023 / Revised: 6 November 2023 / Accepted: 8 November 2023 / Published: 15 November 2023

Abstract

:
In accordance with current sustainable development objectives, it is intended to implement innovative and sustainable solutions at economic, environmental, and functional levels, boosting the construction sector to increasingly contribute to society. Expanded cork is an alternative to sand aggregate in improving the thermal insulating properties of renders. In addition, other materials can be incorporated as aggregates in an attempt to contribute to both the improvement of the physical characteristics that the render must fulfil as well as the improvement of thermal behaviour (if possible). In this sense, bio-based materials generated by the aquaculture sector, such as oyster shells, can contribute as a bio-based insulation material for thermal renders. In this study, thermal natural hydraulic lime mortars were produced from a mixture of expanded cork (EC) insulating aggregate and oyster shells (OSs). The percentages of replacing EC by OSs were 20, 30, 40, and 50%. The tests were carried out in fresh and hardened states. The studied mortars presented a thermal conductivity and compressive strength of 0.151 W/(m·K) and 0.63 MPa, respectively. The most interesting performance between thermal conductivity and compressive strength was for the composite with 50% of each bio-based material. The potential of incorporating oyster shells as a bio-based insulation material could contribute to a sustainable blue circular economy.

1. Introduction

The transition towards sustainability is a pressing need, especially in light of the sharp increase in the global emissions of polluting gases. It is important to note that the construction sector plays a significant role in this scenario and is currently responsible for 36% of energy consumption and 37% of carbon dioxide (CO2) emissions [1]. On the other hand, the construction sector offers viability for the implementation of new strategies aimed at decarbonization and climate change mitigation. It is crucial to adopt energy-focused building improvement strategies aimed at reducing the use of fossil fuels and increasing energy efficiency [1,2]. As part of its Plan to Achieve the 2030 Climate Target, the European Commission has proposed a reduction of at least 55% in greenhouse gas emissions in the construction sector in the European Union by 2030, compared to 1990 levels [3]. Greenhouse gas (GHG) emissions associated with construction are intrinsically linked to all stages of the life cycle of materials, from extraction or harvesting, to manufacturing, transport, construction, use, and eventual demolition. On a global scale, cement stands out as one of the main emitters of carbon dioxide (CO2) related to construction materials [2,4,5].
One of the crucial aspects is to create more sustainable strategies in the process of insulating buildings. Thermal insulation plays a significant role in retaining energy and reducing the need for heating and cooling, thus contributing to the reduction of global energy demand and benefiting the planet and social well-being [6,7]. Thermal insulation attracts attention not only because of its function, but also because of the production process [8]. Currently, the materials used on a global scale include EPS, XPS, PUR, stone wool, and glass wool. However, more sustainable solutions based on organic compounds such as cellulose and cork have aroused growing interest in the scientific community [8,9,10]. The use of natural products not only reduces environmental impact, but also helps to reduce the extraction of raw materials and the amount of waste accumulated in landfill sites [11].
Another natural material that has been explored for thermal and acoustic insulation purposes is bivalve shells. Although no experimental studies of lime mortars, insulating aggregates, and oyster shells have been found [12], it is important to produce and evaluate thermal renders with expanded cork and bivalve shell as aggregates. There is already a study using calcined oyster shell powder to produce vitrocrystalline foams [13]. Martínez-García et al. [14] made a wall prototype and concluded that a section of confined mussel shell displays a behaviour similar to that of commercialised insulation material. Bivalve shells from aquaculture generate a large amount of waste and their natural degradation process is slow, causing environmental and social problems [15]. Due to growing global production in the aquaculture sector, the efficiency and optimization of natural marine resources is essential to help reduce environmental risks and ecological scarcity [16,17].
The use of shells in construction has roots that go back many generations in several nations, due to their limestone-based properties, which give structures greater strength and durability [18]. The availability of shells for construction came from coastal regions and they were often used as a local material and integrated into vernacular architecture [19,20]. The type of lime varied according to the availability of materials in each region, with oyster shells being used in seaside locations and calcium and magnesium rocks such as chalk, dolomite, and limestone being used elsewhere [21]. Some techniques have been developed over the decades to improve the use of shells in construction, such as Chunam, an Indian technique [22] and Tabby, a technique that possibly originated in Spain [23]. Both techniques were found in buildings from the 16th century onwards [22,23,24]. Constructions using these techniques and techniques adapted to the given regions have been identified in Africa, Asia, Europe, South America, and North America [19,22,23,24,25,26].
In 2020, the European Commission, as part of the European Green Deal, launched an ambitious strategy to accelerate and promote the transformation of existing buildings into more ecologically sustainable structures. This strategy focuses on buildings, incorporating concepts such as energy efficiency, life cycle, and circularity, with an emphasis on reducing the ecological footprint of buildings through the sustainable use of resources. The aim is to transform the construction sector into a more sustainable industry, promoting the adoption of green infrastructure, the use of organic building materials, and the integration of nature-based solutions [3]. Furthermore, as part of the revision of the recovery targets for construction and demolition waste, the European Commission paid special attention to insulation materials, which are generating a growing waste stream [27]. The national strategies presented by Portugal, such as PO Mar 2030 and PO Algarve 2030, recognize the weight of the marine sector in the science and technology infrastructure network and propose an approach focused on the conservation and sustainable management of marine biodiversity, as well as initiatives to encourage the collection of marine waste to promote the circular economy of the sea [28,29].
As mentioned before, the construction industry has the opportunity to reuse a bio-based material derived from the aquaculture industry to make buildings more environmentally friendly. With this in mind, this work aims to analyse the potential for using oyster shells as a bio-based insulation material in thermal renders. An experimental study of mortars with percentages of EC aggregate replaced by OSs (20, 30, 40, and 50%), was carried out. The tests were carried out in the fresh state and in the hardened state at 28 and 240 days in the construction laboratory of the Instituto Superior Técnico of the University of Lisbon. The potential of incorporating oyster shell and expanded cork insulation aggregates into hydraulic lime-based thermal mortars is discussed, considering the experimental results.

2. Materials and Methods

In this study, the mortars were produced with natural hydraulic lime -NHL 3.5. The technical specifications of this binder are in accordance with EN 459-1 [30], as indicated by the manufacturer. Table 1 demonstrated the chemical composition of natural hydraulic lime.
The bio-based insulating aggregate was expanded cork. Therefore, the expanded cork was replaced in different percentages by oyster shell aggregate. The EC was obtained by donation from a cork producing company in Portugal, and its particle size measured 0.5–2 mm. The OSs were obtained by donation from an oyster farmer associated with a cooperative in the Algarve, Portugal. The shells arrived at the laboratory and were cleaned with water, dried at 100 °C for 24 h, and crushed in a cutting mill resulting in a particle size of 0–4 mm, according to Figure 1 [31]. The densities of the natural hydraulic lime, expanded cork, and oyster shells were 758, 52, and 924 kg/m3, respectively. All densities were found according to EN 1097-3 [32].
Regarding the production of the mortars, first, natural hydraulic lime and water were mixed. After that, expanded cork and oyster shells were added at the same time. The mixer was used at low and high speeds, and with a pause after all materials were added to the mixture. Mixing the mortars took a total of 3 min and 30 s [33]. The bio-based materials and mortar mix can be seen in Figure 2.
The amount of the aggregate was based on a control mortar (1:3, by volume) produced with calibrated sand. The sand was replaced by EC and OSs in volume, and after that the masses (in kg) of each material were found to produce the mortars. Table 2 presents the four different types of mortar produced, the aggregate replacement percentages and the ratio of materials for each mortar. The amount of water was similar among all mortars produced.
After the production of the mortars, tests were conducted in their fresh state. This involved moulding three prismatic specimens measuring 40 × 40 × 160 mm and one circular specimen measuring 40 × 100 mm for each series. This was done to facilitate the collection of results in the hardened state at both 28 and 240 days of age.

2.1. Tests in the Fresh State

2.1.1. Slump Flow

The slump flow of the mortars was measured in accordance with the recommendations of standard EN 1015-3 [34]. The result of the slump flow diameter was established according to the classification of the EN 998-1 standard [35]. Considering the aggregates used in this study, the slump flow diameter was set at 160 ± 10 mm, as most mortars are classified with densities between 600 to 1200 kg/m3.

2.1.2. Density

The EN 1015-6 standard [36] determines the volumetric mass test in the fresh state. A cylindrical container of known volume was filled with mortar and compacted in two stages. After levelling the material, the set (container + mortar) was weighed. The density was determined by the mass of the set, minus the mass of the cylindrical container, divided by the volume of the cylindrical container.

2.2. Tests in the Hardened State

2.2.1. Thermal Conductivity

ISOMET 2114 equipment [37] was used to measure the thermal conductivity, according to ASTM D5930-9 [38]. A surface probe was placed on the specimens and the thermal behaviour of the material to the probe’s thermal impulses was obtained. The most appropriate equipment thermal conductivity coefficient range of the types of mortars produced was 0.04 to 0.3 W/(m·K) by transient mode. The results were obtained from three measurements carried out on the same 40 × 100 mm cylindrical specimen at 28 and 240 days due to the test being non-destructive. The test site had a temperature of 20 °C and 50% relative humidity.

2.2.2. Apparent Density

The apparent density was determined according to EN 1015-10 [39]. The volume of the specimens was obtained through three dimensions of each prism (length, width and thickness). Each side was measured three times. The weight of each of the three prismatic specimens was then divided by its volume. The specimens were reused for the dynamic modulus of elasticity, ultrasound, and flexural and compression strength tests, respectively, at 28 days due to the apparent density test being non-destructive. At 240 days, half of the sample resulting from the flexural strength test was used to obtain the results.

2.2.3. Open Porosity

Open porosity was found based on the NP EN 1936 standard [40]. After the compressive strength test, the intact parts of the specimens were removed for this test (at 28 and 240 days). The specimens were placed in an oven at a temperature of around 70 °C until they had a constant mass (dry mass, M s ). After determining the dry mass, the specimens were placed in a vacuum container up to a pressure of 2.0 ± 0.7 kPa (15 ± 5 mm of Hg) to eliminate the air contained in the pores. After 24 h, water was added until the specimens were submerged. The pressure was maintained for another 24 h. The immersed specimens were subjected to hydrostatic weighing (mass of the specimen immersed in water, M h ). Finally, the specimens were removed from the water, the excess water was eliminated, and the specimens were weighed again (saturated mass, M s a t ). Equation (1) was used to determine the open porosity.
P a b = M s a t M s M s a t M h × 100

2.2.4. Water Absorption

The water absorption test is described by European Standard EN 1015-18 [41]. This test procedure consists of evaluating the increase in mass of the specimens with the base immersed in 1 cm of water. Three halves of the intact prismatic specimens of each sample resulting from the flexural strength test (28 days) were used. Half of the sample resulting from the flexural strength test was used to obtain the results at 240 days. The samples were dried at a temperature of 70 ± 5 °C until constant mass before starting the test. The samples were placed vertically in a container that was kept covered to prevent water evaporation during the test period. Samples were weighed at 10, 30, 60, 90, 180, 300, 480, 1440, 2880, and 5760 min. The speed of water absorption in the initial moments is characterised by the water absorption coefficient by capillarity, expressed in kg/(m2.min1/2). The time used to determine the coefficient was between 10 and 90 min. The value of the water absorption coefficient was determined by averaging the individual test results. The remaining time used in the test was used to construct capillary absorption curves.

2.2.5. Dynamic Modulus of Elasticity

Three prismatic specimens with previously determined mass and dimensions were used for the dynamic modulus of elasticity test. The specimens were placed under wooden supports that served as support. The transducer of the GrindoSonic MK5 equipment (J.W.Lemmens N.V., Leuven, Belgium) was properly coupled to the surface of the specimen, and with other equipment, taps were made on the surface of the specimens. The value of the fundamental resonance frequency indicated by the GrindoSonic MK5 equipment, in accordance with ASTM E1876-1 [42], was noted. Finally, the modulus of elasticity was calculated from these values using the GrindoSonic software (Winemod Version 2.05). The elastic modulus test was carried out only after 28 days, with the aim of correlating the results with those of traction by flexion, compression, and ultrasound.

2.2.6. Flexural and Compressive Strength

EN 1015-11 [43] determines the test of mechanical strengths to flexural and compression. First, the flexural test was carried out on three prismatic samples of each mortar after 28 days. One of the halves resulting from this test was also used to carry out the compressive strength test at 28 days. The other half was used in the apparent volumetric mass, open porosity, water absorption, ultrasound, and compression tests at 240 days.
In the flexural test, the specimens were subjected to flexural stress. In the case of compression, the force was applied perpendicular to the surface of the specimen. The test ended when the specimens reached rupture.

2.2.7. Ultra-Sounds

The EN 12504-4 [44] regulates the test for determining ultra-sound pulse velocity (US). The test was carried out on three 4 × 4 × 16 cm specimens at 28 days and with half of each of these specimens at 240 days. The equipment used was from the Pundit brand and with 54 Hz flat transducers. The tests were performed using the direct method of the standard.

2.3. Visual Characterization

2.3.1. Stereomicroscopy

Observations were made on the cut surfaces of the 240 days mortars using macro photography and a stereomicroscope. Based on these observations, a comprehensive assessment of the porosity and other macro and microstructural aspects that may influence the properties recorded in the physical-mechanical tests could be performed. The equipment used was a NIKON SMZZ645 stereomicroscope (Nikon Instruments Inc., Melville, NY, USA) coupled with a MOTICAM 10 MP digital camera.

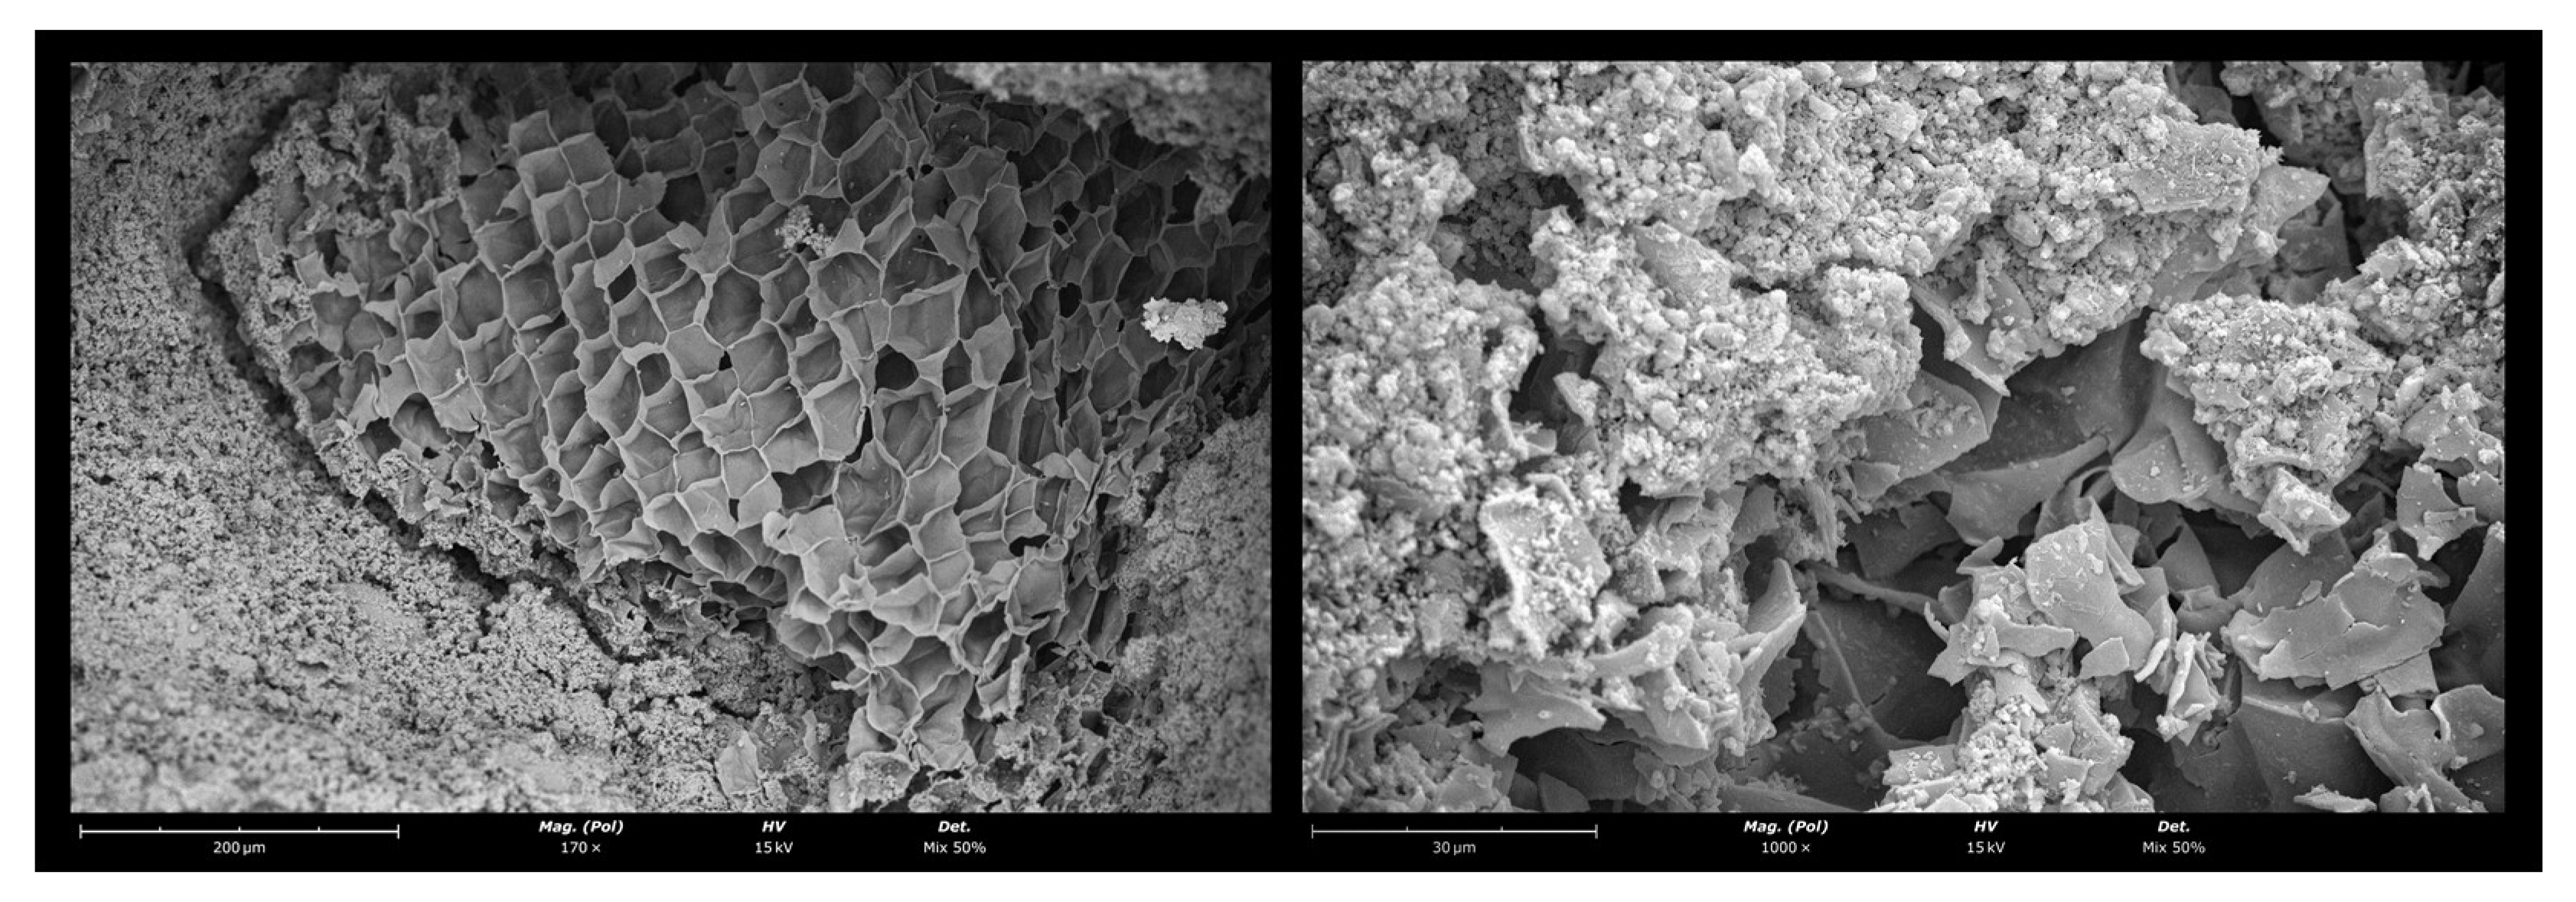
2.3.2. Scanning Electron Microscopy (SEM)

Scanning electron microscopy (SEM) was employed to assess the morphology and microstructure of the mortar in-depth, providing a comprehensive analysis that complemented other techniques. The samples underwent gold sputter coating before being analysed. The images were captured using a FEG-SEM microscope (model JEOL JSM-7001F, Jeol, Tokyo, Japan) equipped with an Oxford EDS detector (Oxford Microbeam, Oxford, UK) operating at accelerated voltages of 10 kV and 25 kV.

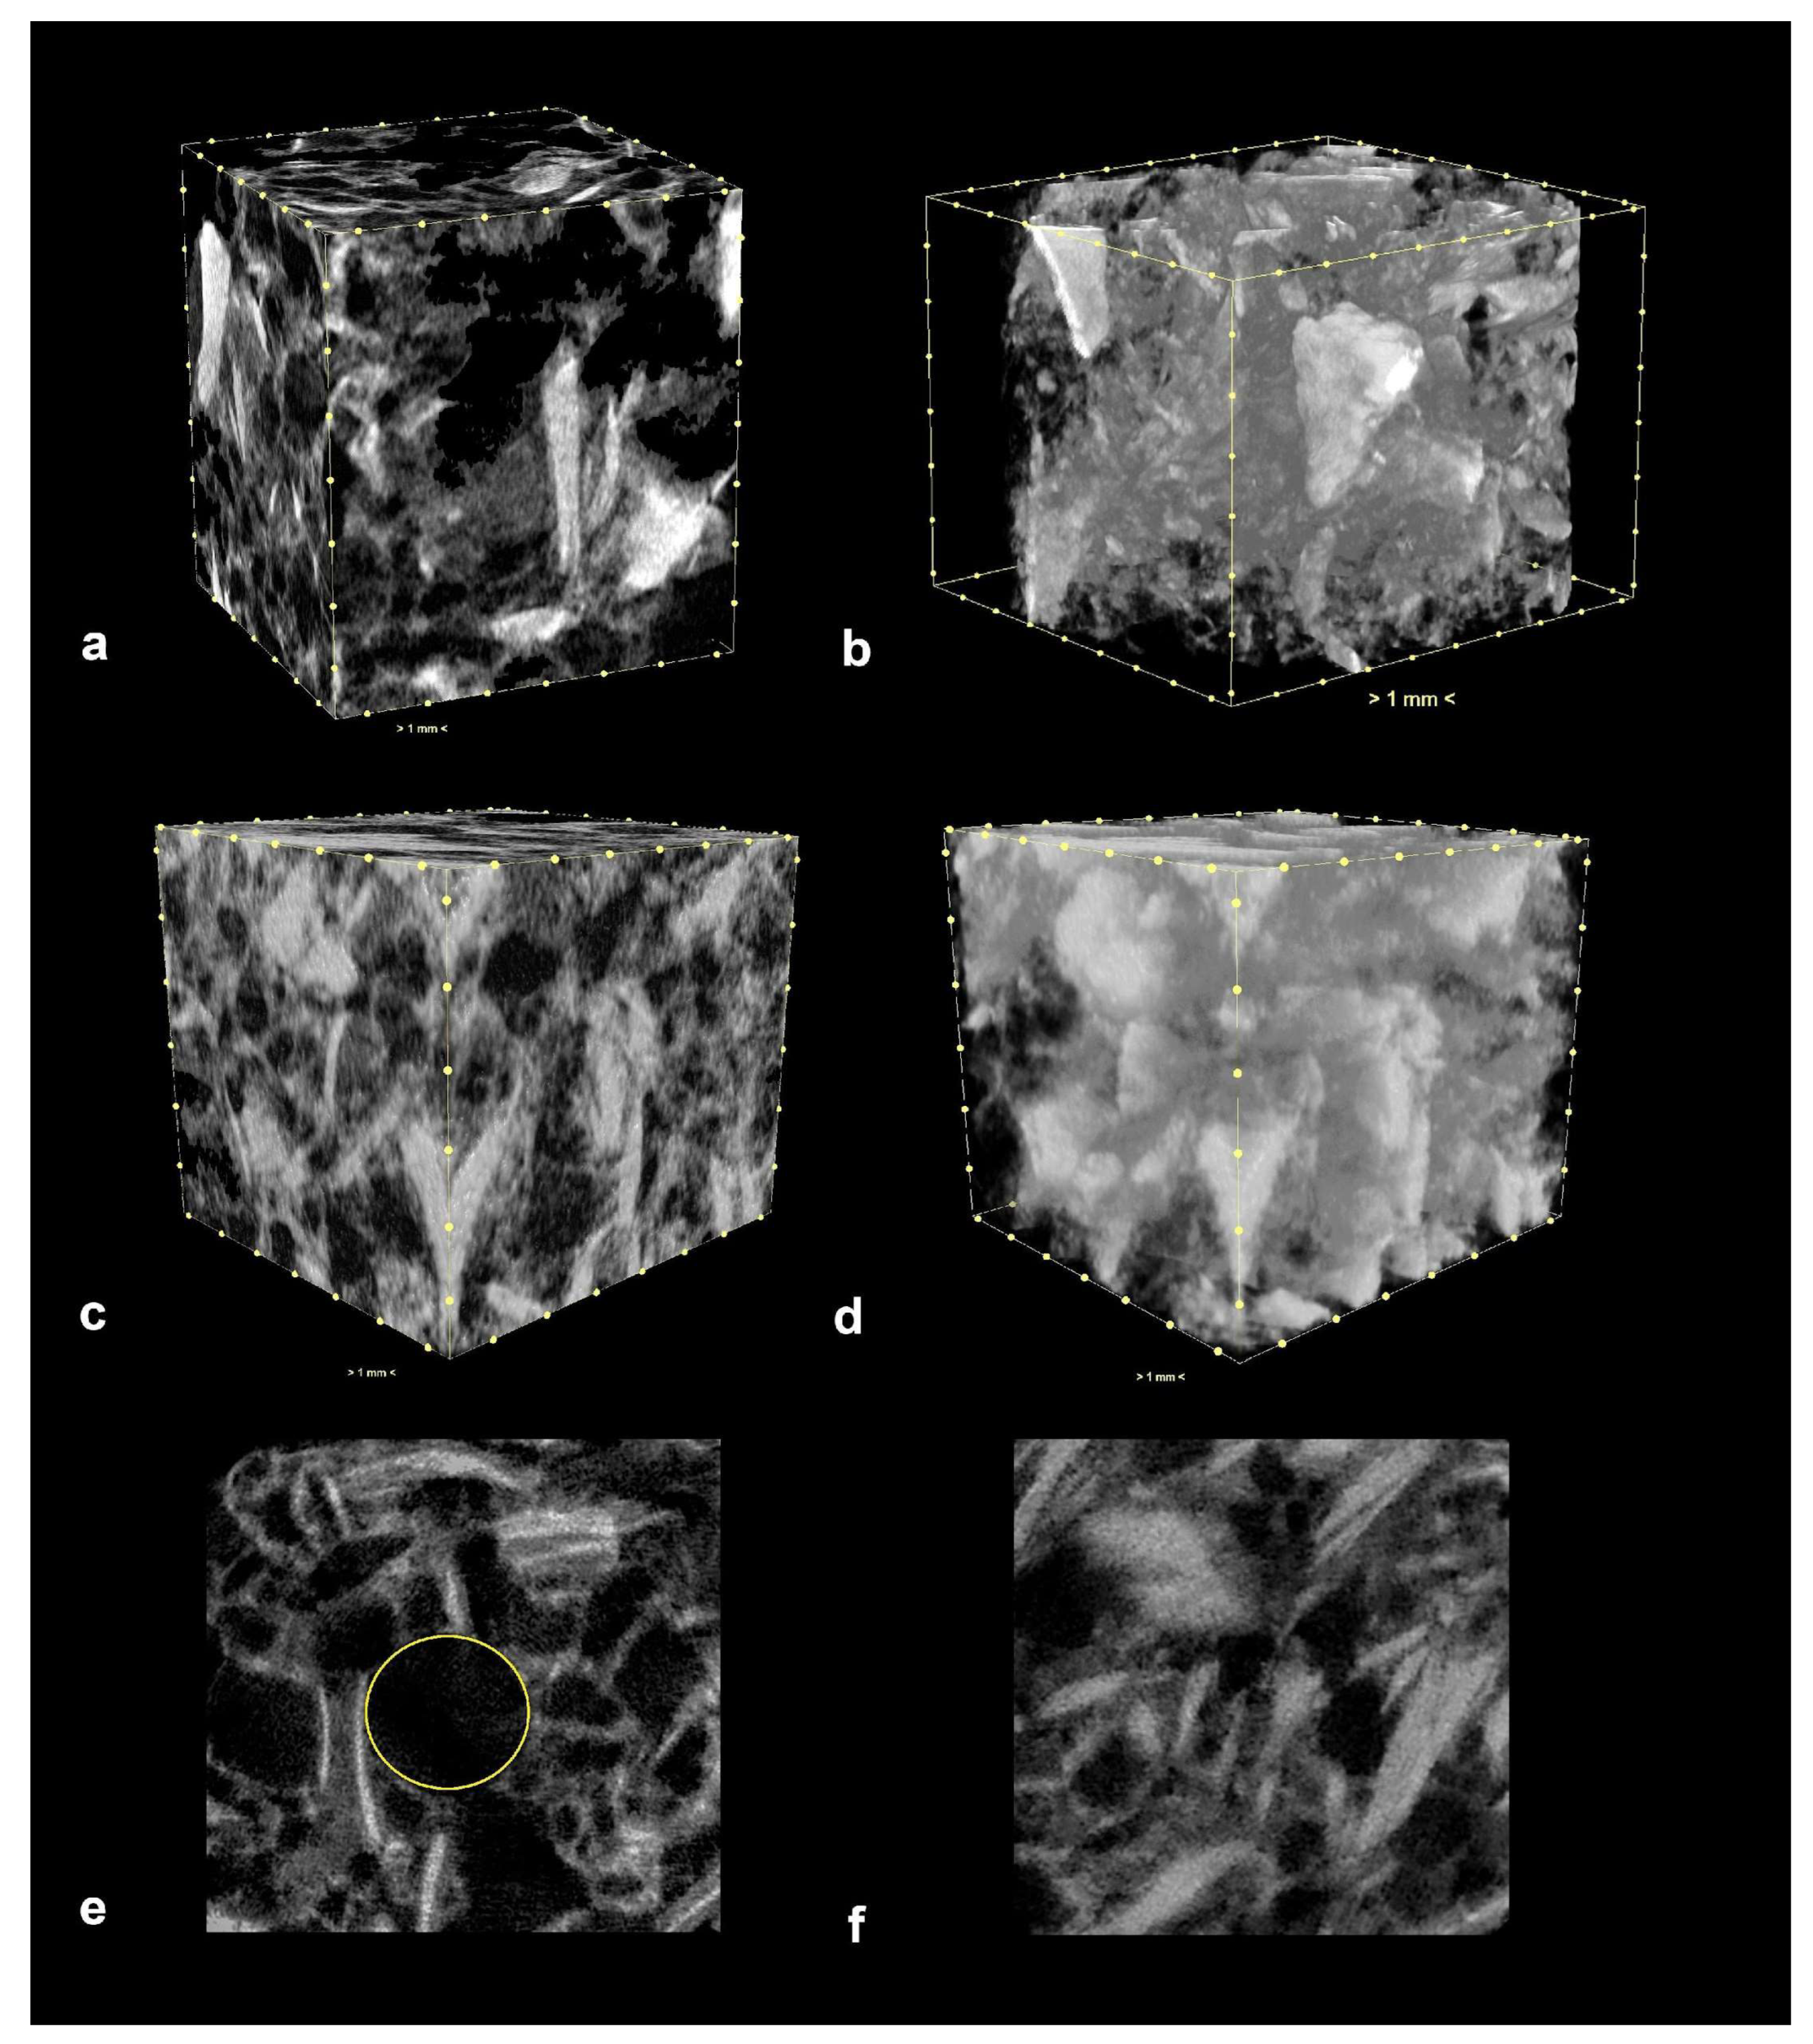
2.3.3. X-ray Microtomography

The data acquisition was performed using the Brucker SKYSCAN1172 scanner (Billerica, MA, USA). This non-destructive technique allows for visualising the internal microstructure of materials. A VDS 1.3 Mp camera was used with a voltage (kV) of 97 and a current intensity (μA) of 102. The resolution used was set at 8.14 μm, with an exposure of 350 ms and a 180° rotation at a step of 0.35°. After the acquisition of the images (radiographs), they were processed using the NRecon reconstruction software (version 1.6.10.4) and converted into slices of the samples under study. The CTvox visualisation program (version 3.1) allows for the simultaneous viewing and manipulation of the entire set of slices, enabling the capture of external and internal images of the object. Using the Ctan analysis software (version 1.15), the images were segmented/binarised to distinguish and characterize all identifiable features. The 2D/3D calculation routine is also provided by Brucker.

3. Results and Discussions

3.1. Fresh State

The results of slump flow and density are presented in Table 3.
Regarding the workability of the mixtures, the water demands of the produced thermal mortars did not vary greatly, which also resulted in little difference in the consistency results obtained. The slump flow diameter was set at 160 ± 10 mm according to EN 998-1 [35].
The density of the aggregates can account for the density observed in the mortars. It is evident that as the substitution of EC by OSs increased, the density of the mortars also rose. Notably, the mortar composed of 50% EC and 50% OSs exhibited a density 37% higher than the one with 80% EC and 20% OSs.
Gomes et al. [45] studied some industrial thermal renders, and one of them was made of natural hydraulic lime and cork, which had a water/dry constituents ratio of 0.55. The consistency and density values in the fresh state were 151 mm and 896 kg/m3, respectively, similar to what would correspond to a control mortar in this case.

3.2. Hardened State

3.2.1. Thermal Conductivity

Table 4 presents the thermal conductivity results of the mortars.
According to the results of the thermal conductivity test, the equipment recorded the following coefficients: 0.07 and 0.08 W/(m·K) for mortars EC80/OS20 and EC70/OS30, respectively, and 0.12 and 0.15 W/(m·K) for mortars EC60/OS40 and EC50/OS50, respectively. The thermal behaviour of these mortars remained consistent at both 28 and 240 days, with small variations in the coefficient of variation. It is important to note that these classifications adhere to the EN 998-1 standard [35], which establishes specific requirements for T1 (≤0.1 W/(m·K)) and T2 (≤0.2 W/(m·K)) thermal conductivity values. As a result, mortars consisting of 80% EC and 20% OS, as well as mortars with a composition of 70% EC and 30% OS, can be classified under T1. Mortars comprising 60% EC and 40% OSs, and those with a 50% EC and 50% OSs composition, fall into the T2 category.
In Borges et al. [46] study, cement mortars produced with 100% expanded cork as aggregate were also classified as T1. The thermal conductivity result presented was 0.08 W/(m·K) at 28 days.

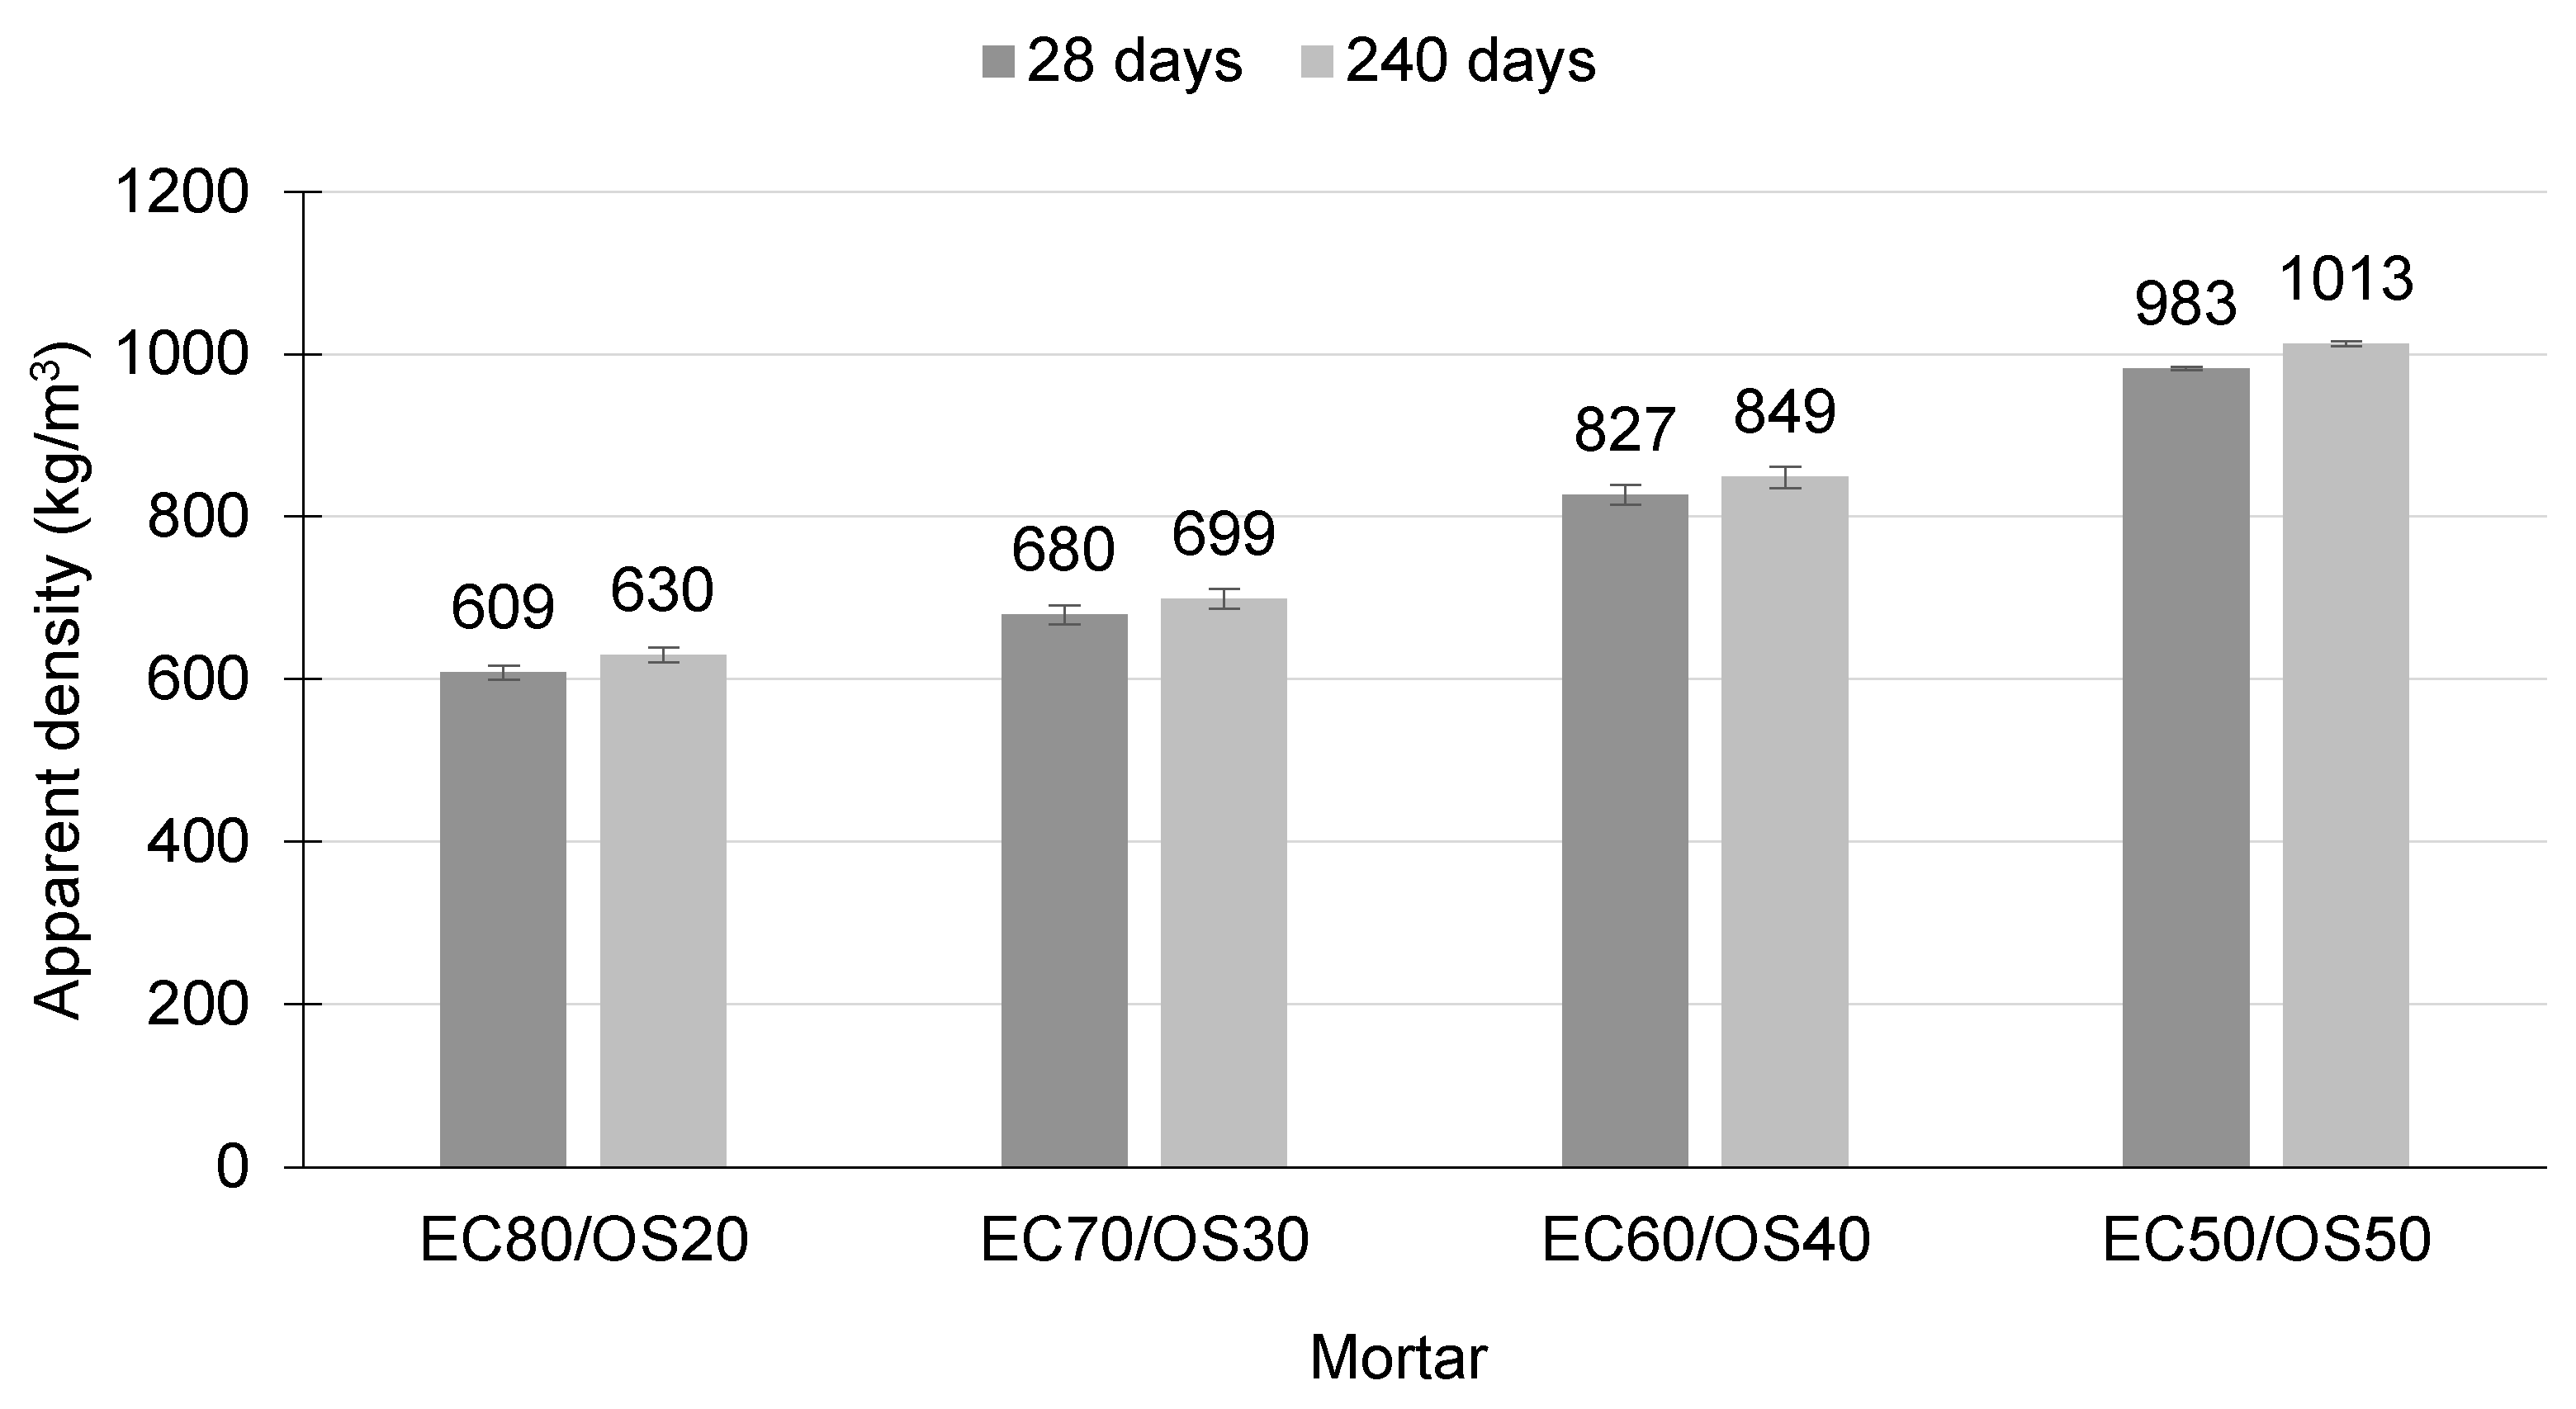
3.2.2. Apparent Density and Open Porosity

Figure 3 displays the findings related to apparent density and standard deviation in error bars.
In terms of density, it was observed that the EC80/OS20 and EC70/OS30 mortars exhibited the most similar results, both at 28 days and 240 days. Notably, the density of the EC50/OS50 mortar, at 983 kg/m3, was 62% higher than that of the EC80/OS20 mortar after 28 days, and this difference remained consistent at around 60% even at 240 days. EN 998-1 [35] classifies these renders as lightweight renders (dry apparent density ≤ 1300 kg/m3). In the industrial thermal render of natural hydraulic lime and cork, the hardened bulk density result found was 642 kg/m3, according to Gomes et al. [45].
The EC60/OS40 and EC50/OS50 mortars had porosities of 46% and 43.6% at 28 days and 44.3% and 41.1% at 240 days, respectively, It is worth noting that these were the mortars that exhibited the most significant variation in results between the two age tests. In contrast, the variation in porosity for the EC80/OS20 and EC70/OS30 mortars did not exceed 1% across the different ages studied, with porosity values of 48% and 47.5% at 28 days, and 47.3% and 46.4% at 240 days, respectively. The EC50/OS50 mortar demonstrated the lowest open porosity at both 28 and 240 days compared to the other mortars.
Gomes et al. [45] found a result of 47.3% open porosity for an industrial thermal render of natural hydraulic lime and cork. The authors state that the open porosity of the renders shows that cork incorporation rates greater than 70% result in open porosity values between 38% and 47% in cement mortars.
It is anticipated that with a decrease in apparent density (both in the fresh and hardened states) and an increase in open porosity, mortars containing a higher percentage of expanded cork in their composition would exhibit a reduction in the thermal conductivity coefficient.

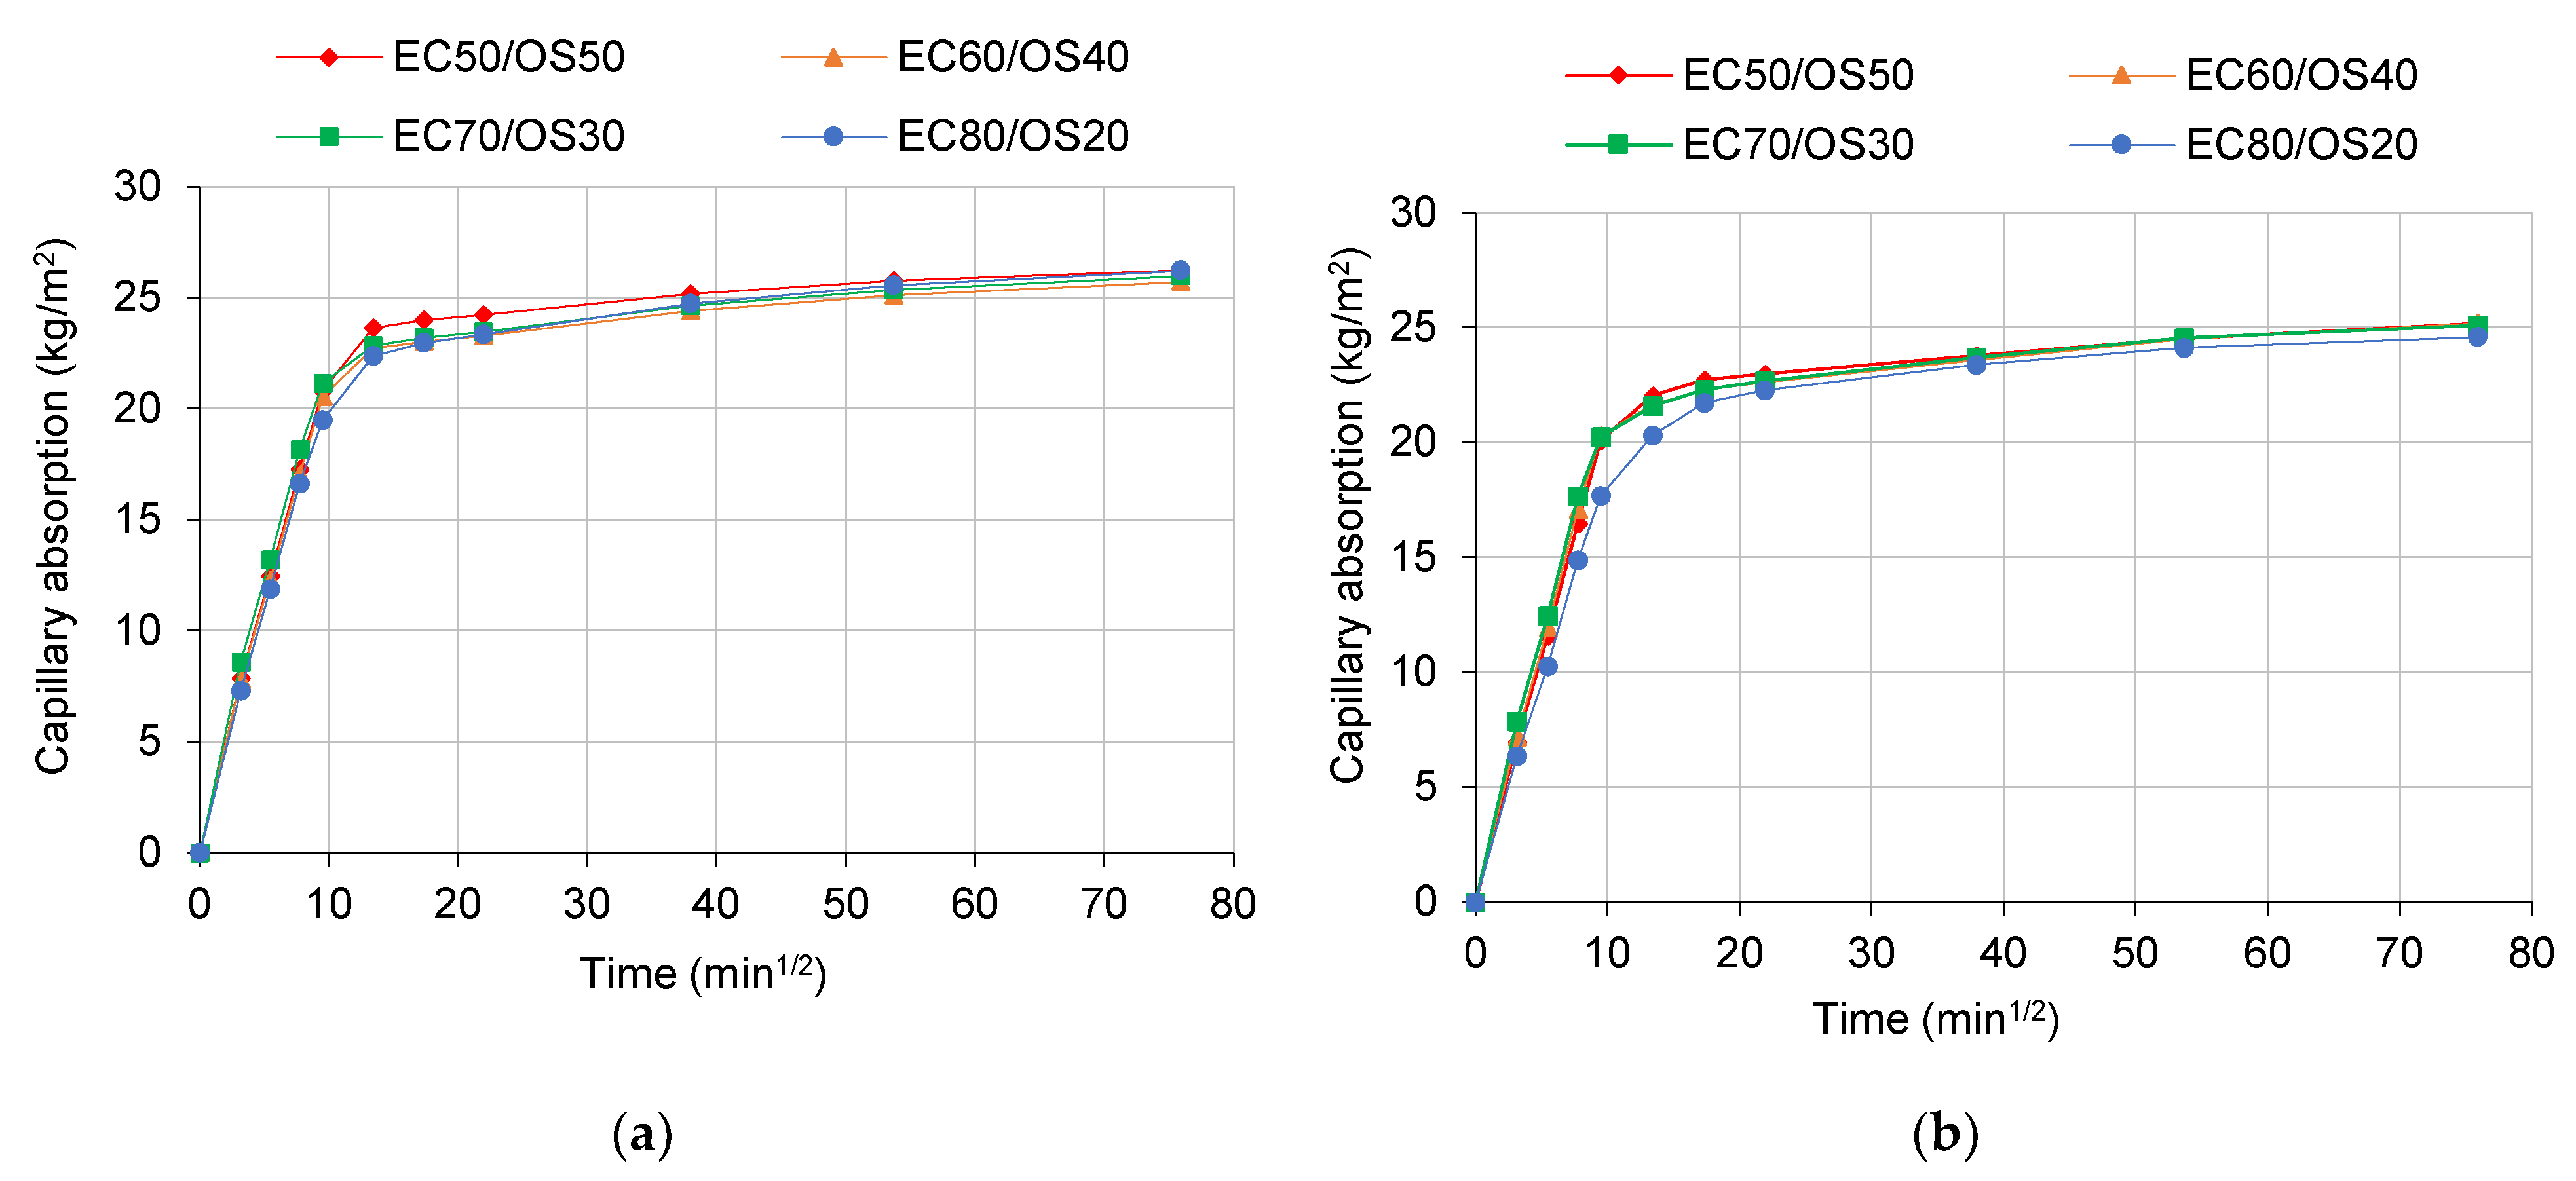
3.2.3. Water Absorption

The water absorption coefficients at 28 and 240 days exhibited minimal variations across the various mortar types. At 28 days, the recorded values were 1.93, 1.98, 2.02, and 2.05 kg/(m2min1/2). The EC80/OS20 mortar, though with a relatively small variation, displayed the most significant change, as it decreased to 1.79 kg/(m2min1/2) at 240 days. Conversely, the other mortars maintained consistent results. It is worth noting that the mortar with the lowest porosity did not necessarily have the lowest water absorption coefficient. However, none of the mortars met the parameters established by EN 998-1 standard [35] (W0—not specified; W1—C ≤ 0.4 kg/(m2min1/2); W2—C ≤ 0.2 kg/(m2min1/2).
The total volume of water absorbed during the 5760 min testing period was calculated based on the capillary curves depicted in Figure 4a (28 days) and Figure 4b (240 days). These capillary absorption curves clearly illustrate the similarities among the mortars, with somewhat more noticeable differences in the 240-day test due to increased overlap in the curves. In contrast, the EC80/OS20 mortar showed a minor reduction in capillary absorption values at this stage. Towards the final segments of both tests, there’s a tendency for capillary absorption values to stabilize, which is attributed to the saturation of the specimens. This observation leads to the conclusion that the capillary absorption coefficient is predominantly influenced by water absorption during the initial stages of the test for mortars containing expanded cork and oyster shells in their composition.

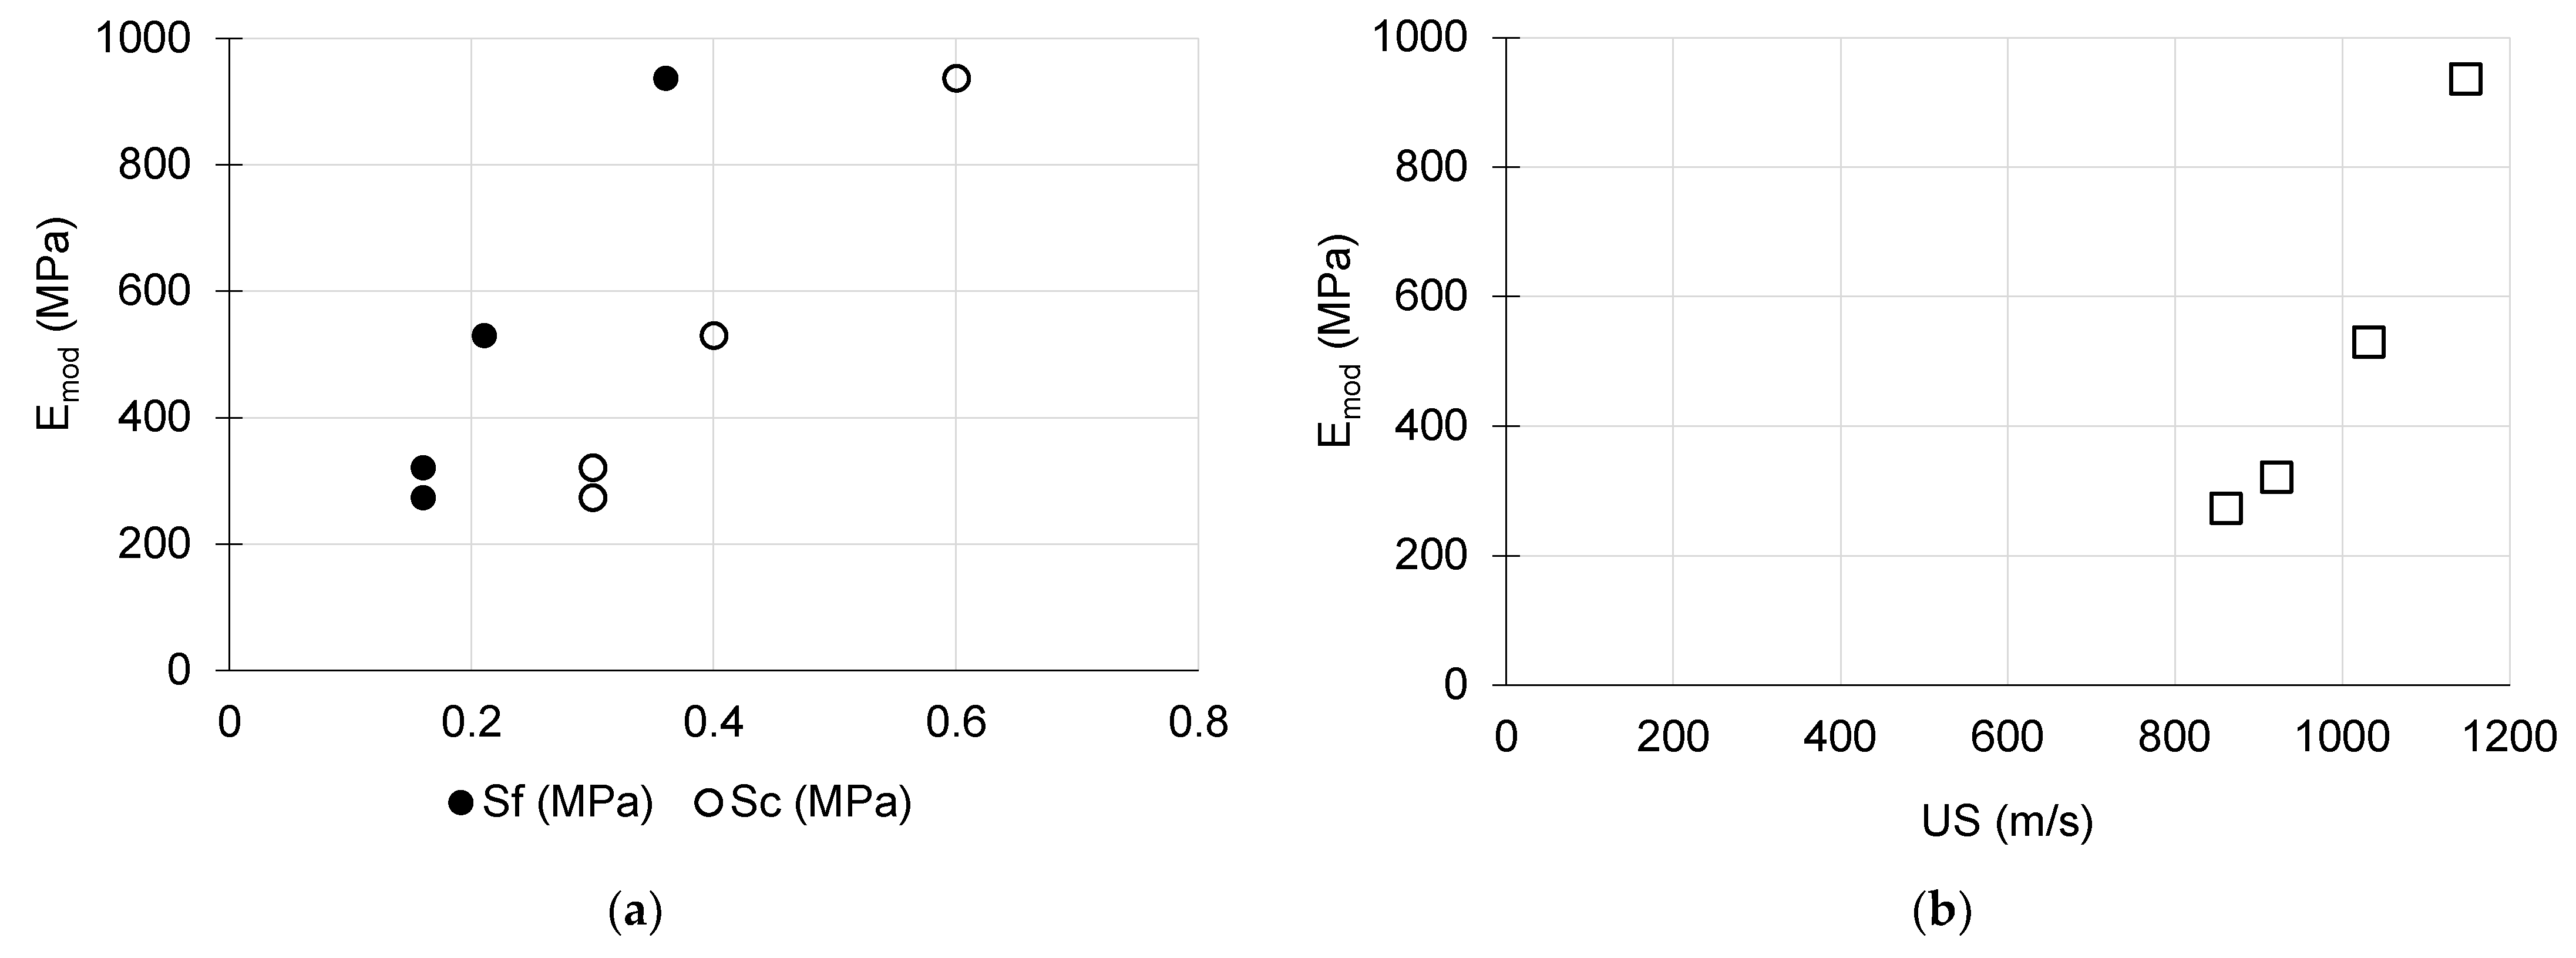
3.2.4. Mechanical Properties

The results of dynamic modulus of elasticity, flexural and compressive strength, and ultra-sound pulse velocity tests are shown in Table 5.
With the incorporation of higher proportions of oyster shells, a noticeable increase in the mechanical strength of the mortars is evident. However, this enhancement comes at the expense of greater thermal conductivity. Nonetheless, even with the achievement of higher thermal performance, the results exhibit a remarkable consistency across mortars with different combinations of expanded cork and oyster shells, effectively meeting the standard classifications. However, not all mortars (EC80/OS20 and EC70/OS30) meet the normative compressive strength classifications. EC60/OS40 and EC50/OS50 were the mortars that fit the CS I classification: 04 to 2.5 MPa according to EN 998-1 [35].
The tendency between flexural strength and compressive strength finds strong support in the correlation of these properties with the dynamic modulus of elasticity (depicted in Figure 5a) and ultrasound pulse velocity (as shown in Figure 5b).

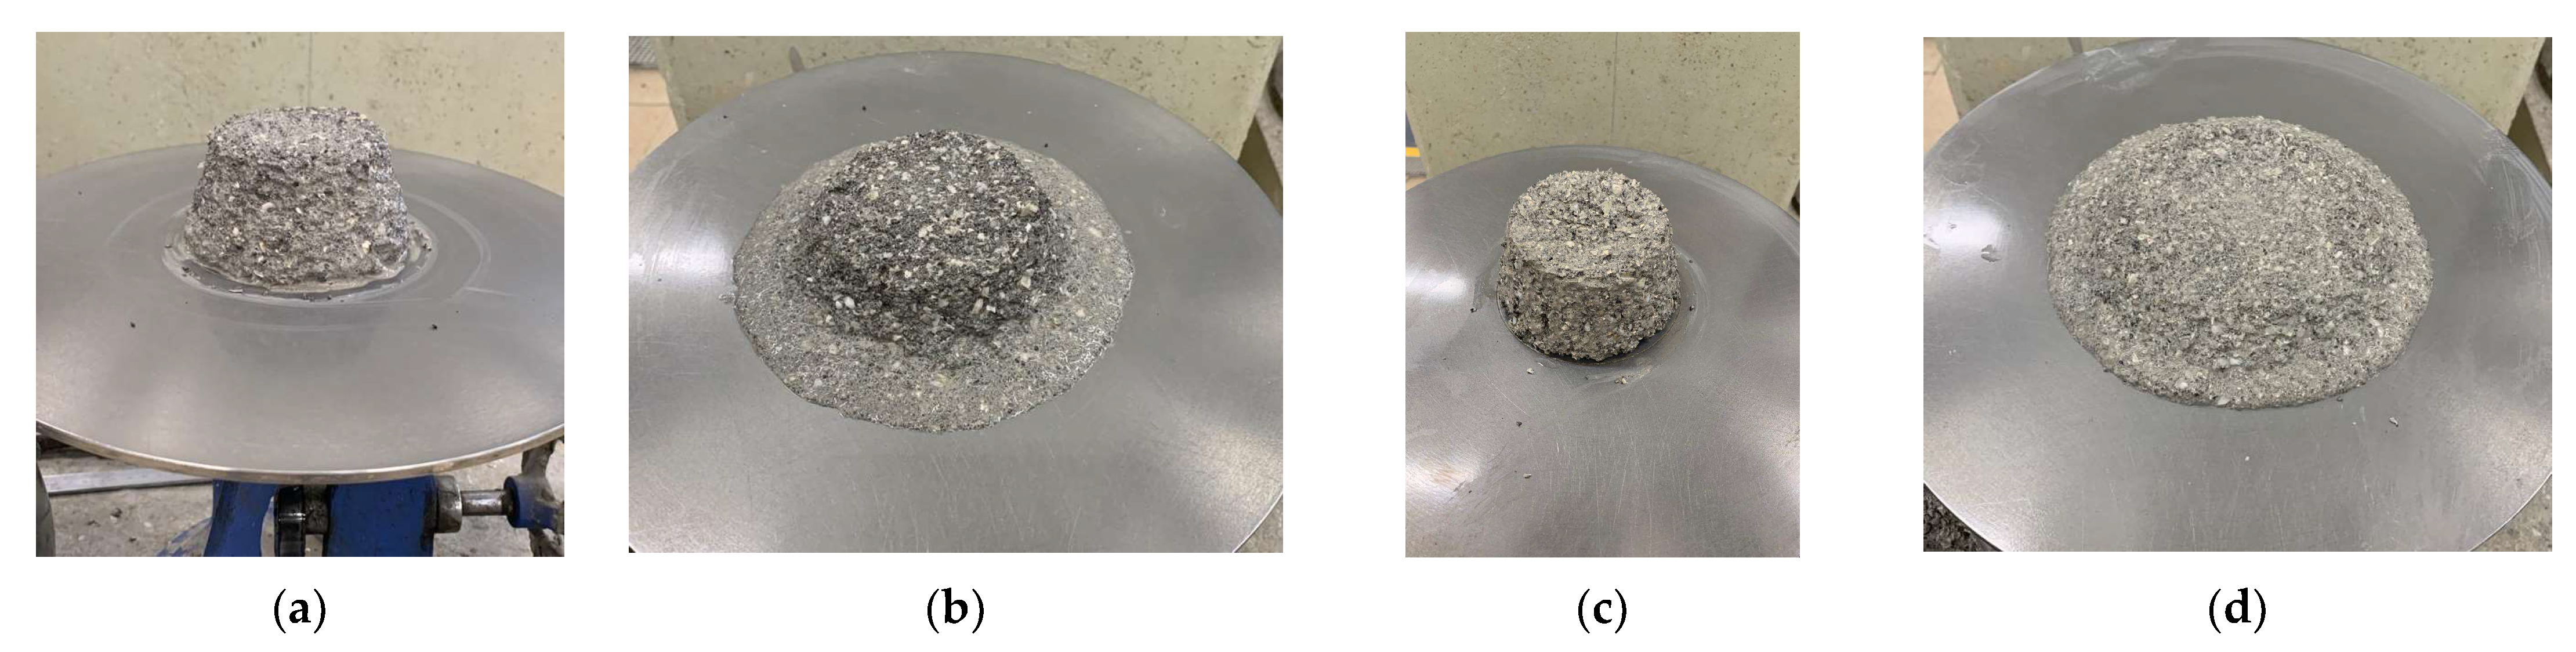
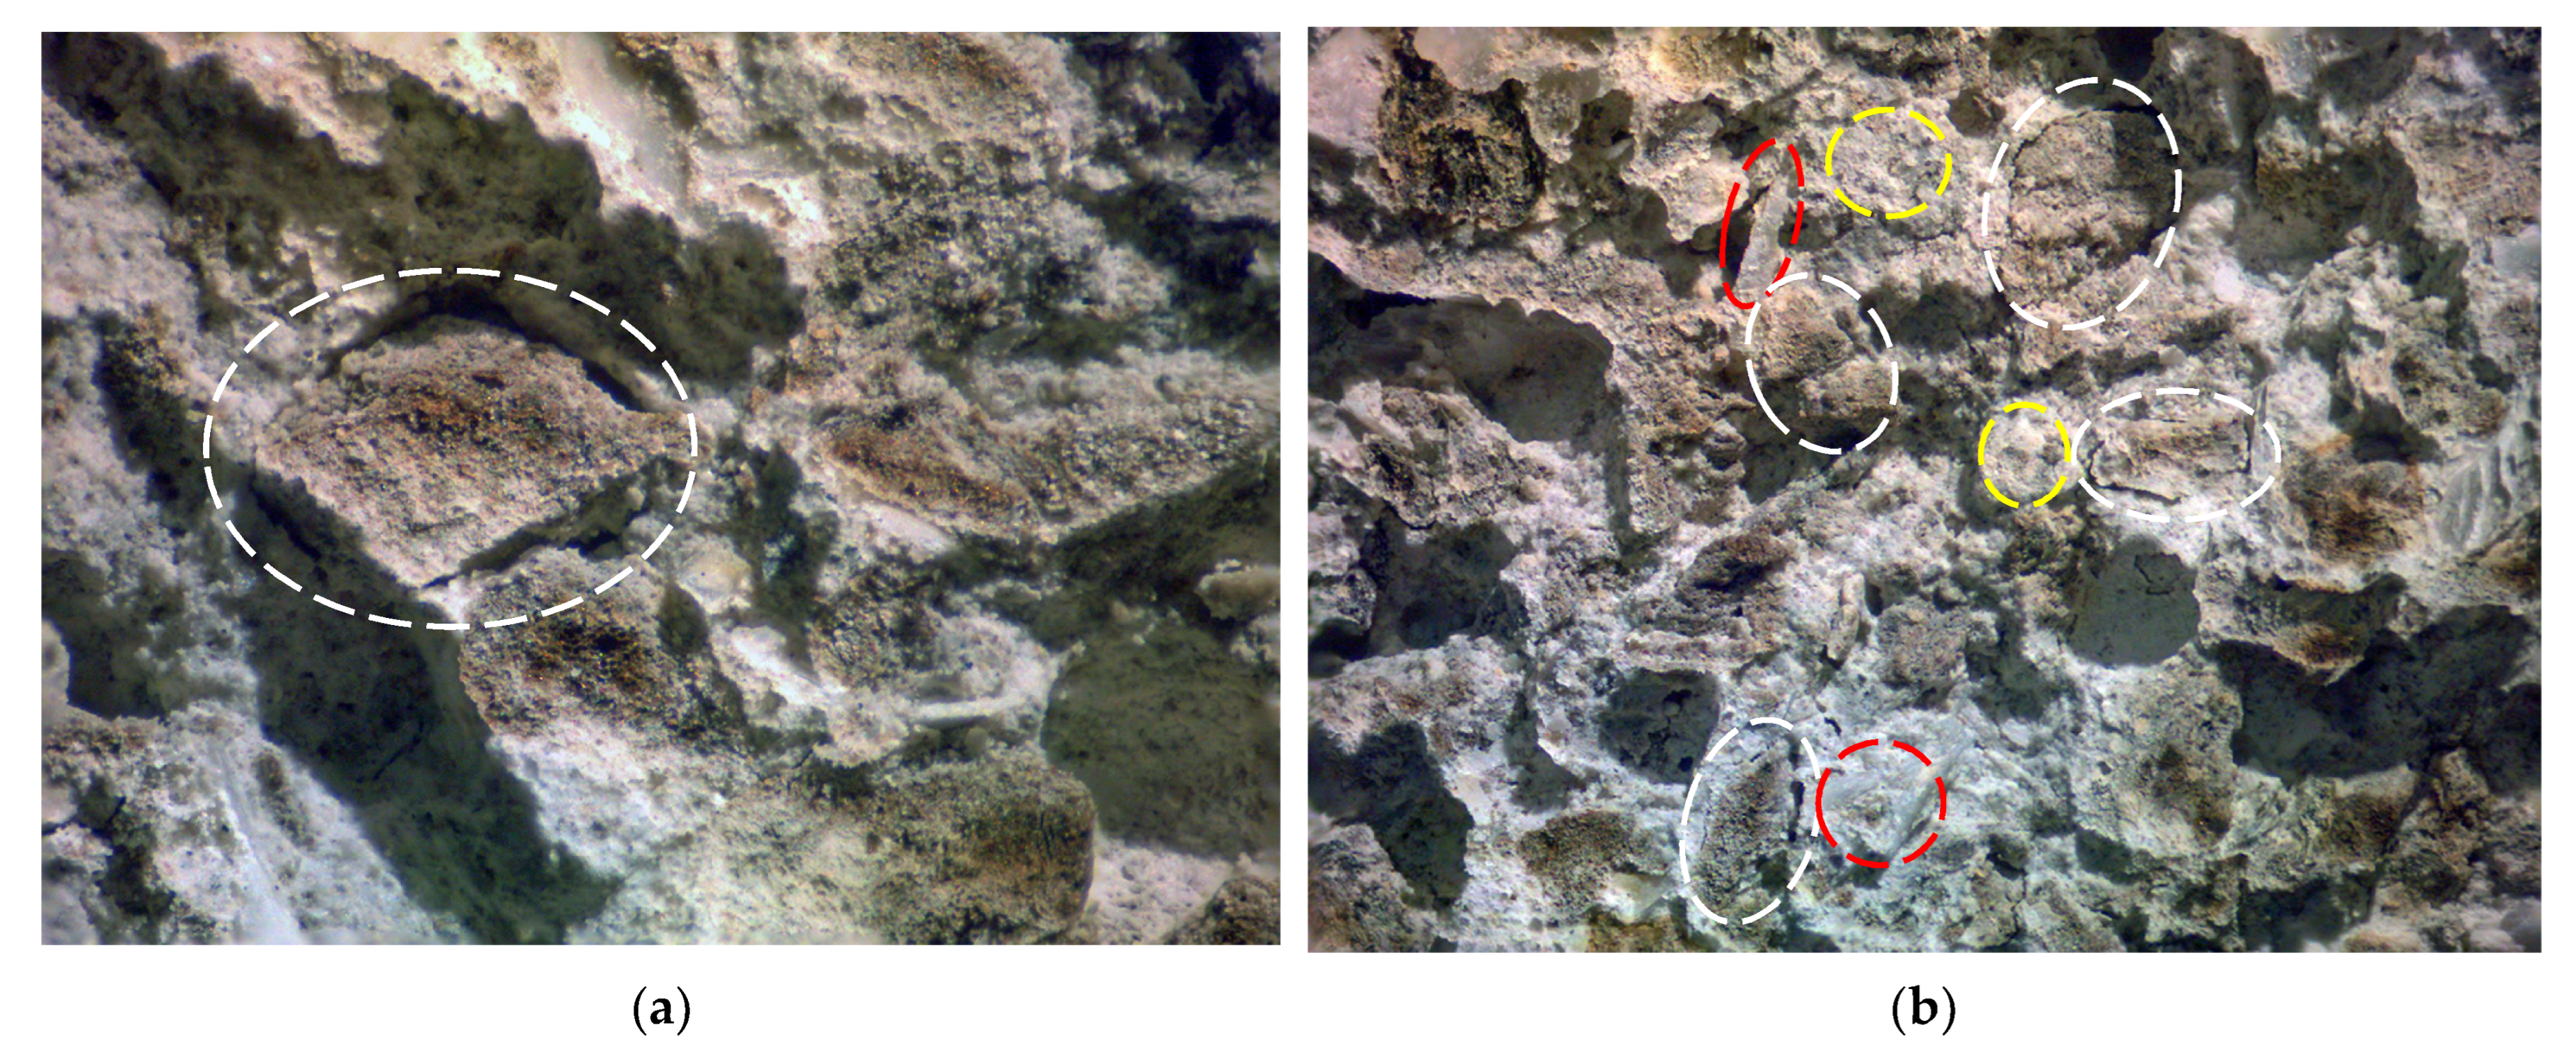
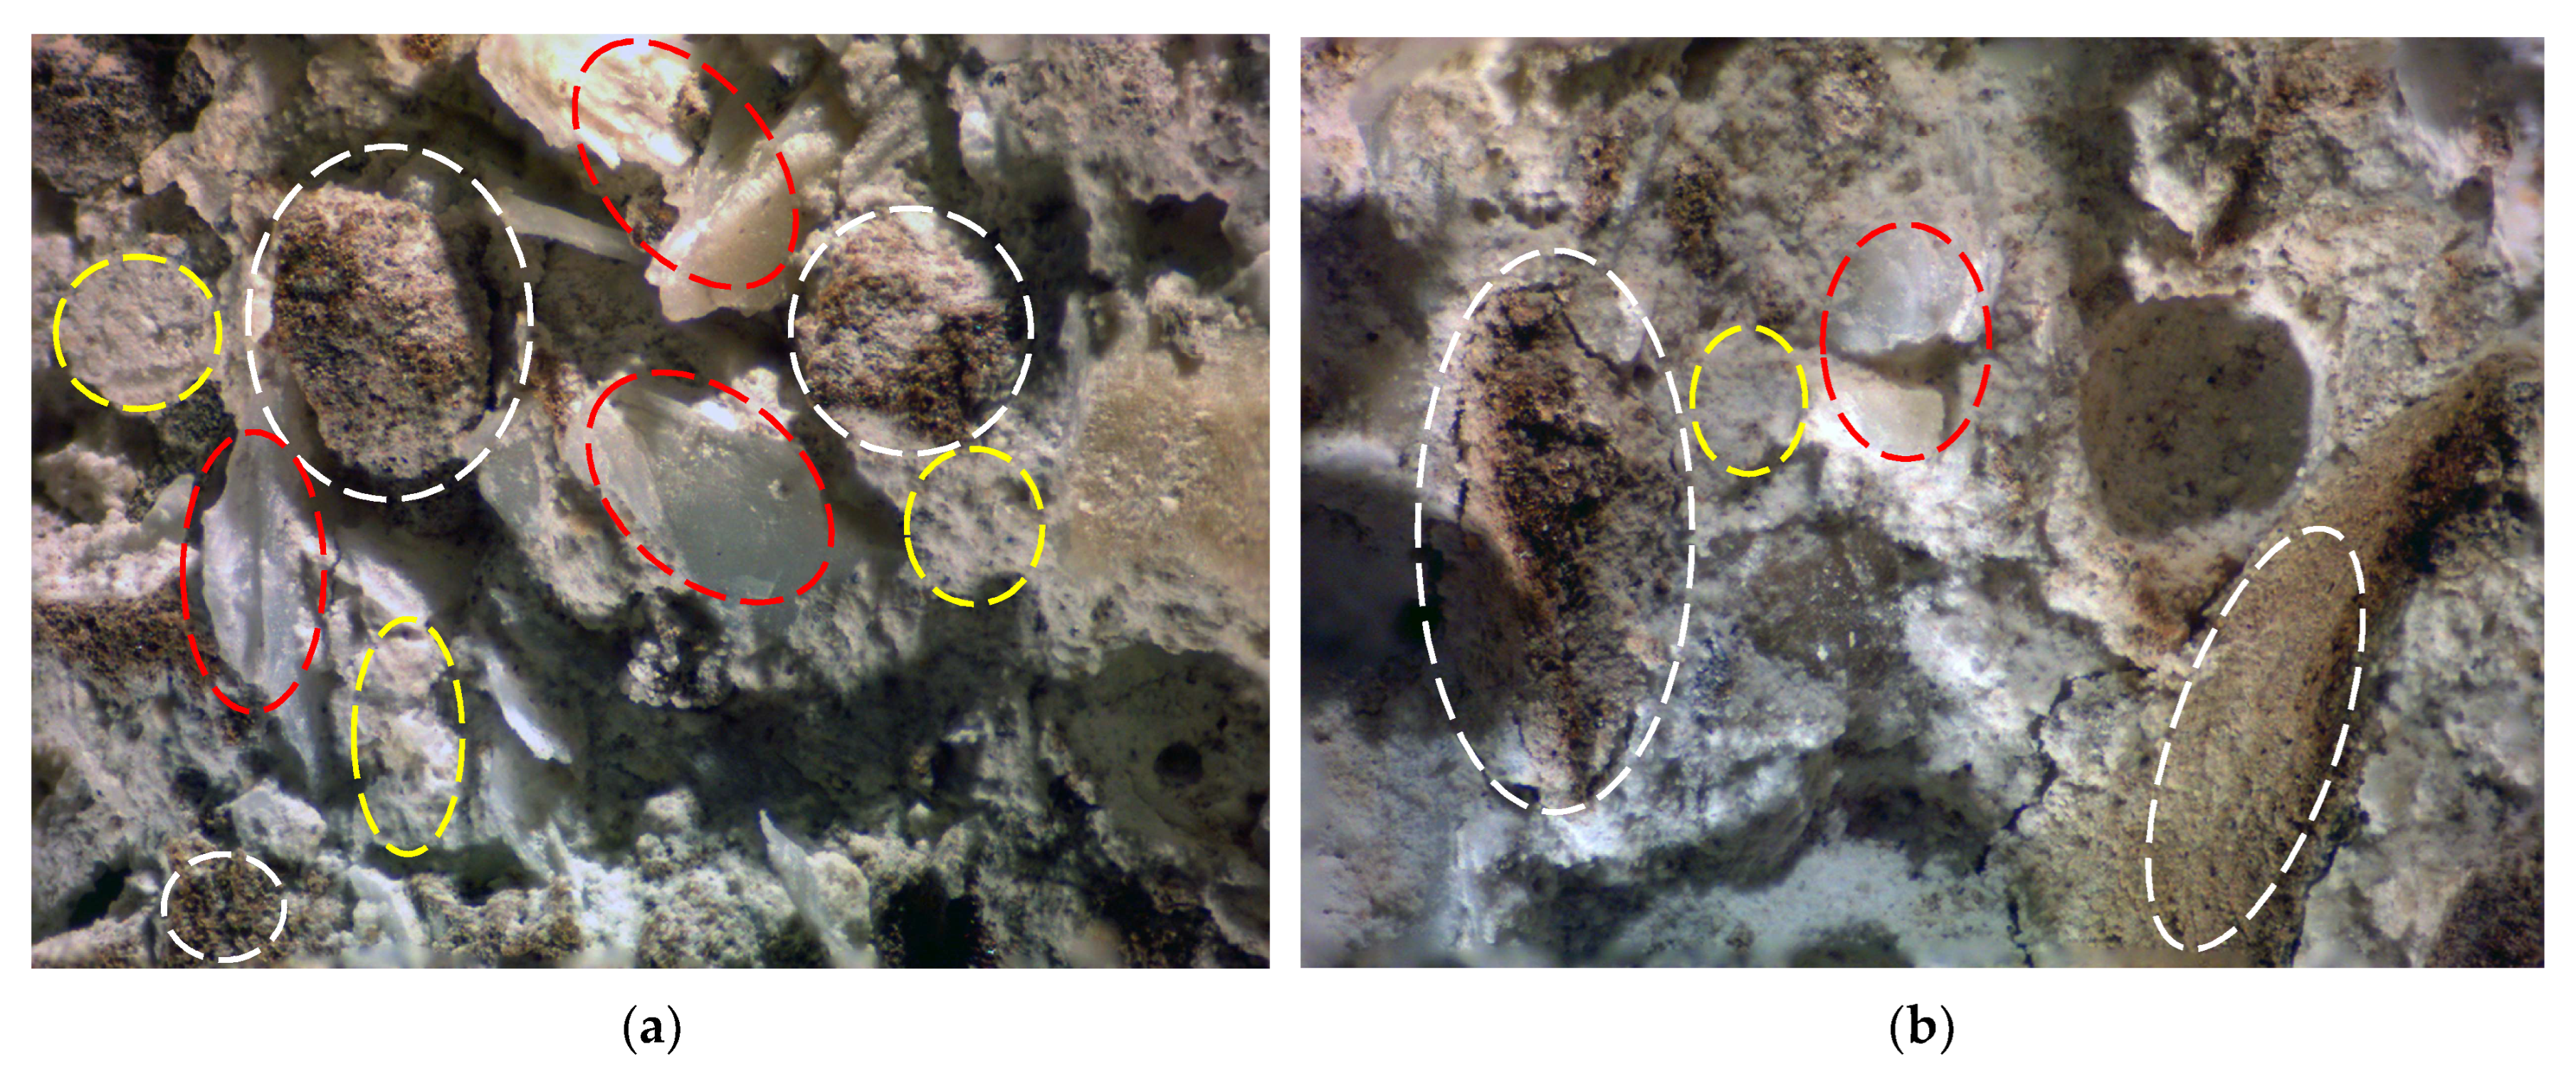
3.2.5. Visual Analysis in the Fresh State

The process of mixing the mortars was completed within a total duration of three and a half minutes. Immediately following this phase, the slump flow of the produced mortars was assessed. An interesting observation was made during this test in relation to workability: the EC80/OS20 and EC70/OS30 mortars exhibited a tendency towards the less uniform mixing of the constituent materials, in contrast to the EC60/OS40 and EC50/OS50 mortars.
In Figure 6a,b, a larger concentration of water was evident at the periphery of the cone (black arrow), while in Figure 6c,d, the dry materials displayed a stronger interaction with the utilised water content. Mortars with higher expanded cork percentages appeared to accumulate dry materials at the centre of the cone.
The similarity in behaviour observed between the EC80/OS20 and EC70/OS30 mortars, as well as between the EC60/OS40 and EC50/OS50 mortars, was not limited to the slump flow test alone. This common trend in behaviour could also be identified in the results of several other tests.

3.2.6. Visual Analysis in the Hardened State

In general, the adhesion of particles to the binder was very good. However, in expanded cork aggregates, some cracks parallel to the particle contours were common, possibly due to shrinkage and the workability changes seen in Section 3.2.5. All samples contained open macropores, whether they were more irregular between particles or more spherical. The observations in the SEM confirmed the observations in the stereomicroscope.
Figure 7a reveals that the expanded cork particles exhibit some areas of disconnection from the hydraulic lime paste, resulting in inadequate adhesion between the aggregates and the paste in the EC80/OS20. Similar issues with bonding between aggregates and mortar paste were observed in the EC70/OS30 mortar, as depicted in Figure 7b.
The EC60/OS40 and EC50/OS50 mortars exhibited a higher concentration of shells within the blend. Nevertheless, some areas of disconnection between the expanded cork particles and the paste persisted, as indicated in Figure 8a,b.
Failures in establishing a strong connection between the paste and the expanded cork and oyster shell aggregates were also evident in the EC60/OS40 mortar. This time, the weak binding was demonstrated through the SEM images, as shown in Figure 9.
In Figure 10a–f, some illustrative examples of tomographic reconstructions of EC20/OS80 mortar (c, d, and f) and EC50/OS50 mortar (a, b, e) are presented. The most compact parts of the mortar, made up of shell fragments, appear with a lighter colour in the tomographic images. The volumetric differences between the expanded cork aggregate and oyster shells are clearly noticeable. The 3D models in Figure 10a,c provide an overview of the mortars, and the models in Figure 10b,d show the components that are more X-ray opaque (oyster shell—brighter white, and binder—hazy white). In the section of the EC50/OS50 mortar (Figure 10e), it is possible to morphologically identify a spherical pore (yellow circle) in contrast to the darker domains composed of more angular expanded cork fragments, along with elongated oyster shell particles. In the section of EC20/OS80 mortar (Figure 10f), the amount of expanded cork is clearly smaller, and it is difficult to distinguish the interparticle pores due to their reduced size and the extreme porosity of expanded cork (subtle detection of some cellular filling). The results allow for the evaluation of the volumetric quantity and spatial distribution of the components. However, due to the lightweight and cellular nature of expanded cork, it was not possible to determine the interparticle porosity, as happens with other thermal/lightweight mortars [47].
The observations found in the images are consistent with the various results obtained in the tests.

4. Conclusions

This study aimed to analyse the potential of using oyster shells as a bio-based insulation material in thermal renders. Tests were carried out on fresh and hardened states after 28 and 240 days of composites produced in the laboratory.
Previous studies have already explored the potential of expanded cork as a thermal aggregate in composites. The conclusions tend towards behaviours such as: lower density, lower compressive strength, and lower thermal conductivity. Therefore, this study was important in that it combined and tested bivalve shells with insulating aggregates to produce thermal render.
The mortars studied did not show large variations in the amounts of water, and consequently in the slump flow value. However, workability appears to be altered, especially when larger amounts of expanded cork are incorporated. This phenomenon could be confirmed later by stereomicroscopy images in the hardened state. Through visual analysis of the images, it was possible to notice points where the expanded cork did not appear to be well adhered to the hydraulic lime paste.
In terms of thermal conductivity, all mortars fall within the normative classifications. The standard classes for water absorption were not met in any mortar produced. The compressive strength of the EC60/OS40 and EC50/OS50 composites meets the normative classes, while the compressive strengths of the other composites produced presented results that cannot be considered in thermal renders.
Density and ultrasound pulse velocity appeared to be the properties that changed most (increase in values) over time. The other properties studied did not demonstrate major changes in behaviour at the ages tested (28 and 240 days).
Visual analysis, together with the results found in each property analysed in this work, give clues to the behaviour of hydraulic lime mortars produced with expanded cork replaced in different percentages by oyster shells up to 240 days of age. However, there is still a lack of knowledge about the durability of thermal renders with expanded cork due to the large void content of these composites, and consequently the loss of strength after years of use, which may become a barrier to their implementation. The authors also highlight the development of future studies, in particular, with information about the economics of replacing the expanded cork with an addition in the form of shells and carrying out mortar adhesion tests on walls.
The experimental development and results obtained contribute to the knowledge of thermal renders. This study found that the use of oyster shells as a bio-based insulation material in thermal mortars showed a good balance between thermal conductivity and mechanical strength, especially when equal percentages of incorporation are considered (50% EC and 50% OS). This provides motivation to further investigate the use of this aquaculture waste.

Author Contributions

Conceptualization, F.M., P.B. and R.S.; methodology, P.B, M.P. and F.M.; investigation, P.B., M.P. and F.M.; resources, I.F.-C., I.T., F.M. and R.S.; writing—original draft preparation, P.B. and F.M.; writing—review and editing, P.B., I.F.-C., I.T., M.P. and R.S.; supervision, I.F.-C., I.T. and M.P. All authors have read and agreed to the published version of the manuscript.

Funding

This research was funded by Fundação para a Ciência e a Tecnologia (FCT) for the PhD scholarship (UI/BD/151151/2021) from the CERIS research unit (UIDB/04625/2020), and the EEA Grants bilateral fund through project financing SHELLTER (FBR_OC2_30).

Institutional Review Board Statement

Not applicable.

Informed Consent Statement

Not applicable.

Data Availability Statement

Data are contained within the article.

Acknowledgments

The authors thank the Amorim Group and the Cooperativa de Viveiristas Ria Formosa, both from Portugal, for donating the materials.

Conflicts of Interest

The authors declare no conflict of interest.

References

  1. Scrucca, F.; Palladino, D. Integration of Energy Simulations and Life Cycle Assessment in Building Refurbishment: An Affordability Comparison of Thermal Insulation Materials through a New Sustainability Index. Sustainability 2023, 15, 1412. [Google Scholar]
  2. GlobalABC/IEA/UNEP. GlobalABC Roadmap for Buildings and Construction: Towards a Zero-Emission; IEA: Paris, France, 2020.
  3. COM. Impulsionar uma Vaga de Renovação na Europa para Tornar os Edifícios Mais Ecológicos, Criar Emprego e Melhorar as Condições de Vida; Comissão Européia: Bruxelas, Belgium, 2020.
  4. Worrell, E.; Price, L.; Martin, N.; Hendriks, C.; Meida, L.O. Carbon Dioxide Emissions from the Global Cement Industry. Annu. Rev. Energy Environ. 2001, 26, 303–329. [Google Scholar]
  5. Liu, S.; Wang, Y.; Liu, B.; Zou, Z.; Teng, Y.; Ji, Y.; Zhou, Y.; Zhang, L.V.; Zhang, Y. Sustainable Utilization of Waste Oyster Shell Powders with Different Fineness Levels in a Ternary Supplementary Cementitious Material System. Sustainability 2022, 14, 5981. [Google Scholar] [CrossRef]
  6. Cabeza, L.; Castell, A.; Medrano, M.; Martorell, I.; Pérez, G.; Fernández, I. Experimental study on the performance of insulation materials in Mediterranean construction. Energy Build. 2010, 42, 630–636. [Google Scholar] [CrossRef]
  7. Villasmil, W.; Fischer, L.J.; Worlitschek, J. A review and evaluation of thermal insulation materials and methods for thermal energy storage systems. Renew. Sustain. Energy Rev. 2019, 103, 71–84. [Google Scholar] [CrossRef]
  8. Liu, L.; Li, H.; Lazzaretto, A.; Manente, G.; Tong, C.; Liu, Q.; Li, N. The development history and prospects of biomass-based insulation materials for buildings. Renew. Sustain. Energy Rev. 2017, 69, 912–932. [Google Scholar] [CrossRef]
  9. Füchsl, S.; Rheude, F.; Röder, H. Life cycle assessment (LCA) of thermal insulation materials: A critical review. Clean. Mater. 2022, 5, 100119. [Google Scholar] [CrossRef]
  10. Morgado, A.; Soares, A.; Flores-Colen, I.; Veiga, M.d.R.; Gomes, M.G. Durability of Thermal Renders with Lightweight and Thermal Insulating Aggregates: Regranulated Expanded Cork, Silica Aerogel and Expanded Polystyrene. Gels 2021, 7, 35. [Google Scholar] [CrossRef] [PubMed]
  11. Švajlenka, J.; Kozlovská, M.; Kozlovská, M. MgO-Based Board Materials for Dry Construction Are a Tool for More Sustainable Constructions—Literature Study and Thermal Analysis of Different Wall Compositions. Sustainability 2021, 13, 12193. [Google Scholar] [CrossRef]
  12. Bellei, P.; Torres, I.; Solstad, R.; Flores-Colen, I. Potential Use of Oyster Shell Waste in the Composition of Construction Composites: A Review. Buildings 2023, 13, 1546. [Google Scholar] [CrossRef]
  13. Teixeira, L.; Fernandes, V.; Maia, B.; Arcaro, S.; Oliveira, A.N.d. Vitrocrystalline foams produced from glass and oyster shell wastes. Ceram. Int. 2017, 43, 6730–6737. [Google Scholar] [CrossRef]
  14. Martínez-García, C.; González-Fonteboa, B.; Carro-López, D.; Pérez-Ordóñez, J.L. Mussel shells: A canning industry by-product converted into a bio-based insulation material. J. Clean. Prod. 2020, 269, 122343. [Google Scholar] [CrossRef]
  15. Félix, F.; Gonçalves, J.F.; Hinzmann, M.; Vaz-Pires, P. Manual de Boas Práticas na Ostreicultura em Portugal; Ficha Técnica: Porto, Lisbon, Portugal, 2018; ISBN 978-989-54077-1-2. [Google Scholar]
  16. FAO. The State of World Fisheries and Aquaculture 2022; FAO: Rome, Italy, 2022; ISBN 9789251363645. [Google Scholar]
  17. Fraga-Curralum, M.; Ronza, P.; Garcia-Oliveira, P.; Pereiraum, A.; Losada, A.; Prietoum, M.; Quiroga, M.; Simal-Gandarau, J. Aquaculture as a circular bio-economy model with Galicia as a study case: How to transform waste into revalorized by-products. Trends Food Sci. Technol. 2022, 119, 23–35. [Google Scholar] [CrossRef]
  18. Laefer, D.F. Emergence, Development, and Prevalence of Brick Nogging in American Vernacular Architecture; SAHC: Padova, Italy, 2004. [Google Scholar]
  19. Hodges, B.K. Some Things are not held together by Glue: Chunambo and other ‘Sticky Matter’ in Subtropical Macao, China. eTropic 2022, 21, 198–216. [Google Scholar] [CrossRef]
  20. Razali, N.; Aris, R.N.F.R.; Razali, N.; Pa’ee, K.F. Revalorization of Aquaculture Waste: The Performance of Calcined Mussel Shells as Partial Cement Replacement. ICERT 2017, 2017, 375–381. [Google Scholar]
  21. Chandra, S. History of Architecture and Ancient Building Materials in India—Single Volume. Tbi—India. 2003. Available online: https://archive.org/details/Aravindctmt_AncientBuildingMaterialsInIndia/page/109/mode/2up (accessed on 15 October 2023).
  22. Guedes, P. Learning from the ‘other’: Early modern emulation and trans-imperial exchanges of ‘native’ building technologies. In Proceedings of the 6th International Congress on Construction History (6ICCH), Brussels, Belgium, 9–13 July 2018; Volume 1, pp. 299–306. [Google Scholar]
  23. Manucy, A.C. Tapia or Tabby. J. Soc. Archit. Hist. 1952, 11, 32–33. [Google Scholar] [CrossRef]
  24. Morris, S.D. Tabby. New Georgia Encyclopedia; University of Georgia; retrieved 10 September 2019; 2005. Available online: https://www.georgiaencyclopedia.org/articles/history-archaeology/tabby/ (accessed on 15 October 2023).
  25. Kimball, F. Metropolitan Museum of Art. Committee on Education. In Domestic Architecture of American Colonies and of the Ealy Republic; C. Scribner’s Sons: New York, NY, USA, 1922. [Google Scholar]
  26. Loureiro, A.M.S.; Paz, S.P.A.d.; Veiga, M.d.R.; Angélica, R.S. Investigation of historical mortars from Belém do Pará, Northern Brazil. Const. Build. Mat. 2020, 233, 117284. [Google Scholar] [CrossRef]
  27. COM. Comunicação Da Comissão Ao ParlamentoUm Novo Plano De Ação Para A Economia Circular Para Uma Europa Mais Limpa E Competitiva; Comissão Europeia: Bruxelas, Belgium, 2020.
  28. MAR2030; European Maritime, Fisheries and Aquaculture Fund–Programme for Portugal—MAR2030. FEAMPA: Bruxelas, Belgium, 2021.
  29. CCDR Algarve. Algarve 2030—Estratégia de Desenvolvimento Regional. Comissão de Coordenação e Desenvolvimento Regional do Algarve; CCDR Algarve: Faro, Portugal, 2020. [Google Scholar]
  30. EN 459-1:2015; Building Lime—Part 1: Definitions, Specifications and Conformity Criteria. CEN: Brussels, Belgium, 2015.
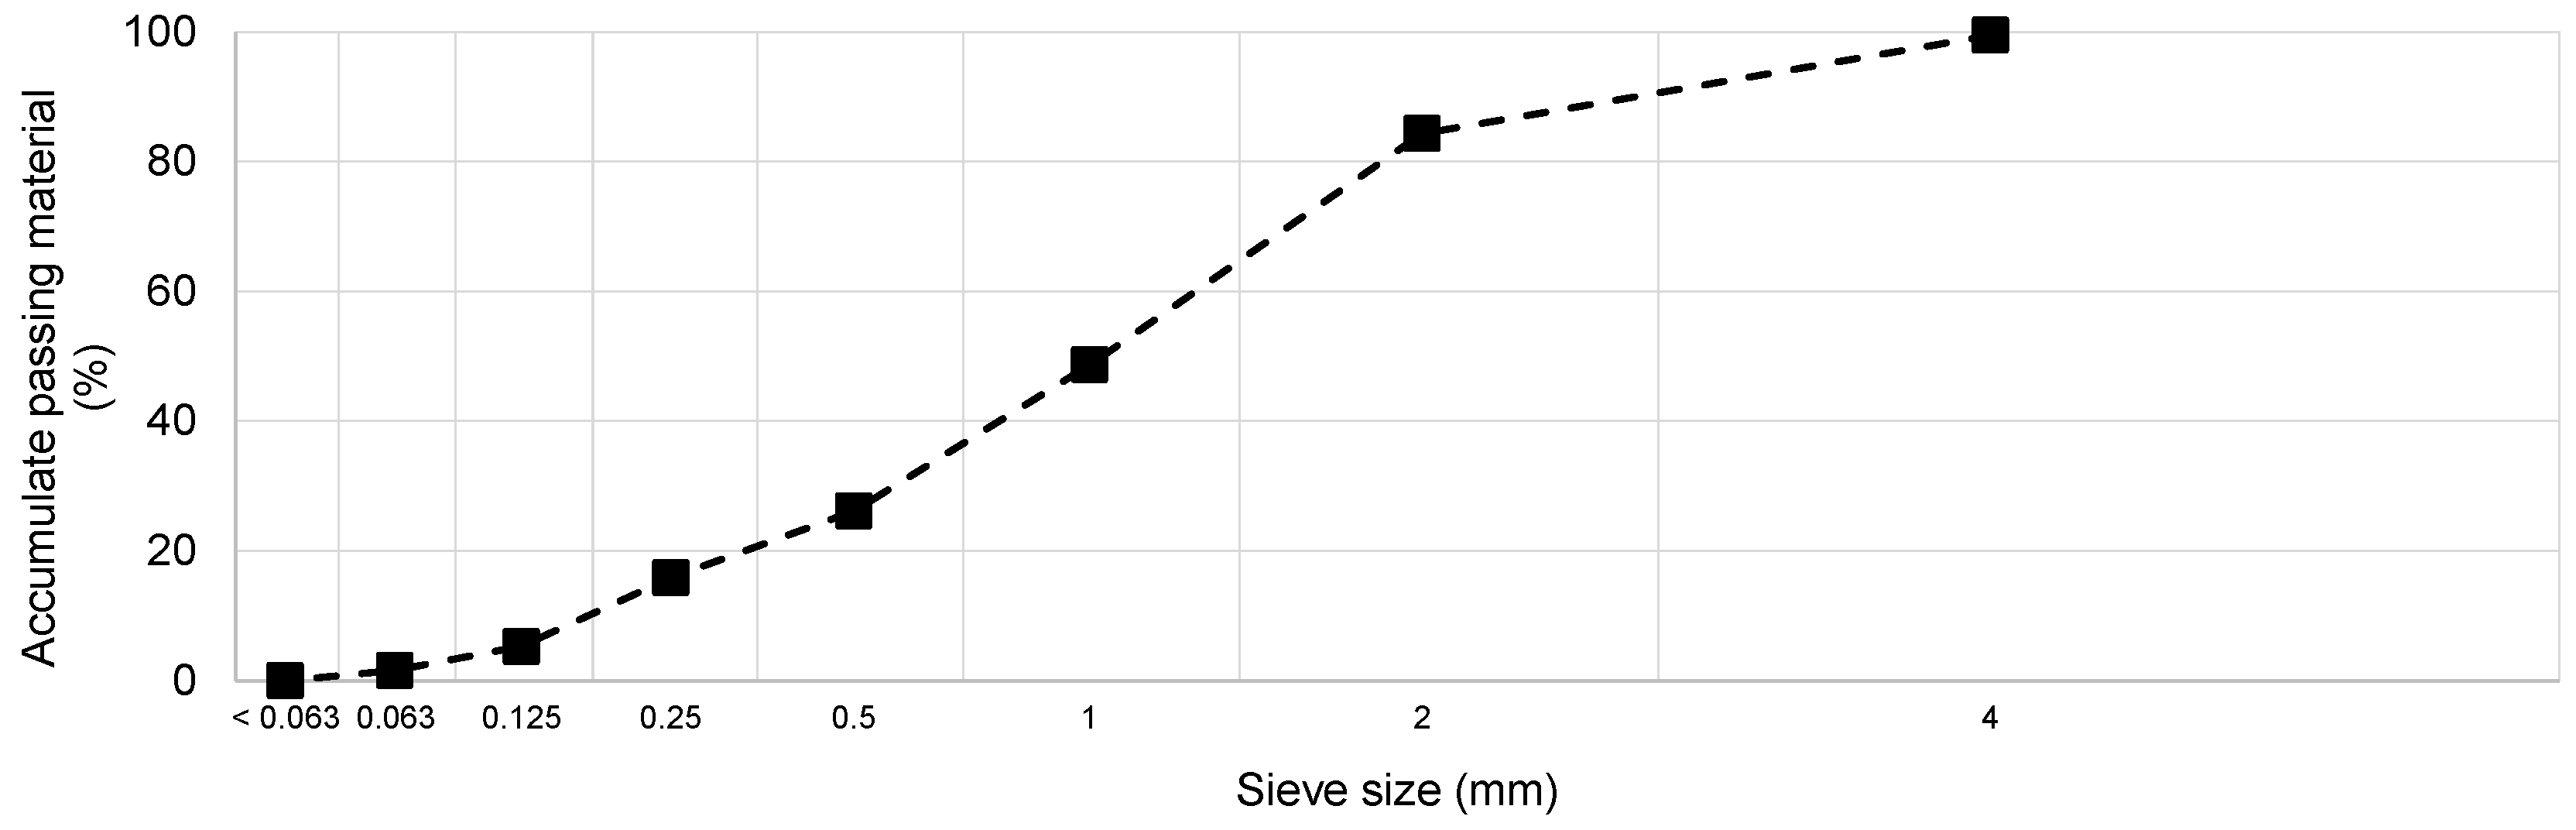
  31. NP EN 933-1:2014; Ensaios das Propriedades Geométricas dos Agregados, Parte 1: Análise Granulométrica—Método de Peneiração. IPQ: Lisboa, Portugal, 2013.
  32. NP EN 1097-3; Determinação da Baridade e do Volume de Vazios. IPQ: Lisboa, Portugal, 2002.
  33. EN 196-1:2016; Methods of Testing Cement—Part 1: Determination of Strength. CEN: Brussels, Belgium, 2016.
  34. EN 1015-3:1999; Methods of Test for Mortar for Masonry—Part 3: Determination of Consistence of Fresh Mortar (by Flow Table). CEN: Brussels, Belgium, 1999.
  35. EN 998-1:2013; Rendering and Plastering Mortar. CEN: Brussels, Belgium, 2013.
  36. EN 1015-6:1998; Methods of Test for Mortar for Mansory—Part 6: Determination of Bulk Density of Fresh Mortar. CEN: Brussels, Belgium, 1998.
  37. AP:2011; ISOMET 2114 Thermal properties analyzer: User’s Guide, Version 120712. Applied Precision: Racha, Slovakia, 2011.
  38. ASTM D5930-9:2009; Thermal Conductivity of Plastics by Means of a Transient Line-Source Technique. American Society for Testing Materials: Philadelphia, PA, USA, 2009.
  39. EN 1015-10:1999; Methods of Test for Mortar for Masonry—Part 10: Determination of Dry Bulk Density of Hardened Mortar. CEN: Brussels, Belgium, 1999.
  40. NP EN 1936:2008; Métodos de Ensaio Para Pedra Natural. Determinação das Massas Volúmicas Real e Aparente e Das Porosidades Total e Aberta. IPQ: Caparica, Portugal, 2008.
  41. EN 1015-18:2002; Methods of Test for Mortar for Masonry—Part 18: Determination of Water Absorption Coefficient Due to Capillary Action of Hardened Mortar. CEN: Brussels, Belgium, 2002.
  42. ASTM E1876:2015; Standard Test Method for Dynamic Young’s Modulus, Shear Modulus, and Poisson’s Ratio by Impulse Excitation of Vibration. ASTM International: West Conshohocken, PA, USA, 2015; 17p.
  43. EN 1015-11:2019; Methods of Test for Mortar for Masonry—Part 11: Determination of Flexural and Compressive Strength of Hardened Mortar. CEN: Brussels, Belgium, 2019.
  44. EN 12504-4:2004; Testing Concrete—Part 4: Determination of Ultrasonic Pulse Velocity. CEN: Brussels, Belgium, 2004.
  45. Gomes, M.G.; Flores-Colen, I.; Melo, H.; Soares, A. Physical performance of industrial and EPS and cork experimental thermal insulation renders. Const. Build. Mat. 2019, 198, 786–795. [Google Scholar] [CrossRef]
  46. Borges, A.; Flores-Colen, I.; Brito, J. Physical and mechanical performance of cement-based renders with different contents of fly ash, expanded cork granules and expanded clay. Const. Build. Mat. 2018, 191, 535–543. [Google Scholar] [CrossRef]
  47. Travincas, R.; Pereira, M.F.C.; Torres, I.; Maurício, A.; Silveira, D. X-ray microtomography applied to mortars: Review of microstructural visualization and parameterization. Micron 2023, 164, 103375. [Google Scholar] [CrossRef] [PubMed]
Figure 1. Particle size distribution.
Sustainability 15 15952 g001
Figure 2. Materials and mortar mix.
Sustainability 15 15952 g002
Figure 3. Mortar’s apparent density.
Sustainability 15 15952 g003
Figure 4. Capillary absorption over time: (a) 28 days; (b) 240 days.
Sustainability 15 15952 g004
Figure 5. Ratio between dynamic modulus of elasticity: (a) flexural strength (Sf) and compressive strength (Sc); (b) ultra-sound pulse velocity (US).
Sustainability 15 15952 g005
Figure 6. Workability: (a) EC80/OS20 (before the strokes); (b) EC70/OS30 (after the strokes); (c) EC60/OS40 (before the strokes); (d) EC50/OS50 (after the strokes).
Sustainability 15 15952 g006
Figure 7. Stereomicroscope: (a) EC80/OS20 (image width of 0.5 mm): EC (white circle); (b) EC70/OS30 (image width of 1 mm): paste (yellow circle); EC (white circle); OS (red circle).
Sustainability 15 15952 g007
Figure 8. Stereomicroscope: (a) EC60/OS40: paste (yellow); EC (white); OS (red); (b) EC50/OS50: paste (yellow); EC (white); OS (red). Image widths of 5 mm.
Sustainability 15 15952 g008
Figure 9. SEM: Expanded cork–binder interface—EC60/OS40_170x (left) and EC60/OS40_1000x (right).
Sustainability 15 15952 g009
Figure 10. Microtomographic results from EC80/OS20 and EC50/OS50 mortars: (a) opaque mode—EC50/OS50; (b) transparent mode—EC50/OS50; (c) opaque mode—EC20/OS80; (d) transparent mode—EC20/OS80; (e) EC50/OS50 section with big air pore (yellow circle); (f) EC20/OS80 typical section.
Sustainability 15 15952 g010
Table 1. Chemical compositions of natural hydraulic lime (% by weight).
CaOSiO2Al2O3MgONa2OFe2O3SO3K2OP2O5TiO2
68.72%5.39%1.85%1.63%1.5%1.23%1.21%0.76%0.37%0.15%
Table 2. Composition of the produced mortars.
MortarNHL
(Binder)
Expanded Cork
(Aggregate)
Oyster Shell
(Aggregate)
Binder/Aggregate
Ratio
Water/Binder
Ratio
Water/Dry Materials Ratio
EC80/OS20100%80%20%1.081.400.73
EC70/OS30100%70%30%0.781.400.61
EC60/OS40100%60%40%0.611.360.51
EC50/OS50100%50%50%0.501.370.46
Table 3. Slump flow results.
MortarSlump Flow (mm)Density (kg/m3)
EC80/OS20162923
EC70/OS30157979
EC60/OS401551096
EC50/OS501591267
Table 4. Thermal conductivity results.
Mortar28 Days240 Days
A 1 (W/(m·K))CV 2A (W/(m·K))CV
EC80/OS200.080.280.080.36
EC70/OS300.080.390.080.42
EC60/OS400.120.130.120.18
EC50/OS500.150.190.160.23
1 Average; 2 Coefficient of variation.
Table 5. Mechanical properties.
MortarEmod 1 (MPa)
28 Days
Sf 2 (MPa)
28 Days
Sc 3 (MPa)
28 Days
Sc (MPa)
240 Days
US 4 (m/s)
28 Days
US (m/s)
240 Days
A 5(MPa)CV 6A (MPa)CVA (MPa)CVA (MPa)CVA (m/s)CVA (m/s)CV
EC80/OS202734.60.163.90.301.20.3071147414148
EC70/OS303214.10.162.50.308.70.301.41031711593
EC60/OS405308.10.214.60.406.90.402.692159643
EC50/OS5093640.365.60.6040.604.786058603
1 Dynamic modulus of elasticity; 2 flexural strength; 3 compressive strength; 4 ultra-sound pulse velocity; 5 average; 6 coefficient of variation.
Disclaimer/Publisher’s Note: The statements, opinions and data contained in all publications are solely those of the individual author(s) and contributor(s) and not of MDPI and/or the editor(s). MDPI and/or the editor(s) disclaim responsibility for any injury to people or property resulting from any ideas, methods, instructions or products referred to in the content.

