In this section, utilizing the self-developed outburst simulation experimental system, a substantial number of coal and gas outburst simulation experiments were conducted. We observed in real-time the patterns of AE, EMR, and EP signals during the adsorption phase, loading phase, and outburst phase of the experiments, and through the analysis of the regularities of coal and gas outbursts, provided a theoretical basis for the further field application of AE-EMR-EP signals in predicting coal and gas outburst.
3.1. The Characteristic of AE, EMR, and EP Signals during the Gas Adsorption Process
As illustrated in
Figure 3, the time span from 0 to
indicates the variations in EMR and AE signals during the gas injection process. Overall, the EMR produced by the coal body tends to increase with the rise of gas pressure. The data from channels 1, 5, and 6 indicate that after gas injection began, the EMR signal showcased an upward trend with the rise in gas pressure in the coal sample. Around
, the EMR signal intensity peaked. The emergence of EMR could be attributed to the deformation of the coal matrix due to the gas, leading to coal fractures. The subsequent phase indicates a stable adsorption period where the EMR signals remain relatively consistent. Near the end of the gas injection, at around
, there was a sudden surge in signal pulses when the valve was abruptly closed.
The process of coal adsorbing gas, or the migration of gas within the coal, is a typical flow–solid coupling process involving adsorption [
36]. Within this process, the stress induced by coal adsorbing gas could result in damages to the coal’s micro and mesoscopic structures, thereby releasing energy. AE indicates the fracturing or extension of pre-existing flaws or damages in the coal-rock mass [
37]. Structural changes in the coal-rock mass release energy rapidly in the form of elastic waves. The AE of the coal-rock mass reflects the internal damage degree, which is directly associated with its internal flaw or damage evolution [
30]. The AE signals produced by the coal body during the gas adsorption process can be attributed to two factors. On the one hand, gas adsorption causes the coal matrix to swell and deform, leading to micro-deformations or micro-fractures in the coal structure, generating AE signals. On the other hand, the existing pressure gradient within the coal body can cause stretching or shearing fractures, producing AE signals [
10,
38]. On the microscopic level, the adsorption of gas by coal leads to the expansion of the coal matrix, resulting in minor deformations or fractures. The surface of the coal matrix has a reduction in adsorption potential, gas molecules are adsorbed by the coal, reducing the surface free energy of the coal, causing expansion, and the greater the amount of gas adsorbed, the greater the reduction in surface energy, leading to increased deformation of the coal matrix. At the same time, the infiltration of gas into the coal matrix can generate additional expansive stress, causing damage to the microscopic structure of the coal. On the mesoscopic level, the gas pressure gradient can damage the microscopic structure of the coal matrix. The gas pressure gradient is the direct cause of coal matrix damage, and an increase in the gas pressure gradient can lead to an increase in effective tensile stress [
39].
When the gas pressure gradient is sufficiently large, it causes damage to the coal matrix, and the characteristic length of layer cracking is closely related to the gas seepage and the tensile strength of the coal matrix. This indicates that there exists a critical gas pressure gradient that can cause damage to the microscopic structure of the coal matrix, and this critical value is closely related to the tensile strength of the coal matrix, as shown in Equation (
1).
where grad
P represents the gas pressure gradient, and
represents the critical pressure gradient that can cause damage to the coal matrix.
In the experiment, the gas pressure used is constant, but the gas pressure gradient in the coal matrix also depends on the length. Although the gas pressure is small in the experiment, a higher gas pressure gradient can still be formed in local minor segments, thereby causing damage to the microporous structure in the coal matrix. As the process of gas adsorption and seepage in the coal matrix is a layer-by-layer penetration process, gas always first breaks through areas of lower strength within the coal matrix. At the same time, due to the maximum gas pressure gradient at the initial stage of the experiment, a peak of AE signals generally appears at the beginning of the experiment. After the coal matrix structure undergoes damage due to the action of the gas, the gas pressure at the seepage front drops sharply, and the gas pressure is not sufficient to overcome coal matrix units with higher strength, while gas seepage enters the energy storage stage. When the gas pressure gradually increases with the adsorption time to form a higher gas pressure gradient, a second peak of AE signals appears in the coal matrix.
During the adsorption process, the characteristic behavior of AE signals is also affected by the homogeneity of the coal matrix. As the experiment uses large-scale coal samples, which are different from the standard coal samples used in ordinary experiments, the heterogeneity of the large-scale coal samples is more pronounced, having a greater impact on the experimental results. Due to the heterogeneity of the coal matrix, the strength varies in different parts of it, which also intensifies the irregularity of the signals during the coal matrix layer seepage process.
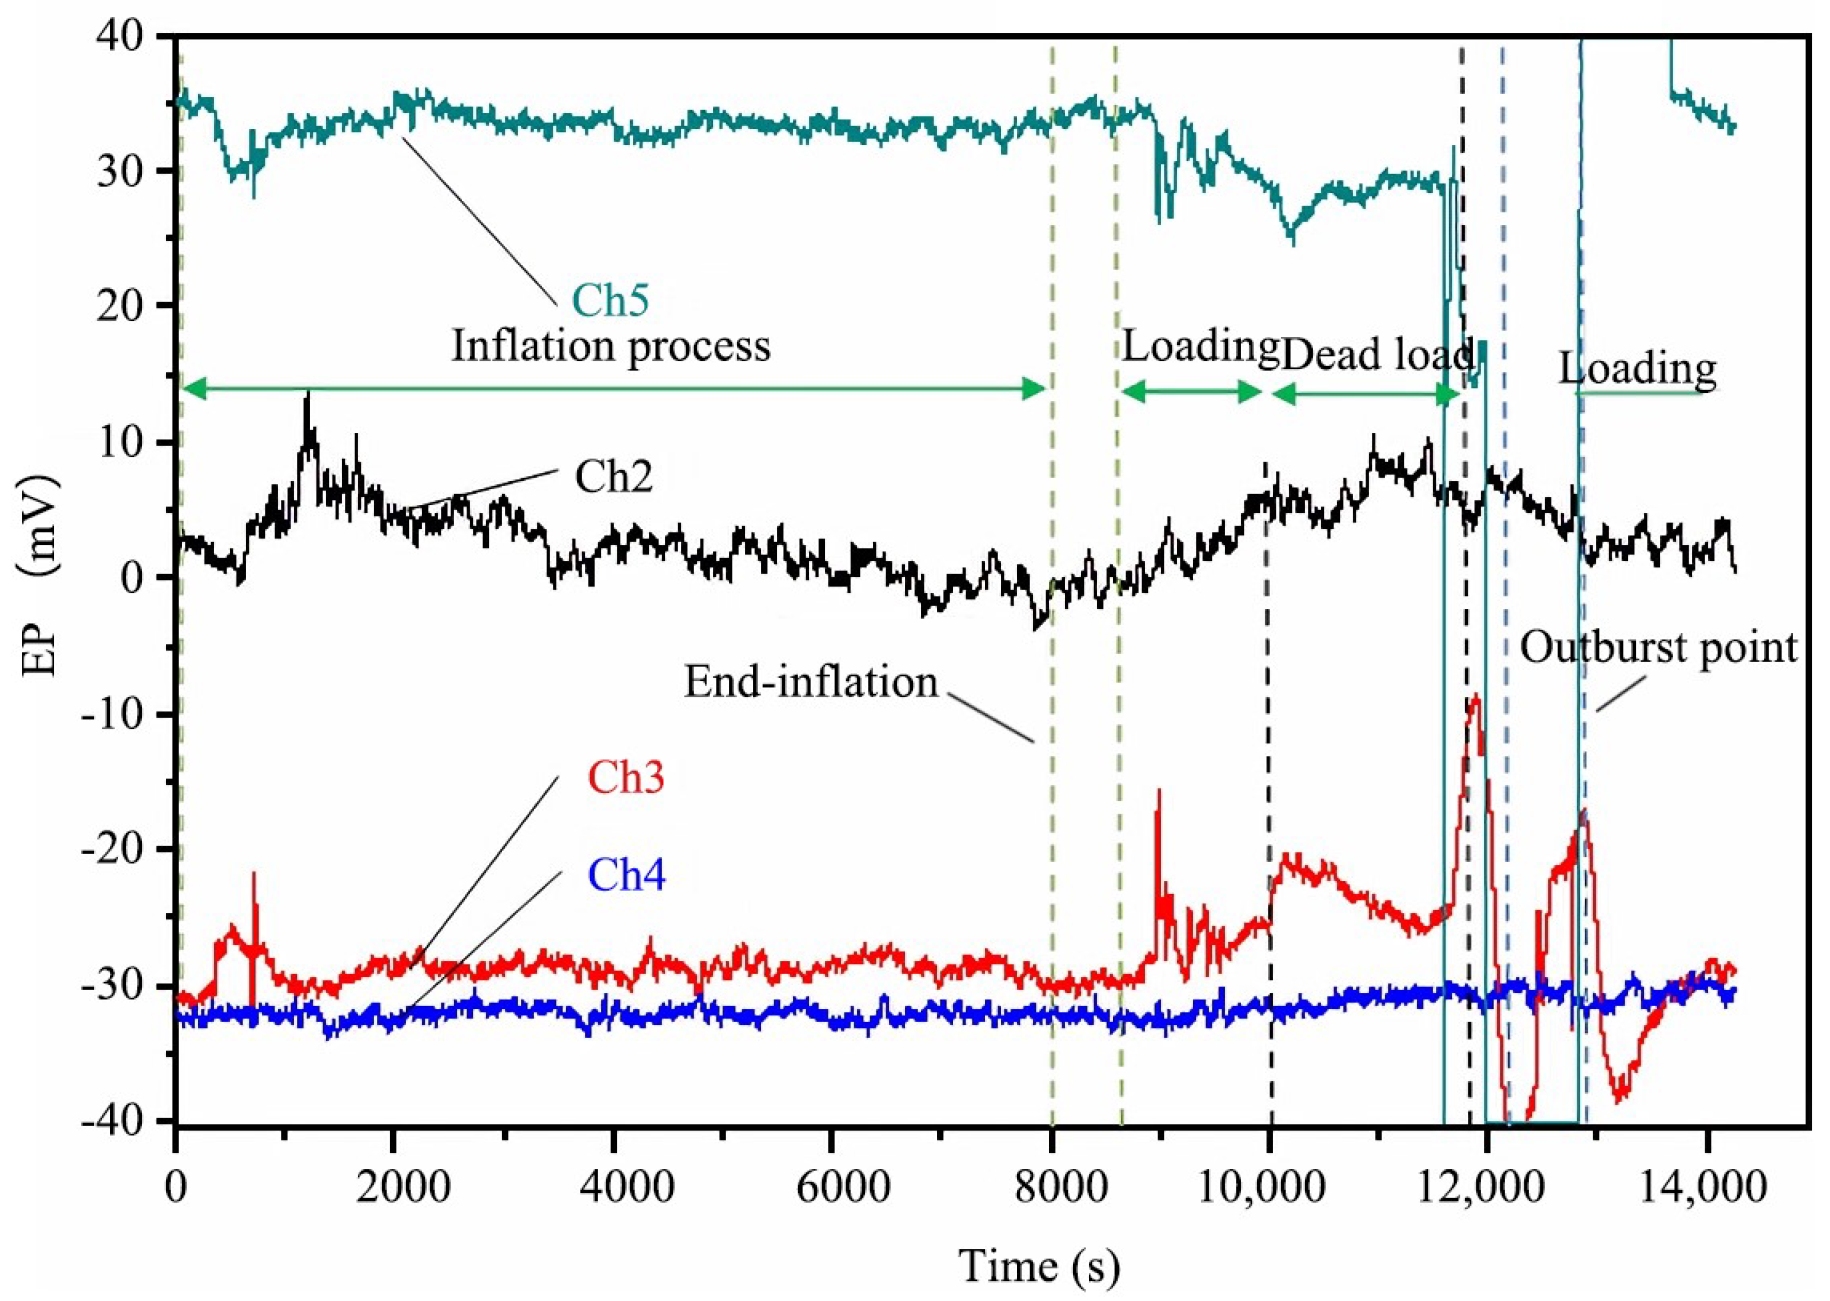
Figure 4 illustrates the variation in the EP signal throughout the entire experimental process. EP signals are produced from the deformation and failure of the coal rock, simultaneously with EMR. Raw coal, rocks, and other materials generate potential, free electric charge, and resistivity under the load. Based on the physical mechanism, processes such as friction, charge separation caused by crack propagation, external electron emission from crack tips, and stress induction can all induce a potential response [
35]. From the perspective of engineering applications, the change in EP signal can be regarded as caused by the sudden change in the stress state and distribution, as well as the deformation and failure of the coal-rock mass. The EP signal often experiences abrupt changes and exhibits other response characteristics before or after the main fracture of the coal-rock sample occurs. The increase or decrease in EP signal is closely related to the stress state and failure process of coal and rock materials. More importantly, the EP response has the advantages of high sensitivity and strong anti-interference. At the beginning of the gas charging phase until around 700 s, the intensity of the electrical potential signal starts to decrease. After a brief period of signal enhancement, the electrical potential signal exhibits a weakening trend.
3.2. The Characteristics of the AE, EMR, and EP Signals during the Loading Process
In
Figure 3, the period from
to 11,750
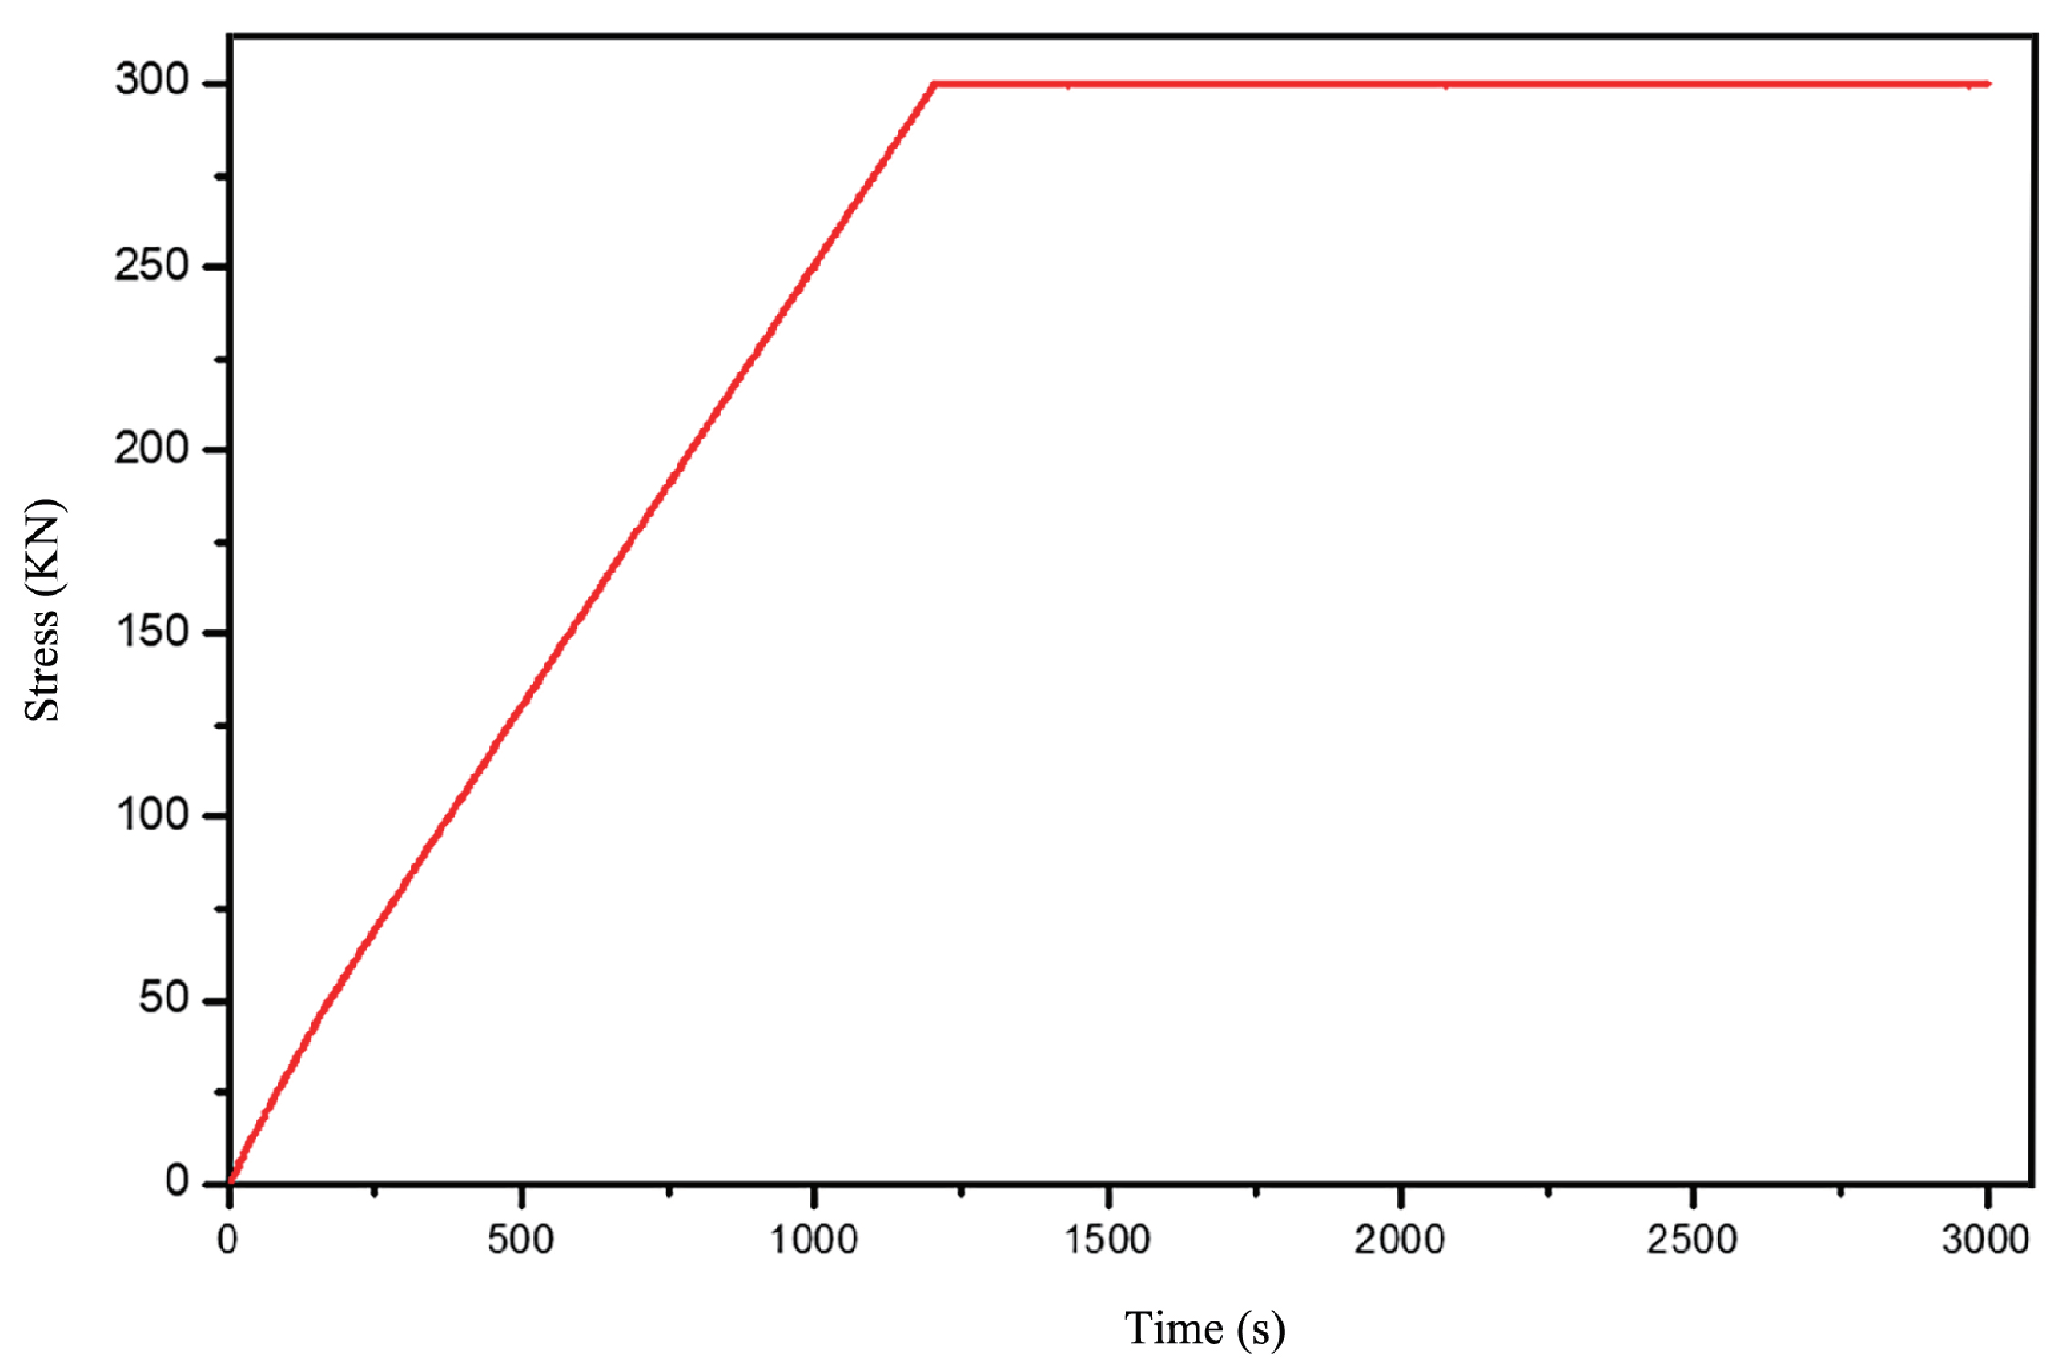
corresponds to the acoustic–electric signals during the loading process. The stress–strain curve during loading is shown in
Figure 5. In this stage, loading is divided into two phases: loading and constant load. The range from
to 10,000
represents the loading phase, while 10,000
to 11,750
represents the constant load phase. From
Figure 3, it can be observed that during the loading phase, there is good consistency between the EMR signals, AE signals, and the variation in the load as stress increases. During the constant load phase from 10,000
to 11,750
, both EMR and AE signals decrease. In this phase, the force within the coal matrix remains constant, meaning the rate of the load change is zero. During this phase, the acoustic–electric signals are weaker, indicating good consistency between EMR, acoustic emission and the rate of force change. From 12,200
to 12,800
, the second loading phase on the coal matrix is observed. As stress increases, the acoustic–electric signals intensify, but the amplitude is much smaller compared to the first loading phase.
There is a correlation between EMR, AE, and the rheological damage of coal. The intensity of EMR and AE signals increases with the increase in stress and the degree of coal deformation and fracture. It also increases with increased stress level, stress loading rate, and deformation rate [
35].
Figure 6 shows the results of acoustic–electric testing during the loading process. From the graph, it can be observed that overall, EMR and
increase with the increasing stress as loading progresses. Channel 5 in
Figure 5 represents the
data. From the data pattern, several points with significant changes in
signals correspond to sudden changes in loading speed, such as around
when the loading rate gradually increases, reaching its maximum around
. The values of EMR and AE also increase accordingly, reaching their maximum. Between
and 270 s, EMR and AE signals gradually weaken with the increasing stress. This is because, in the initial stage, the coal matrix has larger internal pores, and the coal matrix is compacted. During this stage, the compression of pores is greater than the compression of the coal matrix framework. As the pressure increases, the degree of compression decreases, and when it reaches approximately
, the compression of pores in the coal matrix reaches its maximum, resulting in a lower value of EMR and AE signals. Subsequently, as the stress increases, the coal matrix framework begins to fracture under the load, and the degree of the coal matrix fracture gradually increases. At
, the first significant fracture occurs, and the EMR signal suddenly intensifies. After the coal matrix fractures, the energy decreases, reaching its lowest point at
. Since the coal matrix is in the experimental chamber and is subjected to a confining pressure, it does not become unstable. With the increasing pressure, the coal matrix fracture produces EMR and acoustic emission, and as the stress increases, the signal gradually strengthens, leading to another fracture. When it reaches
, another fracture occurs. Afterward, despite the increasing pressure, there is no significant change in EMR energy of the coal matrix, indicating that the coal matrix has completely fractured, corresponding to a stress of 7 MPa. At the 20th minute, the stress level of the coal matrix no longer increases but remains at this pressure level, meaning the rate of force change is zero. It can be seen that both EMR energy and AE energy have reached lower values, and EMR and
signals are consistent with the rate of force change.
Before a coal mine underground outburst occurs, there are usually variations in stress to some extent. EMR is a kind of electromagnetic wave energy radiated by the coal and rock mass in the process of uneven deformation under the action of load. The laboratory research shows that high stress, crack propagation and gas flow cause the increase in EMR signals [
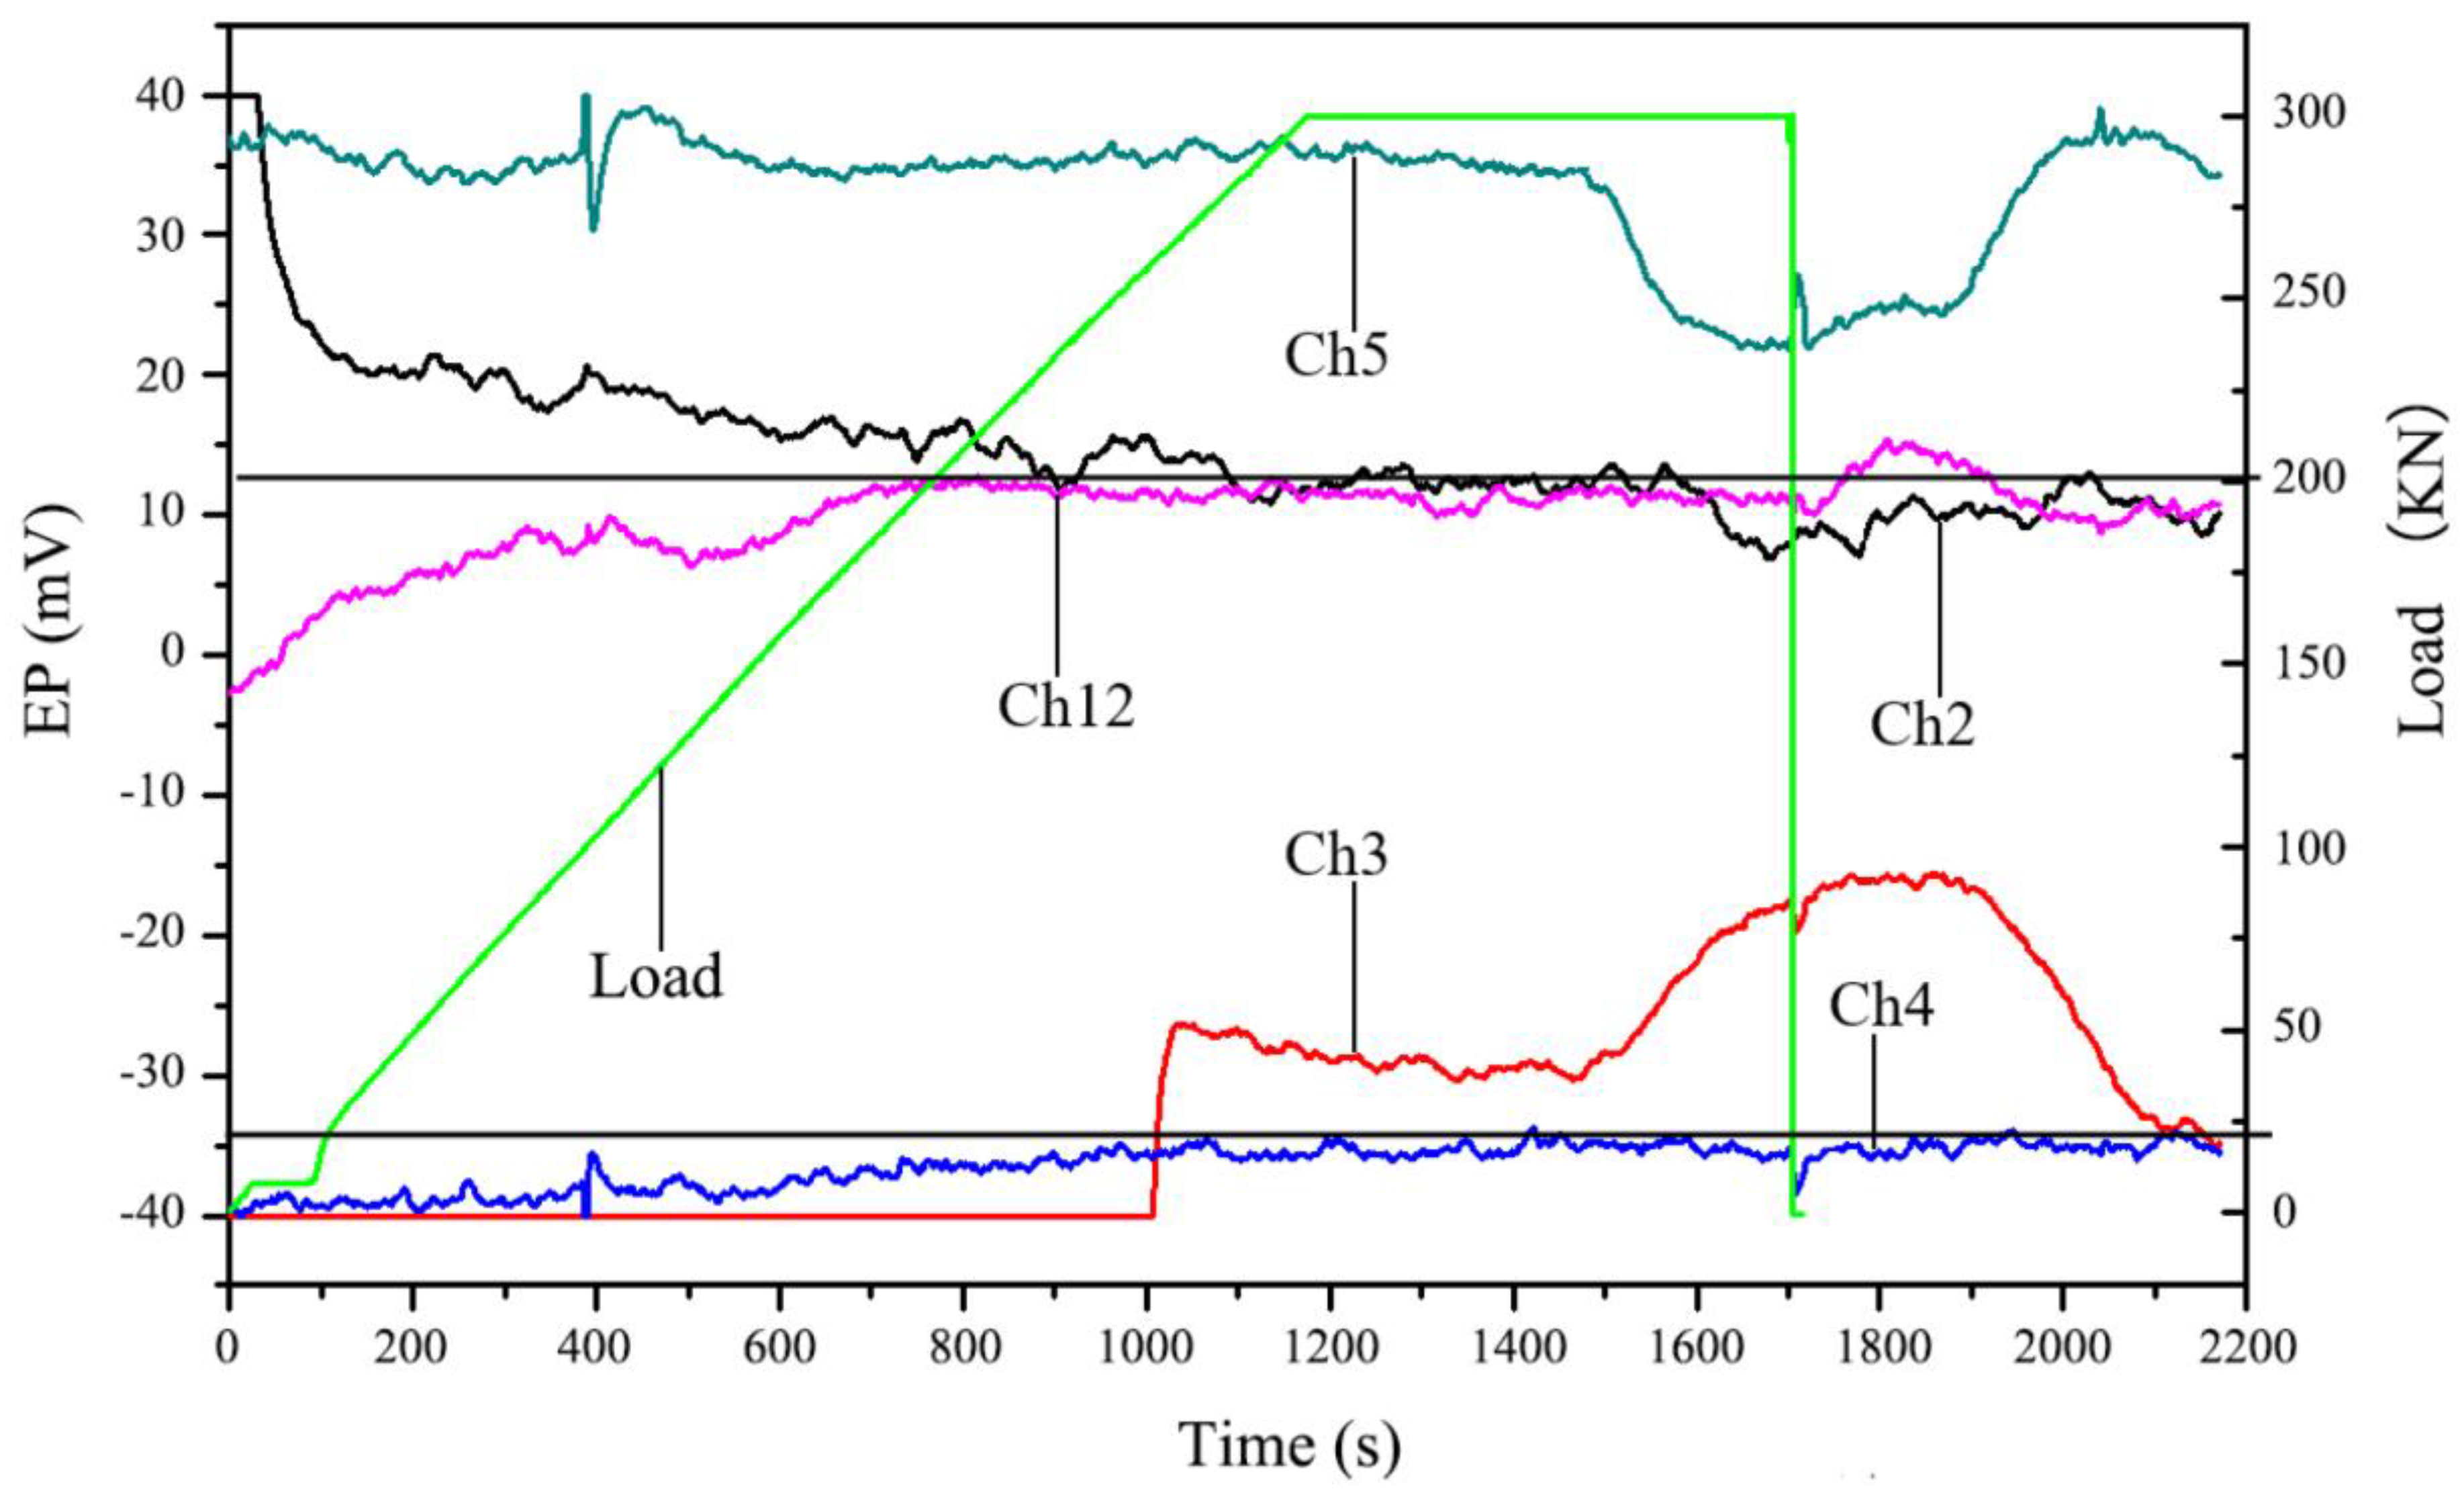
24], which corresponds well with the outburst process of coal and gas. The EMR monitoring method can not only comprehensively characterize the gas, stress, coal-rock fracture process, and other information in front of the working face but also realize the continuous prediction of the evolution process in th coal and gas outburst there. In this section, the experiment tested the pattern of electrical potential signals in gas-bearing coal during the loading process. Overall, the trend in electrical potential signal changes is basically consistent with stress changes. As shown in
Figure 7, at 380
, a minor fracture occurred in the coal mass, and due to the fracture, free charges were generated, resulting in changes in various potential channels within the coal mass. Ch5, Ch2, and Ch12 all show varying degrees of increase. As the load continues to increase, the electrical potential signals in all channels change.
and
are both internal potentials of the coal matrix, and it can be seen that as the load increases during the loading process, the internal coal mass fracturing essentially ends, and the EP signals gradually decrease. Ch12, on the other hand, gradually strengthens with loading. Ch5, with load variations, does not show a very clear trend, but towards the end of the constant load phase, due to the change in the stress state, the signal in channel 5 decreases, and the rate of decrease gradually increases, which is related to the rapid reduction in stress. Ch3 is not far from
and both are on the outer surface of the coal matrix. Their trends are consistent, and during the constant load phase, the signal intensity decreases.
3.3. The Characteristics of the AE, EMR, and EP Signals during the Outburst Process
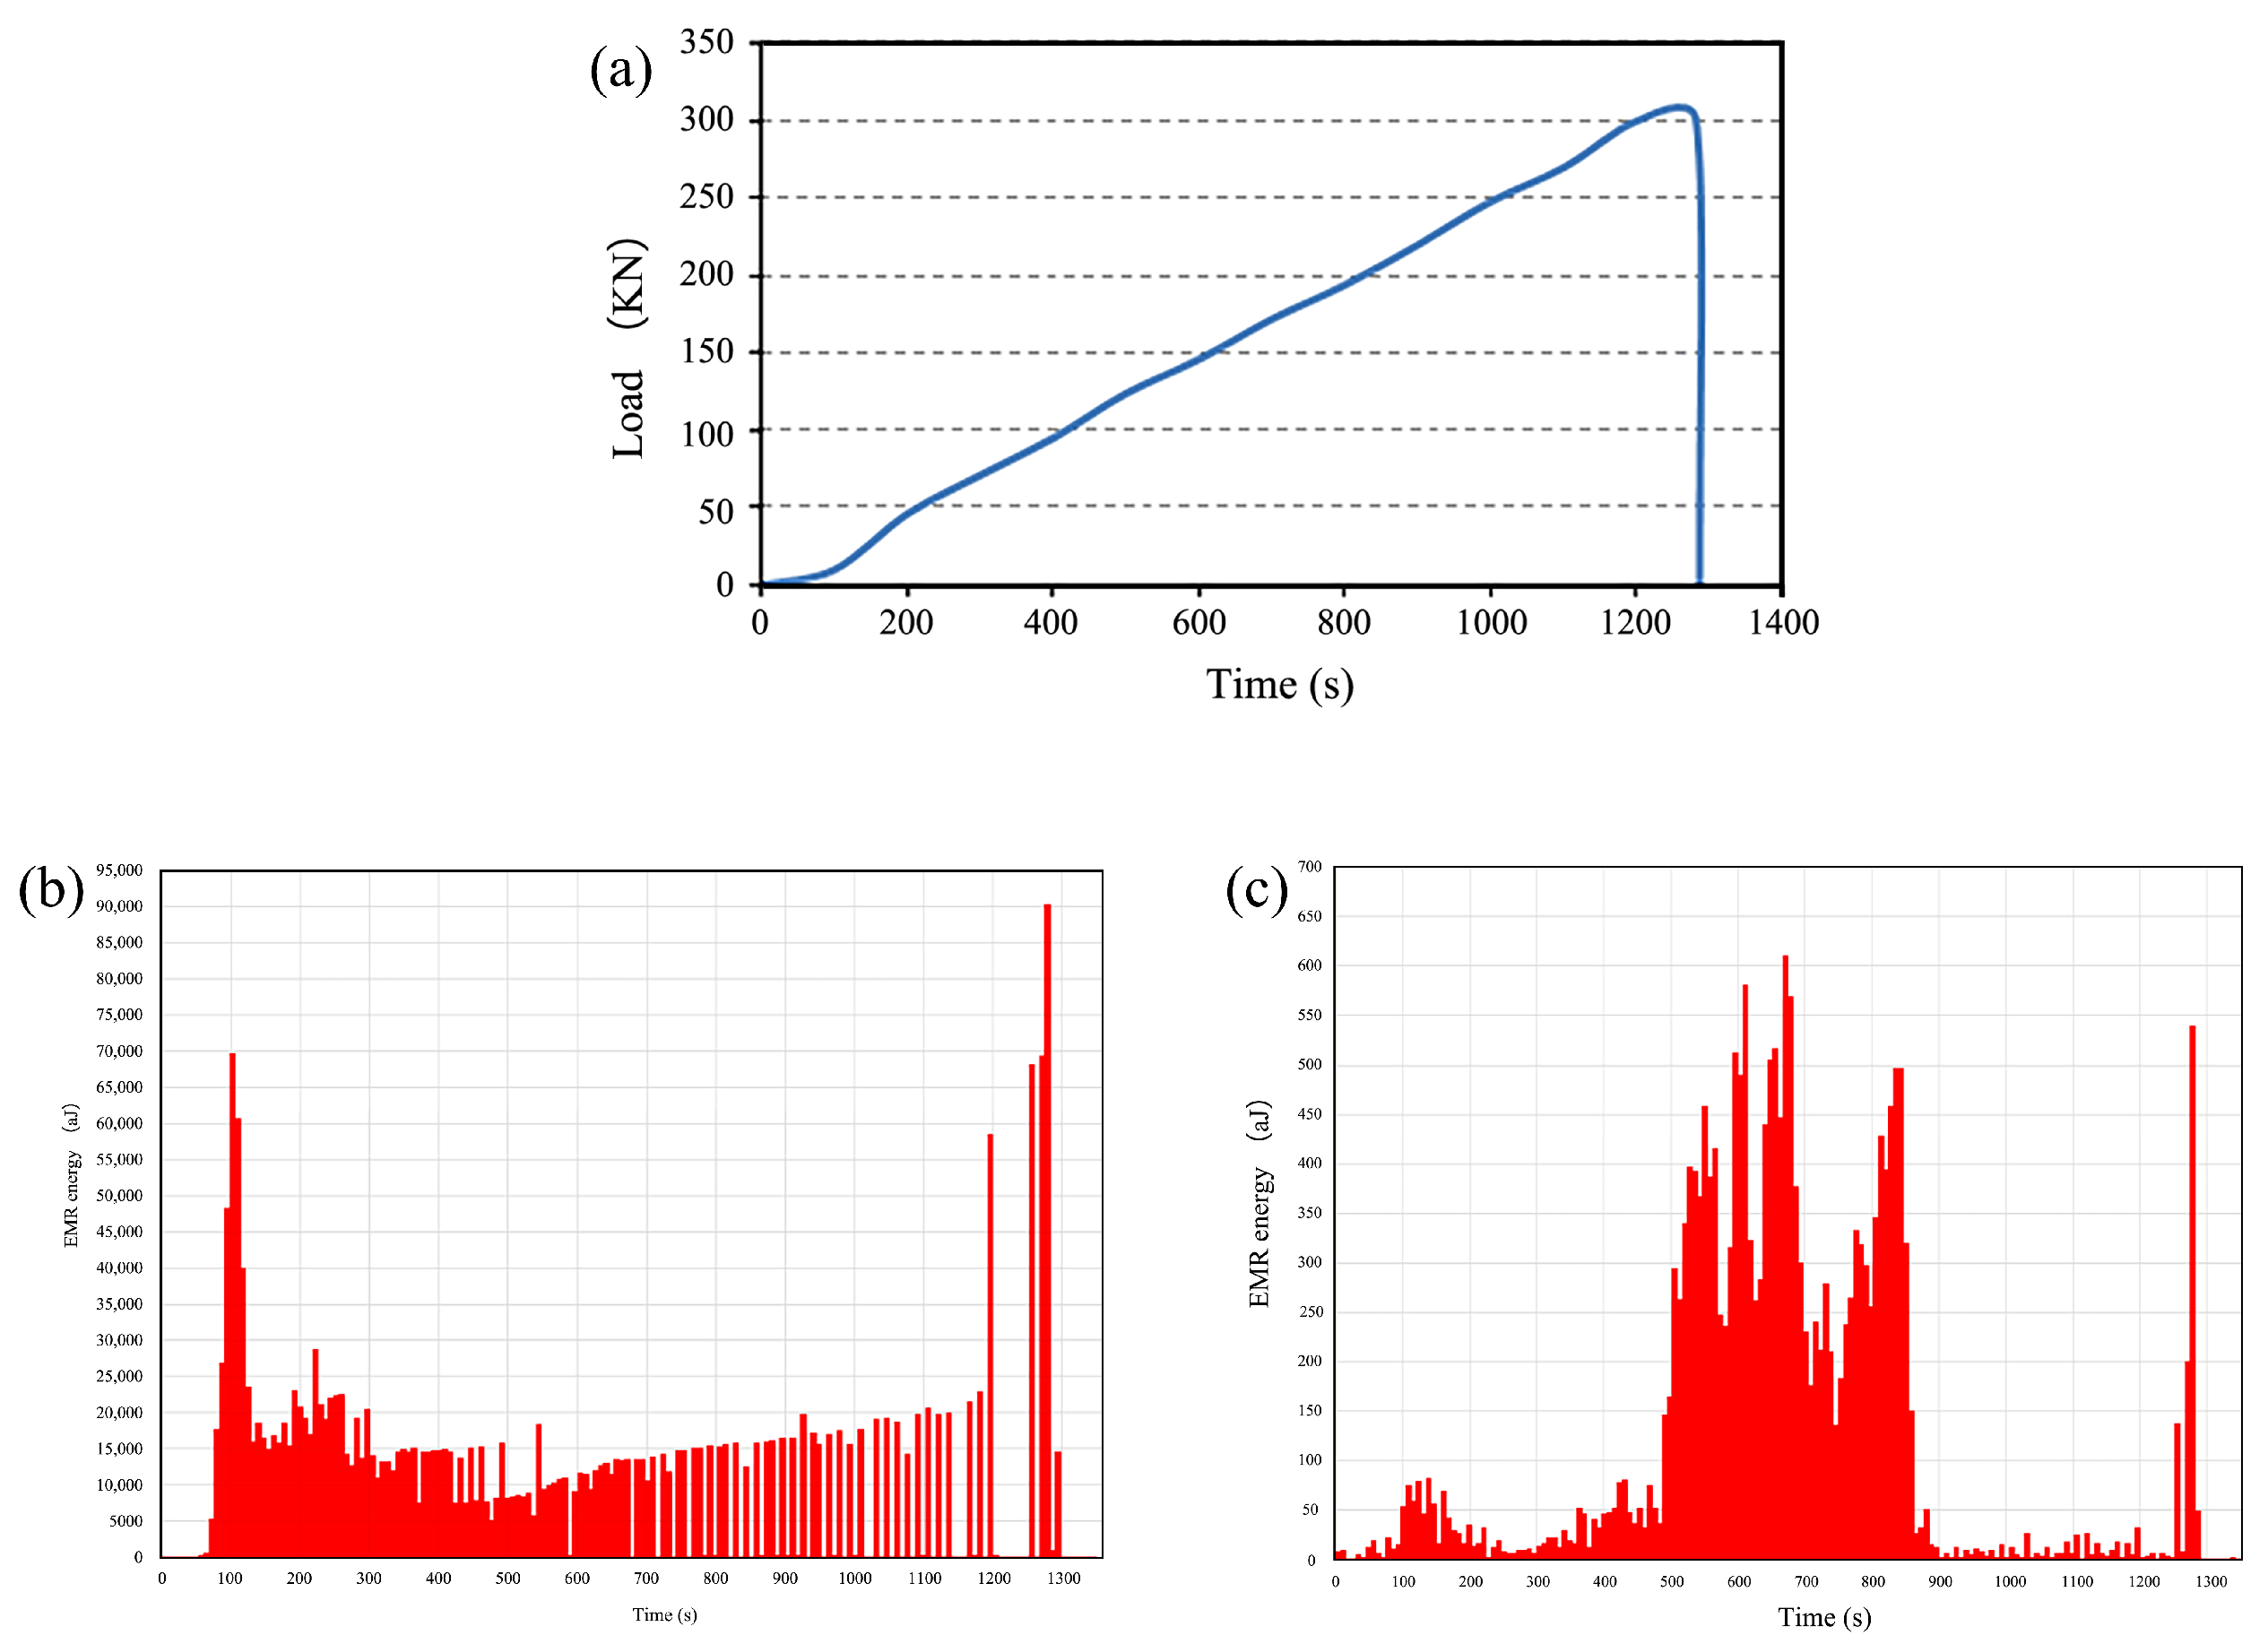
Coal and gas outbursts are rapid processes. During the outburst, the load suddenly decreases, gas rapidly escapes, and the coal is shattered and ejected. In coal mines, there are usually some precursors before a coal and gas outburst occurs. In this study, the changing patterns of acoustic–electric signals during the simulated underground roadway excavation process were tested. In
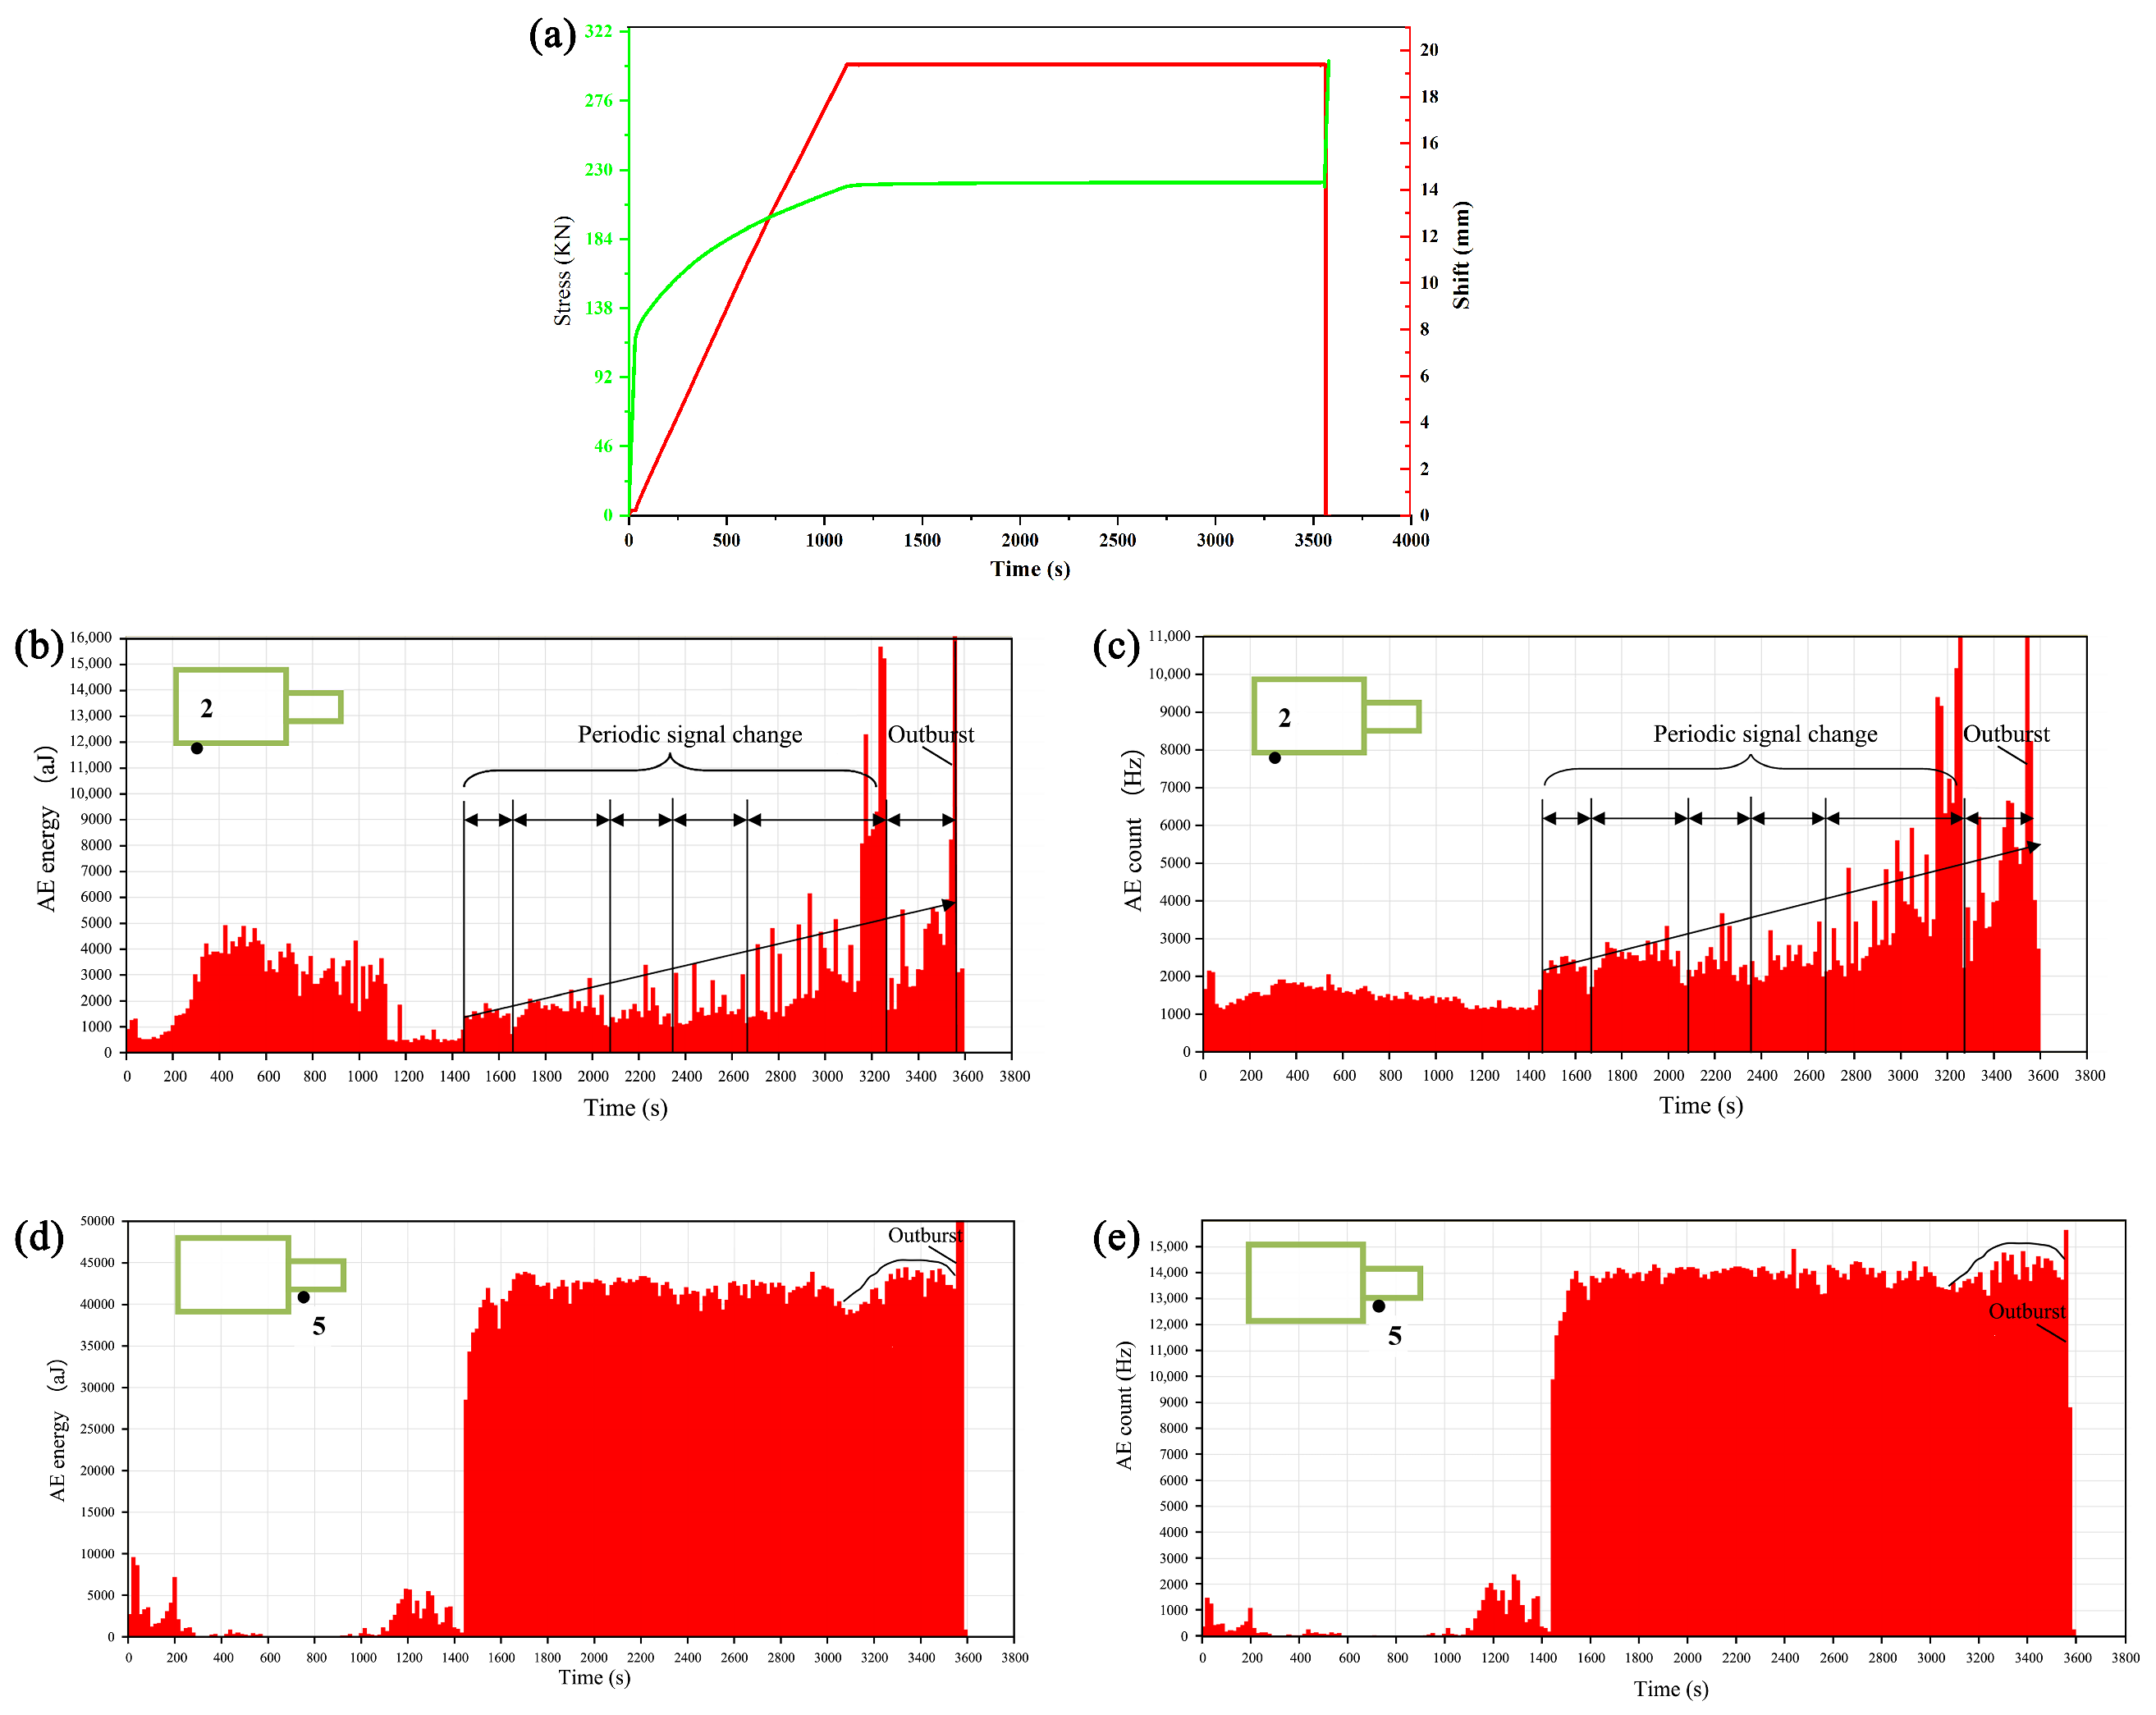
Figure 8a represents the stress–strain of the coal, simulating the in situ stress at the site.
Figure 8b–e represent EMR and AE signals during the simulated outburst process. Starting at
, the simulation of roadway excavation begins, and the outburst lasts for 3540 s.
Figure 7b,c show the monitoring data for Channel 2 of the acoustic emission. From the figure, it can be seen that during the excavation process, as the roadway is excavated, the AE energy gradually increases. An obvious phenomenon can also be observed throughout the entire excavation process: it exhibits a certain periodic pattern. Within each periodic pattern, the variation shows a “peak” shape, where the values first increase and then decrease. Looking at the values of each period, there is a clear increasing trend. Starting from the fifth period, the magnitude of the AE signal enhancement becomes larger, and sudden signal clusters appear. At
, the length of the paraffin column reaches a critical value, and the frictional force between it and the borehole is not sufficient to maintain the original stress balance. As a result, sliding occurs, and the coal moves toward the outburst opening. As the coal unloads at the outburst opening, the AE signal decreases and reaches a new equilibrium. As excavation continues, the length of the paraffin column becomes shorter, and its resistance to the outburst decreases. A larger sliding occurs, separating it from the coal. In front of the coal, the pressure is completely released from the geological stress, and the AE signal reaches a higher value. However, at this point, there is no widespread desorption of gas inside the coal. At
, the paraffin column is completely ejected, and the gas pressure inside the roadway suddenly drops to atmospheric pressure. Under a significant pressure difference, the gas inside the coal rapidly dissipates, and the coal is quickly shattered and pulverized, forming a coal and gas flow.
In
Figure 8d,e represent Channel 5 for EMR signals. The figure shows that due to significant signal interference, the signal characteristics are not clearly evident during the excavation process.
In the simulation of roadway excavation, the paraffin column is relatively long, requiring a considerable amount of time for non-productive work. Through the analysis of
Figure 8, it was found that this period has a relatively small impact on the coal body. In order to save experimental time and capture the acoustic–electric signals during the effective operation period, a method of shortening the paraffin column was adopted. The length of the paraffin column was adjusted based on the residual thickness of the paraffin column from the last outburst, with an additional safety thickness. Through calculations and empirical knowledge, the length of the paraffin column was ultimately reduced to
. After shortening the paraffin column, it can have an immediate impact on the coal in front of it once it is excavated or shortly after excavation.
Figure 9b–e represent the energy and count signals of EMR Ch5 and Ch6. In the figure, the excavation point is at
. It can be seen from the figure that after the excavation "operation," the signal significantly increases. At
, the excavation operation affects the coal, causing the coal to fracture, releasing energy, and the system reaches a new balance with reduced signal intensity. As the operation progresses forward, the degree of coal fracture gradually increases. At
, the paraffin column slides towards the outburst opening and separates from the coal. The coal at the outburst opening expands outward, partially releasing stress and reaching a new relative balance. The changes in stress have essentially disappeared, resulting in only slight changes in the coal mass, hence, the significant weakening of the EMR signal from the coal body. Subsequently, the paraffin column gradually moves towards the outburst opening, and at
, the paraffin column is completely ejected, exposing the coal wall entirely. Under a significant pressure difference, the coal and gas are ejected, completing the outburst. After the outburst, the geological stress no longer affects the coal, and the gas rapidly reaches atmospheric pressure. The disappearance of stress leads to a sharp drop in signal intensity. Looking at the data from
Figure 8d,e, we find that they are similar in characteristics to the Channel 5 signal. However, their sensor placement is different from Channel 5, showing some differences, mainly in the following aspects: at the moment of sudden operation from the original system’s stable equilibrium state, the EMR data signal has a high intensity; the outburst does not occur at the time of the strongest signal but during the process of signal reduction; generally, there is a “peak” appearing before the outburst. The reason for this peak is that the paraffin column moves under stress, the coal unloads and shatters, and the acoustic–electric signal intensifies. After the outburst, the signal drops sharply.
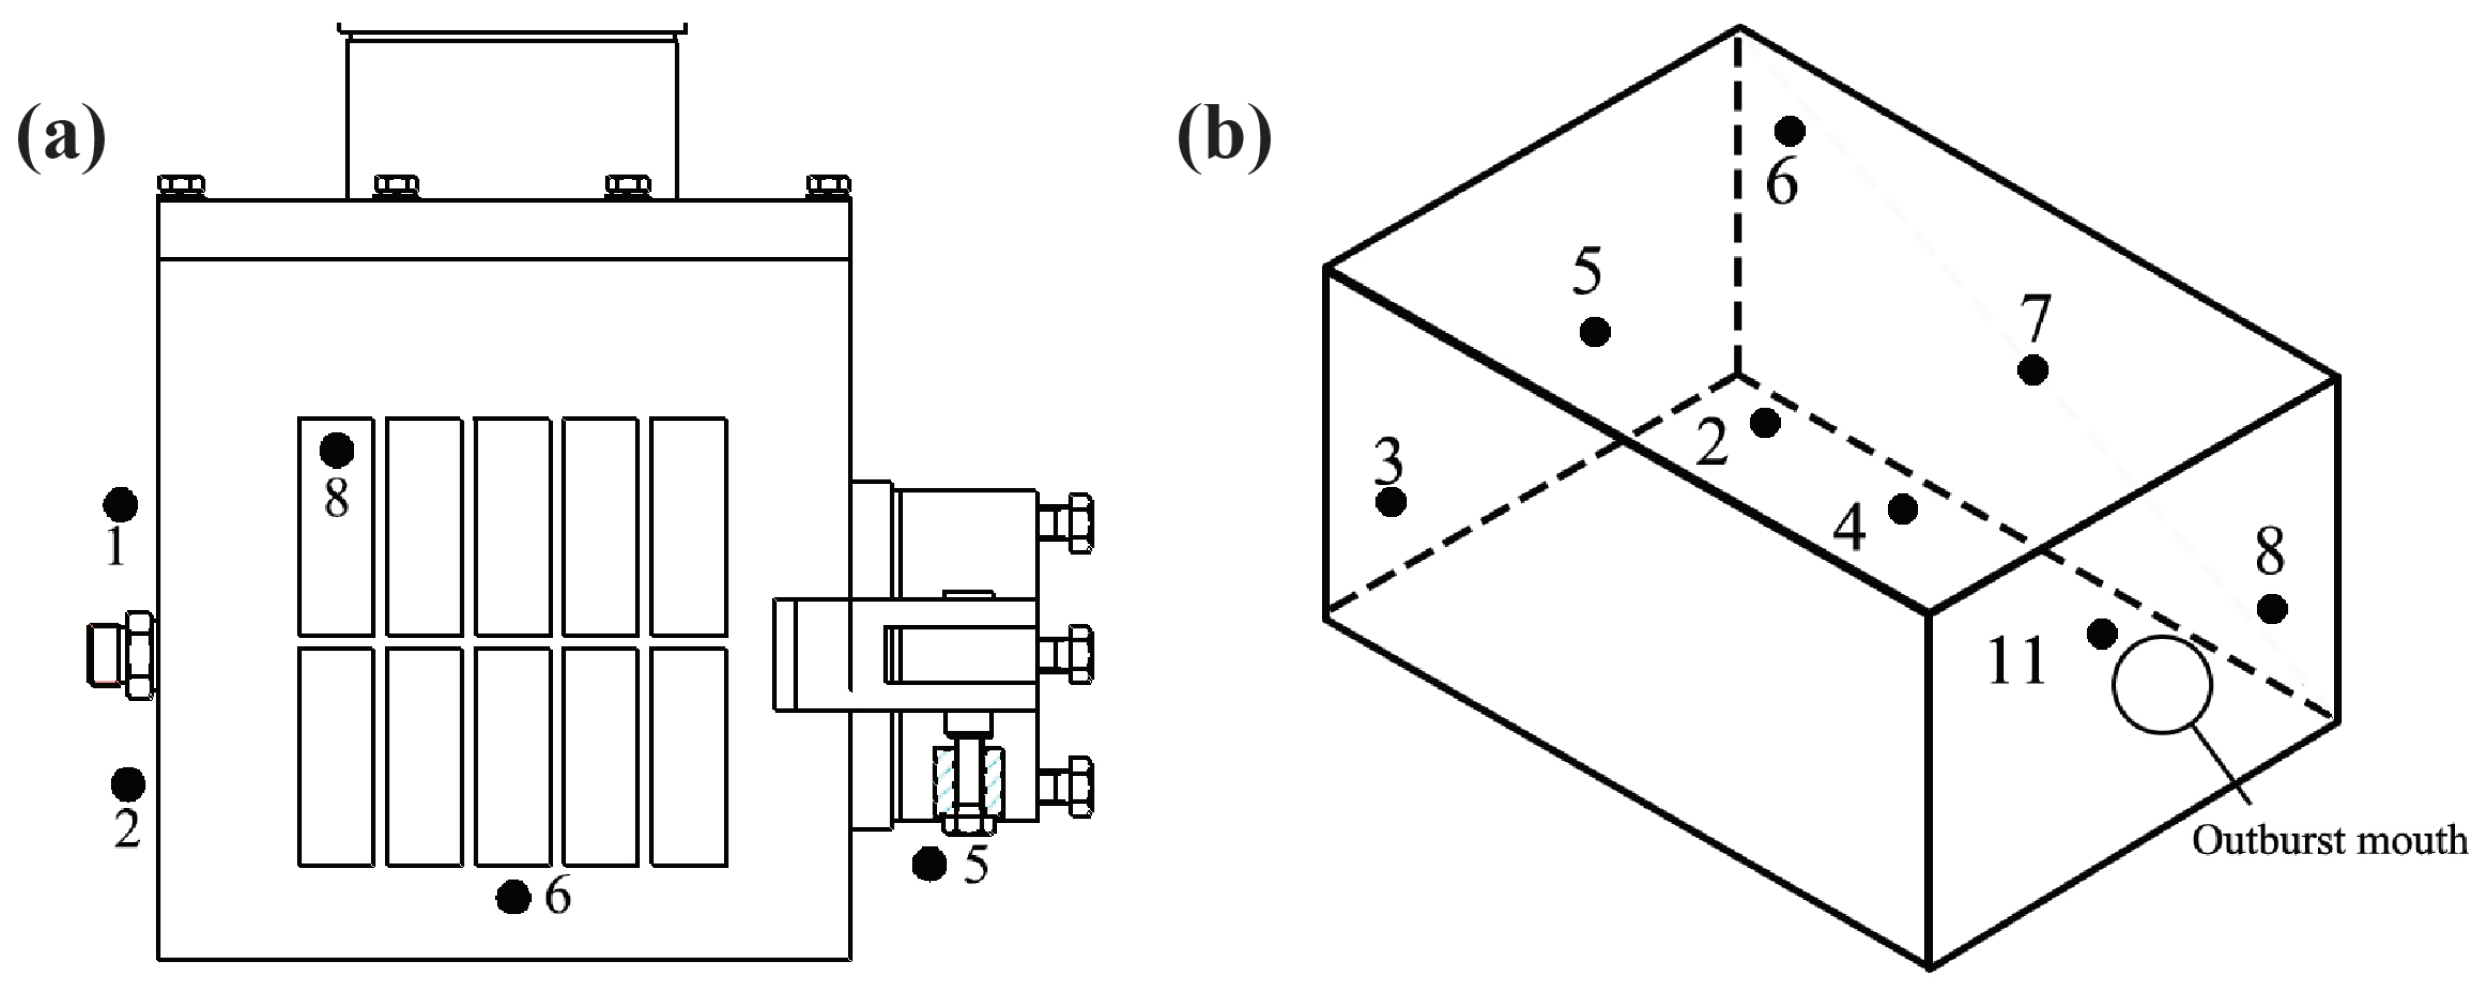
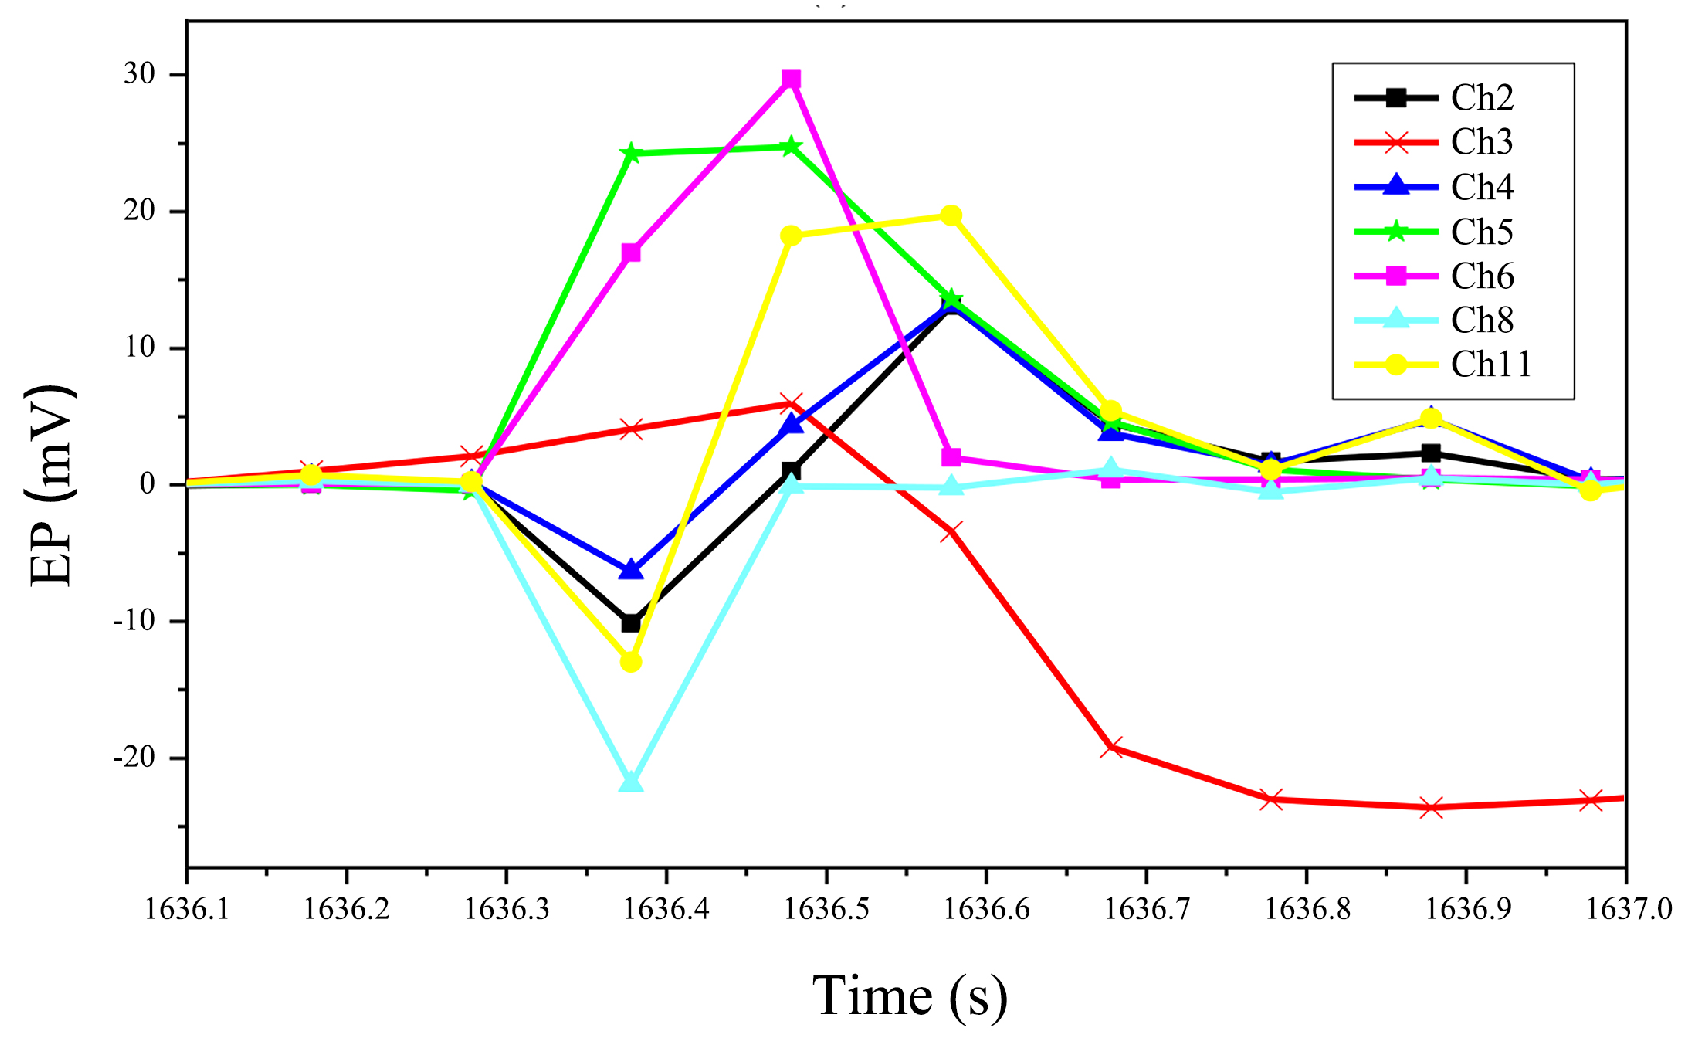
In this set of experiments, the potential sensors in
, and Ch11 are located on the same straight line as the outburst opening, with Ch11 channel being close to the outburst opening.
, and
are close to the cylinder wall. The experiment was conducted at a gas pressure of
, and the results are shown in
Figure 10.
From the experimental results, it can be observed that there is a drastic change in the internal potential of the coal body at the moment of induced protrusion, with significant fluctuations. Among them, and are internal potentials, located on the same line as the protrusion outlet, with Ch11 closest to the protrusion outlet, followed by and . In terms of the trend in changes, the patterns of variation for the three channels are essentially consistent. The EP values rapidly decrease and then sharply increase at the moment of protrusion. During the rising phase, there are differences among the three, with the increase in Ch11 divided into two stages, the first stage being steeper and the second stage being more gradual. Ch2 and Ch4 both rise directly to their maximum values. This might be because Ch11 is near the outburst mouth, and the emission of all gas and coal during the protrusion process causes changes in the EP near Ch11, hence, the differences in the patterns of change. Furthermore, the amplitude of fluctuation is also different among the three, with the rising amplitude of Ch2, Ch4, and Ch11 being , and , respectively. Subsequently, the potential values decrease and gradually stabilize. Ch5 and Ch6 represent surface potentials, both located at the rear of the coal body, with their patterns of variation essentially consistent. The potential values rise rapidly and then decrease at the moment of protrusion. The patterns of change for these two channels are also not exactly the same. Ch5 and can be divided into two stages, with Ch5 being more apparent and similar to the rising stage of Ch11. This might be because and are further from the protrusion outlet. In the initial stage of protrusion, the main factor is the gas desorption flow, causing coal body deformation and damage, and later, the coal body is ejected by high-pressure gas, resulting in the two-stage change in the potential of and Ch6 channels. The rising amplitude is also different between the two, with ch5 and ch6 rising by and , respectively. Afterward, the three gradually stabilize. The Ch3 is also a surface potential, with the potential value slowly rising and then rapidly falling at the moment of protrusion. The potential value of the Ch8 channel rapidly decreases and then rapidly increases at the moment of protrusion, but after rising, the potential is level with the original potential value, with the subsequent changes in potential being stable and fluctuations being small.
The change in EP signal is a reflection of the internal damage and destruction of the coal body. The differences in the trajectories of EP signal changes indicate that there are variations in the damage and destruction of the coal body near each electrode slice. As analyzed and studied from
Figure 10, showing the changes in EP signal at the moment of protrusion under gas pressure, it is known that during the protrusion process, the trend in internal potential change is that the potential value first decreases at the time of protrusion and then rapidly rises. The reason for the decrease is as follows: after the protrusion outlet opens, the stress in the coal body is released, and the gas is discharged. Subsequently, with the development of the coal body protrusion, a large amount of coal breaks, and the breaking of the coal body is accompanied by the separation of charges. The electrons with negative points escape, leaving only positive charges, leading to an increase in potential where the protrusion has occurred. As for the potential at the surface of the coal body, due to the discharge of coal and gas from the protrusion outlet during the protrusion process, accompanied by the rapid discharge of gas and the breaking of the coal body, charge separation occurs, leading to an increase in the EP signal at this location.
During the moment of induced protrusion, the potential values obtained from the tests undergo drastic changes, indicating that the coal body experiences internal ruptures due to the combined effects of gas and stress at this instant. The protrusion process is characterized by the release of the elastic potential energy of the coal body and the internal energy of the gas. The release of the coal elastic potential energy is inherently a process of damage and rupture. Thus, during the outburst of the coal body, the rapid expansion of fractures in the coal body generate a large number of free charges, leading to a rapid change in potential values. The release of gas internal energy is essentially a process where the non-equilibrium gas acts on the coal body. At the moment of induced protrusion, a significant gas pressure gradient is formed near the protrusion opening, and gas rapidly flows towards the lower pressure side. Due to the brevity of this moment, the high-pressure gas exerts considerable force on the coal body, generating tensile stress within the coal body, leading to the rupture of the coal body near the opening and the outburst of gas. As a large amount of gas outbursts, internal fractures in the coal body extend along the existing “weak planes,” separating out free charges and providing a pathway for the gas outburst. Hence, during the simulated protrusion, , and , which are in a straight line with the protrusion opening, exhibit a significant gas pressure gradient, and their gradient directions are basically consistent, showing similar charge generation mechanisms and change patterns at the moment of protrusion. Potential test points far from the induced protrusion opening primarily participate in the protrusion process in the initial stage due to the rapid desorption and outward migration of adsorbed gas, continuously supplying gas for the protrusion. This process causes deformation of the coal body skeleton, leading to drastic changes in potential. When the gas pressure gradient and stress are sufficient to cause the coal body to rupture and be thrown out, the coal body and gas are expelled together.
The rupture of the coal body generates a large number of free charges, causing potential changes. Potential measurement points near the cylinder wall cannot provide high gas concentration, and the outburst is not as intense as at measurement points closer to the protrusion opening; thus, the induced potential change is not as strong. The high-speed outflow of gas causes a strong flow potential effect and triboelectricity, which is also one of the factors causing potential changes at the moment of outburst.
In summary, considering the different , and signals in the three stages, it can be seen that during the adsorption process, the irregularity of AE signals is caused by the varying strengths throughout the coal mass. The process of gas adsorption can cause damage and deformation to the coal body, disrupting the original charge balance within it and resulting in noticeable changes in electric potential values. During the loading process, the trends in AE, EMR, and EP signals are generally consistent with changes in stress. At the moment of outburst, as the coal and gas erupt, the AE and EMR signals increase sharply. Outbursts generally occur during the signal decline of AE and EMR, with the internal EP signal strength first decreasing and then rapidly rising. These findings suggest that there might be possible synergistic or correlated behaviors among EMR, AE, and EP signals. The difficulty and accuracy of monitoring signal changes vary at different stages. Therefore, the combined use of EMR-AE-EP signals for early warning can be used to enhance safety in coal mine production. However, our study was only conducted under simulated laboratory conditions, lacking field data. Additionally, these signals were not integrated, making them unsuitable for direct application. Utilizing machine learning methods to organize the data might provide more accurate and earlier warnings of coal and gas outburst.


