Article

Soil Tillage and Cropping System Effects on the Physical-Hydric Properties of a Soil under No-Tillage

by
Tiago Stumpf da Silva
1,
Luis Eduardo Akiyoshi Sanches Suzuki
2,*,
Cássio Antonio Tormena
3,
Marcelo Raul Schmidt
1,
Michael Mazurana
1 and
Renato Levien
1
1
Department of Soils, Federal University of Rio Grande do Sul, Porto Alegre 91540-000, RS, Brazil
2
Center of Technological Development, Federal University of Pelotas, Pelotas 96010-610, RS, Brazil
3
Department of Agronomy, State University of Maringá, Maringá 87020-900, PR, Brazil
*
Author to whom correspondence should be addressed.
Sustainability 2023, 15(22), 15936; https://doi.org/10.3390/su152215936
Submission received: 7 September 2023 / Revised: 18 October 2023 / Accepted: 13 November 2023 / Published: 14 November 2023
(This article belongs to the Special Issue Sustainable Agriculture for Crop Cultivation)

Abstract

:
A no-tillage system (NT) is an alternative to replace soil management with intense soil tillage and degradation. Our objective was to evaluate the physical–hydric properties of soil under NT for four years after undergoing 13 years of minimum (4NTM) and conventional tillage (4NTC) with reference to continuous NT for 17 years (17NT). The soil bulk density, porosity, storage capacities of water and air, visual evaluation of soil structure (VESS), and saturated hydraulic conductivity were determined. The root dry biomass of soybean, maize, and palisade grass was also measured. NT during four years established after receiving 13 years of tillage did not significantly affect soil properties compared to 17NT, which means that four years of NT reached structural stability similar to continuous 17NT. The VESS scores were less sensitive to identifying soil compaction. Crops have no significative influence on soil properties, but the roots of maize seem to be less sensitive to soil compaction, which is important considering it is in a crop rotation system. The treatments (soil tillage and crop rotation) presented soil compaction below a 10 cm depth, and to our loamy textural class soil, a Bd > 1.60 Mg m−3 restricted soil aeration due to macroporosity < 0.10 m3 m−3.

1. Introduction

No-tillage is characterized by no soil disturbance, while the intensity of disturbance increases from minimum to conventional tillage, generally characterized, respectively, by chiseling, plowing, and harrowing [1]. No-tillage (NT) brings numerous benefits to the soil and the environment [2], increasing organic matter, especially at the 0–10 cm soil layer depth [3,4], with positive effects on soil structure and soil physical properties [2,3,4,5,6], being considered a sustainable management system. NT is also characterized by having a more organized and stable soil structure, with biopores created by plant root systems and mesofauna activity [1,7], being considered a sustainable (economic, social, and environmental, for example) management system. On the other hand, soil compaction in no-tillage has been observed at around 8 to 15 cm of soil depth [8]. The variability and diversity of soils, uses, management, machinery, and climate, for example, make the soil behavior under those different conditions complex, making it necessary for specific studies to understand their influence over time.
NT is often adopted to replace conventional or minimum tillage practices [3,9,10], which may significantly improve soil structure [11] and make the system sustainable. Soils under conventional tillage generally present a compacted layer formed when tractor tires run on the bottom of the plow furrow [8,12]. This compacted layer affects the flow of water and air in the soil, as well as the growth of roots in deeper layers, with negative impacts on crop yields [13], compromising the sustainability of the system. Few studies have been reported on how the conversion from conventional or minimum tillage into NT affects soil structure [14,15]. Therefore, long-term studies can help elucidate the structural changes that occur after NT adoption with the absence of soil mobilization [16,17], and they may help decision makers regarding soil management.
Soil structure organization has a significant influence on the pore network, as well as on its continuity and connectivity, thus affecting air and water flow in the soil [18]. The physical properties of soil, which control the hydraulic properties, such as hydraulic conductivity and water infiltration, are important indicators of soil structure organization and porosity due to soil tillage practices, which also affect plant growth [19]. The changes undergone in these properties along the transition process into the NT system are not well understood yet, and the results show divergences that may be related to interactions between different soils, climates, and crop systems [3].
As we can see, no-tillage can bring many benefits to the most variable situations (economic, environmental, and others), but soil compaction may negatively affect the no-tillage system, so it is necessary to know which strategies to avoid or break up the soil compaction layer (mechanically or biologically, for example).
Changes in soil physical properties modify the growth and development of the root system under NT [20,21]. For instance, studies have shown that additional compaction applied in NT reduces root growth and concentrates it in the 0–10 cm surface layer [20,21], compromising the sustainability of the system.
In this study, we hypothesized that after conversion from minimum or conventional tillage, the 4-year period under NT would present similar soil physical–hydric properties via long-term NT. Thus, the objectives of this work were (i) to evaluate soil physical–hydric properties in two short-term NT, i.e., 4 years of NT after receiving 13 years of minimum and conventional tillage compared to continuous long-term NT for 17 years; and (ii) test the capacity of palisade grass to produce root dry biomass, and its impacts on soil structure.

2. Materials and Methods

2.1. Site and Tillage Systems Description

The study was conducted in a long-term experiment at the experimental station of the Federal University of Rio Grande do Sul, Southern Brazil (30°05′47″ S, 51°40′52″ W, and 42 m asl). The soil was a loam Ultisol ([22]; Acrisol [23]; Argissolo Vermelho Distrófico típico, Brazilian soil classification system [24]. The 0–10 cm soil layer had 46.2% of sand, 29.1% of silt, and 24.7% of clay, while the 10–20 cm layer had 43.7% of sand, 28.5% of silt, and 27.8% of clay. The local climate is humid subtropical (Cfa), with a mean annual temperature of 18.8 ºC and a mean annual rainfall of 1455 mm (1970–2009, climatological normal), ranging from 102 mm (March) to 154 mm (June), according to Bergamaschi et al. [25].
The experiment consisted of three tillage systems (no-tillage, minimum tillage, and conventional tillage), lasting from 2000 to the summer of 2013; the minimum and conventional tillage were replaced for no-tillage in the following years (Figure 1). Soil disturbance in conventional and minimum tillage in their respective plots was carried out once every year before the spring/summer crops. Minimum tillage consisted of chiseling down to a 25 cm depth, using a chisel plow with five shanks, a 0.40 m interval between shanks, and a shank tip width of 6 cm. Conventional tillage was performed down to a 20 cm depth using multiple passes of a disc plow with 4 discs of 71 cm (~28 inches) in diameter, followed by two passes of harrowing using a disc harrow with 36 discs of 50 cm (~20 inches) in diameter and a depth operation of around 10 cm. Since the summer of 2014, NT has been conducted using a mounted precision seeder (Vence Tudo, AS11500 model, Ibirubá, Brazil) with five tine furrow openers with 45 cm spacing and working a depth of around 12 cm. The same NT seeder was used for autumn/winter crops but modified to 11 double-disc furrow openers distributed along a 17 cm spacing.
In the spring/summer season, soybean (Glycine max L.) and maize (Zea mays L.) crops were sown every alternative year in all plots. The autumn/winter crops were black oat (Avena strigosa Schreb), ryegrass (Lolium multiflorum L.), and vetch (Vicia sativa L.), always sown in NT without prior soil disturbance, over the spring/summer crop straw residues.
Table 1 shows the crops used over the years, with only one crop per spring/summer being established until 2016. From the spring/summer of 2017, tillage plots were divided into three subplots, with palisade grass [Brachiaria brizantha (Hochst. ex. A. Rich) Stapf] being included as a third crop in the experimental field, performing the three tillage systems (no-tillage, minimum tillage, and conventional tillage) in the plots and the crops (soybean, maize, and palisade grass) in the subplots.
A timeline of the main events performed in the experiment is presented in Figure 1.

2.2. Experimental Design and Treatments

The experiment was carried out in a split-plot design, with three soil-tillage practices (no-tillage, minimum tillage, and conventional tillage) as the main plots and three crops (soybean, maize, and palisade grass) as the subplots, with four replicates. In the 2017/2018 season, the main plots consisted of soil tillage: (i) 17 years in continuous no-tillage (17NT) (from 2000 to 2017/2018); (ii) 4 years of NT after receiving 13 years of minimum tillage (4NTM); and (iii) 4 years of NT after receiving 13 years of conventional tillage (4NTC). The subplots consisted of growing (i) soybean, (ii) maize, and (iii) palisade grass. Each 17NT plot had dimensions of 10 × 15 m, while the 4NTM and 4NTC plots measured 10 × 7.5 m. In 2017/2018, the three crops were sown in early November: soybean and maize with 45 cm spacing in rows (soybean with 15.3 and maize with 3.5 seeds per meter) and palisade grass with 17 cm spacing in rows. Palisade grass had to be reseeded in late December because of low germination in the first sowing due to a water deficit, remaining 40 days less than the other crops.
Maize was harvested in early April, and soybean in early May 2018, along with the shoot dry biomass of palisade grass that was sampled by hand. The harvesting of maize and soybean was performed with a combined harvester (7200–4900 kg on the front axle and 2250 kg on the rear axle). The autumn/winter crops were used as cover crops. Black oat was sown at the end of May, with 17 cm spacing in rows and 80 kg ha−1 of seeds. Before sowing spring/summer crops, black oat was desiccated with herbicide.
A 4 × 2 tractor with a front-wheel assist (FWA) of 53 kW was used for all operations in the experiment over the years, including phytosanitary treatments. It had a total weight of ~ 3500 kg and ~165 and ~137 kPa inflation pressures, respectively, on the front and rear axle tires.

2.3. Soil Sampling and Physical–Hydric Properties

Soil sampling using undisturbed soil cores of ~102 cm3 (~4.0 cm diameter and ~5.7 cm height) was carried out in mid-March 2018, which coincided with the maturity stage of soybean and maize growth. Samples were taken from the inter-row zone in the middle of 0–10 cm, 10–20 cm, and 20–30 cm soil layers, totaling 216 samples (4 blocks × 9 treatments × 3 depths × 2 cylinders per depth). Undisturbed soil samples were used to determine soil bulk density (Bd), macroporosity (Mac—pores larger than 0.05 mm), microporosity (Mic—pores smaller than 0.05 mm), total porosity (TP), and saturated hydraulic conductivity (Ksat). The soil samples were saturated and drained at a −6 and −10 kPa matric potential to determine, respectively, the microporosity and field capacity. After reaching equilibrium at each potential, the samples were weighed and oven-dried at 105 °C for 48 h to quantify the Bd, porosity, and volumetric water content in each matric potential.
TP [m3 m−3] was obtained using the ratio between Bd [Mg m−3] and soil particle density (2.53 Mg m−3) (Equation (1)), while Mac [m3 m−3] was calculated as the difference between TP and Mic [m3 m−3].
TP = 1 − (Bd/particle density)
The soil physical quality indicators of storage capacity of water (FC/TP) and storage capacity of air (AC/TP) were determined according to Reynolds et al. [26]. The FC/TP was calculated using the ratio between volumetric water content retained at a matric potential equivalent to the field capacity (FC), i.e., matric potential of −10 kPa and TP. The AC/TP was determined using the ratio between air capacity (AC) and TP. The AC was calculated as the difference between saturated volumetric water content and pore volume drained at a matric potential of −10 kPa.
The undisturbed soil samples were also used for measuring the soil-saturated hydraulic conductivity (Ksat). Before being oven-dried at 105 °C, the samples were slowly saturated via capillarity with water for 48 h, and then, the Ksat was determined using the falling-head soil cores method according to Reynolds and Elrick [27] and calculated as expressed by Equation (2):
Ksat = (Ø/Øs)2 (H/t) ln (h0/h1)
where Ksat is the saturated hydraulic conductivity (LT−1); Ø is the diameter of the cylinder without soil over the cylinder with a soil sample (L); Øs is the diameter of the cylinder with a soil sample (L); H is the height of the soil sample (L); h0 and h1 are the reference heights (heights of the metal gauges + H) (L); and t is the time between the water level at h0 until reaching the level at h1 (T). At each measurement, the water temperature was measured to correct the viscosity and density to 20 °C.

2.4. Visual Evaluation of Soil Structure

The visual evaluation of soil structure (VESS) was performed using Guimarães et al.’s [28] improved method. The evaluation was performed on 36 soil samples, i.e., 9 treatments (three soil tillage practices × three crops) × 4 blocks. The VESS scoring (Sq) was performed on the same day as the root system was sampled. Each soil sample was collected with a spade (20 cm wide × 10 cm thick × 25 cm deep) and transferred to a plastic tray. The characteristics evaluated were the size and shape of aggregates, the shape and position of the roots, and the soil aggregate porosity. A soil structural quality score (Sq) was attributed to each layer using the VESS reference chart, and the overall score for each sample was calculated according to Guimarães et al. [28]. The interpretation of VESS scores was integrated into a single value according to Ball et al. [29], ranging from 1 (good soil quality) to 5 (poor soil quality): Sq1—friable (aggregates readily crumble), Sq2—intact (aggregates easy to break with one hand), Sq3—firm (most aggregates break with one hand), Sq4—compact (requires considerable effort to break aggregates with one hand), and Sq5—very compact (difficult to break up).

2.5. Evaluation of the Plant Root System

On 6 April 2018, the sampling of soybean, maize, and palisade grass root systems was performed, respectively, at 149, 144, and 105 days after sowing. The root samples were extracted using a root auger (inner diameter—6 cm; height—10 cm), 10 cm from the reference plant (two plants per plot) in each plot, in the 0–10, 10–20, and 20–30 cm layers on the row crops. The roots were manually separated from the soil using sieves and tweezers by washing and then oven-dried at 60 °C till constant weight to determine the root dry biomass.

2.6. Data Analysis

The normality of the data was checked using the Shapiro–Wilk test prior to any further statistical tests. Non-normal data were log-transformed before analysis. An ANOVA was conducted with a split-plot design model to test the main effect (soil tillage) and split-plot effect (crops) and their interaction. Each soil layer (0–10, 10–20, and 20–30 cm) was analyzed separately to test soil properties and the root dry biomass. When the effects of treatments were significant, means were compared using Tukey’s test (p < 0.05). The coefficient of variation was interpreted based on Pimentel-Gomes and Garcia [30], using the following range: low (smaller than 10%), medium (between 10 and 20%), high (between 20 and 30%), and very high (larger than 30%).
Regression analyses using an Excel spreadsheet version 2016 were realized between macroporosity with bulk density and saturated hydraulic conductivity. From the equation obtained via the regression between macroporosity and bulk density, the critical value of bulk density was defined and corresponded to 0.10 m3 m−3 macroporosity, a value considered to limit soil aeration to plant growth [31]. Furthermore, the average bulk density values were relativized, according to Equation (3), and we named the relative bulk density (RBd, %):
RBd = (actual bulk density, Mg m−3/bulk density corresponded to 0.10 m3 m−3, Mg m−3) × 100
Statistical analysis was performed using R 3.40 (R Foundation for Statistical Computing, Vienna, Austria) combined with the ExpDes package [32]. A Spearman rank correlation coefficient (r) between root dry biomass and soil physical–hydric properties was performed using SigmaPlot version 14.0 (Systat Software, San Jose, CA, USA). The correlation coefficients were interpreted using the ranges indicated for Mukaka [33] and Schober et al. [34]: r = 0.00 to 0.10: negligible correlation; r = 0.10 to 0.39: weak correlation; r = 0.40 to 0.69: moderate correlation; r = 0.70 to 0.89: strong correlation; and r = 0.90 to 1.00: very strong correlation.

3. Results

3.1. Soil Physical–Hydric Properties

Soil tillage practices and crops did not have significant effects (p > 0.05) on soil bulk density (Bd), macroporosity (Mac), total porosity (TP), and saturated hydraulic conductivity (Ksat) at all investigated depths (Table 2), while Mic was significantly affected by crops (p < 0.05) at the 10–20 cm soil layer.
Based on Pimentel-Gomes and Garcia [30], the coefficient of variation was low (smaller than 10%) to Bd, Mic, and TP, high (between 20 and 30%), very high (larger than 30%) to Mac, and very high to Ksat (Table 2).
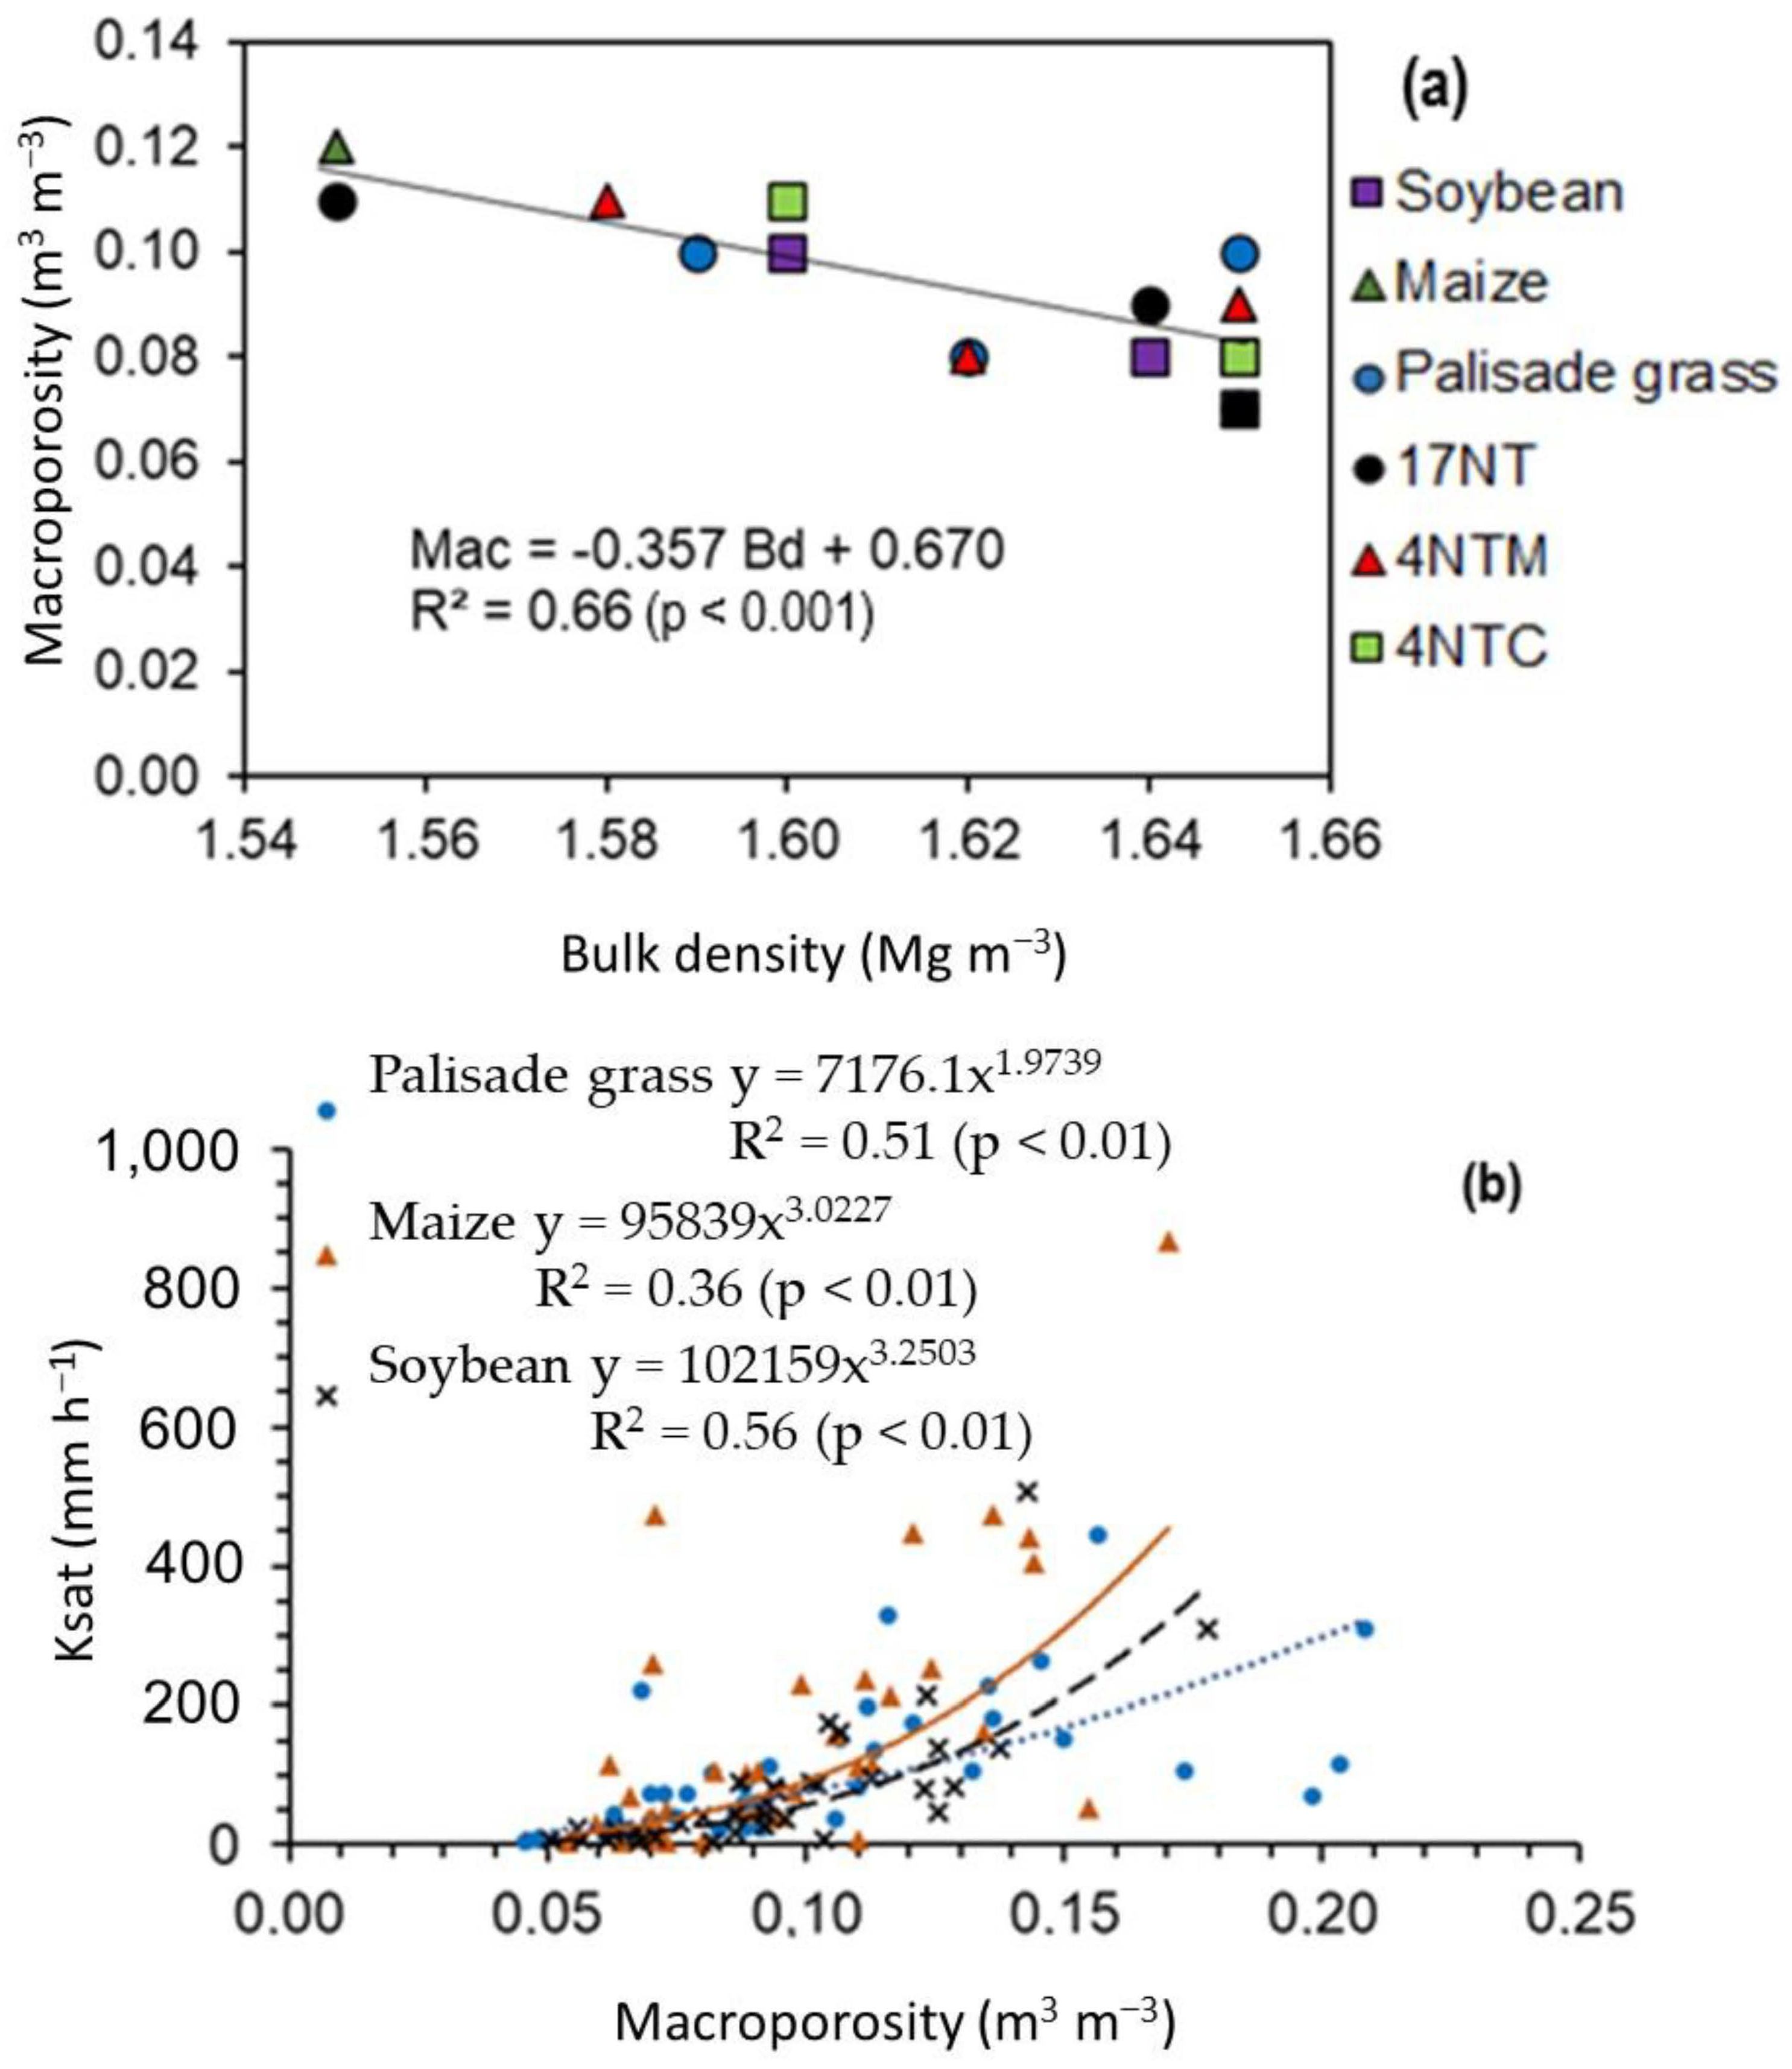
From the linear regression between Bd and Mac (Mac = −0.357 Bd + 0.670; R2 = 0.66; p < 0.001; Figure 2a), the Bd = 1.60 Mg m−3 was taken as the critical value in which it corresponds to Mac = 0.10 m3 m−3, a limit value of air-filled porosity for plant growth suggested by Grable and Siemer [31]. In the subsurface layers of 10–20 and 20–30 cm, Bd exceeded 1.60 Mg m−3, and the macroporosity was lower than 0.10 m3 m−3 (Table 2), resulting in a relative bulk density (RBd) larger than 100%. Although the bulk density and macroporosity did not reach values larger than the critical value (respectively, 1.60 Mg m−3 and 0.10 m3 m−3) in the surface soil layer (0 to 10 cm), it is possible to verify that they are close to reaching the critical value of Bd = 1.60 Mg m−3, with a relative bulk density ranging between 96.88 and 100% (Table 2).
The relationships between Ksat and Mac for crop treatments are shown in Figure 2b. Regarding a macroporosity of 0.10 m3 m−3 as the critical value of air-filled porosity, the Ksat was 57 (R2 = 0.51; p < 0.01), 76 (R2 = 0.56; p < 0.01), and 91 mm h−1 (R2 = 0.36; p < 0.01), respectively, for soybean, palisade grass, and maize. The values of Ksat are the minimum capacity of soil flow water considering the critical value of soil macroporosity (=0.10 m3 m−3).
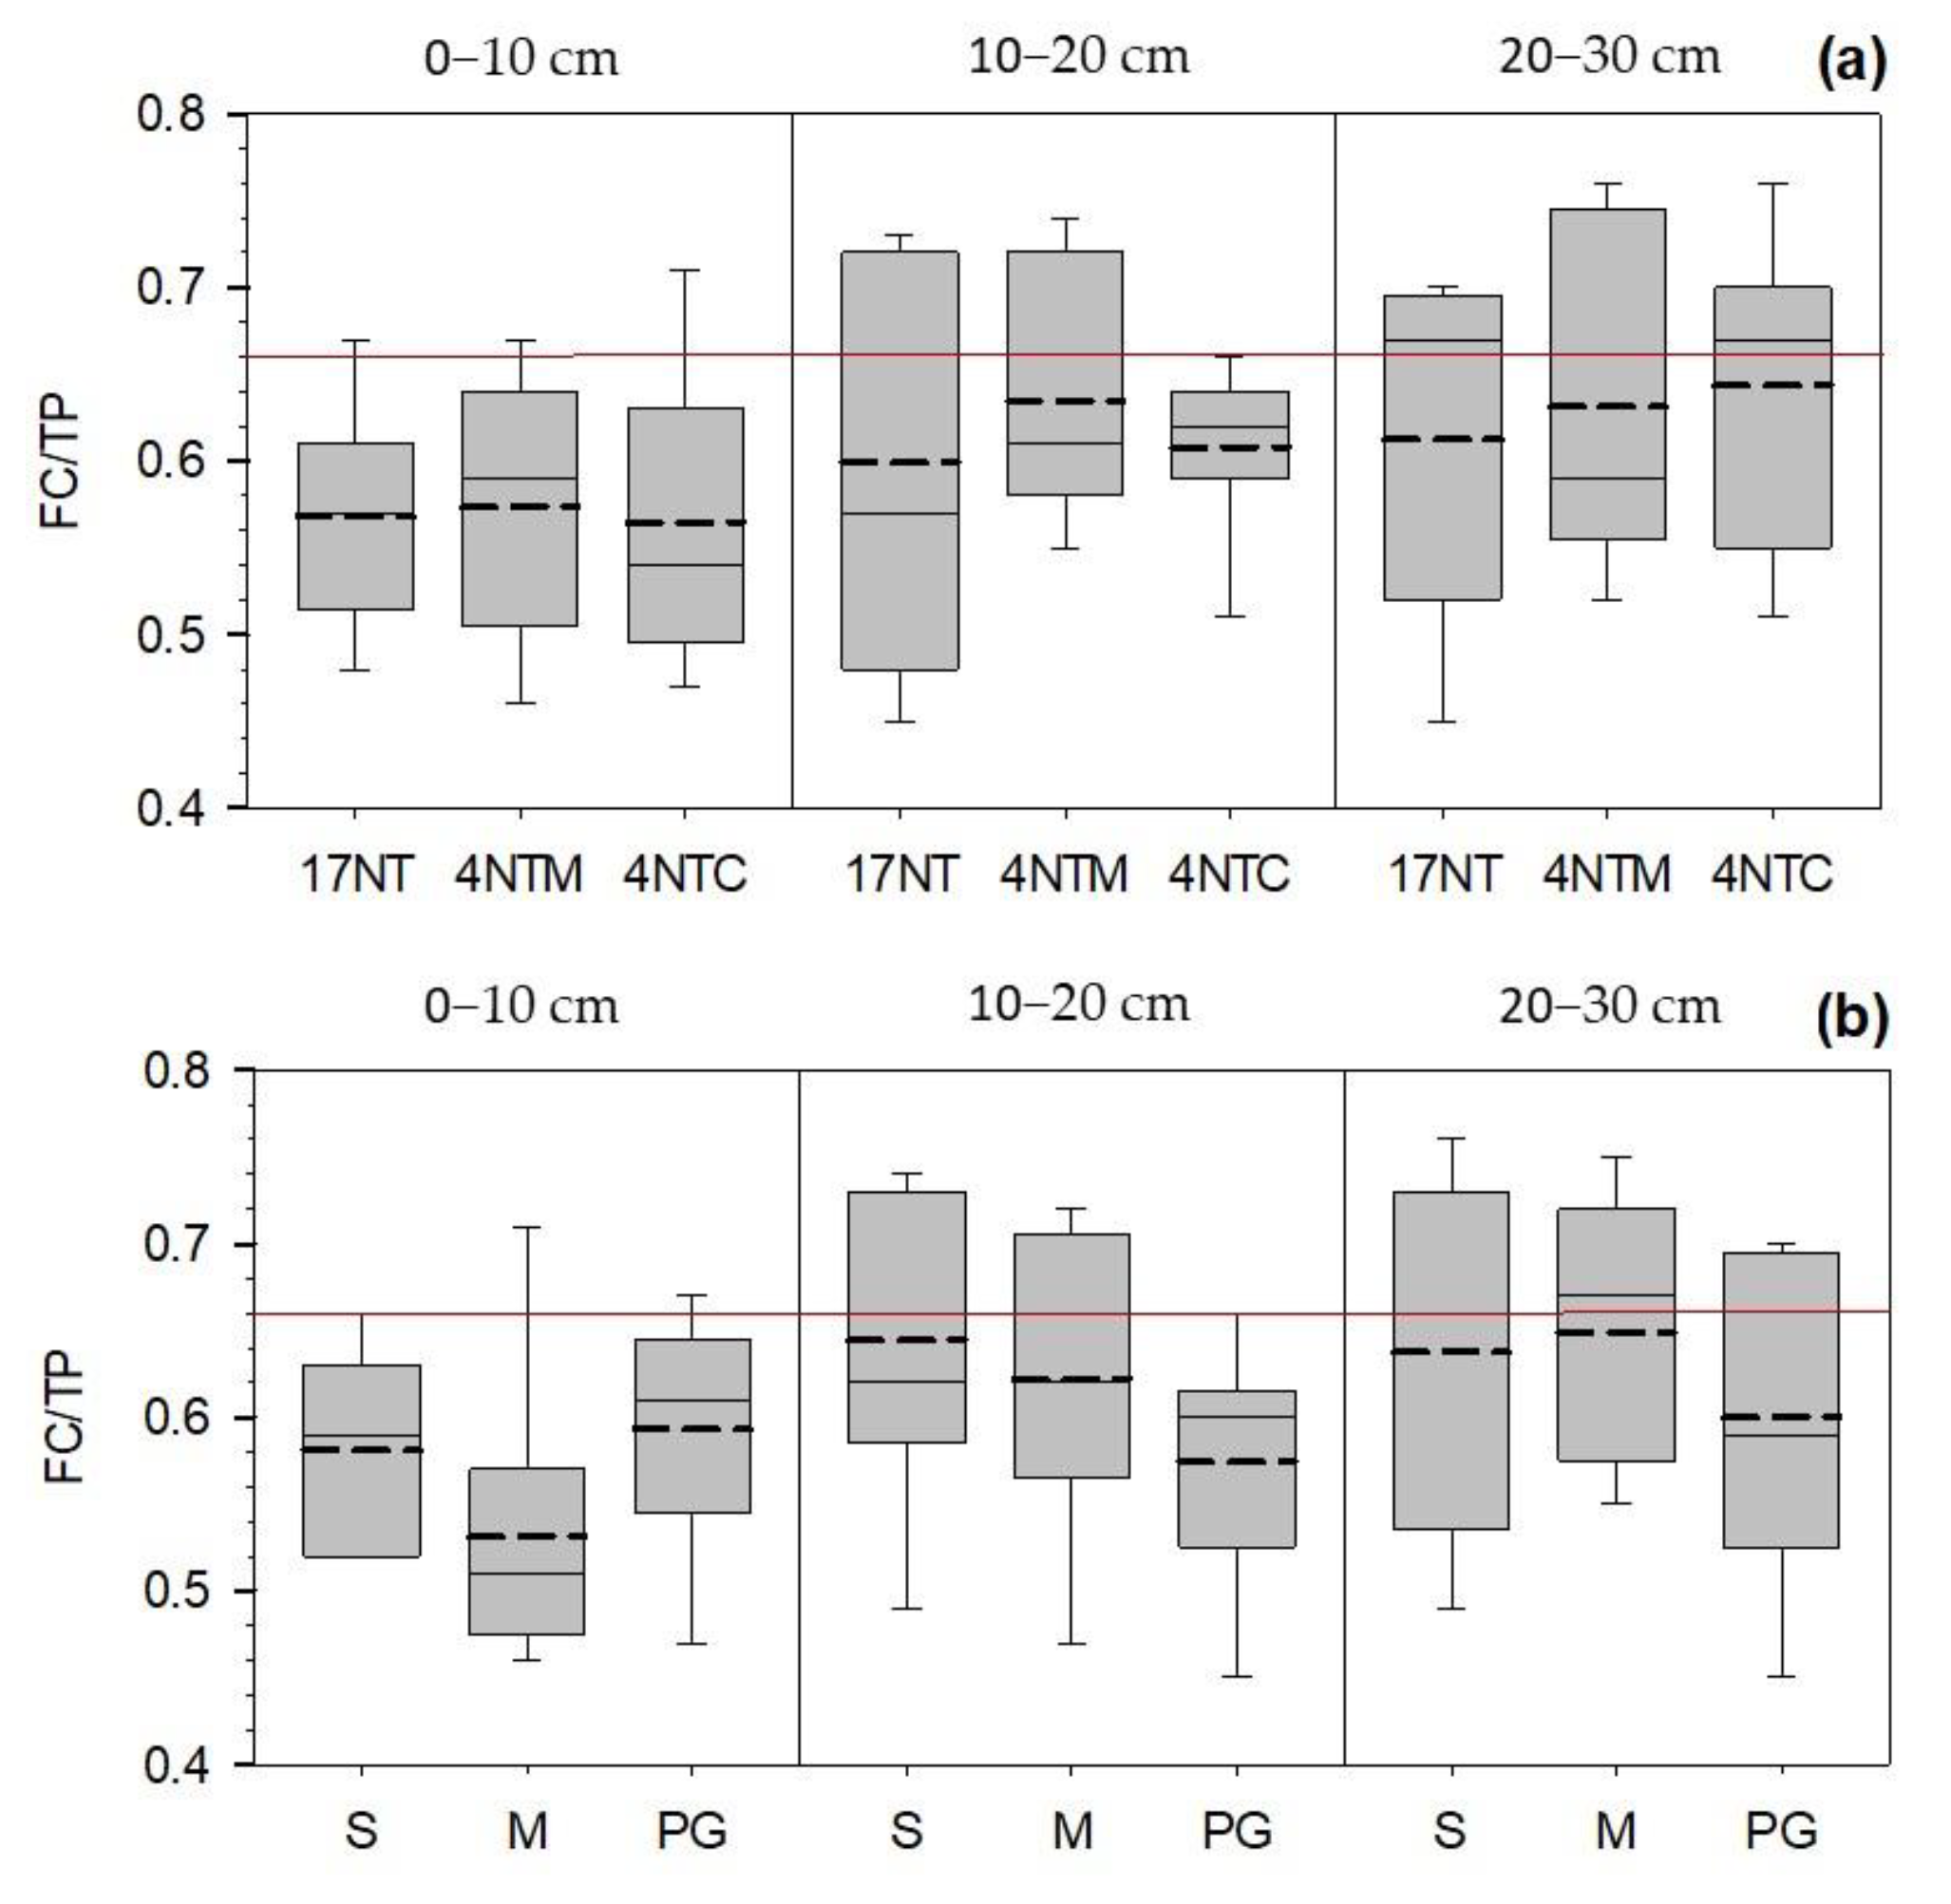
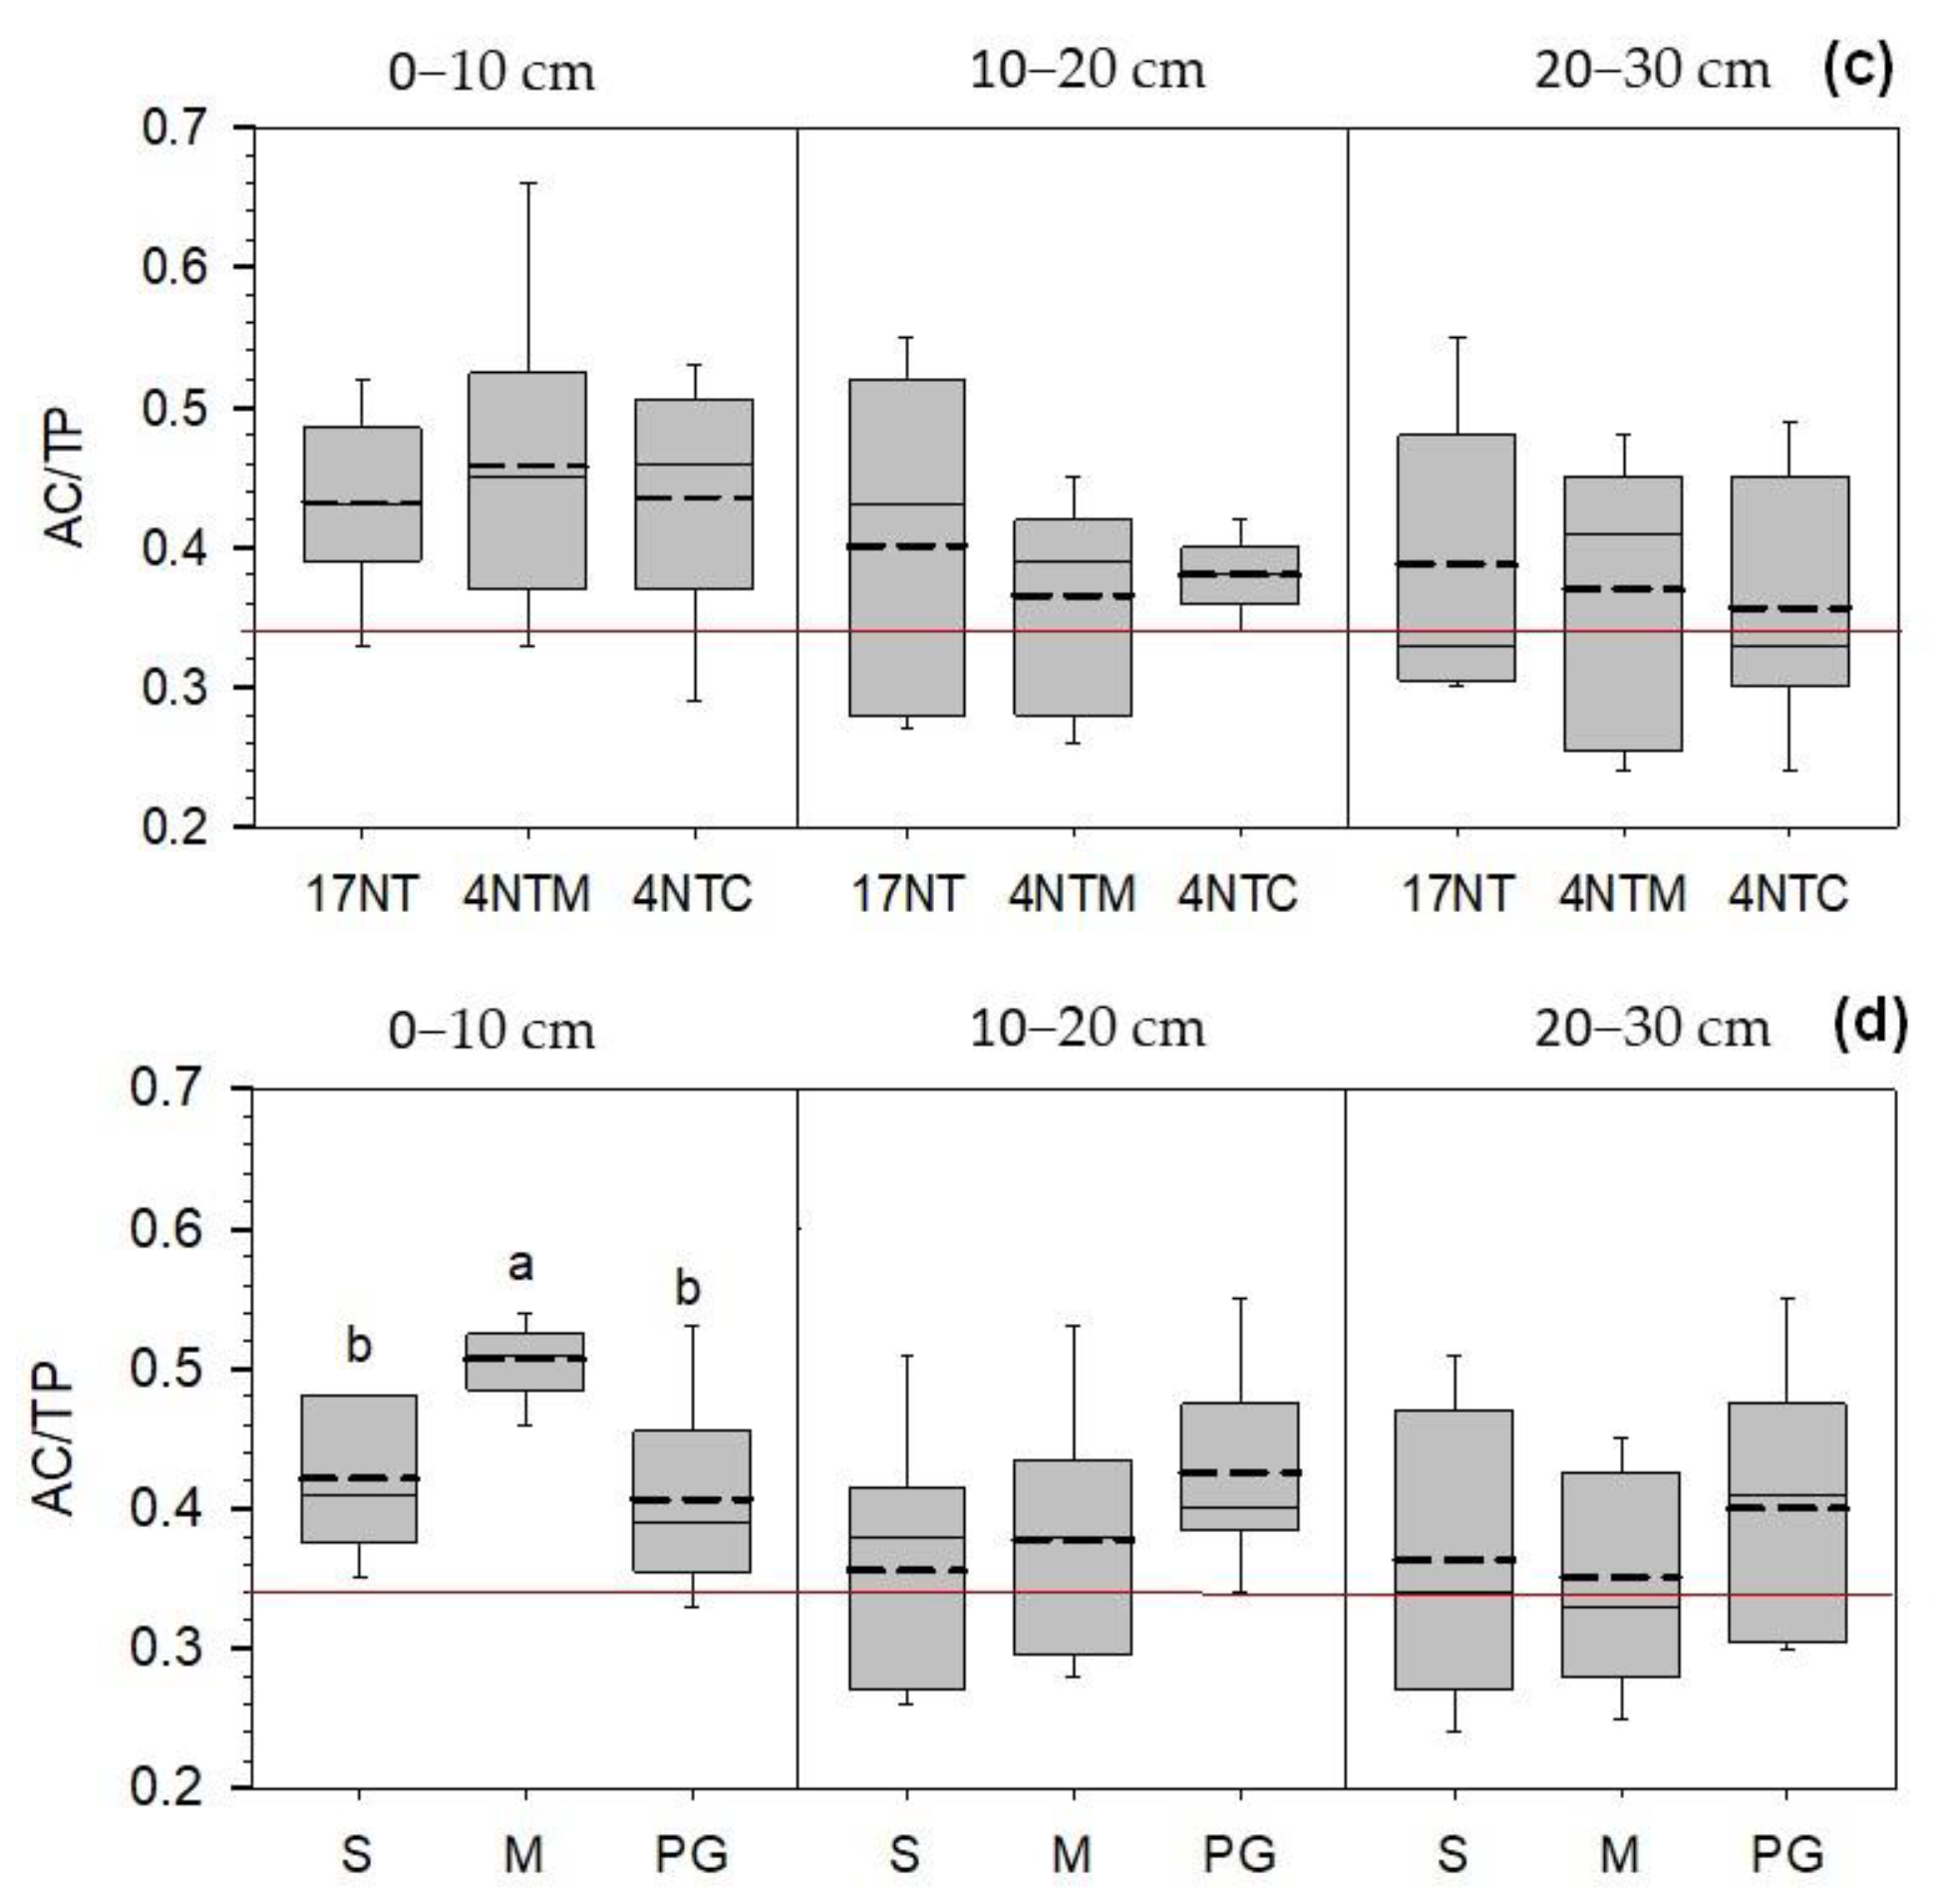
For the storage capacity of water (FC/TP) and storage capacity of air (AC/TP), no significant differences (p > 0.05) were observed for tillage systems (Figure 3), in agreement with the results of the physical–hydric properties presented before (Table 2). Overall, all treatments presented FC/TP mean values below 0.66, a value considered optimal for good soil physical quality, according to Reynolds et al. [26], at all investigated depths (Figure 3). The AC/TP showed a significant difference among crops (p < 0.01) in the surface soil layer (Figure 3d), with lower values for palisade grass and soybean. All treatments showed average values of AC/TP higher than the optimal value of 0.34 [26] (Figure 3).

3.2. Field Measurement of the Soil Structure Using the VESS

The visual evaluation of soil structure (VESS) revealed significant interaction (p < 0.01) between soil tillage and crops (Table 3), differently from the physical–hydric properties results presented before. In the 17NT, the palisade grass showed lower structural quality scores (Sq = 2.00-intact), while 4NTM had the highest value (Sq = 2.64-firm) (Table 3). Comparing crop treatments, palisade grass under 17NT showed a lower score (Sq = 2.00) and differed statistically from soybean (Sq = 2.65) and maize (Sq = 2.50) (Table 3). For 4NTM, soybean had a lower Sq score (Sq = 2.22), which was not significantly different from palisade grass (Sq = 2.64) but was different from maize (Sq = 2.69). Despite the statistical differences, the results show that all treatments were below Sq = 3, from which soil structural quality begins to decline [29].

3.3. Root Dry Biomass of Soybean, Maize, and Palisade Grass

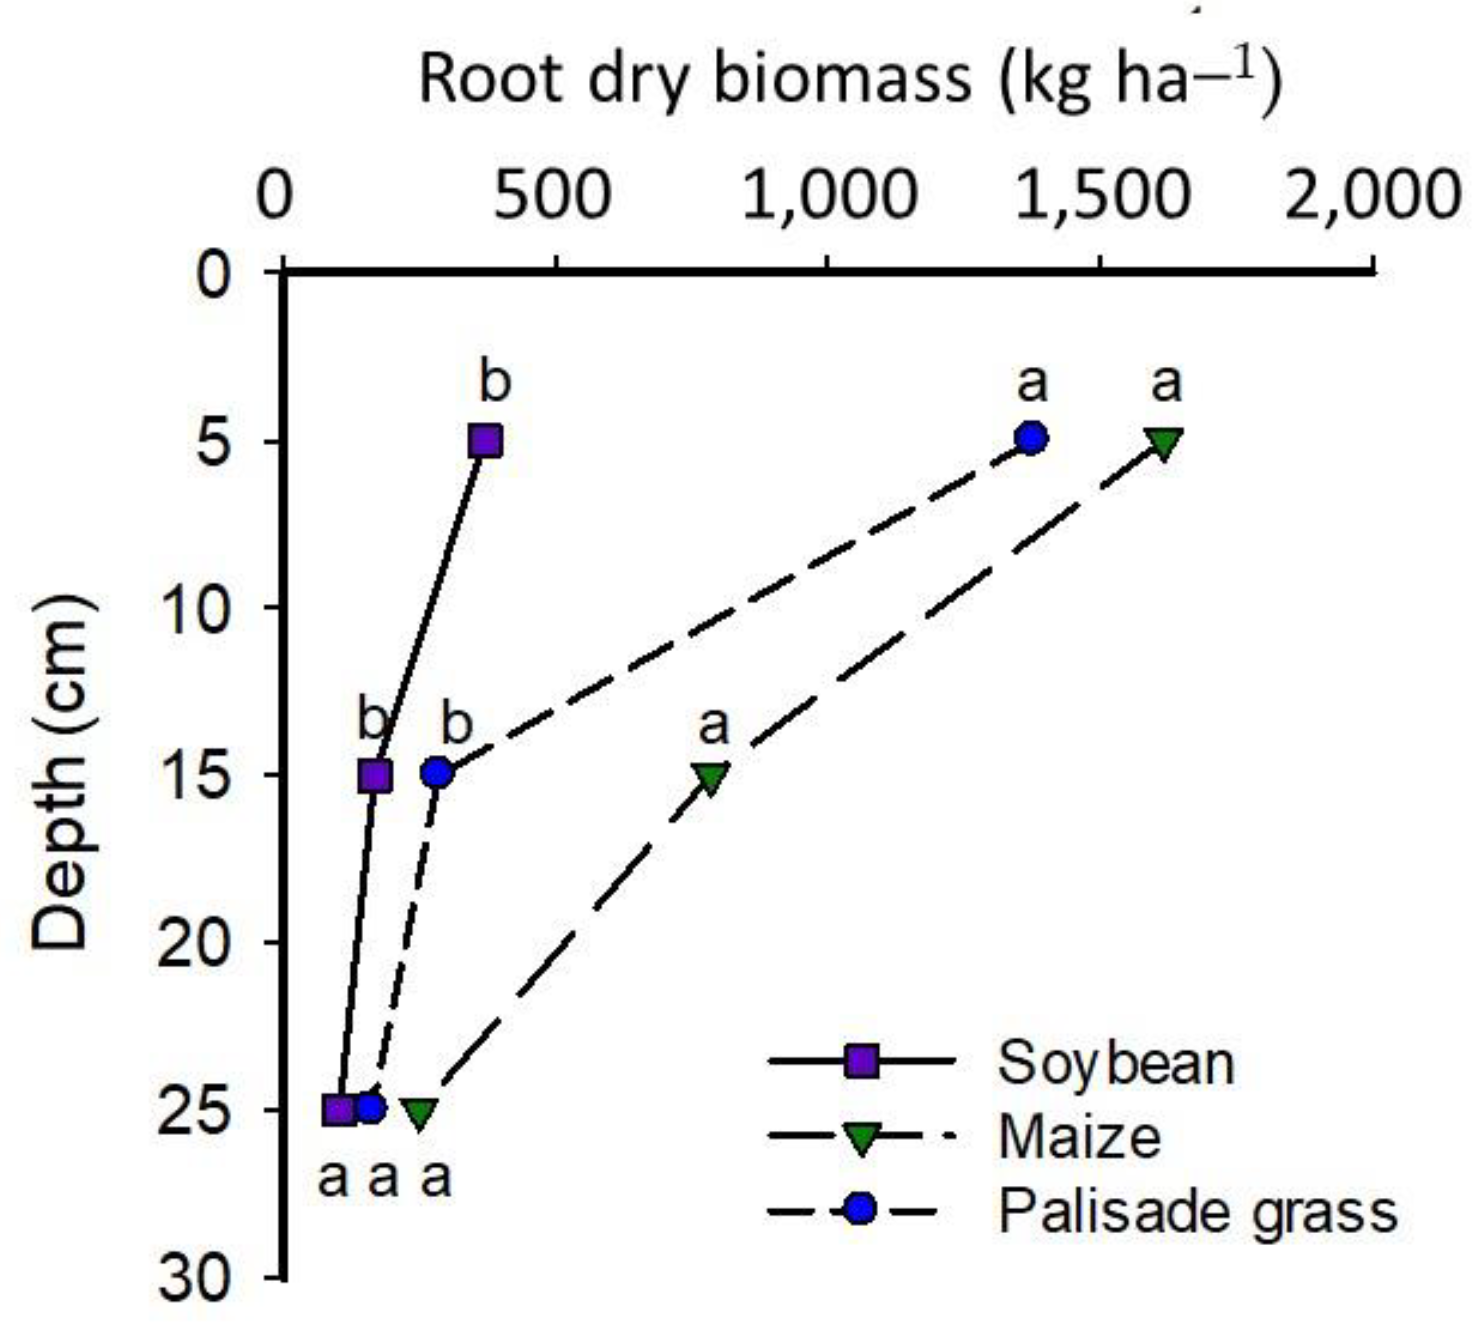
There were no significant differences between soil tillage treatments on root dry biomass (p > 0.05). Crops showed significant differences at the 0–10 cm and 10–20 cm layer depth (p < 0.01) but no differences for the 20–30 cm (Figure 4). Maize and palisade grass showed significantly higher root dry biomass at the 0–10 cm soil layer (i.e., 1617 and 1376 kg ha−1, respectively) than soybean (370 kg ha−1) (Figure 4), which may be associated with the fibrous root system of maize and palisade grass and the taproot for soybean. At the 10–20 cm soil layer, maize presented the highest root dry biomass (786 kg ha−1) and differed statistically from soybean and palisade grass. It is important to report that the root system of palisade grass was sampled 105 days after sowing, while 149 and 144 days, respectively, for soybean and maize. Palisade grass had to be reseeded in late December/2017 because of low germination in the first sowing due to a water deficit, remaining 40 days less than the other crops.
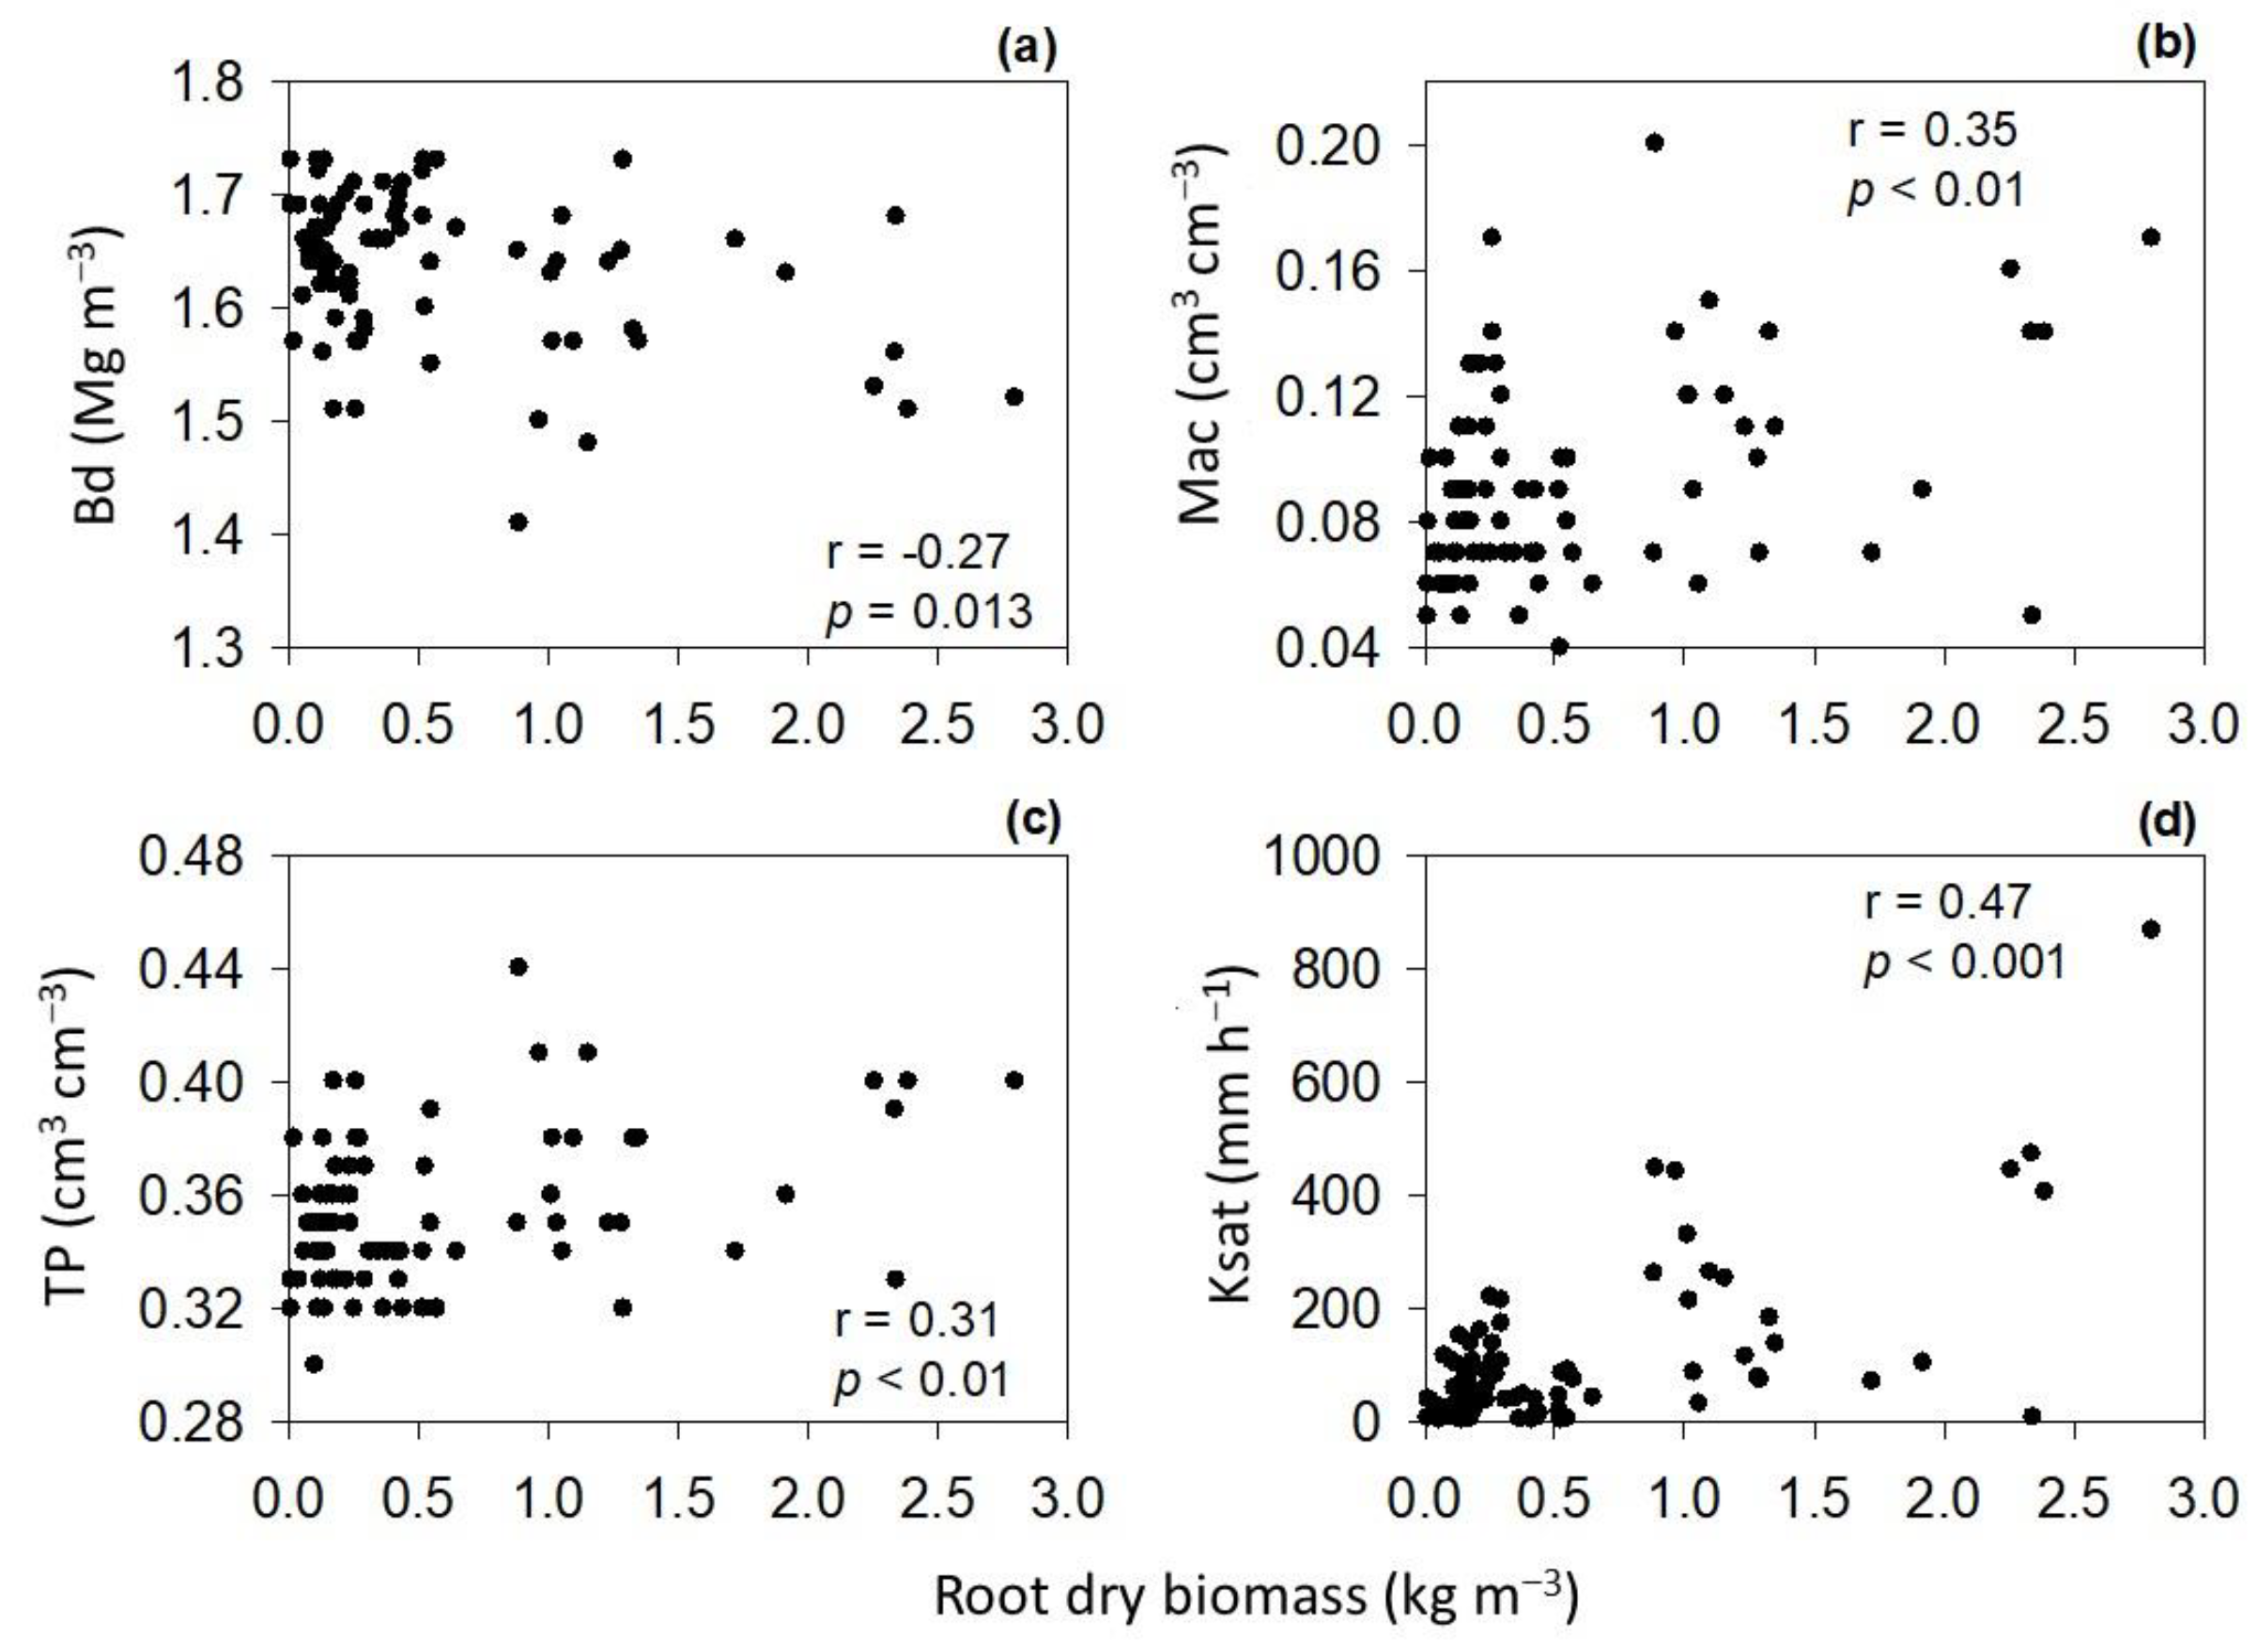
The root dry biomass was positively correlated with Ksat (r = 0.47; p < 0.001), macroporosity (r = 0.35; p < 0.01), and total porosity (r = 0.31; p < 0.01), and negatively correlated with bulk density (r = −0.27; p = 0.013) (Figure 5). The correlation coefficient was moderate (r = 0.40 to 0.69) to Ksat and weak (r = 0.10 to 0.39) to macroporosity, total porosity, and bulk density, based on Mukaka [33] and Schober et al. [34].

4. Discussion

There were no significant effects of soil tillage and crops (except to microporosity at a 10–20 cm depth) on soil physical–hydric properties, such as bulk density (Bd), macroporosity (Mac), total porosity (TP), and saturated hydraulic conductivity (Ksat) at all depths. Therefore, 4 years of NT after 13 years of soil tillage—minimum tillage (4NTM) and conventional tillage (4NTC) present soil physical–hydric properties similar to continuous NT for 17 years in this loamy soil. A gap in our study is the absence of temporal data regarding the no-tillage along the 4 years after 13 years of minimum and conventional tillage because this monitoring could show us the time of soil consolidation after tillage.
Chiseling a Ferralic Nitisol under NT was able to reduce soil compaction, and this effect lasted for 12 to 24 months, depending on depth [35]. Similar to our results and from Nunes et al. [35], Reichert et al. [36] found a short-term effect of chiseling tillage that remained for two years in NT. They found no differences in bulk density and total porosity in comparison to 13 years of continuous NT on a sandy clay loam due to faster soil reconsolidation in sandier soil.
Using the equation (Bdcritical = −0.00071 × clay + 1.8618) proposed by Reichert et al. [37], we obtained critical Bd values that restrict root elongation or yield a decrease of 1.69 and 1.67 Mg m−3, according to the clay content of 24.7 and 27.8%, respectively, to the 0–10 and 10–20 cm soil layer. Based on the Bd corresponding to Mac = 0.10 m3 m−3 obtained from the equation generated via the regression analysis between Bd and Mac (Mac = −0.357 Bd + 0.670; R2 = 0.66; Figure 2), we found a Bd = 1.60 Mg m−3 value slightly superior to 1.52 Mg m−3 and a value of Bd corresponding to Mac = 0.10 m3 m−3 for loam and clay loam textural soils obtained by Suzuki et al. [21].
Our Bd value of 1.60 Mg m−3 is critical to soil aeration, while larger values, such as 1.67 Mg m−3 (obtained using the equation proposed by Reichert et al. [37]), may limit root elongation and crop yield. The 10–30 cm soil layer reached critical values of Bd larger than 1.60 Mg m−3 (Table 2), indicating that there may be a restriction of soil aeration for plant growth, corroborating with the macroporosity < 0.10 m3 m−3. Additionally, despite statistically not being different, the Ksat decreases according to deeper soil layers, especially in the 20–30 cm region, which corroborates with the smaller macroporosity, responsible for water flow, and increase in bulk density. According to Schlüter et al. [38], the Ksat is controlled by pore size—mainly macropores and their abundance and connectivity.
Hydraulic conductivity (Ksat) is characterized as a property with large variability, ranging with a wide coefficient of variation [39,40,41], as observed in our study, with values ranging between 35 and 99% (Table 2), values considered very high (larger than 30%) according to Pimentel-Gomes and Garcia [30]. This large variability may result in no significant differences between treatments, even with large differences in the mean value. Nevertheless, no significant differences in treatments match with the other soil physical properties, such as porosity and bulk density, despite their lower coefficient of variation.
Although the surface soil layer (0 to 10 cm) does not present bulk density and macroporosity restrictive to root growth and crop yield, their values are close to them, with a relative bulk density (based on reference bulk density = 1.60 Mg m−3 as critical to soil aeration) between 96.88 and 100%. Generally, the lower bulk density and larger macroporosity in the surface layer are associated with the cutting disc or seeder rod in the row [21] since the furrower mechanisms may mobilize the entire soil surface layer when winter and soybean crops are introduced in the area [42]; to the larger organic carbon content and biopores formed in no-tillage [13]; and the soil depth limiting root growth due to soil compaction in no-tillage is around 8 to 15 cm [8]. When relative bulk density is larger than 100%, the macroporosity will be smaller than 0.10 m3 m−3, which is a critical air-filled porosity for plants. Additionally, the Ksat will decrease, as represented by the relationships between Ksat and Mac (Figure 2b).
The maximum production of crop-available nitrogen by mineralizing organic matter occurred when ~66% of the soil pore space was water-filled or when ~34% of the pore space was air-filled [43]. Our results indicate that the storage capacity of water (FC/TP) and the storage capacity of air (AC/TP) present similar structural conditions for soil tillage and crop (except in the 0 to 10 cm to AC/TP) treatments, corroborating the results obtained for other soil physical–hydric properties (bulk density, porosity, and saturated hydraulic conductivity), that are not statistically different between short- and long-term NT. The mean values of FC/TP and AC/TP remained, respectively, below and above the optimal limits of 0.66 (FC/TP) and 0.34 (AC/TP) proposed by Reynolds et al. [26], but the mean values of FC/TP and AC/TP from 10 to 30 cm were closer to the optimal limits, while the physical–hydric properties (bulk density and macroporosity) presented before, evidenced soil compaction below a 10 cm depth.
The treatment palisade grass presented significant differences in soil tillage (4NTM-Sq 2.64 > 4NTC-Sq 2.42 > 17NT-Sq 2.00), while for soybean and maize the visual evaluation of soil structure (VESS) indicated that soil tillage treatments are not statistically different between a long-term (17 continuous years) and short-term (4 years) NT, regardless of previous soil mobilization, in accordance with the other soil physical–hydric properties previously discussed. Crops differed in the 17NT and 4NTM, with maize having the larger soil structure score, respectively, 2.50 and 2.69. Despite some significant differences (tillage and crops), generally, the treatments presented an acceptable soil structure quality (Sq < 3) [28]. Different from the previous physical–hydric property results that showed soil compaction below a 10 cm depth and critical values (i.e., bulk density, macroporosity, FC/TP, and AC/TP) for plants, the visual evaluation of soil structure (VESS) revealed an adequate soil structure, but it is important to consider that the VESS was performed with a block soil sample collected from a 0–25 cm depth, which means no stratification of the soil layers. Munkholm et al. [44] reported an agreement between quantitative soil measurements and the VESS on the effects of tillage practices.
We expected the influence of palisade grass roots, creating different sizes of continuous biopores and improving soil structure, as a potential crop to be included in a crop rotation system, but until now, we have not observed a significative influence in the physical–hydric properties of the soil, perhaps due to the short time (cycle of 105 days) since it was included in the experiment and the soil sampling (spring/summer 2017 to March-2018), while soybean and maize remained, respectively, 149 and 144 days after sowing. Those statements imply the need for further studies related to crops, especially the palisade grass.
In agreement with our expectations and in disagreement with our results until now regarding palisade grass, the literature reports that the root system of cover crops contributes to increasing soil porosity and decreasing soil resistance to penetration in the subsurface layers [1,45,46]. In NT, channels formed by root decay and other biological activities create long and continuous porosity [47,48] that connects the soil surface with deeper layers, improving root colonization in these pores [46]. Calonego et al. [45] verified that palisade grass intercropped with maize for two years improved the soil’s physical and structural properties in the 20 to 40 cm layer through the least-limiting water range. Bertollo et al. [1] found higher soybean root density and root dry biomass, respectively, in 0 to 50 cm and 0 to 40 cm in areas where ruzigrass (Brachiaria ruziziensis R. Germ. and Evrard) had been previously grown during a 2-year period, under compacted NT. The results show the potential of grasses in structuring soil in deeper layers.
The soybean, maize, and palisade grass roots dry biomass concentrated in the surface soil layer (0 to 10 cm), in agreement with the results of several authors [49,50,51,52] and in accordance with the better soil physical–hydric conditions in this soil layer as previously shown, but maize and palisade grass had the larger and significant root biomass in the surface. Silva et al. [53] evaluated the distribution of maize roots in 0 to 40 cm and found that ~80% of roots concentrated within the shallower 20 cm. However, the remaining 20% of maize roots below the 20 cm depth could significantly contribute to biopore formation below this layer over time since it had less effect from mechanical implements, tire pressure, and animal trampling.
Although crops (soybean, maize, and palisade grass) do not show significative statistical influence in quantitative soil physical–hydric properties (bulk density, porosity, hydraulic conductivity, FC/TP, and AC/TP), our study suggests that growing maize in a crop rotation with soybean, rotating grasses, and legumes, may have a potentially greater impact on soil structure stabilization conditioned by its voluminous root system, including subsurface layers (below a 10 cm depth), since maize presented the highest root dry biomass (786 kg ha−1) at the 10 to 20 cm soil layer, and differed statistically from soybean and palisade grass, showing that the roots of maize are less sensitive to soil compaction considering the critical values of bulk density, macroporosity, FC/TP, and AC/TP below a 10 cm depth. On the other hand, palisade grass looks like it has potential to be included in a crop rotation system, especially rotating with legumes, alternating different characteristics of root and relation carbon/nitrogen, for example, but further studies are necessary since it had a smaller cycle until sampling (105 days after sowing) compared to the maize (144 days after sowing), being necessary to elucidate if the smaller root dry biomass of palisade grass below a 10 cm depth is due to a smaller cycle until harvesting or restriction associated with soil compaction, reported by the critical bulk density and macroporosity values. These crops can provide significant soil improvements, especially in terms of physical properties, the root dry biomass input, and the accumulation of organic matter [54], with benefits to the sustainability of the system. The previous cultivation with palisade grass and the use of soil chemical correctives reduced the soil compaction effects on the soybean growth and grain yield in a greenhouse experiment [55], while the dry matter of palisade grass was reduced by high compaction (bulk density = 1.62 Mg m−3) but its growth was not inhibited by medium compaction (bulk density = 1.57 Mg m−3), in an Oxisol with 752 g kg−1 of sand [56].
In NT, it is essential to maintain crops with different root characteristics in order to intensify the positive effects of crop rotation on soil physical–hydric properties. Calonego and Rosolem [54] point out that important benefits have been observed in soil structure in the medium and long term with cover crop species with extensive and vigorous root systems, with the ability to grow through high-resistance soil layers, increasing organic matter content, and stabilizing soil aggregates. Nouri et al. [57] reported that maize in rotation with soybean and cotton resulted in more favorable structural conditions and consequently increased cotton and soybean yields under NT. Similar to maize, palisade grass is a potential crop to produce the root dry biomass (Figure 4), especially in the 0 to 10 cm soil layer, even though this crop was sown ~40 days after soybean and maize.
Despite macroporosity being smaller than 0.10 m3 m−3 and bulk density larger than 1.60 Mg m−3 below the 10 cm depth, indicating critical values of air-filled porosity, the Ksat in the 0.10 m3 m−3—macroporosity was high to palisade grass and maize, respectively, 76 and 91 mm h−1, compared to 57 mm h−1 with soybean, evidencing the possible positive effect of biopores formed by root decomposition. Plant roots play an important role in soil-saturated hydraulic conductivity [41]. The root dry biomass was positively correlated with the Ksat (r = 0.47; p < 0.001), macroporosity (r = 0.35; p < 0.01), and total porosity (r = 0.31; p < 0.01), reinforcing positive effects of the root system in improving soil structure and water and air flow. This result is supported by other studies on the correlations between the Ksat and other root characteristics [41,58]. According to Zhu et al. [41], this positive correlation can be attributed to root growth and decomposition, forming larger and connected pores. In addition, roots can increase soil porosity by bonding soil particles, releasing exudates, and increasing organic matter content through their decomposition. Since soil mobilizations were not carried out over 4 years on 4NTM and 4NTC treatments, nor for 17 years on the 17NT treatment, correlations may be attributed to root biopore formation [13,48,59] and the natural soil reconsolidation [36]. We also observed a negative correlation between the root dry biomass and bulk density (r = −0.27; p = 0.013), evidencing that soil compaction may limit root growth and the sustainability of the system.

5. Conclusions

Short-term no-tillage (NT), i.e., 4 years of NT after receiving 13 years of minimum (4NTM) or conventional tillage (4NTC), has no statistical difference in soil physical–hydric properties (such as bulk density, porosity, saturated hydraulic conductivity, and storage capacity of water and air) compared to continuous long-term NT for 17 years in a loamy textural class soil, confirming our hypothesis that a 4-year period under NT would present similar soil physical–hydric properties previously modified by long-term tillage practices, which means that four years of NT reached structural stability similar to continuous NT during 17 years.
Below the 10 cm depth, soil tillage and cropping systems presented restrictions related to soil compaction, based on macroporosity < 0.10 m3 m−3 and bulk density > 1.60 Mg m−3–values from which there can be a restriction to adequate soil aeration to the plants. However, despite no significant effects of crops (soybean, maize, and palisade grass) in the soil physical–hydric properties, the roots of maize seem to be less sensitive to soil compaction, and the biopores formed by its root decomposition in the compacted layer may contribute to improve hydraulic conductivity. This information is important when considering a crop rotation system, including plants less sensitive to soil compaction. Despite no significant impact on soil structure in just one crop cycle, further studies are necessary to verify the possible potential of palisade grass to be included in a crop rotation system.
The soil’s physical–hydric properties (such as bulk density, macroporosity, saturated hydraulic conductivity, and storage capacity of water and air) were more sensitive than the visual evaluation of soil structure to identify soil compaction, evidenced below the 10 cm depth. This statement may be because the visual evaluation of soil structure was performed with no stratification of the soil layers (0 to 25 cm depth), which may have hidden the soil compaction layer.

Author Contributions

Conceptualization, T.S.d.S. and R.L.; methodology, T.S.d.S., L.E.A.S.S., C.A.T., M.R.S., M.M. and R.L.; formal analysis, T.S.d.S., L.E.A.S.S., C.A.T., M.R.S., M.M. and R.L.; investigation, T.S.d.S., L.E.A.S.S., C.A.T., M.R.S., M.M. and R.L.; resources, T.S.d.S. and R.L.; data curation, T.S.d.S.; writing—original draft preparation, T.S.d.S. and R.L.; writing—review and editing, L.E.A.S.S., C.A.T., M.R.S. and M.M.; project administration, R.L.; funding acquisition, T.S.d.S. and R.L. All authors have read and agreed to the published version of the manuscript.

Funding

This research was funded by the AGRISUS Foundation—Sustainable Agriculture, grant number PA no. 2031/17. Brazilian National Council for Scientific and Technological Development (CNPq) through grant no. 147031/2016-8 (Ph.D. scholarship).

Institutional Review Board Statement

Not applicable.

Informed Consent Statement

Informed consent was obtained from all subjects involved in the study.

Data Availability Statement

Data are available upon request from the authors.

Acknowledgments

We thank Leonardo Fortes, Sofia Teichmann, Lucas Zulpo, Nelson Vuaden, and Artur Fiegenbaum for helping with laboratory measurements and field sampling. Tiago S. Silva would like to acknowledge the financial support provided by the Brazilian National Council for Scientific and Technological Development (CNPq) through grant no. 147031/2016-8 (Ph.D. scholarship) and the AGRISUS Foundation—Sustainable Agriculture (PA no. 2031/17). Cássio A. Tormena would like to thank CNPq for the research grant.

Conflicts of Interest

The authors declare no conflict of interest.

References

  1. Awe, G.O.; Reichert, J.M.; Fontanela, E. Sugarcane production in the subtropics: Seasonal changes in soil properties and crop yield in no-tillage, inverting and minimum tillage. Soil Tillage Res. 2020, 196, e104447. [Google Scholar] [CrossRef]
  2. Blanco-Canqui, H.; Mikha, M.M.; Presley, D.R.; Claassen, M.M. Addition of cover crops enhances no-till potential for improving soil physical properties. Soil Sci. Soc. Am. J. 2011, 75, 1471–1482. [Google Scholar] [CrossRef]
  3. Blanco-Canqui, H.; Ruis, S.J. No-tillage and soil physical environment. Geoderma 2018, 326, 164–200. [Google Scholar] [CrossRef]
  4. Carneiro, C.E.A.; Melém Júnior, N.J.; de Azevedo, M.C.B.; Andrade, E.A.; Koguishi, M.S.; Diehl, R.C.; Ricce, W.S.; Passarin, A.L.; Vaz, R.H.M.; Stelmachuk, T.L.L.; et al. Efeitos dos sistemas de manejo sobre o carbono orgânico total e carbono residual de um latossolo vermelho eutroférrico. Semin. Ciências Agrárias 2009, 30, 5–10. Available online: https://www.redalyc.org/pdf/4457/445744091001.pdf (accessed on 12 November 2023). [CrossRef]
  5. Hobson, D.; Harty, M.; Tracy, S.R.; McDonnell, K. The effect of tillage depth and traffic management on soil properties and root development during two growth stages of winter wheat (Triticum aestivum L.). Soil 2022, 8, 391–408. [Google Scholar] [CrossRef]
  6. Nunes, M.R.; Karlen, D.L.; Moorman, T.B. Tillage intensity effects on soil structure indicators—A US meta-analysis. Sustainability 2020, 12, 2071. [Google Scholar] [CrossRef]
  7. Pires, L.F.; Borges, J.A.R.; Rosa, J.A.; Cooper, M.; Heck, R.J.; Passoni, S.; Roque, W.L. Soil structure changes induced by tillage systems. Soil Tillage Res. 2017, 165, 66–79. [Google Scholar] [CrossRef]
  8. Reichert, J.M.; Suzuki, L.E.A.S.; Reinert, D.J. Compactação do solo em sistemas agropecuários e florestais: Identificação, efeitos, limites críticos e mitigação. In Tópicos em Ciência do Solo; Ceretta, C.A., Silva, L.S., Reichert, J.M., Eds.; Sociedade Brasileira de Ciência do Solo: Viçosa, Brazil, 2007; pp. 49–134. Available online: http://fisicadosolo.ccr.ufsm.quoos.com.br/downloads/Producao_Artigos/2007_Topicos.pdf (accessed on 12 November 2023).
  9. Kassam, A.; Friedrich, T.; Derpsch, R.; Kienzle, J. Overview of the worldwide spread of conservation agriculture. Field Actions Science Reports. J. Field Actions 2015, 8, 1–12. [Google Scholar]
  10. Reichert, J.M.; da Rosa, V.T.; Vogelmann, E.S.; da Rosa, D.P.; Horn, R.; Reinert, D.J.; Sattler, A.; Denardin, J.E. Conceptual framework for capacity and intensity physical soil properties affected by short and long-term (14 years) continuous no-tillage and controlled traffic. Soil Tillage Res. 2016, 158, 123–136. [Google Scholar] [CrossRef]
  11. Tian, M.; Qin, S.; Whalley, W.R.; Zhou, H.; Ren, T.; Gao, W. Changes of soil structure under different tillage management assessed by bulk density, penetrometer resistance, water retention curve, least limiting water range and X-ray computed tomography. Soil Tillage Res. 2022, 221, 105420. [Google Scholar] [CrossRef]
  12. Gao, W.; Hodgkinson, L.; Jin, K.; Watts, C.W.; Ashton, R.W.; Shen, J.; Ren, T.; Dodd, I.C.; Binley, A.; Phillips, A.L.; et al. Deep roots and soil structure. Plant Cell Environ. 2016, 39, 1662–1668. [Google Scholar] [CrossRef] [PubMed]
  13. Vizioli, B.; Cavalieri-Polizeli, K.M.V.; Tormena, C.A.; Barth, G. Effects of long-term tillage systems on soil physical quality and crop yield in a Brazilian Ferralsol. Soil Tillage Res. 2021, 209, 104935. [Google Scholar] [CrossRef]
  14. Franchini, J.C.; Debiasi, H.; Sacoman, A.; Nepomuceno, A.L.; Farias, J.R.B. Manejo do Solo Para Redução das Perdas de Produtividade Pela Seca; Documentos 314; Embrapa Soja: Londrina, Brazil, 2009; 39p. [Google Scholar]
  15. Pereira Neto, O.C.; Guimarães, M.F.; Ralisch, R.; Fonseca, I.C.B. Análise do tempo de consolidação do sistema de plantio direto. Rev. Bras. De Eng. Agrícola E Ambient. 2007, 11, 489–496. [Google Scholar] [CrossRef]
  16. Franchini, J.C.; Debiasi, H.; Balbinot, A.A., Jr.; Tonon, B.C.; Farias, J.R.B.; Oliveira, M.C.N.d.; Torres, E. Evolution of crop yields in different tillage and cropping systems over two decades in southern Brazil. Field Crops Res. 2012, 137, 178–185. [Google Scholar] [CrossRef]
  17. Martínez, I.; Chervet, A.; Weisskopf, P.; Sturny, W.G.; Rek, J.; Keller, T. Two decades of no-till in the Oberacker long-term field experiment: Part II. Soil porosity and gas transport parameters. Soil Tillage Res. 2016, 163, 130–140. [Google Scholar] [CrossRef]
  18. Hamamoto, S.; Moldrup, P.; Kawamoto, K.; Sakaki, T.; Nishimura, T.; Komatsu, T. Pore network structure linked by X-ray CT to particle characteristics and transport parameters. Soils Found. 2016, 56, 676–690. [Google Scholar] [CrossRef]
  19. Kuncoro, P.H.; Koga, K.; Satta, N.; Muto, Y. A study on the effect of compaction on transport properties of soil gas and water I: Relative gas diffusivity, air permeability, and saturated hydraulic conductivity. Soil Tillage Res. 2014, 143, 172–179. [Google Scholar] [CrossRef]
  20. Collares, G.L.; Reinert, D.J.; Reichert, J.M.; Kaiser, D.R. Compactação de um latossolo induzida pelo tráfego de máquinas e sua relação com o crescimento e produtividade de feijão e trigo. Rev. Bras. Cienc. Solo 2008, 32, 933–942. [Google Scholar] [CrossRef]
  21. Suzuki, L.E.A.S.; Reinert, D.J.; Alves, M.C.; Reichert, J.M. Critical limits for soybean and black bean root growth, based on macroporosity and penetrability, for soils with distinct texture and management systems. Sustainability 2022, 14, 2958. [Google Scholar] [CrossRef]
  22. Soil Survey Staff. Keys to Soil Taxonomy, 12th ed.; USDA—Natural Resources Conservation Service: Washington, DC, USA, 2014. Available online: https://www.nrcs.usda.gov/wps/portal/nrcs/detail/soils/survey/class/taxonomy/?cid=nrcs142p2_053580 (accessed on 8 December 2021).
  23. IUSS Working Group WRB. World Reference Base for Soil Resources 2014, Update 2015 International Soil Classification System for Naming Soils and Creating Legends for Soil Maps; World Soil Resources Reports No. 106; FAO: Rome, Italy, 2015. [Google Scholar]
  24. Santos, H.G.; Jacomine, P.K.T.; Anjos, L.H.; Oliveira, V.A.; Lumbreras, J.F.; Coelho, M.R.; Almeida, J.A.; Araujo Filho, J.C.; Oliveira, J.B.; Cunha, T.J.F. Sistema Brasileiro de Classificação de Solos; Embrapa: Brasília, Brazil, 2018; ISBN 9788570358004. Available online: https://ainfo.cnptia.embrapa.br/digital/bitstream/item/199517/1/SiBCS-2018-pdf (accessed on 5 October 2022).
  25. Bergamaschi, H.; Melo, R.W.; Guadagnin, M.R.; Cardoso, L.S.; Silva, M.I.G.; Comiran, F.; Dalsin, F.; Tessari, M.L.; Brauner, P.C. Boletins Agrometeorológicos da Estação Experimental Agronômica da UFRGS; Editora UFRGS: Porto Alegre, Brazil, 2013; 8p, Available online: https://www.ufrgs.br/agronomia/joomla/files/EEA/Srie_Meteorolgica_da_EEA-UFRGS.pdf (accessed on 1 September 2023).
  26. Reynolds, W.D.; Bowman, B.T.; Drury, C.F.; Tan, C.S.; Lu, X. Indicators of good soil physical quality: Density and storage parameters. Geoderma 2002, 110, 131–146. [Google Scholar] [CrossRef]
  27. Reynolds, W.D.; Elrick, D.E. Hydraulic conductivity of saturated soils, constant head method. In Methods of Soil Analyses; Part 4, Physical Methods; Book Series 5; Soil Science Society of America: Madison, WI, USA, 2002; pp. 694–700. [Google Scholar]
  28. Guimarães, R.M.L.; Ball, B.C.; Tormena, C.A. Improvements in the visual evaluation of soil structure. Soil Use Manag. 2011, 27, 395–403. [Google Scholar] [CrossRef]
  29. Ball, B.C.; Batey, T.; Munkholm, L.J. Field assessment of soil structural quality—A development of the Peerlkamp test. Soil Use Manag. 2007, 23, 329–337. [Google Scholar] [CrossRef]
  30. Pimentel-Gomes, F.; Garcia, C.H. Estatística Aplicada a Experimentos Agronômicos e Florestais: Exposição com Exemplos e Orientações Para Uso de Aplicativos; FEALQ: Piracicaba, Brazil, 2002; 309p. [Google Scholar]
  31. Grable, A.R.; Siemer, E.G. Effects of bulk density, aggregate size, and soil water suction on oxygen diffusion, redox potentials, and elongation of corn roots. Soil Sci. Soc. Am. J. 1968, 32, 180–186. [Google Scholar] [CrossRef]
  32. Ferreira, E.B.; Cavalcanti, P.P.; Nogueira, D.A. ExpDes: An R package for ANOVA and experimental designs. Appl. Math. 2014, 5, 2952. [Google Scholar] [CrossRef]
  33. Mukaka, M.M. Statistics Corner: A guide to appropriate use of correlation coefficient in medical research. Malawi Med. J. 2012, 24, 69–71. Available online: https://www.ncbi.nlm.nih.gov/pmc/articles/PMC3576830/pdf/MMJ2403-0069.pdf (accessed on 12 November 2023). [PubMed]
  34. Schober, P.; Boer, C.; Schwarte, L.A. Correlation coefficients: Appropriate use and interpretation. Anesth Analg. 2018, 126, 1763–1768. [Google Scholar] [CrossRef] [PubMed]
  35. Nunes, M.R.; Pauletto, E.A.; Denardin, J.E.; Suzuki, L.E.A.S.; van Es, H.M. Dynamic changes in compressive properties and crop response after chisel tillage in a highly weathered soil. Soil Tillage Res. 2019, 186, 183–190. [Google Scholar] [CrossRef]
  36. Reichert, J.M.; Brandt, A.A.; Rodrigues, M.F.; da Veiga, M.; Reinert, D.J. Is chiseling or inverting tillage required to improve mechanical and hydraulic properties of sandy clay loam soil under long-term no-tillage? Geoderma 2017, 301, 72–79. [Google Scholar] [CrossRef]
  37. Reichert, J.M.; Suzuki, L.E.A.S.; Reinert, D.J.; Horn, R.; Håkansson, I. Reference bulk density and critical degree-of-compactness for no-till crop production in subtropical highly weathered soils. Soil Tillage Res. 2009, 102, 242–254. [Google Scholar] [CrossRef]
  38. Schlüter, S.; Großmann, C.; Diel, J.; Wu, G.M.; Tischer, S.; Deubel, A.; Rücknagel, J. Long-term effects of conventional and reduced tillage on soil structure, soil ecological and soil hydraulic properties. Geoderma 2018, 332, 10–19. [Google Scholar] [CrossRef]
  39. Lopes, V.S.; Cardoso, I.M.; Fernandes, O.R.; Rocha, G.C.; Simas, F.N.B.; Moura, W.M.; Santana, F.C.; Veloso, G.V.; Luz, J.M.R. The establishment of a secondary forest in a degraded pasture to improve hydraulic properties of the soil. Soil Tillage Res. 2020, 198, 104538. [Google Scholar] [CrossRef]
  40. Silva, R.F.; Severiano, E.C.; Oliveira, G.C.; Barbosa, S.M.; Peixoto, D.S.; Tassinari, D.; Silva, B.M.; Silva, S.H.G.; Dias Júnior, M.S.; Figueiredo, T.A.F.R. Changes in soil profile hydraulic properties and porosity as affected by deep tillage soil preparation and Brachiaria grass intercropping in a recent coffee plantation on a naturally dense Inceptisol. Soil Tillage Res. 2021, 213, 105127. [Google Scholar] [CrossRef]
  41. Zhu, P.; Zhang, G.; Zhang, B. Soil saturated hydraulic conductivity of typical revegetated plants on steep gully slopes of Chinese Loess Plateau. Geoderma 2022, 412, 115717. [Google Scholar] [CrossRef]
  42. Genro Junior, S.A.; Reinert, D.J.; Reichert, J.M.; Albuquerque, J.A. Atributos físicos de um Latossolo Vermelho e produtividade de culturas cultivadas em sucessão e rotação. Ciência Rural 2009, 39, 65–73. [Google Scholar] [CrossRef]
  43. Skopp, J.; Jawson, M.D.; Doran, J.W. Steady-state aerobic microbial activity as a function of soil water content. Soil Sci. Soc. Am. J. 1990, 54, 1619–1625. [Google Scholar] [CrossRef]
  44. Munkholm, L.J.; Heck, R.J.; Deen, B. Long-term rotation and tillage effects on soil structure and crop yield. Soil Tillage Res. 2013, 127, 85–91. [Google Scholar] [CrossRef]
  45. Calonego, J.C.; Borghi, E.; Crusciol, C.A.C. Intervalo hídrico ótimo e compactação do solo com cultivo consorciado de milho e braquiária. Rev. Bras. Cienc. Solo 2011, 35, 2183–2190. [Google Scholar] [CrossRef]
  46. Williams, S.M.; Weil, R.R. Crop cover root channels may alleviate soil compaction effects on soybean crop. Soil Sci. Soc. Am. J. 2004, 68, 1403–1409. [Google Scholar] [CrossRef]
  47. Dörner, J.; Sandoval, P.; Dec, D. The role of soil structure on the pore functionality of an Ultisol. J. Soil Sci. Plant Nutr. 2010, 10, 495–508. [Google Scholar] [CrossRef]
  48. Moraes, M.T.d.; Debiasi, H.; Carlesso, R.; Franchini, J.C.; Silva, V.R.; Luz, F.B. Soil physical quality on tillage and cropping systems after two decades in the subtropical region of Brazil. Soil Tillage Res. 2016, 155, 351–362. [Google Scholar] [CrossRef]
  49. Beutler, A.N.; Centurion, J.F.; Silva, A.P.D.; Roque, C.G.; Ferraz, M.V. Compactação do solo e intervalo hídrico ótimo na produtividade de arroz de sequeiro. Pesq. Agropecu. Bras. 2004, 39, 575–580. [Google Scholar] [CrossRef]
  50. Dal Ferro, N.; Sartori, L.; Simonetti, G.; Berti, A.; Morari, F. Soil macro- and microstructure as affected by different tillage systems and their effects on maize root growth. Soil Tillage Res. 2014, 140, 55–65. [Google Scholar] [CrossRef]
  51. Fiorini, A.; Boselli, R.; Amaducci, S.; Tabaglio, V. Effects of no-till on root architecture and root-soil interactions in a three-year crop rotation. Eur. J. Agron. 2018, 99, 156–166. [Google Scholar] [CrossRef]
  52. Stumpf, L.; Pauletto, E.A.; Pinto, L.F.S. Soil aggregation and root growth of perennial grasses in a constructed clay minesoil. Soil Tillage Res. 2016, 161, 71–78. [Google Scholar] [CrossRef]
  53. Silva, V.R.; Reinert, D.J.; Reichert, J.M. Densidade do solo, atributos químicos e sistema radicular do milho afetados pelo pastejo e manejo do solo. Rev. Bras. Cienc. Solo 2000, 24, 191–199. [Google Scholar] [CrossRef]
  54. Calonego, J.C.; Rosolem, C.A. Estabilidade de agregados do solo após manejo com rotações de culturas e escarificação. Rev. Bras. Cienc. Solo 2008, 32, 1399–1407. [Google Scholar] [CrossRef]
  55. Souza, M.A.S.; Silva, D.R.G.; Ávila, F.W.; Faquin, V.; Oliveira, G.C.; Bastos, C.E.A. Previous cultivation of palisade grass and soil correctives: Influence on growth and yield of soybean cultivated under various soil compaction levels. Ciênc. Agrotec. 2011, 35, 1132–1140. Available online: https://www.scielo.br/j/cagro/a/GzWzYDwVFVdm3thjk4nfZMB/?format=pdf&lang=en (accessed on 12 November 2023). [CrossRef]
  56. Sousa Neto, E.L.; Pierangeli, M.A.P.; Lal, R. Compaction of an oxisol and chemical composition of palisadegrass. Rev. Bras. Cienc. Solo 2013, 37, 928–935. Available online: https://www.scielo.br/j/rbcs/a/FtsgtcrGKDktG5TpggMXcFG/?format=pdf&lang=en (accessed on 12 November 2023). [CrossRef]
  57. Nouri, A.; Lee, J.; Yin, X.; Tyler, D.D.; Saxton, A.M. Thirty-four years of no-tillage and cover crops improve soil quality and increase cotton yield in Alfisols, Southeastern USA. Geoderma 2019, 337, 998–1008. [Google Scholar] [CrossRef]
  58. Chen, J.; Wu, Z.; Zhao, T.; Yang, H.; Long, Q.; He, Y. Rotation crop root performance and its effect on soil hydraulic properties in a clayey Utisol. Soil Tillage Res. 2021, 213, 105136. [Google Scholar] [CrossRef]
  59. Calonego, J.C.; Raphael, J.P.A.; Rigon, J.P.G.; Oliveira Neto, L.d.; Rosolem, C.A. Soil compaction management and soybean yields with cover crops under no-till and occasional chiseling. Eur. J. Agron. 2017, 85, 31–37. [Google Scholar] [CrossRef]
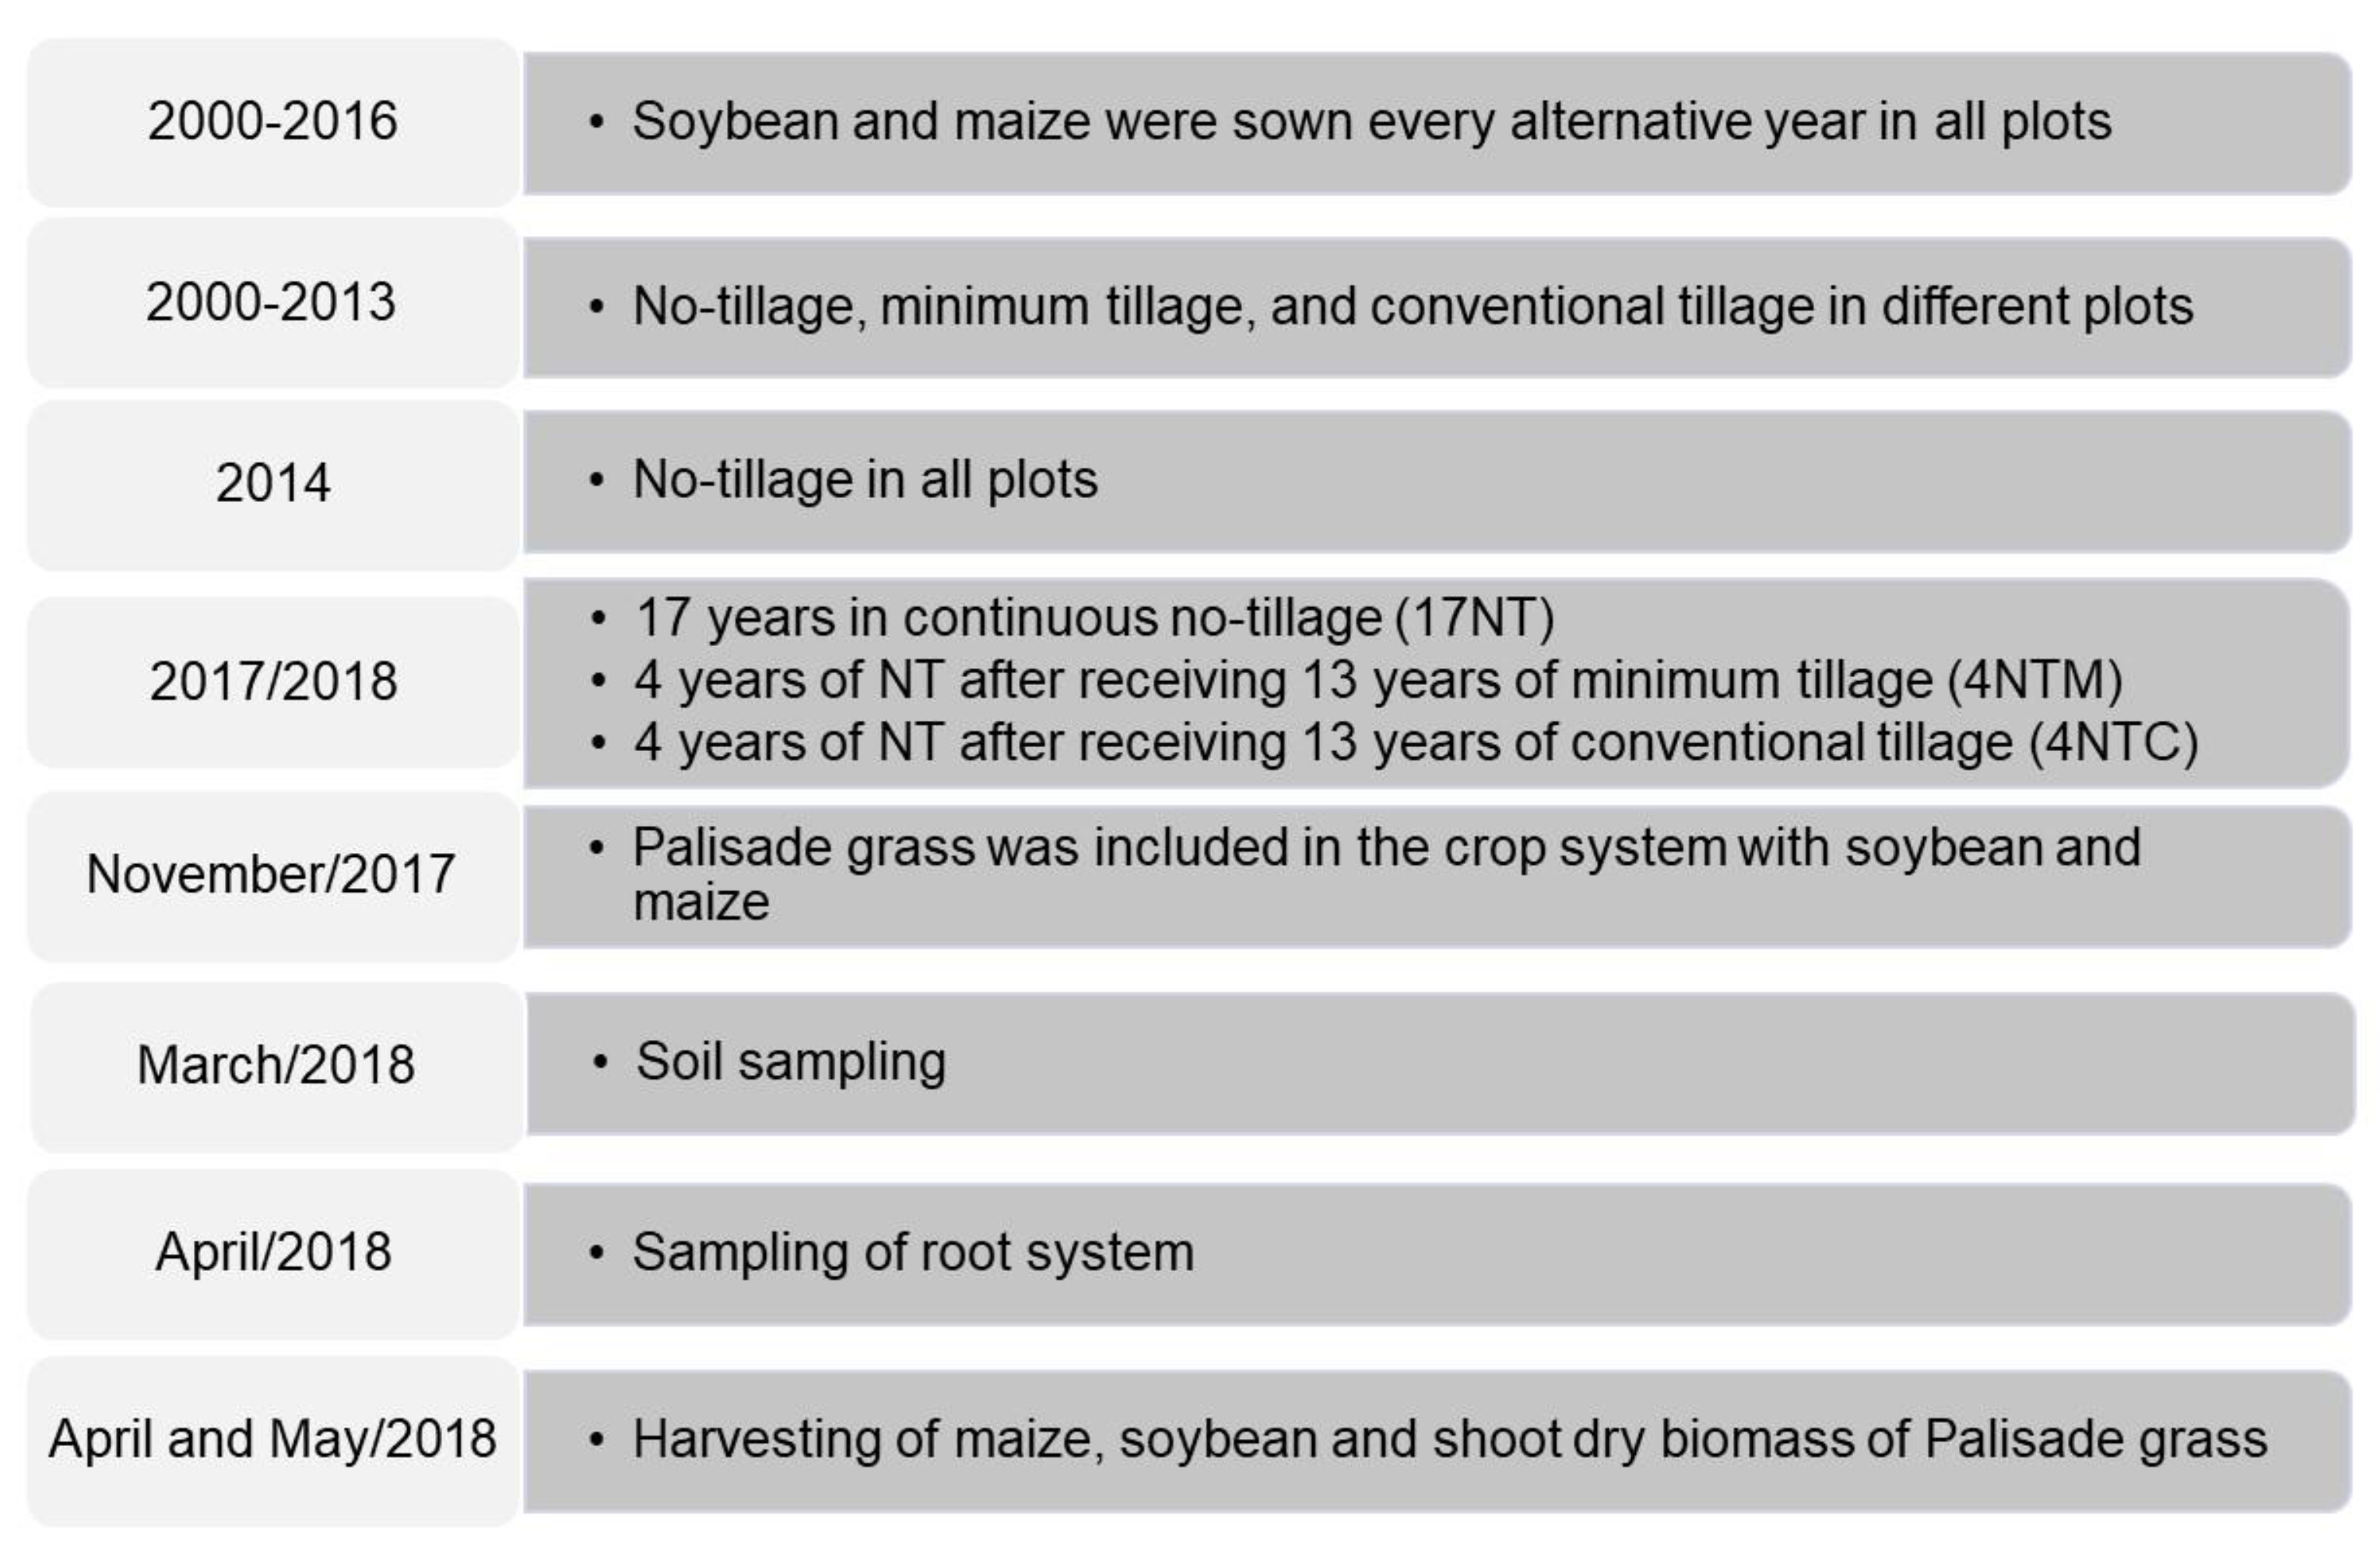
Figure 1. Timeline of the main events realized in the experiment.
Sustainability 15 15936 g001
Figure 2. Relationship between mean values of macroporosity and bulk density (a), and Ksat (saturated hydraulic conductivity) and macroporosity (b) for all treatments and soil layers investigated. Each point in Figure “(b)” is the replicate of each treatment.
Sustainability 15 15936 g002
Figure 3. Storage capacity of water (FC/TP) and air (AC/TP) for soil tillage (respectively, (a) and (c)) and cropping systems (respectively, (b) and (d)) in each soil layer. The dashed line is the mean value. The red line is the optimal value of good soil quality, according to Reynolds et al. [26]. 17NT: 17 years of continuous no-tillage; 4NTM: 4 years of no-tillage after receiving 13 years of minimum tillage; 4NTC: 4 years of no-tillage after receiving 13 years of conventional tillage. S: soybean; M: maize; PG: palisade grass. Different letters indicate significant differences among treatments in the same depth (p < 0.05, Tukey’s test).
Sustainability 15 15936 g003aSustainability 15 15936 g003b
Figure 4. Root dry biomass for different cropping systems evaluated at each soil layer. Different letters indicate significant differences among treatments (p < 0.05, Tukey’s test).
Sustainability 15 15936 g004
Figure 5. Spearman rank correlations between bulk density (a), macroporosity (b), total porosity (c), saturated hydraulic conductivity (d), and root dry biomass.
Sustainability 15 15936 g005
Table 1. Summarized description of crops in the experimental field from 2000 to 2018/2019.
YearWinterSummerYearWinterSummer
2000/01Native grassSoybean2010/11Black oat + VetchMaize
2001/02Black oat + VetchMaize2011/12Black oat + VetchSoybean
2002/03Black oat + VetchSoybean2012/13Black oat + VetchMaize
2003/04Black oatMaize2013/14Black oat + VetchSoybean
2004/05Black oatFallow2014/15Black oat + VetchMaize
2005/06Black oat + VetchSoybean2015/16Black oat + VetchMaize
2006/07Black oat + VetchMaize2016/17Black oat + VetchSoybean
2007/08Black oat + VetchSoybean2017/18Black oatMaize/Soybean/Palisade
2008/09Black oat + VetchMaize2018/19Black oat
2009/10RyegrassSoybean
Black oat (Avena strigosa Schreb); Vetch (Vicia sativa L.); Ryegrass (Lolium multiflorum L.); Soybean (Glycine max L.); Maize (Zea mays L.); Palisade: Palisade grass (Brachiaria brizantha cv. Xaraés).
Table 2. Physical–hydric properties according to soil tillage and cropping systems (n = 4).
TreatmentBd
(Mg m−3)
Mac
(m3 m−3)
Mic
(m3 m−3)
TP
(m3 m−3)
Ksat
(mm h−1)
RBd
(%)
Soil tillage Layer 0–10 cm
17NT1.55 (0.07) ns0.11 (0.04) ns0.27 (0.02) ns0.38 (0.03) ns175 (53) ns96.88
4NTM1.58 (0.10)0.11 (0.04)0.25 (0.02)0.36 (0.03)204 (62)98.75
4NTC1.60 (0.05)0.11 (0.03)0.26 (0.01)0.37 (0.02)158 (44)100.00
CV (%)5.631.75.47.535
Crops
Soybean1.60 (0.06) ns0.10 (0.02) ns0.26 (0.02) ns0.36 (0.03) ns118 (27) ns100.00
Maize1.55 (0.07)0.12 (0.03)0.26 (0.02)0.38 (0.02)230 (48)96.88
Palisade1.59 (0.09)0.10 (0.05)0.25 (0.02)0.36 (0.04)189 (27)99.38
CV (%)4.824.52.96.476
Soil tillage Layer 10–20 cm
17NT1.64 (0.06) ns0.09 (0.04) ns0.26 (0.02) ns0.35 (0.02) ns113 (55) ns102.50
4NTM1.65 (0.06)0.09 (0.02)0.26 (0.01)0.35 (0.02)122 (55)103.13
4NTC1.65 (0.06)0.08 (0.03)0.25 (0.02)0.34 (0.02)88 (28)103.13
CV (%)3.420.84.24.890
Crops
Soybean1.64 (0.07) ns0.08 (0.03) ns0.26 (0.02) a0.35 (0.03) ns139 (45) ns102.50
Maize1.65 (0.04)0.09 (0.03)0.26 (0.02) a0.34 (0.01)89 (19)103.13
Palisade1.65 (0.06)0.10 (0.04)0.25 (0.02) b0.35 (0.02)95 (18)103.13
CV (%)3.434.33.77.076
Soil tillage Layer 20–30 cm
17NT1.65 (0.05) ns0.07 (0.02) ns0.28 (0.01) ns0.34(0.02) ns28 (11) ns103.13
4NTM1.62 (0.08)0.08 (0.04)0.26 (0.01)0.34 (0.04)55 (28)101.25
4NTC1.65 (0.05)0.08 (0.02)0.27 (0.02)0.34 (0.02)50 (10)103.13
CV (%)6.113.85.65.271
Crops
Soybean1.65 (0.05) ns0.07 (0.02) ns0.27 (0.02) ns0.34 (0.02) ns37 (11) ns103.13
Maize1.65 (0.05)0.07 (0.03)0.27 (0.01)0.34 (0.02)51 (15)103.13
Palisade1.62 (0.08)0.08 (0.04)0.27 (0.02)0.35 (0.03)44 (14)101.25
CV (%)6.727.46.06.299
17NT: 17 years of continuous no-tillage; 4NTM: 4 years of no-tillage after receiving 13 years of minimum tillage; 4NTC: 4 years of no-tillage after receiving 13 years of conventional tillage. Bd: bulk density; Mac: macroporosity; Mic: microporosity; TP: total porosity; Ksat: saturated hydraulic conductivity; RBd: relative bulk density. Different letters indicate significant differences among treatments in the same soil layer (p < 0.05, Tukey’s test); ns: treatments in the same soil layer are not statistically different using Tukey’s test. The standard deviation of the mean is given in parentheses (±). CV: coefficient of variation.
Table 3. Values of Sq to the interaction between treatments on the visual evaluation of soil structure (VESS), with different soil tillage practices within each crop and different cropping systems within each soil tillage.
Tillage
Crops17NT4NTM4NTC
Soybean2.65 (0.47) ns2.22 (0.50)2.48 (0.42)
Maize2.50 (0.76) ns2.69 (0.47)2.50 (0.42)
Palisade grass2.00 (0.45) B2.64 (0.47) A2.42 (0.57) AB
Crops
TillageSoybeanMaizePalisade grass
17NT2.65 (0.47) A2.50 (0.76) A2.00 (0.45) B
4NTM2.22 (0.50) B2.69 (0.47) A2.64 (0.47) AB
4NTC2.48 (0.42) ns2.50 (0.42)2.42 (0.57)
17NT: 17 years of continuous no-tillage; 4NTR: 4 years of no-tillage after receiving 13 years of minimum tillage; 4NTC: 4 years of no-tillage after receiving 13 years of conventional tillage. Different letters in the line indicate significant differences among treatments (p < 0.05, Tukey’s test); ns: treatments in the same line are not statistically different using Tukey’s test. The standard deviation of the mean is given in parentheses (±). Treatment with the same Sq number in the line is statistically different because we present the mean value of four replicates, which was statistically considered the decimal number.
Disclaimer/Publisher’s Note: The statements, opinions and data contained in all publications are solely those of the individual author(s) and contributor(s) and not of MDPI and/or the editor(s). MDPI and/or the editor(s) disclaim responsibility for any injury to people or property resulting from any ideas, methods, instructions or products referred to in the content.