Article

Assessing the Benefits of Climate-Sensitive Design with Nature-Based Solutions for Climate Change Adaptation in Urban Regeneration: A Case Study in Cheltenham, UK

School of Arts, University of Gloucestershire, Cheltenham GL50 4AZ, UK
*
Author to whom correspondence should be addressed.
Sustainability 2023, 15(22), 15855; https://doi.org/10.3390/su152215855
Submission received: 29 September 2023 / Revised: 2 November 2023 / Accepted: 3 November 2023 / Published: 11 November 2023
(This article belongs to the Special Issue Urban Regeneration, Development, and Sustainability)

Abstract

:
Addressing the challenge of climate adaptation necessitates an evidence-based approach. The integration of nature into urban spaces is vital in mitigating the effects of climate change, which can be accomplished through the regeneration of grey areas. Consequently, the incorporation of nature-based solutions (NBS) becomes indispensable for the creation of climate-resilient public spaces. However, only a few studies have considered climate change simulated data to design climate-resilient spaces in the UK. Thus, in this study, we evaluated the benefits of two scenarios for regenerating an existing car park space in Cheltenham with 30% and 50% NBS. These design scenarios were the outcomes of a 3-day design workshop aiming to create a climate-resilient public space with NBS. Using ENVI-met software (version 5.0.3) and weather data for the second-highest heatwave in Cheltenham, UK, in 2017 and 2050 predictions, we analysed temperature impacts. Results show NBS could reduce the mean radiant temperature by 6 to 15 degrees. An average decrease of 1.2 in the predicted mean vote (PMV) value, indicating an improvement in thermal comfort within the 50% NBS scenario, highlights its climate adaptation benefits. Comparison between the 30% and 50% NBS scenarios reveals the importance of strategy implementation. This evidence will aid future urban projects in designing climate-resilient and healthy cities, benefiting planning authorities, architects, urban planners, landscape architects, and researchers.

1. Introduction

In recent years, there has been a rising prominence of global challenges associated with climate change and global warming, with one of its immediate and significant effects becoming increasingly evident. [1]. The average global temperature is thought to be rising due to both natural and human-caused factors [2]. Temperature increases brought on by climate change will exacerbate the warming caused by urban growth in the forthcoming years [3]. In cities worldwide, extreme heat episodes (EHE) have resulted in disproportionately high death and morbidity rates because urban populations are stressed beyond their capacity for adaptation [4].
According to Oke (1982), the urban heat island (UHI) effect is a distinctive urban climate, characterised by hotter temperatures in highly populated regions compared to the surrounding areas [5]. Koppe et al. (2004) further affirm that the UHI has a detrimental impact on people’s health and quality of life in cities, especially during heatwaves [6]. Moreover, owing to the urban heat island effect and extreme weather conditions such as prolonged heatwaves, cities are frequently the most severely affected by climatic changes [7]. In 2018, it is noteworthy that the European Union accounted for over a third of the 296,000 heat-related fatalities worldwide, with 104,000 deaths attributed to such causes [8]. In the UK, during the second heatwave in 2017, lasting from the 5th to the 7th of July, an estimated 180 more fatalities among those aged 65 and older were recorded above the baseline. In total, 778 additional fatalities are estimated to have occurred during the summer of 2017 [9]. Additionally, as highlighted by Basu (2009), there is a proven connection between elevated ambient temperatures and adverse health effects, a connection that has been demonstrated in various contexts, including the United Kingdom [10].
Numerous studies have emphasised the significance of nature-based solutions (NBS) and green infrastructure (GI) in reducing heatwave mortality, enhancing human thermal comfort, and mitigating climate change effects in urban areas [11,12,13]. Given the spatial constraints inherent in densely populated cities, well-connected green infrastructure networks and the regeneration of existing urban grey spaces with NBS become critical. In this pursuit, it is critical to embrace the principles of climate-resilient design and climate-sensitive urban design, which recognise that urban planning should provide not only economic, spatial, functional, and visual benefits, but also contribute significantly to both environmental enhancement and climate change mitigation [14]. Simultaneously, the creation of interconnected urban green areas is critical for altering the urban thermal climate [15]. As a result, urban regeneration efforts [16] should include both climate-sensitive urban design and NBS, as the latter has enormous potential for offering a varied array of ecosystem services inside urban environments [17]. Well-designed NBS interventions have been shown to effectively alleviate the impact of heatwaves, as highlighted in multiple studies [18,19] Therefore, the urgency to incorporate nature into urban areas has driven researchers to explore how underutilised urban spaces, such as parking lots, can be repurposed and transformed into green and environmentally beneficial areas using NBS. For example, a recent study by Croeser et al. (2022) examined the potential of repurposing redundant car parks using NBS [4].
Their findings demonstrate the significant advantages of strategies such as tree canopy coverage, stormwater management, and ecological connectivity [4]. This approach transforms parking areas into urban green spaces for nature, contributing to the broader goal of creating climate-resilient cities.
In addition, numerous case studies have focused on NBS and their contribution to climate change adaptation in the past decade [20,21]. For instance, by reducing air temperature through shade and evapotranspiration, NBS can help mitigate the detrimental effects of increasingly frequent and severe heatwaves [22]. However, implementing NBS on a diverse scale, ranging from mid-scale to large-scale, and incorporating them into urban regeneration projects remains challenging. Grace et al. (2021) note that while it has been easier for new development projects to incorporate NBS since its implementation, the existing urban shape and land usage have limited opportunities for interventions in already built-up regions [23]. This is particularly true in high-density areas, which are also the most susceptible to climate change [24].
In Egypt, a case study evaluated the possibility of climate change mitigation with GI on a neighbourhood scale in the city of Cairo [25], in which three present and future scenarios were analysed using ENVI-met V4 and CCWeatherGen tool. The results of this case study demonstrate that tree lines and green roofs effectively lowered air and radiation temperatures and enhanced the site’s present microclimate performance. Additionally, these solutions show an excellent capacity to drop just the radiant temperatures and their effect in the context of a changing climate together with significant heatwaves [25]. Similar to this, it was determined in a more recent case study by Cortes et al. (2022) that including trees, grasses, and a green roof may lower the air temperature by an average range of 0.1 °C–0.3 °C [26]. In the past, concepts such as water-sensitive urban design and sustainable urban drainage systems, incorporating NBS, have been applied and studied by researchers and landscape architects for their ability to address water-related challenges in cities [27]. However, more recent research on bioretention systems or rain gardens has brought to the forefront their role in mitigating the UHI effect and enhancing thermal comfort [27,28]. For example, Kridakorn Na Ayutthaya et al. (2023) [27] demonstrated that combining bioretention with mature trees can offer additional outdoor thermal comfort. Therefore, the benefits of climate-sensitive design with NBS on temperature reduction is evident [29], as demonstrated by parametric research investigating the effects of incorporating green elements into 26 small parking areas during midsummer outdoor thermal conditions in Shanghai [30].
However, there are only a few studies that have examined the potential contributions of urban regeneration initiatives to climate change adaptation [14], particularly those that are based on future climate change scenario forecasts and the benefits of NBS for improving thermal comfort. Moreover, given that many European cities are focusing on reducing automobile dependency as well as decreasing parking spaces to accommodate their car-free or “15-min city” policies [31,32], it is crucial to understand the benefits of regenerating these car parks through the application of NBS. In order to fill this knowledge gap, our study examined a specific case study in which we evaluated the advantages of two regeneration scenarios for an existing car park in Cheltenham. These scenarios involve the incorporation of 30% and 50% NBS, the use of research-through-design methodologies that include efficient climate change mitigation strategies, and the incorporation of climate change simulation data. The primary objective of our research was to assess the effects of increasing the percentage of NBS on numerous variables, such as thermal comfort, temperature, and relative humidity. These specific variables are critical in mitigating the negative effects of heatwaves caused by climate change and, as a result, in lowering the related mortality risk [33,34].

2. Materials and Methods

2.1. Study Area

Cheltenham is a town in the United Kingdom located in the south-western English county of Gloucestershire, 88 miles (141.62 km) west of London. The chosen location is in the city’s heart, surrounded by busy intersections and roadways (Figure 1). This site was selected due to the lack of vegetation, the need for urban regeneration, and the potential to reduce parking spaces through green area regeneration using climate-sensitive design and NBS.
In accordance with the Köppen climate classification system, Cheltenham is categorised as possessing a temperate oceanic climate (Cfb) [35]. This classification denotes a region characterised by its mild and temperate meteorological conditions. Cheltenham experiences substantial precipitation throughout all seasons, with a consistent presence of rainfall even during the relatively drier months [35]. Among the twelve months, July stands out with the highest average temperature, often reaching 16.6 °C. Conversely, the coldest period of the year occurs in January, when the average temperature descends to 4.4 °C [35].

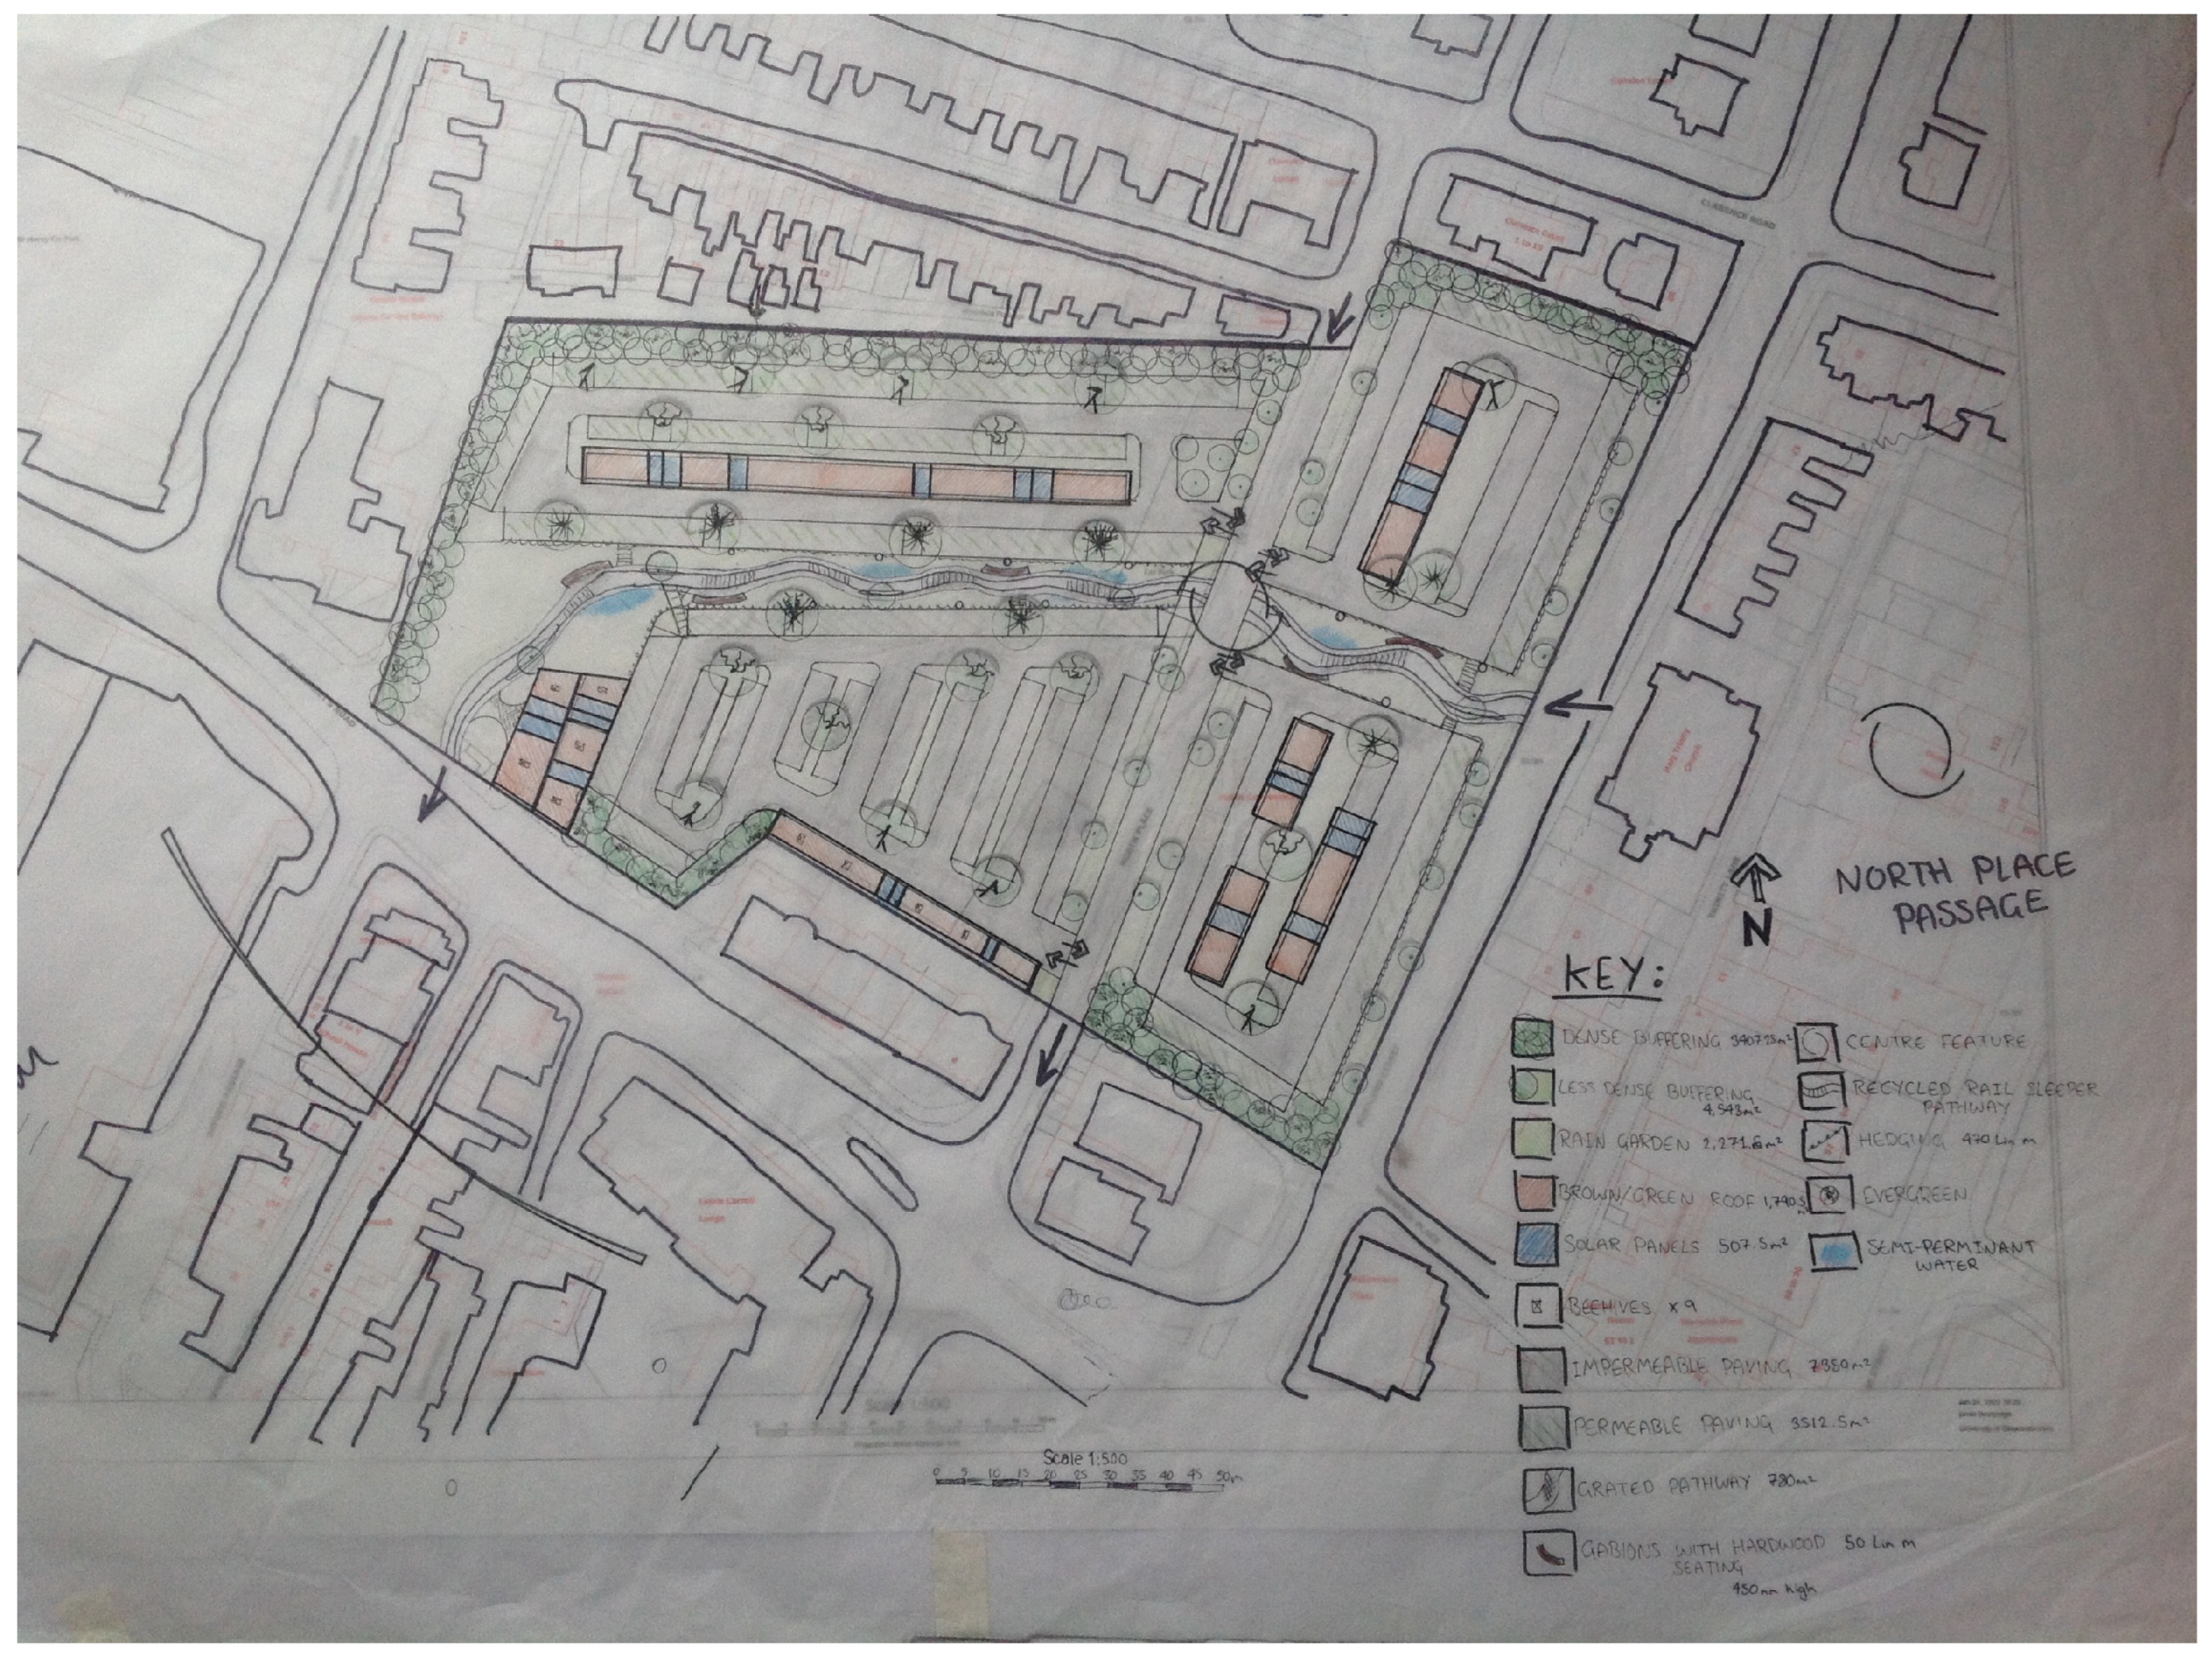
2.2. Research through Design (RtD) and Design Scenarios

This study applied a research through design (RtD) approach in landscape architecture and urban design [36], following Lenzholzer, Duchhart, and Koh’s methodology [37].
The RtD approach was chosen based on past post-positivist microclimatic urban design research because it produces accurate and trustworthy knowledge, creating evidence that supports urban microclimate-responsive design [37,38,39]. In October 2022, a three-day design workshop took place at the University of Gloucestershire. This workshop was exclusively attended by individuals with knowledge or a background in landscape architecture or urban planning. It was jointly facilitated by academics in landscape architecture from the University of Gloucestershire and experts from relevant practices. During the workshop, participants were tasked with creating regenerative designs based on specific climate-sensitive design guidelines. These designs were intended to reflect site analysis-derived requirements, with a primary focus on incorporating NBS for the regeneration of parking spaces. In particular, the 3-day design workshop involved design iterations as an integral part of the research process, aligning with the post-positivist approach of RtD [37,38]. The primary goal was to generate nature-based solution concepts as design outputs that could be tested through numerical modelling [38]. The workshop divided participants into two groups: the first group worked on the first scenario, and the second group addressed the second scenario. The results of their efforts are presented in Figure 2 and Figure 3.
Scenario 1 (Figure 2) designates 30% of the area to NBS, in line with climate-resilient design goals. This scenario includes the following:
-
Establishment of 600 parking spaces.
-
Implementation of a brown and green shading system.
-
Integration of solar panels to power electric vehicle recharge stations.
-
Inclusion of rain gardens and wetlands.
-
Incorporation of buffering zones.
-
Application of permeable paving.
-
Provision of bicycle racks.
Scenario 2, shown in Figure 3, allocates 50% of the area to NBS, further supporting climate-resilient design objectives. The requirements for this scenario consist of the following:
-
A minimum of 400 parking spaces.
-
Incorporation of electric vehicle recharge stations.
-
Creation of a pond and wetlands.
-
Establishment of buffering zones.
-
Installation of bicycle racks.
-
Implementation of permeable paving.
The RtD methodology uses quantitative evaluations as part of its framework to assess designs against objective criteria, such as cooling effects [40]. This approach played a key role in guiding the development of these two design scenarios during the 3-day workshop [40].

2.3. Modelling

As part of the post-positivist RtD approach [38], the workshop outputs were processed to create 3D representations of the site. This involved using SketchUp, Cadmapper, and Google Earth to extract building height data. Subsequently, BMP files were exported and used in the modelling process in ENVI-met version 5.0.3, utilising the “spaces” tool.
The modelling process involved comparing climate and environmental data for two key dates: the first, utilising available data on 05/07/2017, and the second, selected as the target year for analysis, on 05/07/2050. By using the fundamental principles of fluid mechanics (wind field), thermodynamics (temperature calculations), and general atmospheric physics (such as turbulence prediction), ENVI-met can produce outputs relating to environmental analysis [41,42]. ENVI-met is a microscale, three-dimensional computer model for simulating complex metropolitan settings [41,42]. ENVI-met is frequently used in urban green space microclimate regulation effects, mainly to simulate the heat island effect [43], improve human thermal comfort [44], and reduce air pollutants [45]. ENVI-met can also simulate air temperature and relative humidity, soil temperature and humidity, solar radiation, surface temperature, and wind speed and direction scenarios [41,46].
In total, six scenarios were modelled using the space tool in ENVI-met V5.0.3, as follows:
Scenario 1: Existing 2017 (EX-2017)—This scenario models the existing conditions, materials, and the surrounding building.
Scenario 2: Existing 2050 (EX-2050)—This scenario models future weather data, materials, aged trees and vegetation, and the surrounding buildings.
Scenario 3: 30% NBS implementation for 2017 (30-2017)—This scenario is modelled based on workshop output and includes existing weather data, materials, young trees, vegetation, and surrounding buildings. It also involves removing the scaffold system around the northwest situated structure.
Scenario 4: 30% NBS implementation for the year 2050 (30-2050)—Similar to Scenario 3, this scenario models future weather data, materials, aged trees, vegetation, and surrounding buildings. It also involves removing the scaffold system around the northwest situated building.
Scenario 5: 50% NBS implementation for 2017 (50-2017)—Like Scenario 3, this scenario models existing weather data, materials, young trees, vegetation, and surrounding buildings while removing the scaffold system around the northwest situated structure.
Scenario 6: 50% NBS implementation for the year 2050 (50-2050)—Similar to Scenario 5, this scenario models future weather data, materials, aged trees, vegetation, and surrounding buildings while removing the scaffold system around the northwest situated building.
All six scenarios had a total simulation time of 24 h in ENVI-met.

2.4. Environmental and Weather Data

The weather data file used for the simulation process was extracted from the EPW file downloaded from https://climate.onebuilding.org/ (accessed on 10 October 2023) [47] using DesignBuilder software version 7.1.2.006. As the EPW file for Cheltenham was not available, we used the one related to Gloucestershire County, in which Cheltenham is situated. The 5 July 2017, was chosen as the simulation date due to the availability of data and the second heatwave recorded in the UK, which resulted in 778 excess deaths over the summer of 2017 [9]. The weather data from the EPW file for 05/07/2017 was inputted manually into the ENVI-guide tool.

2.5. CCWeatherGen Tool

In addition, ENVI-met requires weather data to perform simulations. CCWorldWeatherGen v1.9 [48] was used to generate a climate change weather file for the future scenario of 2050 based on existing data from the EPW weather file for 05/07/2017, and it was used in the simulation using ENVI-guide tool of ENVI-met v 5.0.3.

2.6. NBS Species Selection

The plant species used in ENVI-Met modelling were selected using the Tree Species Guide v 1.3 [49], which are mainly local species. The different ages and sizes were modified for each scenario using the Albedo tool in ENVI-met v 5.0.3, which are young trees planted for 2017 and medium age to old trees for 2050. The selected species are as follows:
  • Field maple tree, young, middle, and old age
  • Oak tree, old and middle age
  • Hazel, young and old age
  • Birch, young and medium age
  • Hawthorn, young age
  • 25 cm and 40 cm grass and vegetation

2.7. Data Analysis and Mapping

Leonardo, an application tool from ENVI-met V5.0.3, was used to visualise and examine the model outputs. Each map was created using simulated microclimate data generated by the ENVI-core simulation. We extracted information on potential air temperatures, relative humidity, wind speed, mean radiant temperature, and thermal comfort value PMV at z-levels (vertical levels) at a height of 2 m [50]. The thermal comfort index, known as the predicted mean vote (PMV), denoting a scale ranging from −4 (very cold) to +4 (very hot) with 0 indicating a state of thermal neutrality and comfort, was assessed for all scenarios using the Bio-met tool [51]. This post-processing programme is designed to compute human thermal comfort and thermal comfort indices using simulation microclimate data [51]. To analyse the differences in potential temperature and mean radiant temperature between different scenarios, we selected a single grid cell within the model area, specifically the southwest entrance grid point at X = 30 and Y = 80, using the Leonardo tool. We then exported the data as Excel spreadsheet files and conducted further analysis in MS Excel version 2019 to generate charts.

3. Results

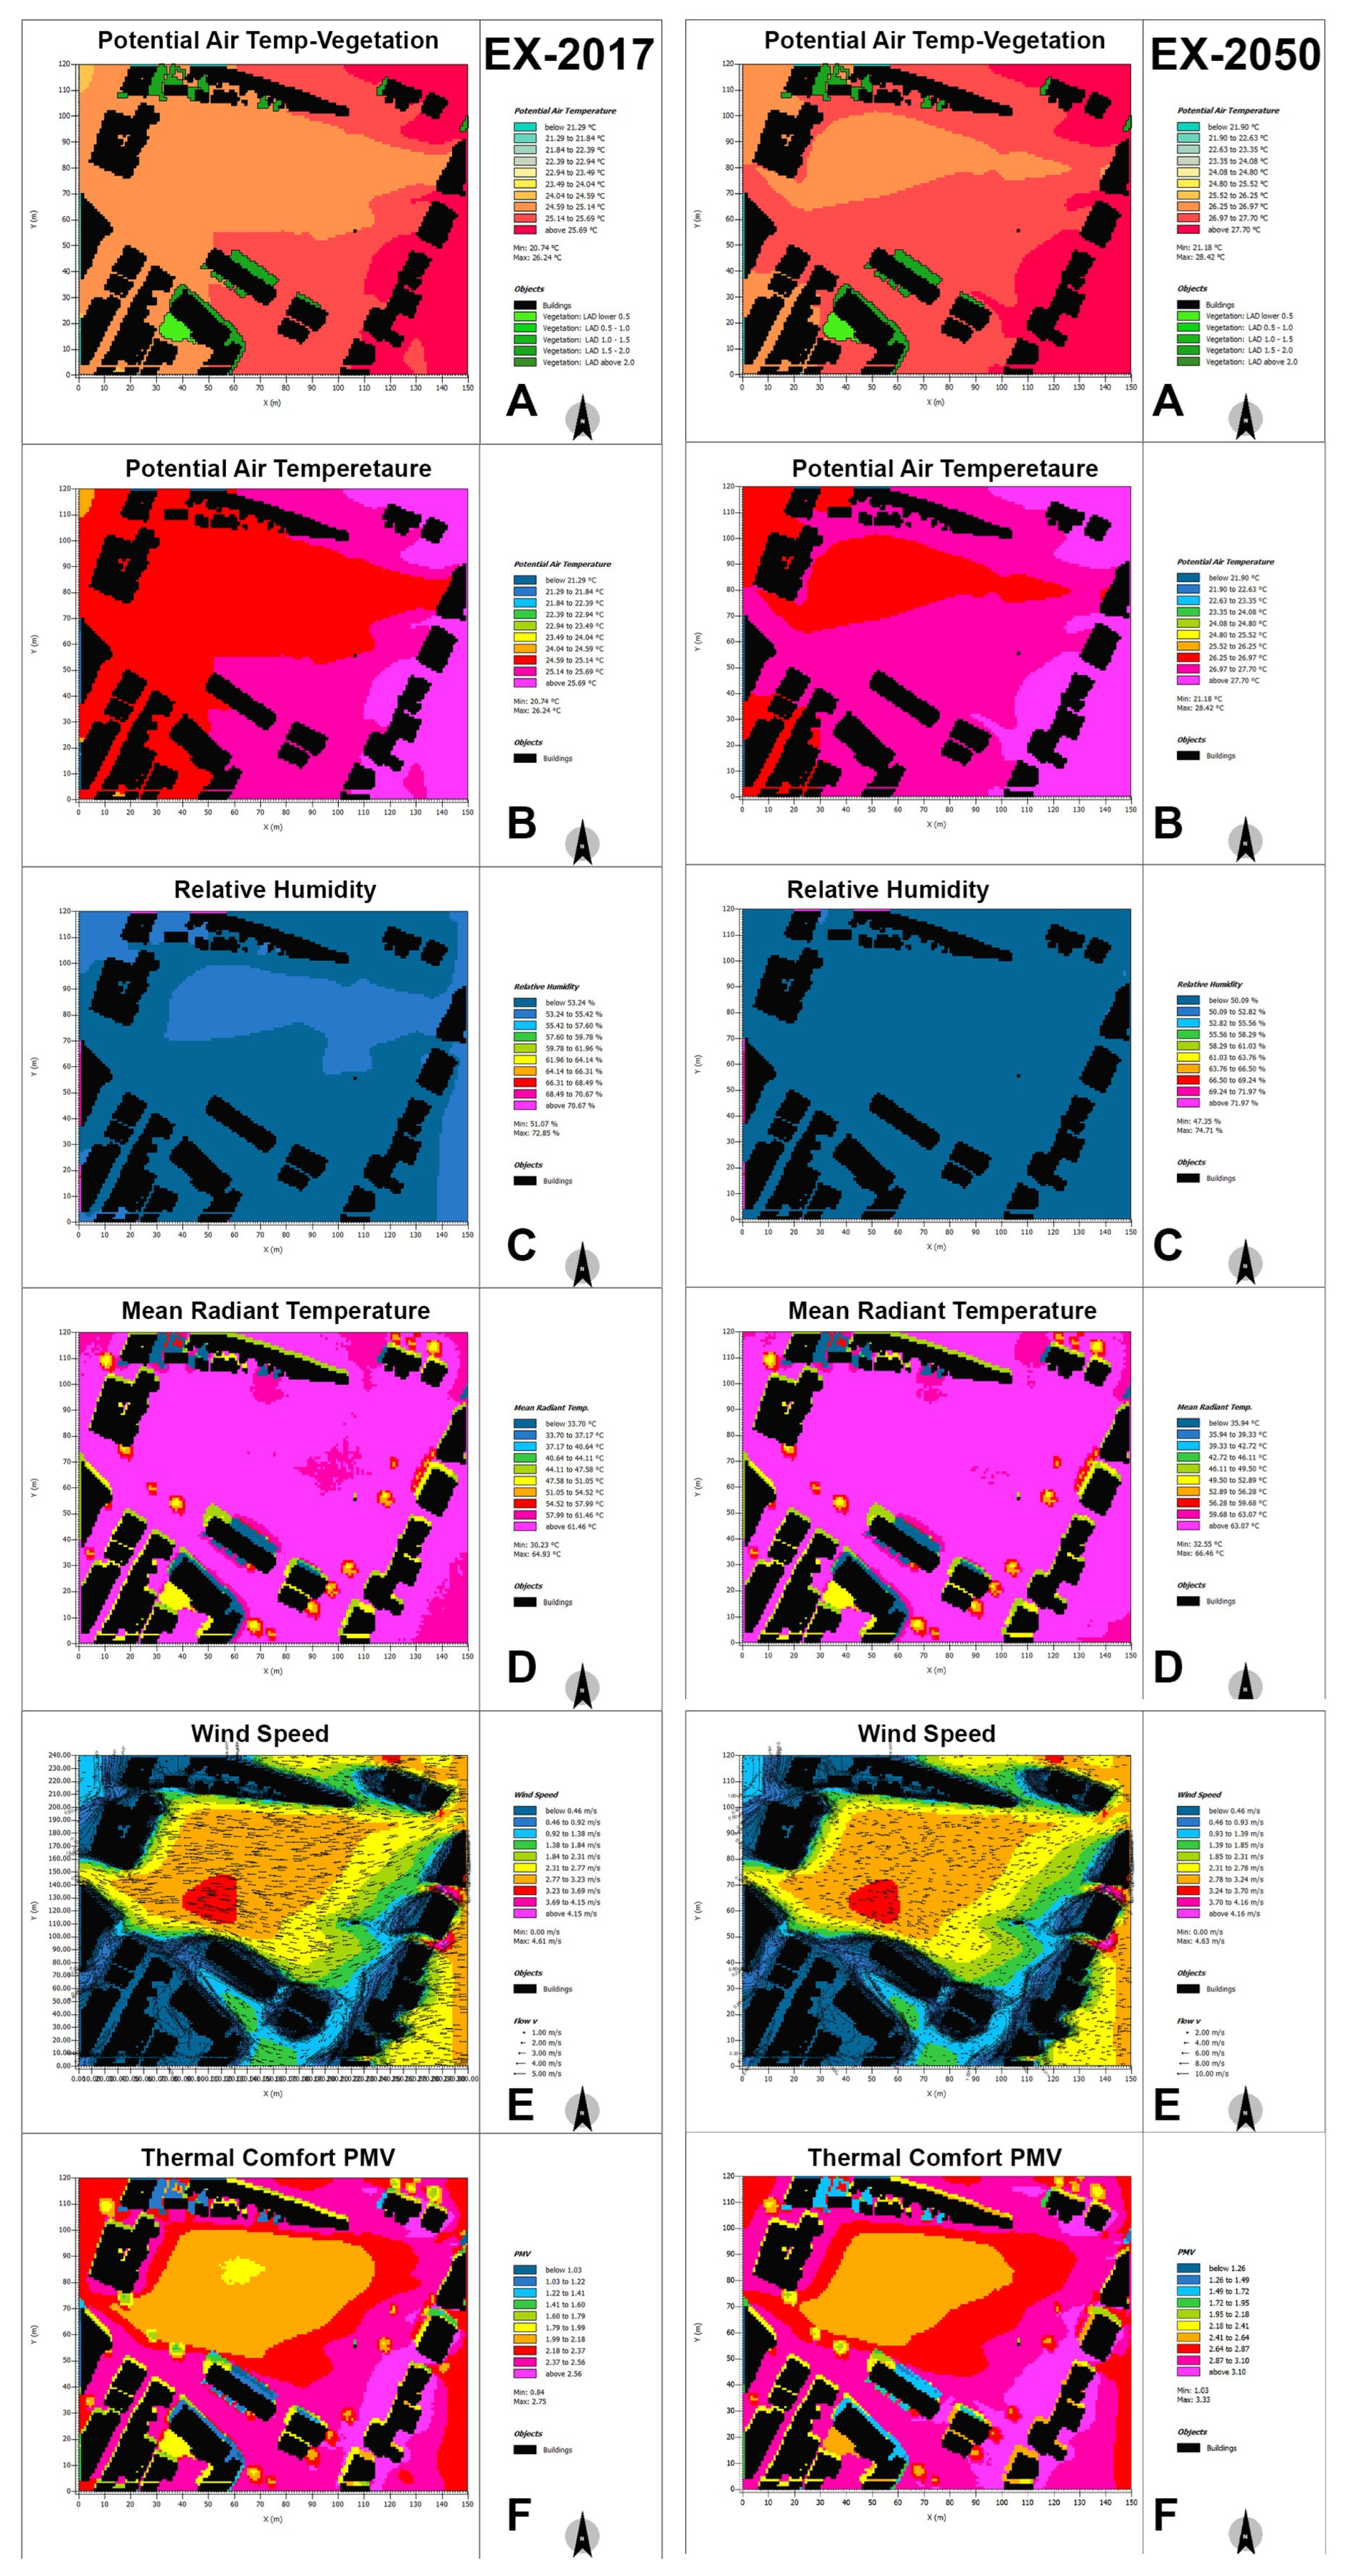
3.1. Existing 2017 and 2050 Mapped Results

Figure 4 shows the changes in environmental data from 2017 to 2050 if the site has the same existing conditions; two groups, EX-2017 and EX-2050, present these changes for each scenario. The potential air temperature map shows the changes during this period. It can be seen that there is a potential increase in air temperature in 50% of the site from the east-side of the site to the centre, where the potential air temperature changes from 25 degrees to 26 degrees (orange colour) and for most of the area the minor temperature changes are illustrated from 2017 to 2050. The potential air temperature maps for both scenarios demonstrate that the temperature value will be greater than 24 degrees in the EX-2017 scenario and more than 26.25 in the EX-2050 scenario.
The relative humidity regarding the existing scenarios in 2017 and 2050 has significant change to the point where most of the site will have less than 50.09% relative humidity. In contrast, in the map regarding 2017 (EX-2017-C), the relative humidity is more than 53% in most of the sites. Moreover, the highest relative humidity for the scenario existing 2017 is 55.42%. The mean radiant temperature (EX-2017-D) remains the same due to no change in conditions, vegetation, materials, or interventions regarding the site. The same can be observed for wind speed and direction (EX-2017-E), where minimal changes occur due to the absence of any modifications in the area.
The thermal comfort value has a significant change in the centre of the site. As can be seen, the PMV value of 1.79–1.99 in (EX-2017-F) was increased from 1.99 to 2.18 in (EX-2050-F). Meanwhile, a slight change from 2017 to 2050 was illustrated in a reduction of PMV value in the centre of the site to the northwest. Generally, the PMV value in the site for 2017 and 2050 scenarios will be more than the value of 0, which identifies as a neutral-comfort predicted mean vote [51]. The numbers mentioned in this study are mainly average, and the predicted value of the data is demonstrated in figures.

3.2. The 30% Nature-Based Solution Implementation Mapped Results in 2017 and 2050

Figure 5 illustrates the scenarios for 2017 and 2050 with 30% implementation of NBS solutions as (30-2017 A to F) and (30-2050 A to F). Like the existing scenarios, maps for both scenarios of 30-2017-B and 30-2050-B demonstrate that the temperature value will be greater than 24 degrees in the 30-2017-B scenario and more than 26.20 in the 30-2050-B scenario. This highlights a 2 degree increase in certain site areas from 2017 to 2050. The affected areas are mainly about the scenario design in which the areas remain unchanged regarding the air temperature concerning dense areas of NBS interventions. The main increases in potential air temperature are from the east-side of the site to the centre and from the centre to the south-west side of the site. As shown, the areas with lower potential air temperature in 30-2017-B have decreased in the 30-2050-B scenario. Relative humidity for most of the site in the 30-2017-C scenario is below 53.40%, and it increases to a range of 53% to 55.63% in all east borders of the site, centre and north, and west-northwest of the site. In scenario 30-2050-C, relative humidity in most of the area is decreased from 50.33% to 53.15%. Still, an area covering north to west of the site demonstrates the range of 53.15% to 55.97%, consisting of trees and vegetation in the 30% NBS implementation design scenario.
In scenarios 30-2017-D and 30-2050-D, the map illustrates that implementing NBS as a strategy significantly reduces mean radiant temperature. This will have positive effects on temperature and thermal comfort. It can be seen that in most of the designed areas, there is a reduction in mean radiant temperature, and it is more significant in the 30-2050-D scenario, where the input of the trees and vegetation are different compared to scenarios 30-2017-D. The figure demonstrates that scenario 30-2017-D lowest mean radiant temperature is 42.45 to 45.74. Whereas, for scenario 30-2050-D, the range of mean radiant temperature is between 39.67 to 42.82, which is a 3 degree difference from 2017 to 2050. Wind speeds in both scenarios of 30-2017-E and 30-2050-E remain the same for the surrounding areas, especially those with existing buildings. However, its direction changes as the design changes from the existing conditions in Figure 5. As it is demonstrated, the wind reduces in scenarios 30-2050-E in comparison to scenario 30-2017-E in the centre of the site, where the wind speed reduces from an average of 1.85 m/s to 2.31 m/s to an average of 1.40 m/s to 1.87 m/s.
The PMV value represents thermal comfort increases in scenario 30-2050-F from the range of 2.05 to 2.26 in scenario 30-2017-F to the range of 2.66 to 2.90. This increase is mainly in the areas allocated for the parking spots, and there are no NBS interventions rather than surface material. Second, it is noticeable that there is an increase in areas with PMV values with a range of 1.97 to 2.20 in scenario 30-2050-F from scenario 30-2017-F with higher values. Lastly, the improvement of PMV value directly relates to the scenario’s design to the point that the effects of the areas covered with vegetation are evident in the maps illustrated for both scenarios. The numbers mentioned in this study are mainly average, and the predicted value of the data is demonstrated in figures.

3.3. The 50% Nature-Based Solution Implementation Mapped Results in 2017 and 2050

The mapped results for scenarios with 50% NBS implementation are grouped with titles of 50-2017 and 50-2050 in Figure 6, demonstrating the environmental data extracted from ENVI-met simulation. The potential air temperature map 50-2017-B illustrates that the implementation of NBS positively affected the air temperature reduction of the whole site in 2017. Whereas the map for scenario 50-2050-B shows that most areas with temperatures less than 25.21 degrees will significantly change, dramatically increasing from the east side of the site to the centre to 26.94 degrees in the west. Regarding relative humidity in Figure 6 there is a significant decrease where in scenario 50-2017-C, the minimum relative humidity is 51.20% and for 50-2050-C is 47.53%. The map illustrates that most of the area, rather than the zone with high-density NBS interventions located from north to northwest of the site, faces a significant decrease in relative humidity.
Mean radiant temperature for 50% NBS implementation 50-2017-D scenarios depict a dramatical decrease in areas which have been designed, and the nature-based solutions have been used to transform them. This shows that the mean radiant temperature difference in areas which consist of NBS implementation has almost 20 degrees difference. The 50-2050-D map shows that the mean temperature is highly reduced in the areas affected by the design in scenario 50-2017-D. The change in mean radiant temperature exceeds almost 10 degrees in temperature in the northwest of the site. In scenarios 50-2017-E and 50-2050-E, it is evident that the surrounding areas will have a lower wind speed due to the existing buildings. The comparison between these two scenarios shows that the minimum wind speed decreases by almost 3.5 m/s from 2017 to 2050, from 51.20 in 50-2017-E to 47.53 in 50-2050-E. The decrease in wind speed becomes more significant in the site’s border, where it reduces drastically where most border zones from different directions and the street between parking have shown a wind speed under 1 m/s. For design scenario 50-2017-F, the mapped data illustrated that the thermal comfort value significantly decreased in designed areas where 50% of nature-based solutions were implemented. These reductions in PMV value vary from almost 50% of the area having a value of 1.66 in the green area to 2.24 in the parking space. A significant decrease in PMV value is recorded in areas with higher-density vegetation, with the thermal comfort value decreasing to nearly 1.27. The map of scenario 50-2050-F depicts that the PMV value is similar to scenarios with 30% NBS implementation and 50% in 2017, which for this scenario is a significant decrease in all the areas where NBS were implemented from 2.65 to 1.49 in PMV value. It should be mentioned that the impact of the age factor on trees and vegetation is noticeable all along the site, to the point that compared to scenario 50-2017-F, the trees planted on the border of the eastern parking lot illustrate a decrease in PMV value. The numbers mentioned in this study are mainly average, and the predicted value of the data is demonstrated in figures.

3.4. A Comparative Analysis of NBS Scenarios and Thermal Comfort

The mapped results illustrate a direct relation between the proposed greening strategy and the solution with the changes in relative humidity, mean radiant temperature, wind speed and thermal comfort value. The results of this study regarding thermal comfort value (Figure 7) are in accordance with [52,53], which also highlighted that greening strategies have positive benefits on thermal comfort. The air temperature increase and relative humidity reduction pattern in each scenario highlight the benefits of implementing NBS. The results for scenarios with 30% and 50% NBS implementation illustrate that areas with higher tree canopy have a lower PMV value, improving thermal comfort (Figure 7). It can be discussed that different types of NBS intervention can have different benefits and roles in the final results. For example, the rain garden system in the 30% scenario shows a positive effect on thermal comfort rather than pond NBS intervention in the 50% scenario. This study’s result agrees with a current study that concludes that water bodies positively affect air temperature [54].

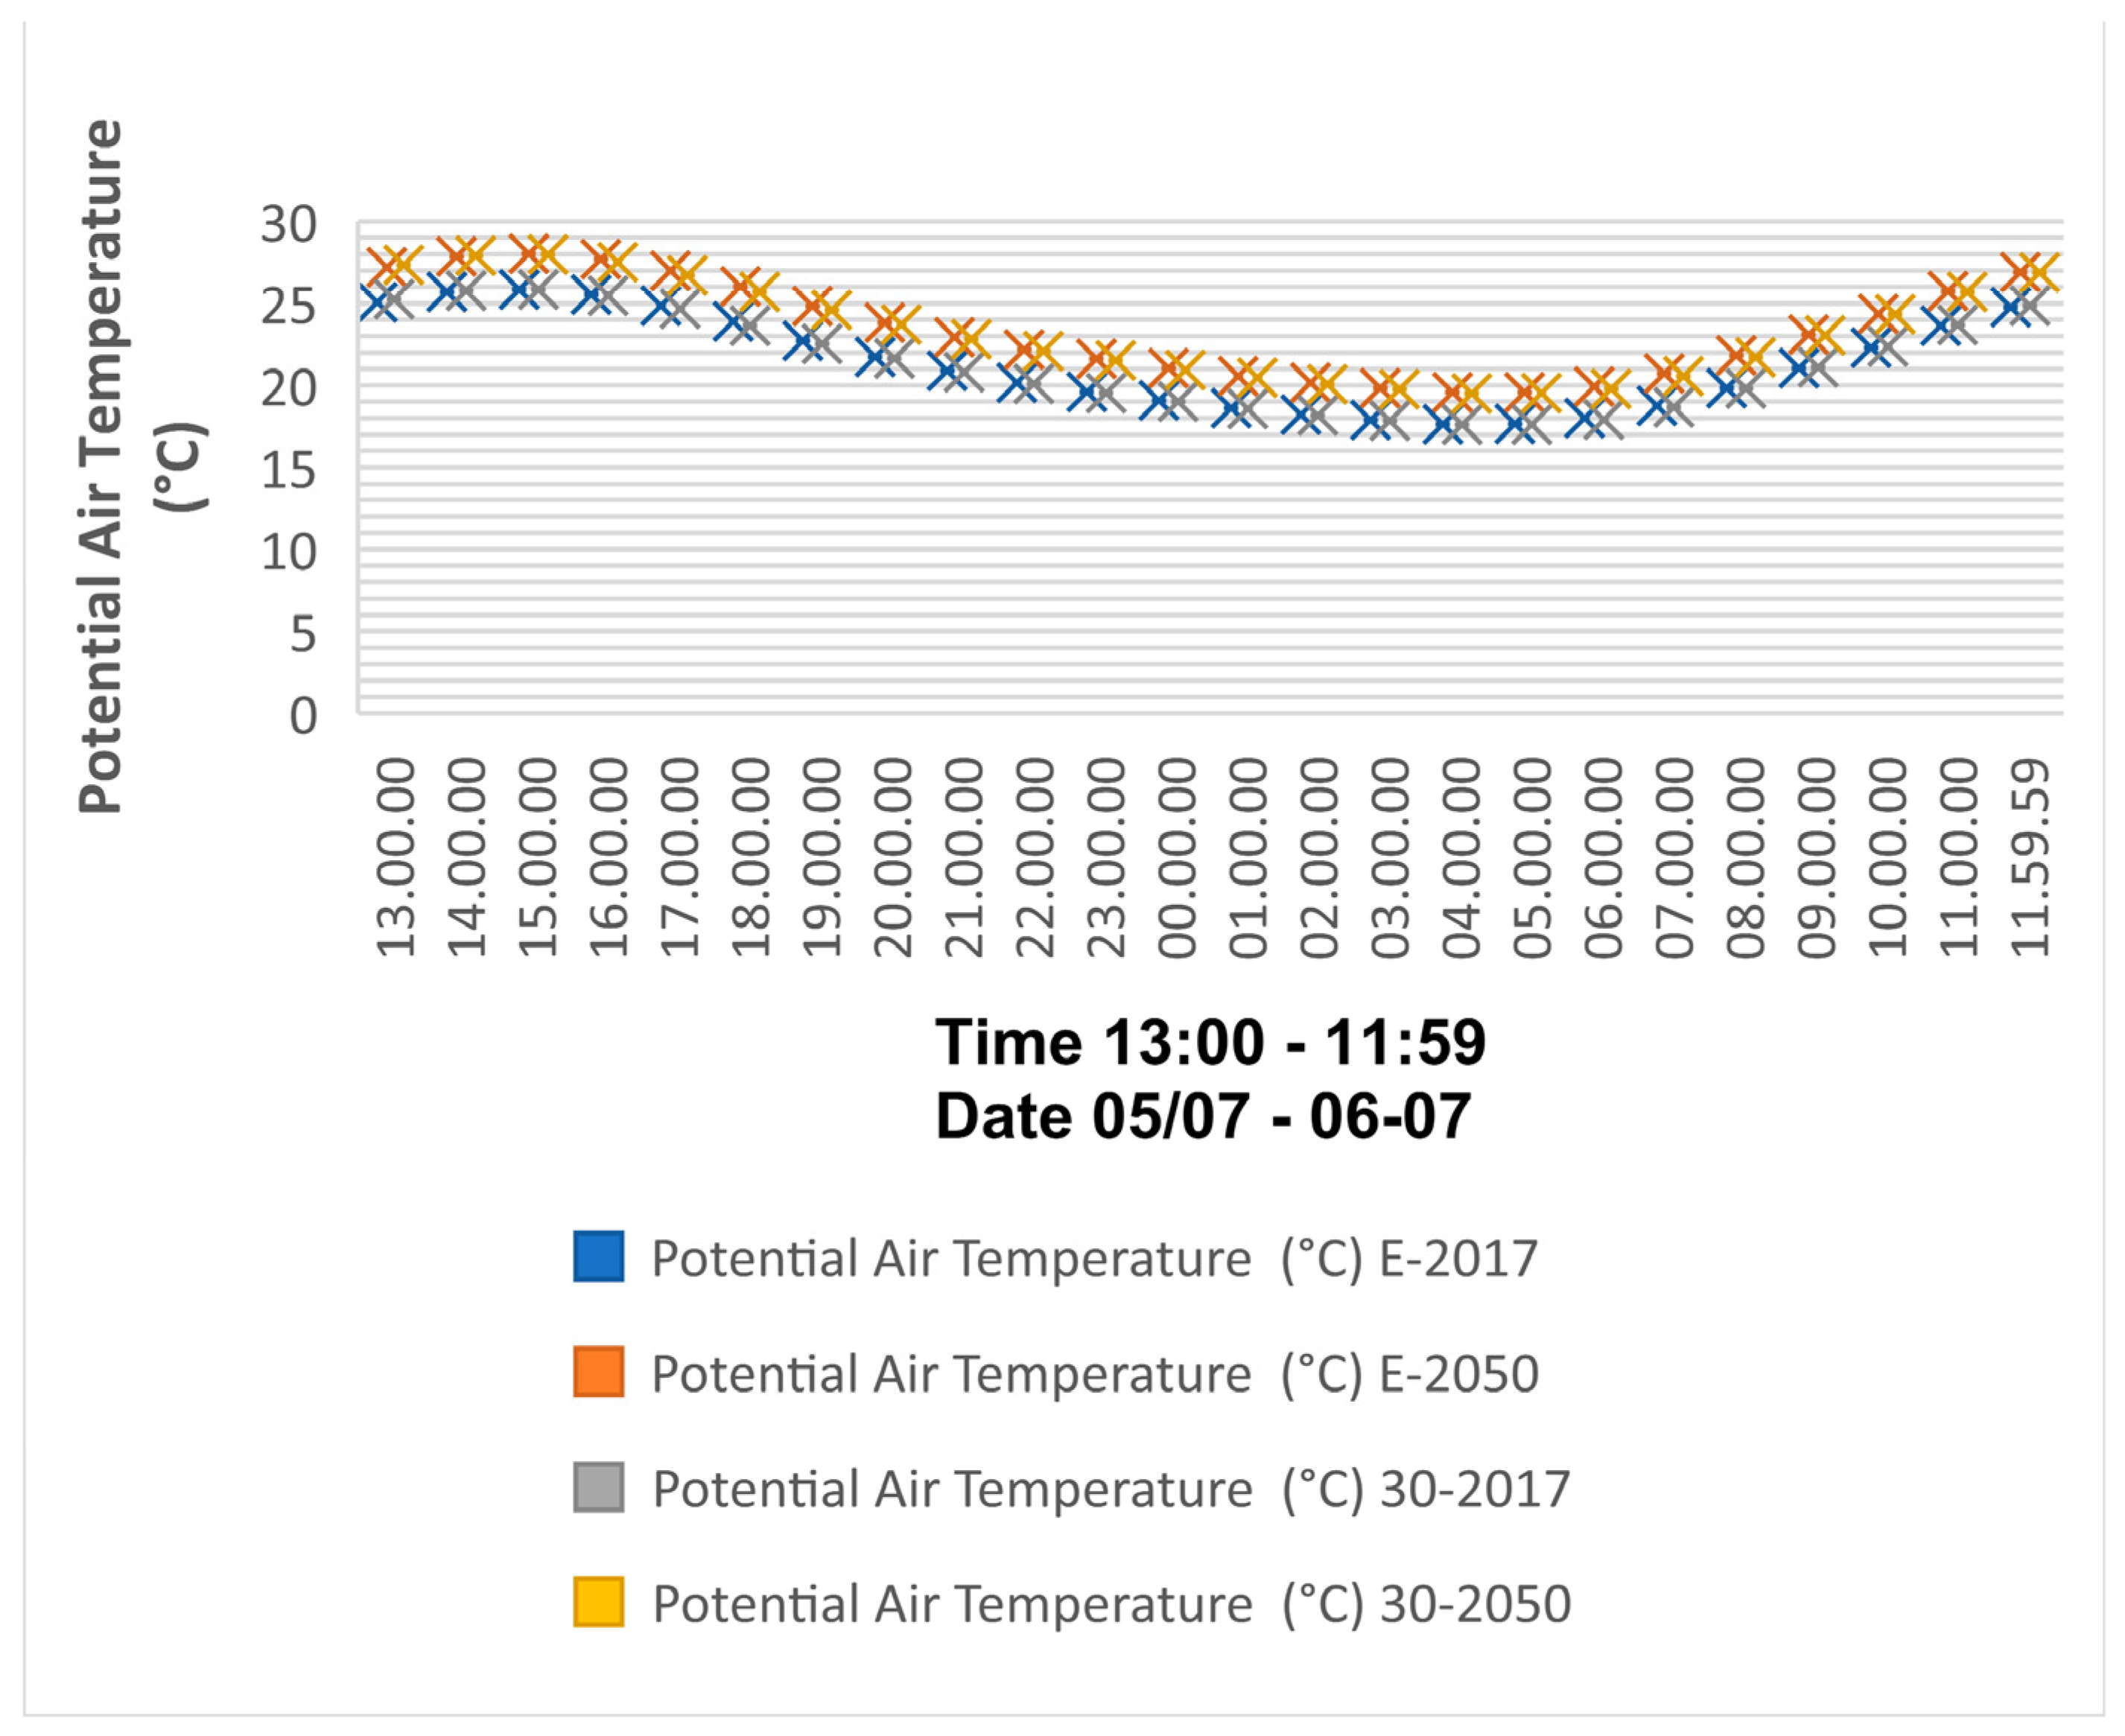
3.5. Potential Air Temperature Changes in Existing and 30% NBS Scenarios

Figure 8 depicts the changes in potential air temperature for four different scenarios consisting of existing scenarios 2017 and 2050 and 30% nature-based solution implementation 2017 and 2050. The significant change in potential air temperature from the E-2017 scenario to the E-2050 scenario can be seen, and it highlights that in 24 h, the potential air temperature has a consistent increase of about 1.8 degrees. The same changes apply to the potential air temperature of scenarios 30-2017 to 30-2050. It should be mentioned that the predicted potential air temperature change from 2017 to 2050 predicted using CCweathergen in Figure 8 illustrates a more remarkable change in comparison to the simulated and mapped data using ENVI-met. While comparing EX-2017 and EX-2050 with 30-2017 and 30-2050, it can be seen that for each scenario relevant to the corresponding year, there is a slight increase of less than 1 degree from 13:00 to 15:00, followed by an insignificant decrease from 16:00 to 8:00. The potential air temperature remains nearly constant from 8:00 to 10:00, with a slight increase from 10:00 to 11:59. The numbers mentioned in this study are mainly average and the predicted value of the data is demonstrated in figures.

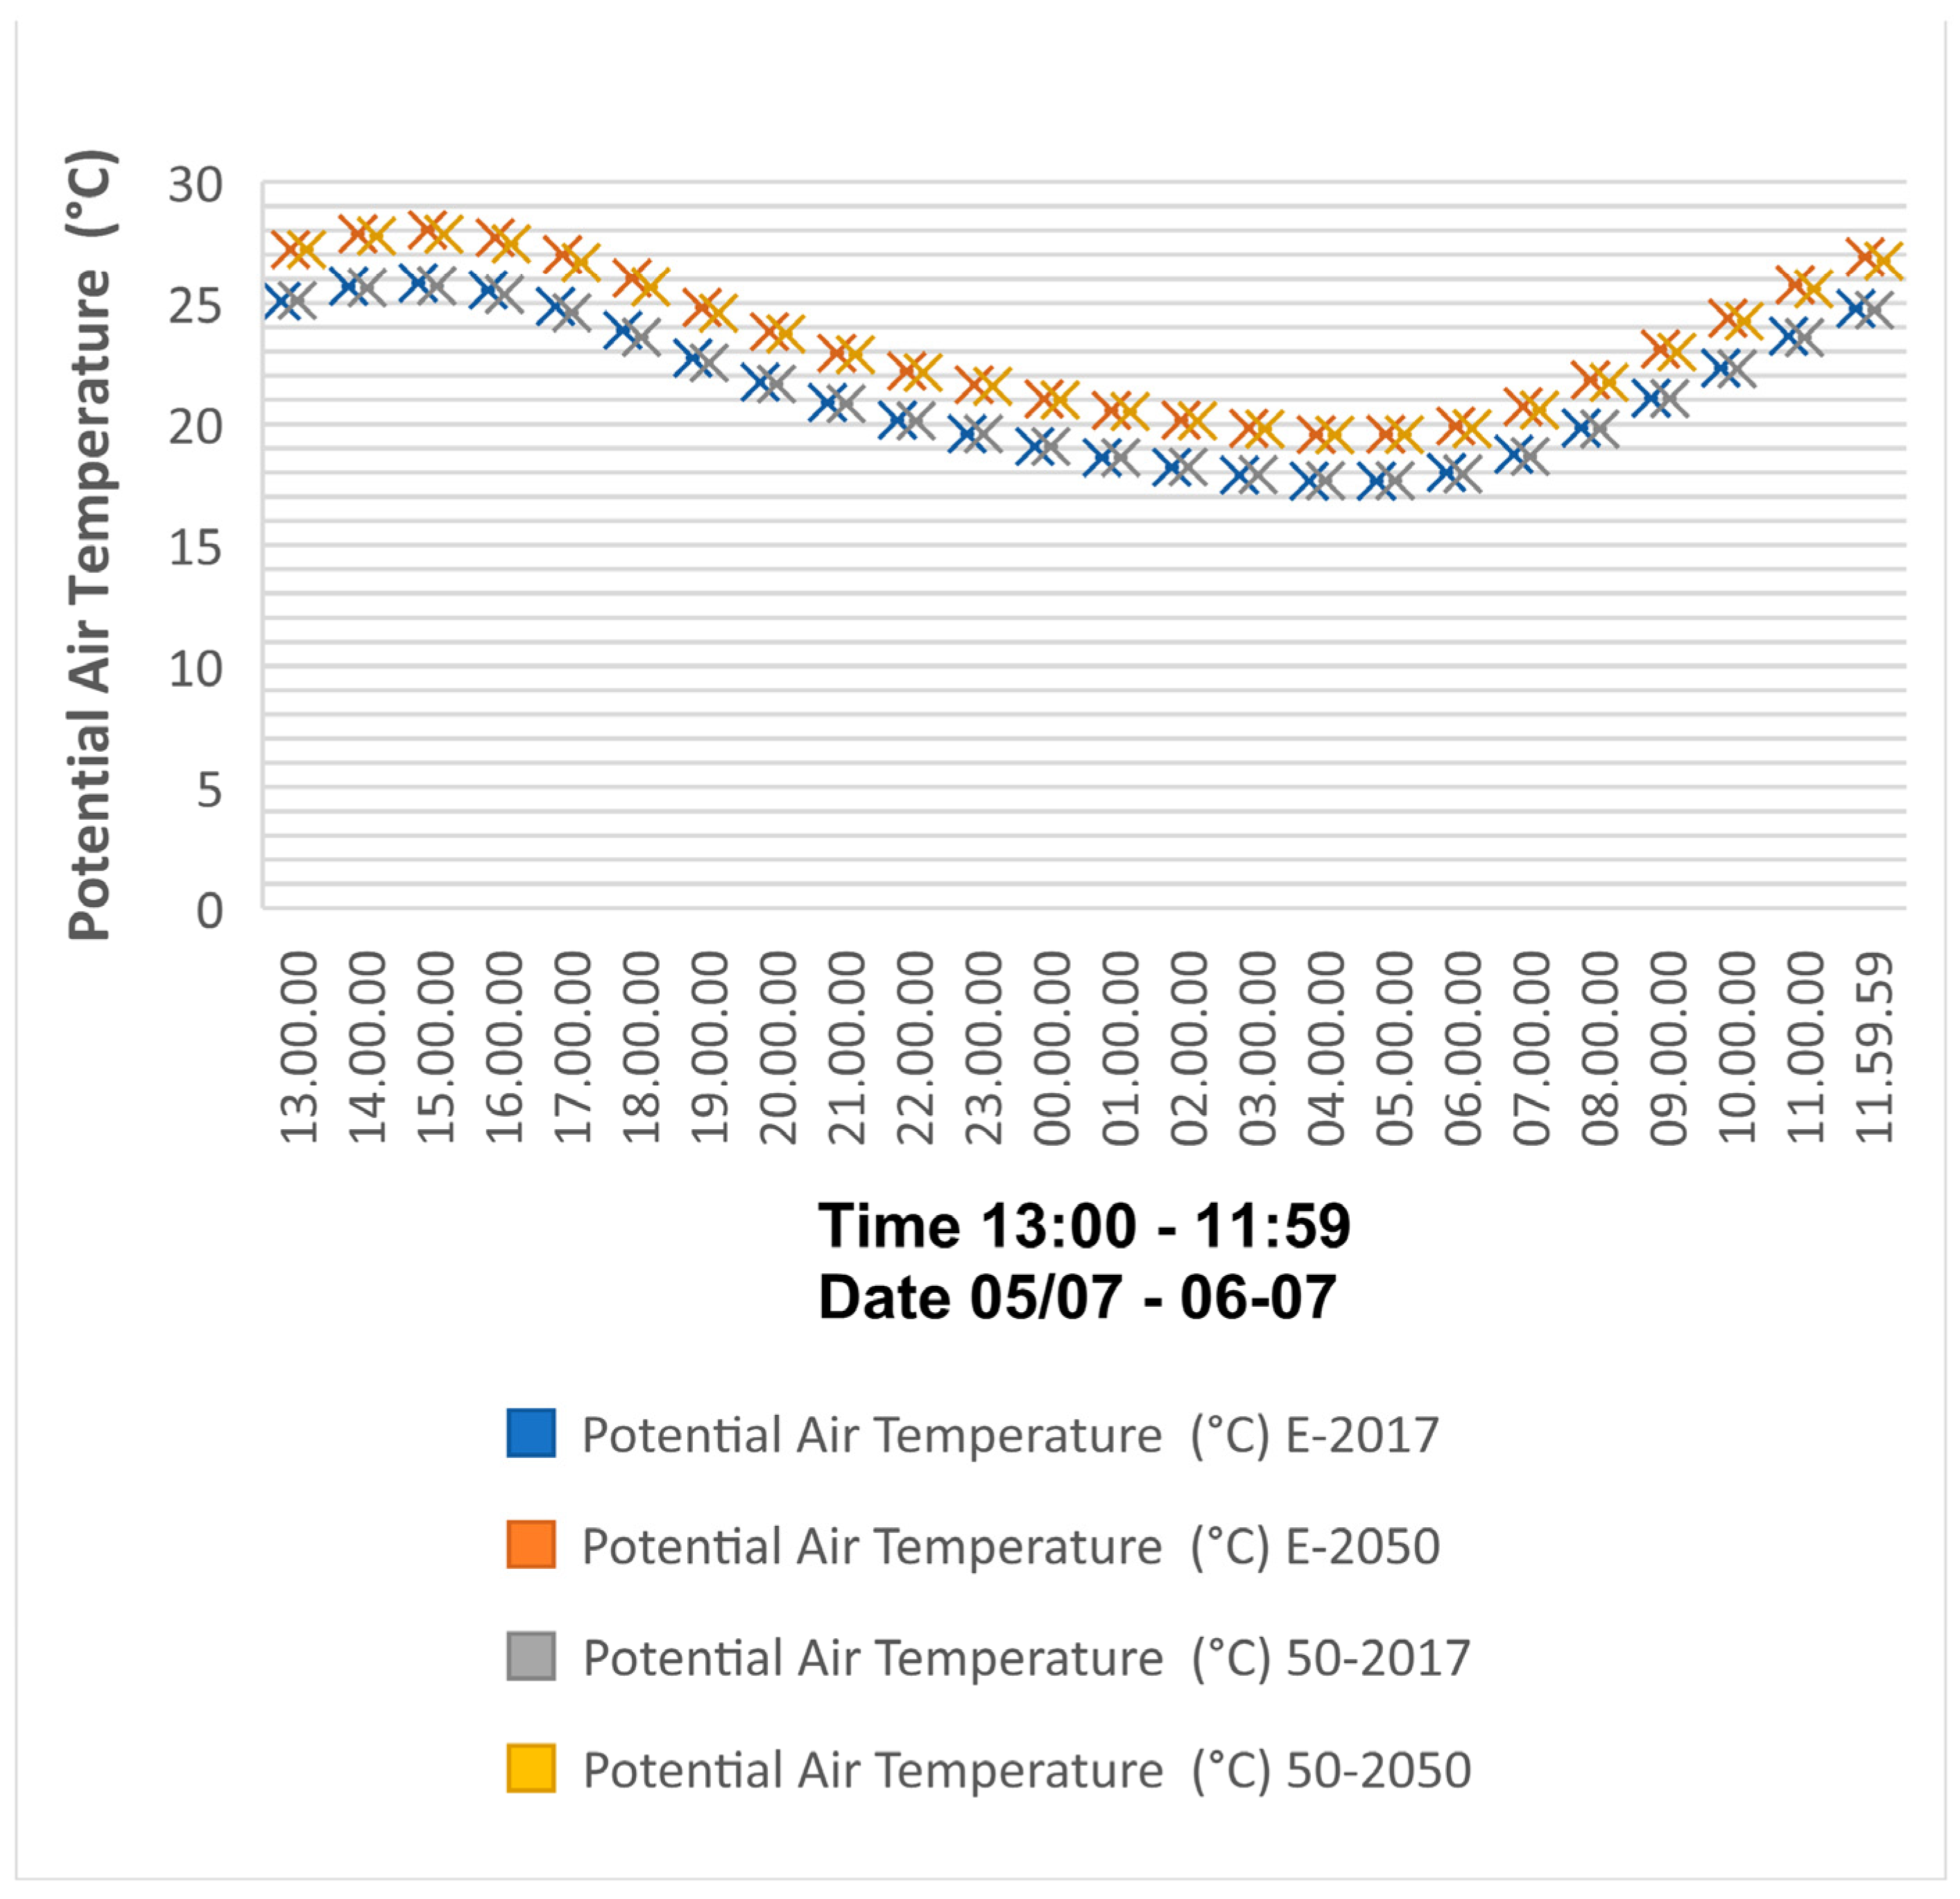
3.6. Potential Air Temperature Changes in Existing and 50% NBS Scenarios

Figure 9 demonstrates the Potential air temperature changes in existing with 50% NBS scenarios. The same changes regarding potential air temperature apply to the comparison between scenario E-2017 and E-2050 with 50-2017 and 50-2050, with a significant increase of about 1.8 degrees. The fluctuations between each scenario in the same year highlight that there is a slight decrease of less than 1 degree between 13:00 to 21:00, an almost equal potential air temperature from 21:00 to 6:00, and an insignificant decrease from 6:00 to 11:59 while comparing E-2017 to 50-2017 and E-2050 to 50-2050. The numbers mentioned in this study are mainly average, and the predicted value of the data is demonstrated in figures.

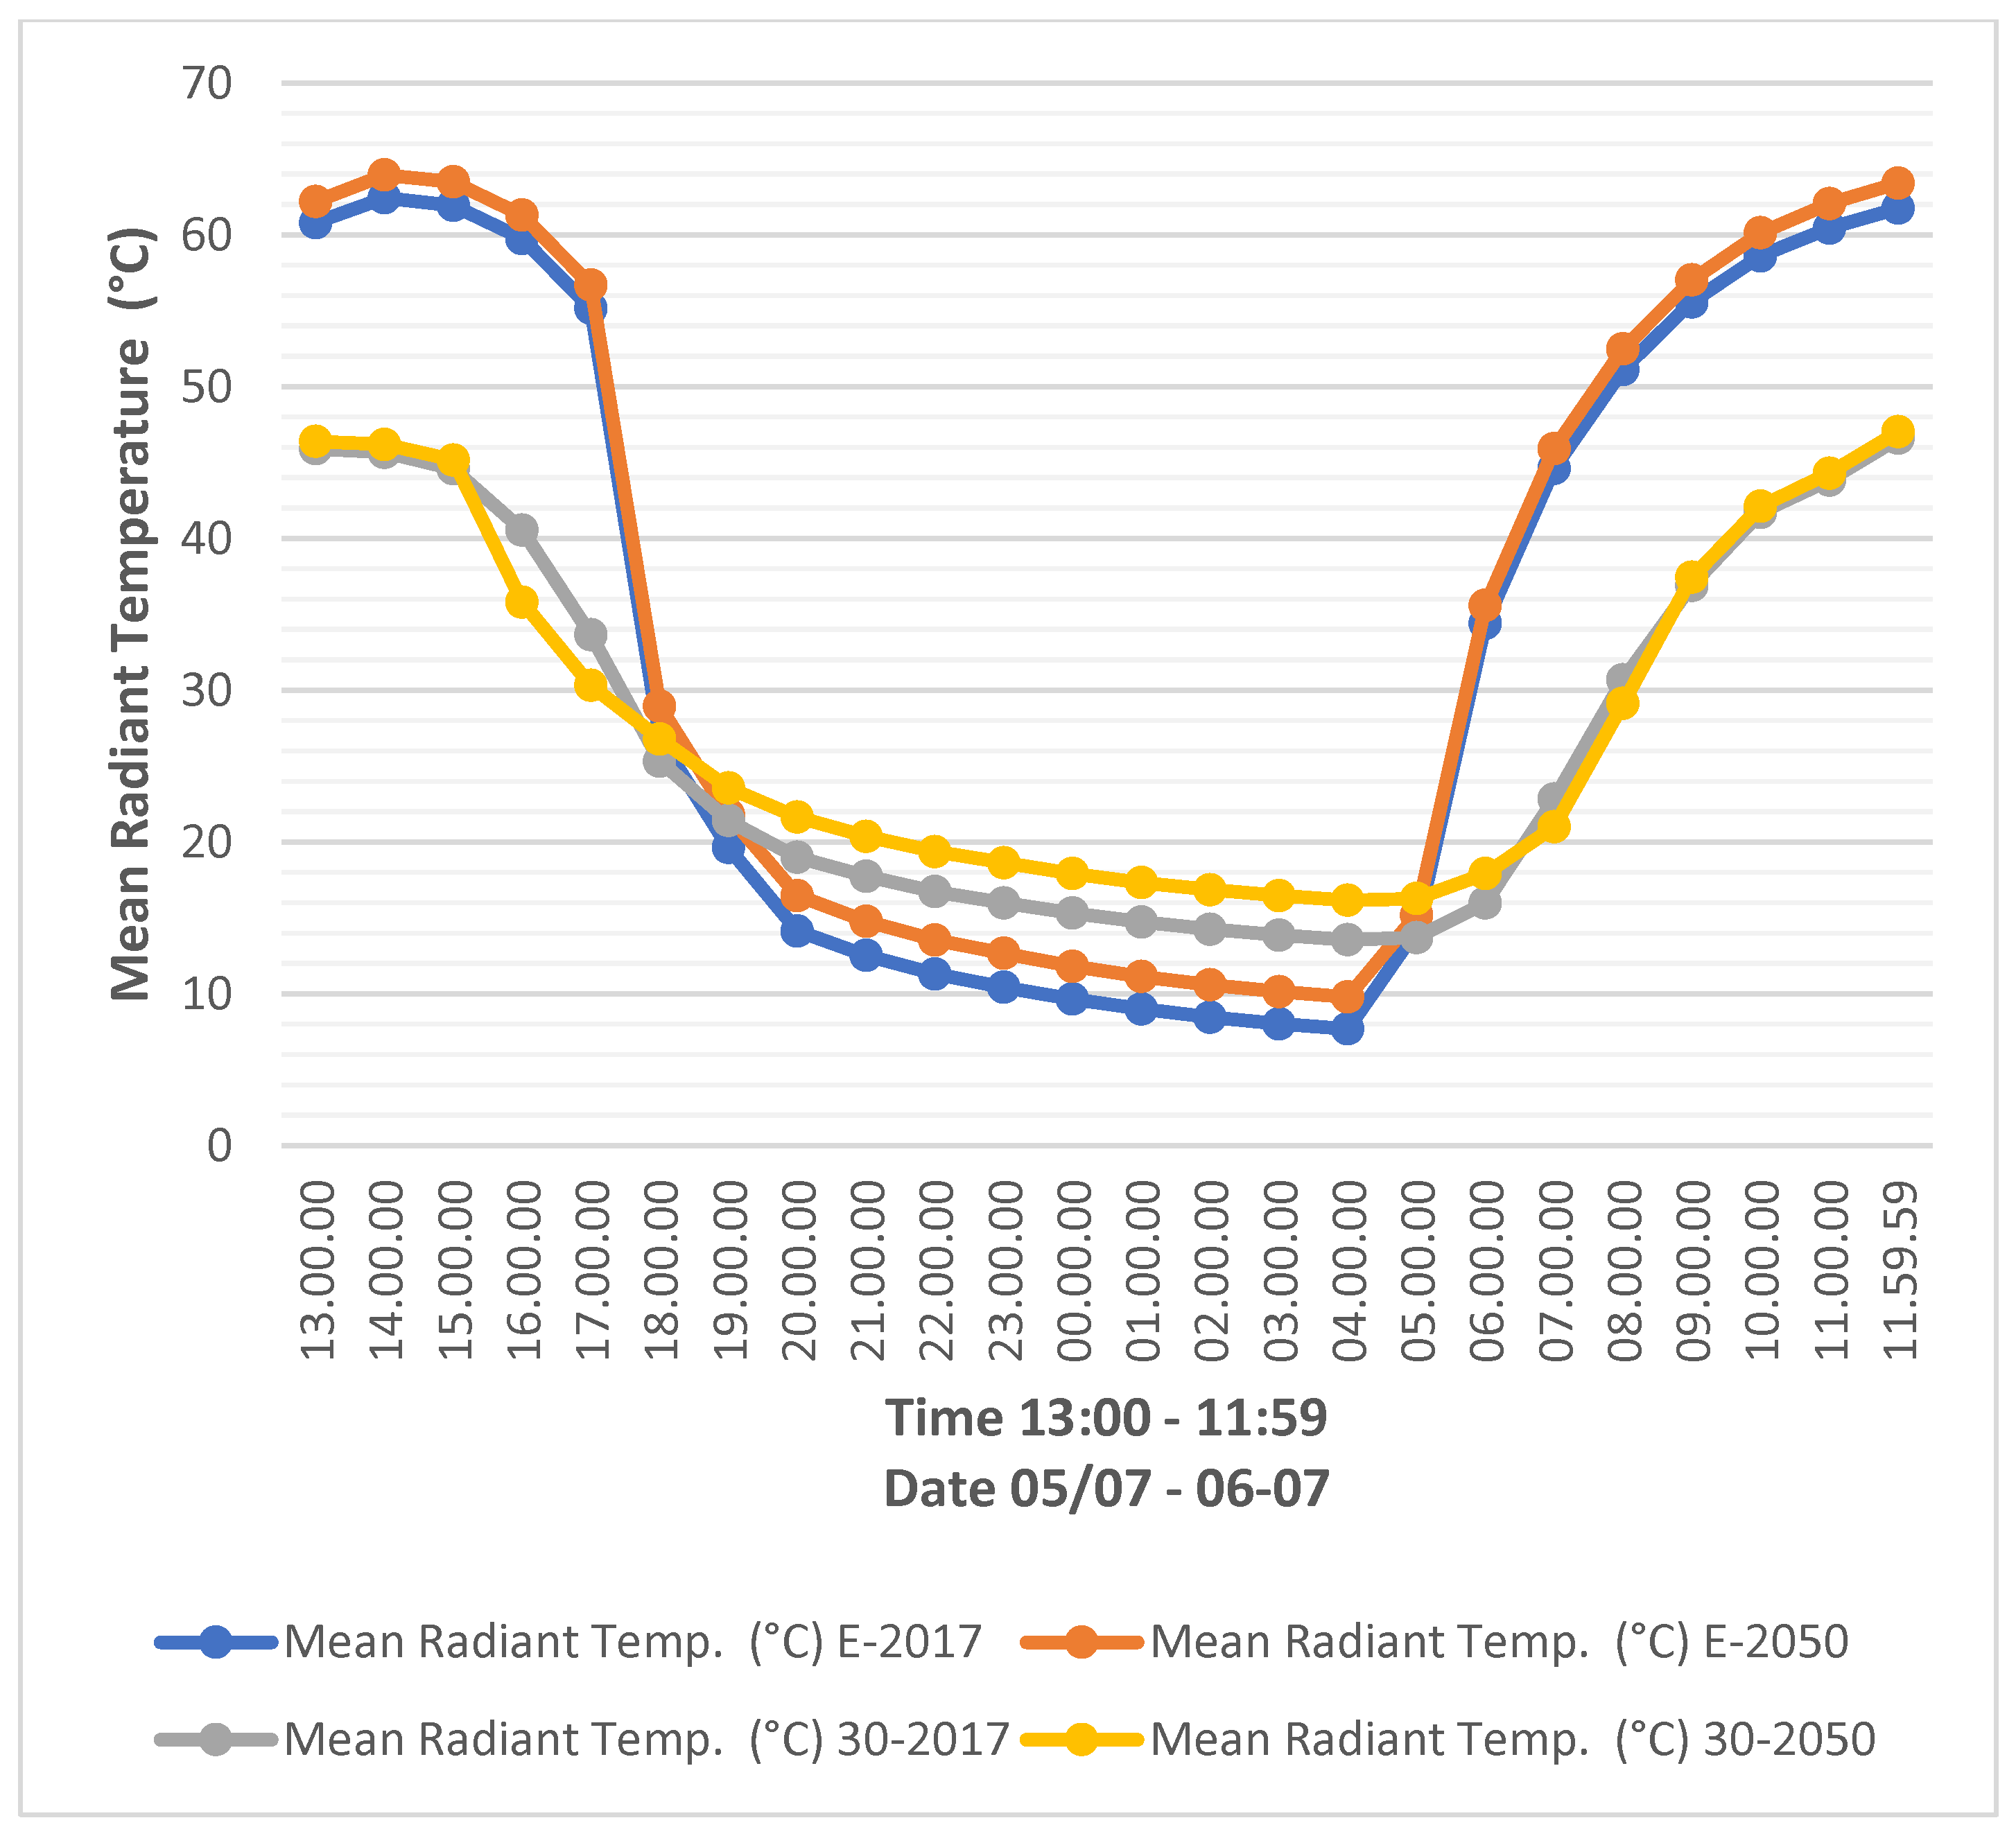
3.7. Mean Radiant Temperature Changes in Existing and 30% NBS Scenarios

Another aspect of thermal comfort and environmental data analysis critical for understanding the benefits of urban regeneration with nature-based solutions is the mean radiant temperature which aims to calculate the transmission of radiant heat between an individual and their surroundings. A drastic decrease can be seen when comparing the existing scenarios E-2017 and E-2050 with 30% NBS implementation in 30-2017 and 30-2050 (Figure 10). This highlights a significant fall of about 15 degrees in mean radiant temperature, which could be due to the increase in the tree canopy and vegetation. The mentioned change in mean radiant temperature occurs from 6:00 to 19:00. Moreover, a decrease in mean radiant temperature with an average of 6 degrees between existing and 30% NBS scenarios adds to the significance of NBS benefits in decreasing mean radiant temperature. This decrease in mean radiant temperature highlights the benefits of this approach.

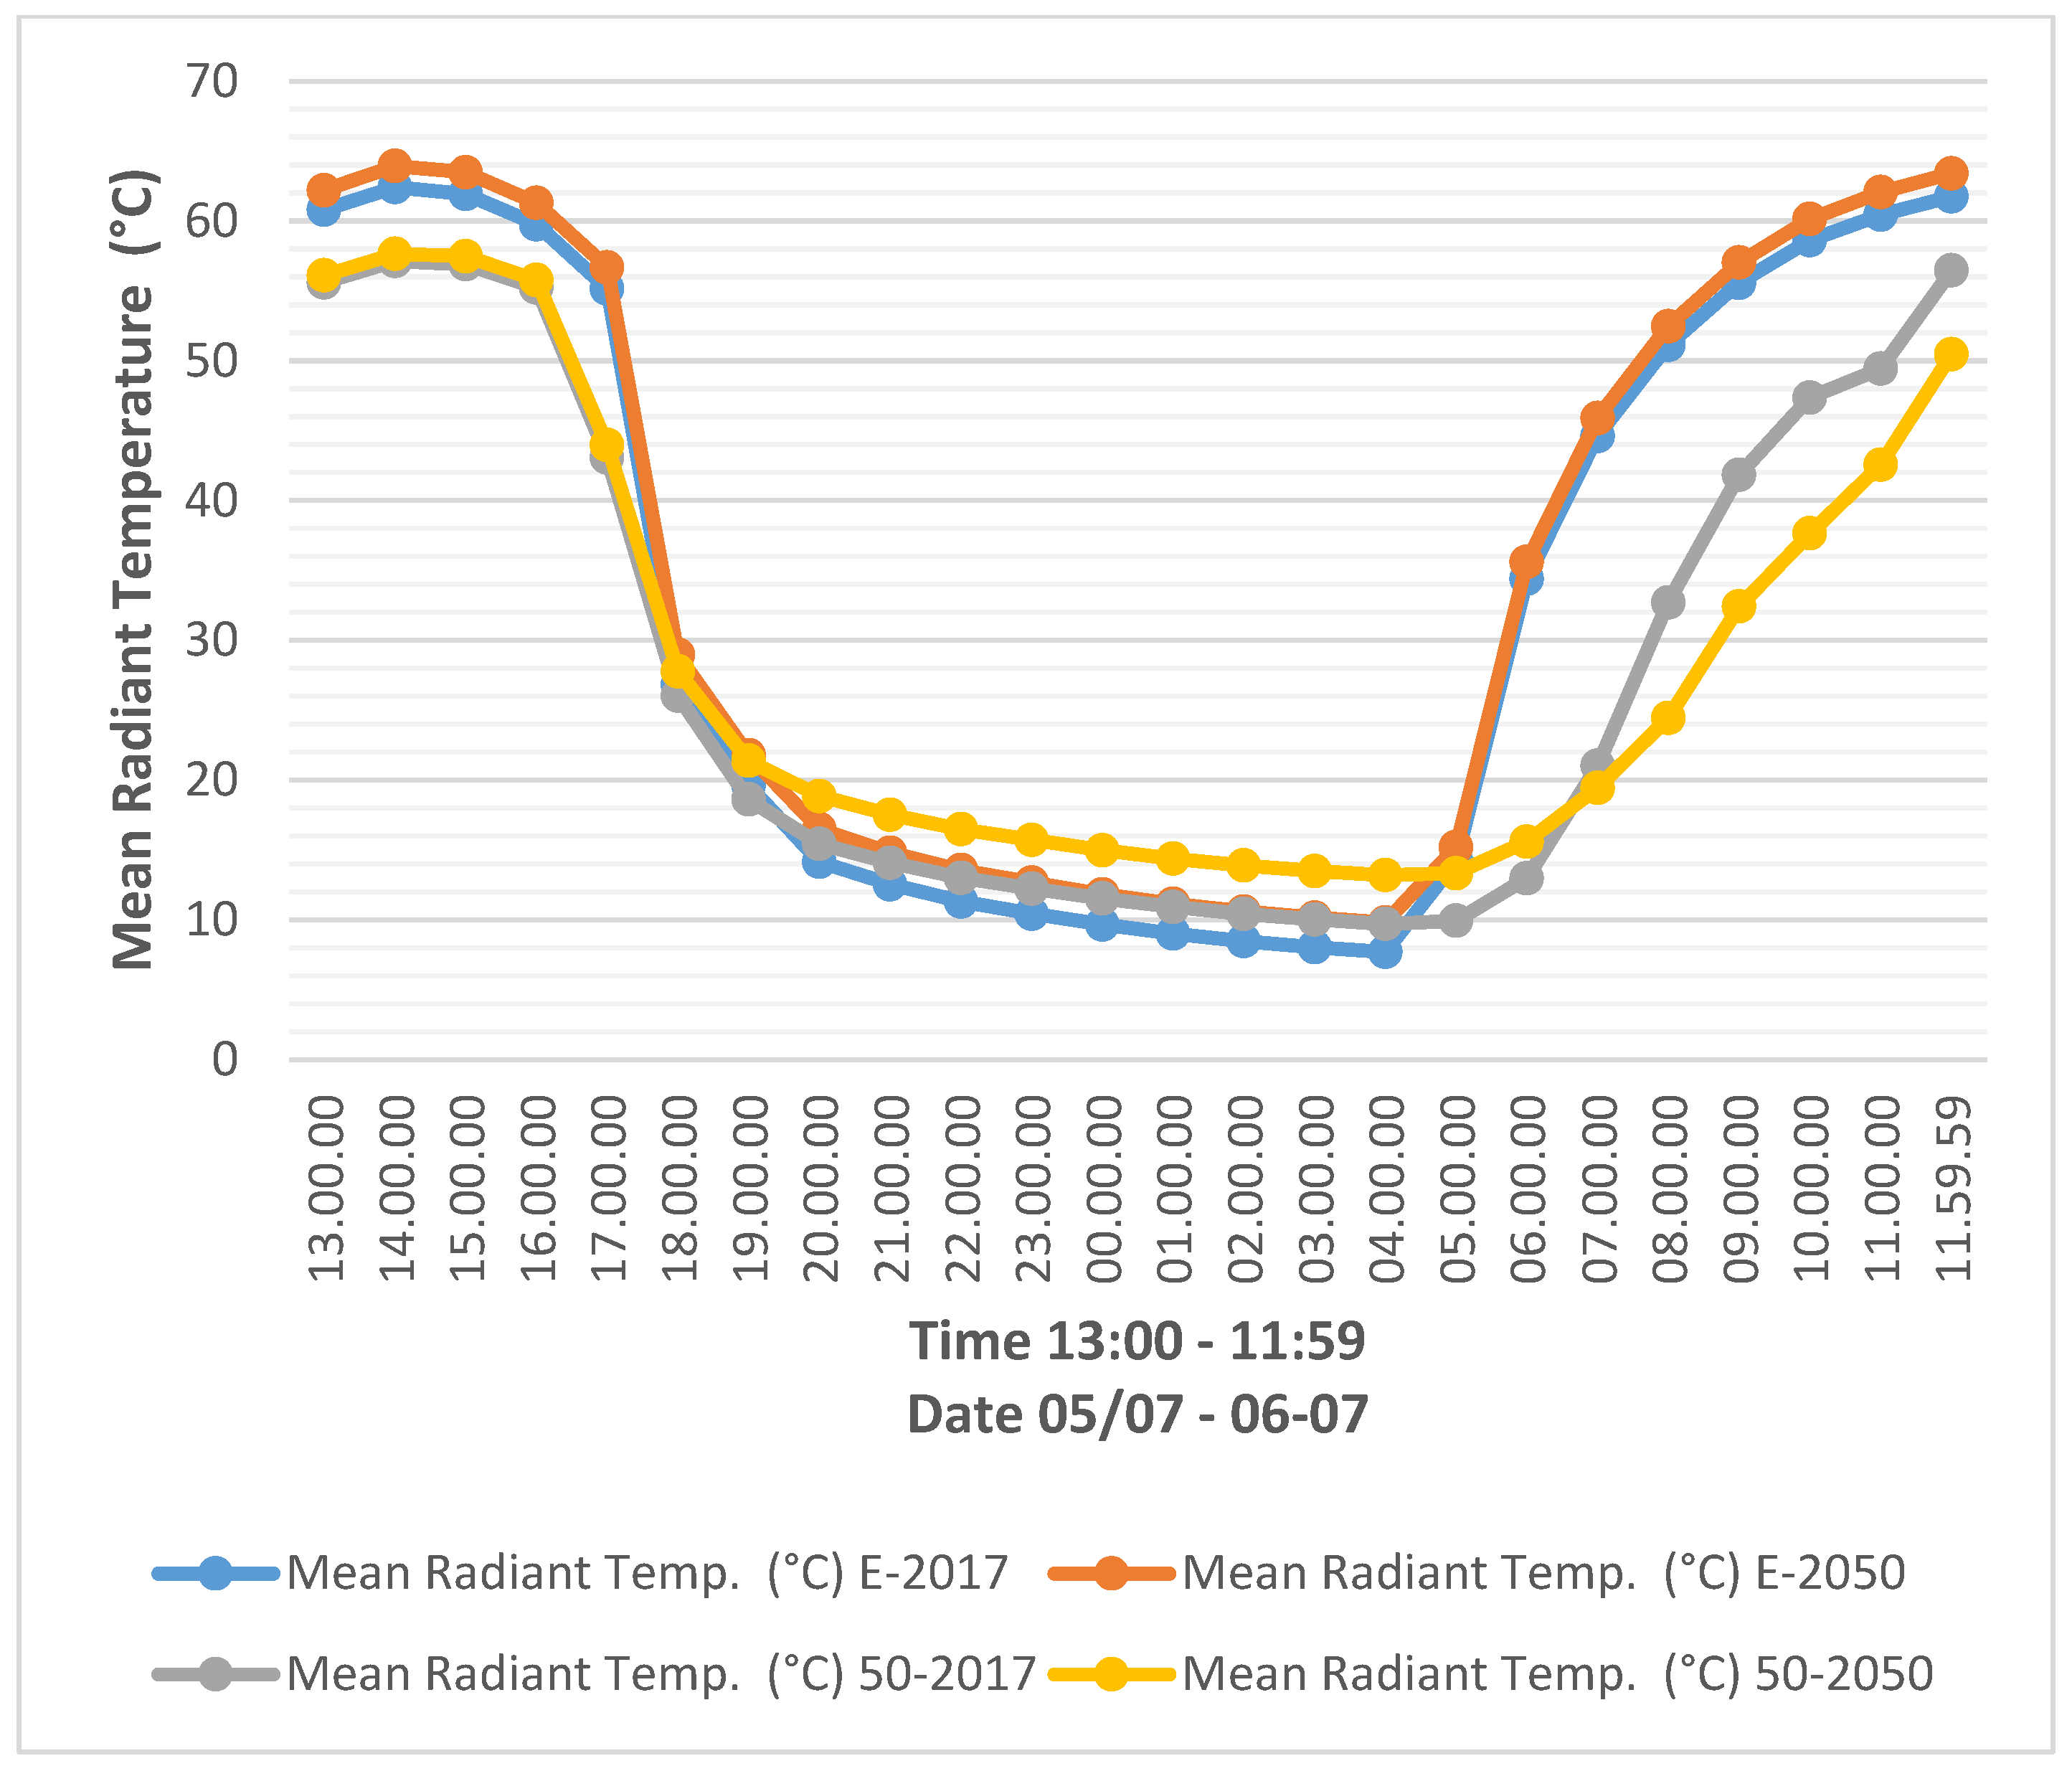
3.8. Mean Radiant Temperature Changes in Existing and 50% NBS Scenarios

Figure 11 illustrates the changes in mean radiant temperature between existing scenarios of E-2017 and E-2050 with 50% nature-based solutions implementation 50-2017 and 50-2050. First, a constant decrease in mean radiant temperature is noticeable in which an average of 6 degrees reduction from 13:00 to 19:00 occurs, and it becomes equal at the point of sunset at 19:00. This reduction in temperature is less significant in comparison to the changes in mean radiant temperature in existing scenarios with 30% nature-based solution implementation. The period from 19:00 to 5:00 demonstrates that the mean radiant temperature has an average of 2 degrees increase when comparing E-2017 with 50-2017, and it also shows that for scenarios E-2050 and 50-2050, this increase is more significant with an average of 3.5 degrees. It should be noted that a fluctuation can be seen in the decreasing temperature from 6 to 11:59 in scenarios 50-2017 and 50-2050 to E-2017 and E-2050 with an average of 13 degrees.

3.9. Mean Radiant Temperature Changes in 30% and 50% NBS Scenarios

The significant difference in mean radiant temperature is noticeable from 13:00 to 18:00, where the illustrated data when comparing both 30% and 50% scenarios in 2017 and 2050 shows that scenarios 30-2017 and 30-2050 have almost 10 degrees decrease in mean radiant temperature ranging from 16 to 36 degrees, while for scenarios 50-2017 and 50-2050, the results show a range between 58 to 36 degrees (Figure 12). The comparison shows that scenarios with 50% nature base solution have almost 3 degrees less regarding scenarios -2017 and E-2050 nearly 3 degrees in scenarios regarding 2050 from 18:00 to 7:00. Lastly, the mean radiant temperature for scenario 50-2050 is constantly the lowest between other scenarios from 7:00 to 11:59, whereas for scenario 50-2017 is the highest.

4. Discussions

4.1. The Potential Microclimatic Benefits of Converting Car Park Spaces into Nature-Based Solutions for Climate-Resilient Spaces

The findings of this study highlight the potential of NBS for enhancing urban climate and thermal comfort. NBS should be considered by urban planners and politicians for future urban regeneration projects. The existing large parking areas with limited vegetation in this study store excessive heat and contribute significantly to UHIs [55]. However, the simulations carried out in this research have produced insightful results regarding the potential effects of regreening these large parking areas and the benefits on urban climate conditions and thermal comfort. These results are essential for understanding the function of NBS in reducing the negative impacts of future heatwaves and enhancing the well-being of city dwellers. We observed that potential air temperature changes in the existing scenarios show an increase of 1 degree by the year 2050. Moreover, the values for both scenarios (existing and with NBS) are projected to surpass 24 degrees. Relative humidity is expected to decrease from 53% in most areas in 2017 to 50.09% in the existing scenario for 2050. In addition, the thermal comfort value (PMV) is set to increase in the central area of the site, reaching 2.18.
The mapped results for scenarios with a 30% implementation of nature-based solutions illustrate a 2 degree increase in potential air temperature from 2017 to 2050. These results emphasise that areas where implementation occurred will experience a higher percentage of relative humidity, averaging 53%.
In contrast, the mean radiant temperature exhibits a drastic decrease when compared to the existing scenario with 30% NBS solutions implemented, surpassing a 14 degree reduction. Conversely, for scenarios with 50% NBS implementation, these changes are, on average, approximately 6 degrees less compared to the existing scenarios. A comparison between scenarios with 30% and 50% NBS implementation highlights that the former has almost 10 degrees lower temperatures than the latter in both 2017 and 2050. The lowest mean radiant temperature results are recorded in the scenario with 50% NBS implementation in 2050 between 18:00 and 7:00. This data pertains to a specific grid location in ENVI-met visualisations, which may vary in other areas. In general, the scenario with 50% NBS implementation yields superior results in terms of reducing mean radiant temperature, PMV value, and preserving relative humidity. The mapped results for thermal comfort value (PMV) demonstrate that using nature-based solutions to regenerate urban grey spaces can have positive effects on future scenarios. These results highlight the direct relationship between PMV value and the type, size, and density of plantings. In scenarios with 50% nature-based solutions, the PMV value decreases in areas where these interventions are implemented, signifying an improvement in thermal comfort. The type, size, and density of plantings have a direct impact on mean radiant temperature and thermal comfort values. Shadowing systems, as part of nature-based solutions, can have a positive influence on temperature change and climate change adaptation, as highlighted by the scenario results with 30% NBS, showing a more significant reduction in mean radiant temperature. Rain gardens, when incorporated into the 30% NBS design scenario, prove to be beneficial for improving thermal comfort values when used in conjunction with trees and other greening strategies. The microclimatic benefits of the rain gardens found in this study are in accordance with a previous study in Virginia, USA, which analysed the microclimate impacts of 12 types of rain garden design scenarios [28]. This highlighted the role of such a typology of NBS in cities, which can be used not only for sustainable drainage systems and pollutant removal [56] but also for improving the microclimate [27]. The results of comparing the changes in potential air temperature for all the scenarios highlight that an increase in potential air temperature will be inevitable. The effects of the implementation of NBS on potential air temperature will be insignificant, with a range of 0.1 to 0.3 degrees, which agrees with the current study of assessing urban heat island mitigation methods in Mandaue [26]. On the other hand, the result for mean radiant temperature illustrates that the drastic decrease will positively affect thermal comfort. This can be linked to the results mapped with ENVI-met in Figure 7, which demonstrates the effects of greening and different strategies on thermal comfort value PMV. These results agree with current studies regarding NBS implementation in cities and the effects of each element on air temperature and thermal comfort [54].

4.2. Opportunities and Challenges in the Reduction of Car Park Spaces for Climate Change Adaptation

Reducing the number of car parking spaces offers a valid approach to increasing tree cover in urban areas and adapting to climate change. As demonstrated in this study, the transformation of car park zones into NBS can enhance thermal comfort and potentially reduce mortality during future heatwaves. In addition, increasing tree cover can help to reduce air pollutants as well as biodiversity [57,58]. Nevertheless, a significant challenge lies in the fact that a considerable portion of the population still heavily rely on private cars. Therefore, policymakers and urban planners must implement parking policies aimed at reducing the dependence on individual automobiles [59]. For example, numerous cities worldwide are initiating a shift away from private cars towards more environmentally friendly and citizen-centric transportation solutions [31]. In Europe, cities such as Hamburg, Oslo, Helsinki, and Madrid have announced their intentions to evolve into (partially) car-free urban areas [31]. In the UK, the Local Government Association organised a roundtable conversation in 2021 to debate the benefits and drawbacks of regenerating town and city cores [60]. The meeting covered a variety of themes, including the reduction of parking spaces. While it was accepted that eliminating these areas could help with emission reduction and be in line with environmental targets, it was also recognised that this strategy might have difficulties attracting people to city centres [60]. This sparked debate over whether extra parking facilities should be included in future expansions, as well as if overall parking capacity should be reduced to encourage greater usage of e-scooters and bicycles [60]. Government assistance, such as the Transforming Cities Fund, was also proposed to improve connectivity between cities and towns and encourage sustainable transport options [60]. A recommendation was also made to reassess road layouts in regeneration plans, prioritising bicycle and pedestrian lanes over cars to build more sustainable and lively urban areas [60].

4.3. Research Limitations and Strengths

The first limitation of this research is that the EPW weather data were not city-specific because the available data were only for the county of Gloucestershire. It is recommended that future research should use site and city-specific data. In addition, future studies should also validate the weather data with ENVI-met outputs. Additionally, more accurate modelling can be achieved by incorporating site-specific tree growth rates to predict future tree growth [53]. To present more precise landscape design guidelines, a more extensive investigation of the impacts of different landscape features and their combinations on outdoor thermal comfort should be performed. Future large-scale research can focus on evaluating various grid points [50] to establish the relationship between independent nature-based solution parts and how it could potentially be used to improve future outcomes. Another limitation is the use of CCWorldWeatherGen [48]. The limitations associated with this tool primarily stem from its reliance on projected weather data. Users must be well-informed about these constraints when working with climate change weather files. While these files are indispensable for planning and renovating structures in preparation for future climate conditions, users need to comprehend the limitations linked to the selected baseline weather data [48]. The specific characteristics present in these baseline weather files may also be reflected in the generated climate change weather data, potentially exerting a more substantial influence than broader uncertainties inherent in climate change modelling [48]. The final limitation pertains to the 3-day design workshop. The initial limitation concerns the time constraint, which may potentially impact the project’s design aspects. Second, the participants and tutors had backgrounds in landscape architecture and urban planning. Considering the complexity of climate change adaptation and mitigation in urban regeneration projects, a robust interdisciplinary approach is required [61]. This approach should involve not only landscape architects and urban planners but also social scientists, architects, arboriculturists, urban foresters, economists, meteorologists, and building engineers [61]. Lastly, our study lacks community involvement, which is essential for understanding the perceptions and preferences of NBS as perceived by the community, who will be the users of these regenerated spaces [17,62].
The strength of this research lies in its methodological rigour, creativity, and robustness, which are demonstrated through the implementation of a locality-specific methodology using the research through design (RtD) approach [36,38].
This approach builds upon earlier research to ensure the validity and robustness of the regeneration process, incorporating urban spaces scenarios for NBS [36,38] and utilising modelled data provided by CCWorldWeatherGen and ENVI-met software.
This methodology is a structured, evidence-based framework that combines scientific testing [36], climate change projections, and creative design. It has resulted in evidence-based design solutions that align with climate-sensitive design approaches.
Furthermore, our research shows that urban space regeneration, combined with a reduction in the number of parking spaces, not only has the potential to reduce urban temperatures and prepare for future heatwaves, but also to convey to policymakers and city planners that there are urban areas where, through appropriate design strategies, it is possible to increase tree coverage and biodiversity. Most importantly, it can meet the new urban forestry standard known as the “3-30-300” rule [63,64]. According to this rule, every home, school, and business should have a view of at least three trees [63]. In addition, the rule highlights that we must guarantee at least a 30% tree canopy in every neighbourhood. Lastly, the 300 in the rule means that every citizen should have access to a public green space within a 300 m radius, approximately a 5 min walk from their residence [63].

5. Conclusions

This study aimed to evaluate the benefits of climate-sensitive design in regenerating a grey urban space with NBS. The ENVI-met software was used to model and analyse the effect of this regreening strategy. The existing built conditions and two scenarios of 30% and 50% nature-based solution implementation, which were the outcomes of a 3-day workshop, were compared and assessed. This study aligns with prior research, affirming the effectiveness of NBS in mitigating mean radiant temperature reduction [65,66]. These NBS interventions have demonstrated significant improvements in the thermal comfort of individuals and have also shown promise in reducing mortality rates during heatwaves [65]. However, it is important to emphasise that this study is limited to a specific car park space in an English town. Nonetheless, when combined with site-specific data, the methodology used in this study can be adapted for application in other places across other countries. This adaptability enables the regeneration of parking areas with NBS to build climate-resilient spaces. In the future, it is very desirable to harness large datasets and use big data analytics to generate the volume and scope of knowledge required to mainstream nature-based solutions, as well as to display and quantify their usefulness in the context of urban regeneration [67]. This approach enables a more thorough worldwide assessment of NBS efficacy [67]. Furthermore, the integration of NBS into the new circular economic model for climate change adaptation has been suggested as a valuable tool for designing climate-resilient cities [68]. Hence, there is a need for further investigation into the potential of NBS to stimulate a holistic model of economic growth in the context of urban regeneration. Additionally, as part of a strategy for climate change adaptation and mitigation, future research might explore the synergies between NBS and other sustainable urban strategies [68]. This might include evaluating the synergies between NBS and sustainable transport and renewable energy infrastructure and supporting a well-rounded strategy for solving urban climate challenges.

Supplementary Materials

The following supporting information can be downloaded at: https://www.mdpi.com/article/10.3390/su152215855/s1.

Author Contributions

Conceptualization, A.R.; methodology, P.T. and A.R.; software, P.T.; formal analysis, P.T.; investigation, P.T. and A.R.; resources, A.R.; data curation, P.T.; writing—original draft preparation, A.R.; writing—review and editing, P.T. and A.R.; visualization, P.T.; supervision, A.R.; project administration, A.R.; funding acquisition, A.R. All authors have read and agreed to the published version of the manuscript.

Funding

This research was funded by the RPA Small Grants at the University of Gloucestershire for the project ‘Designing Climate-Resilient Public Spaces with Nature-Based Solutions’.

Institutional Review Board Statement

This research does not infringe the ethical principles set out in the University of Gloucestershire’s Handbook for Research Ethics.

Data Availability Statement

The data used in this study are available upon request.

Acknowledgments

We extend our gratitude to the participants of the 3-day design workshop. We are immensely grateful to the six reviewers whose invaluable feedback significantly improved the quality of this paper.

Conflicts of Interest

The authors declare no conflict of interest.

References

  1. Abbass, K.; Qasim, M.Z.; Song, H.; Murshed, M.; Mahmood, H.; Younis, I. A review of the global climate change impacts, adaptation, and sustainable mitigation measures. Environ. Sci. Pollut. Res. 2022, 29, 42539–42559. [Google Scholar] [CrossRef]
  2. Shi, W.; Wang, S.; Yang, Q. Climate change and global warming. Rev. Environ. Sci. Bio/Technol. 2010, 9, 99–102. [Google Scholar] [CrossRef]
  3. Norton, B.A.; Coutts, A.M.; Livesley, S.J.; Harris, R.J.; Hunter, A.M.; Williams, N.S.G. Planning for cooler cities: A framework to prioritise green infrastructure to mitigate high temperatures in urban landscapes. Landsc. Urban Plan. 2015, 134, 127–138. [Google Scholar] [CrossRef]
  4. Croeser, T.; Garrard, G.E.; Visintin, C.; Kirk, H.; Ossola, A.; Furlong, C.; Clements, R.; Butt, A.; Taylor, E.; Bekessy, S.A. Finding space for nature in cities: The considerable potential of redundant car parking. npj Urban Sustain. 2022, 2, 27. [Google Scholar] [CrossRef]
  5. Oke, T.R. The energetic basis of the urban heat island. Q. J. R. Meteorol. Soc. 1982, 108, 1–24. [Google Scholar] [CrossRef]
  6. Koppe, C.; Kovats, S.; Jendritzky, G.; Menne, B. Heat-Waves: Risks and Responses; Health and Global Environmental Change Series, No. 2; World Health Organization, Regional Office for Europe: København, Denmark, 2004. [Google Scholar]
  7. Katila, P.; Colfer, C.J.P.; de Jong, W.; Galloway, G.; Pacheco, P.; Winkel, G. (Eds.) Sustainable Development Goals: Their Impacts on Forests and People; Life Sciences; Cambridge University Press: Cambridge, UK, 2019; ISBN 9781108765015. [Google Scholar]
  8. Taylor, K. Europe Has World’s Highest Death Rate from Heatwaves: Study. Available online: https://www.euractiv.com/section/climate-environment/news/europe-has-highest-share-of-global-deaths-from-heatwaves-and-air-pollution-study/ (accessed on 20 September 2023).
  9. Public Health England. PHE Heatwave Mortality Monitoring—Summer 2017; Public Health England: London, UK, 2019. [Google Scholar]
  10. Basu, R. High ambient temperature and mortality: A review of epidemiologic studies from 2001 to 2008. Environ. Health 2009, 8, 40. [Google Scholar] [CrossRef] [PubMed]
  11. Russo, A.; Cirella, G.T. Urban Sustainability: Integrating Ecology in City Design and Planning. In Sustainable Human–Nature Relations: Environmental Scholarship, Economic Evaluation, Urban Strategies; Cirella, G.T., Ed.; Springer: Singapore, 2020; pp. 187–204. ISBN 978-981-15-3049-4. [Google Scholar]
  12. Marvuglia, A.; Koppelaar, R.; Rugani, B. The effect of green roofs on the reduction of mortality due to heatwaves: Results from the application of a spatial microsimulation model to four European cities. Ecol. Modell. 2020, 438, 109351. [Google Scholar] [CrossRef]
  13. Iungman, T.; Cirach, M.; Marando, F.; Pereira Barboza, E.; Khomenko, S.; Masselot, P.; Quijal-Zamorano, M.; Mueller, N.; Gasparrini, A.; Urquiza, J.; et al. Cooling cities through urban green infrastructure: A health impact assessment of European cities. Lancet 2023, 401, 577–589. [Google Scholar] [CrossRef]
  14. Palazzo, E.; Rani, W.N.M.W.M. Regenerating Urban Areas Through Climate Sensitive Urban Design. Adv. Sci. Lett. 2017, 23, 6394–6398. [Google Scholar] [CrossRef]
  15. Mokhtari, Z.; Barghjelveh, S.; Sayahnia, R.; Karami, P.; Qureshi, S.; Russo, A. Spatial pattern of the green heat sink using patch- and network-based analysis: Implication for urban temperature alleviation. Sustain. Cities Soc. 2022, 83, 103964. [Google Scholar] [CrossRef]
  16. Sessa, M.R.; Russo, A.; Sica, F. Opinion paper on green deal for the urban regeneration of industrial brownfield land in Europe. Land Use Policy 2022, 119, 106198. [Google Scholar] [CrossRef]
  17. McCarthy, L.J.; Russo, A. Exploring the role of nature-based typologies and stewardship schemes in enhancing urban green spaces: Citizen perceptions of landscape design scenarios and ecosystem services. J. Environ. Manag. 2023, 346, 118944. [Google Scholar] [CrossRef]
  18. Kumar, P.; Debele, S.E.; Sahani, J.; Rawat, N.; Marti-Cardona, B.; Alfieri, S.M.; Basu, B.; Basu, A.S.; Bowyer, P.; Charizopoulos, N.; et al. Nature-based solutions efficiency evaluation against natural hazards: Modelling methods, advantages and limitations. Sci. Total Environ. 2021, 784, 147058. [Google Scholar] [CrossRef]
  19. Gómez, G.; Frutos, B.; Alonso, C.; Martín-Consuegra, F.; Oteiza, I.; De Frutos, F.; Castellote, M.M.; Muñoz, J.; Torre, S.; Fermoso, J.; et al. Selection of nature-based solutions to improve comfort in schools during heat waves. Int. J. Energy Prod. Manag. 2021, 6, 157–169. [Google Scholar] [CrossRef]
  20. Goodwin, S.; Olazabal, M.; Castro, A.J.; Pascual, U. Global mapping of urban nature-based solutions for climate change adaptation. Nat. Sustain. 2023, 6, 458–469. [Google Scholar] [CrossRef]
  21. Kiddle, G.L.; Bakineti, T.; Latai-Niusulu, A.; Missack, W.; Pedersen Zari, M.; Kiddle, R.; Chanse, V.; Blaschke, P.; Loubser, D. Nature-Based Solutions for Urban Climate Change Adaptation and Wellbeing: Evidence and Opportunities From Kiribati, Samoa, and Vanuatu. Front. Environ. Sci. 2021, 9, 442. [Google Scholar] [CrossRef]
  22. Zardo, L.; Geneletti, D.; Pérez-Soba, M.; Van Eupen, M. Estimating the cooling capacity of green infrastructures to support urban planning. Ecosyst. Serv. 2017, 26, 225–235. [Google Scholar] [CrossRef]
  23. Grace, M.; Balzan, M.; Collier, M.; Geneletti, D.; Tomaskinova, J.; Abela, R.; Borg, D.; Buhagiar, G.; Camilleri, L.; Cardona, M.; et al. Priority knowledge needs for implementing nature-based solutions in the Mediterranean islands. Environ. Sci. Policy 2021, 116, 56–68. [Google Scholar] [CrossRef]
  24. Furchtlehner, J.; Lehner, D.; Lička, L. Sustainable Streetscapes: Design Approaches and Examples of Viennese Practice. Sustainability 2022, 14, 961. [Google Scholar] [CrossRef]
  25. Fahmy, M.; Ibrahim, Y.; Hanafi, E.; Barakat, M. Would LEED-UHI greenery and high albedo strategies mitigate climate change at neighborhood scale in Cairo, Egypt? Build. Simul. 2018, 11, 1273–1288. [Google Scholar] [CrossRef]
  26. Cortes, A.; Rejuso, A.J.; Santos, J.A.; Blanco, A. Evaluating mitigation strategies for urban heat island in Mandaue City using ENVI-met. J. Urban Manag. 2022, 11, 97–106. [Google Scholar] [CrossRef]
  27. Kridakorn Na Ayutthaya, T.; Suropan, P.; Sundaranaga, C.; Phichetkunbodee, N.; Anambutr, R.; Suppakittpaisarn, P.; Rinchumphu, D. The influence of bioretention assets on outdoor thermal comfort in the urban area. Energy Rep. 2023, 9, 287–294. [Google Scholar] [CrossRef]
  28. Ge, M.; Huang, Y.; Zhu, Y.; Kim, M.; Cui, X. Examining the Microclimate Pattern and Related Spatial Perception of the Urban Stormwater Management Landscape: The Case of Rain Gardens. Atmosphere 2023, 14, 1138. [Google Scholar] [CrossRef]
  29. Oke, T.; Mills, G.; Christen, A.; Voogt, J. Climate-Sensitive Design. In Urban Climates; Cambridge University Press: Cambridge, UK, 2017; pp. 408–452. [Google Scholar]
  30. Lin, P.; Song, D.; Qin, H. Impact of parking and greening design strategies on summertime outdoor thermal condition in old mid-rise residential estates. Urban For. Urban Green. 2021, 63, 127200. [Google Scholar] [CrossRef]
  31. Nieuwenhuijsen, M.J.; Khreis, H. Car free cities: Pathway to healthy urban living. Environ. Int. 2016, 94, 251–262. [Google Scholar] [CrossRef] [PubMed]
  32. Poorthuis, A.; Zook, M. Moving the 15-minute city beyond the urban core: The role of accessibility and public transport in the Netherlands. J. Transp. Geogr. 2023, 110, 103629. [Google Scholar] [CrossRef]
  33. Xu, Z.; FitzGerald, G.; Guo, Y.; Jalaludin, B.; Tong, S. Impact of heatwave on mortality under different heatwave definitions: A systematic review and meta-analysis. Environ. Int. 2016, 89–90, 193–203. [Google Scholar] [CrossRef]
  34. Huang, X.; Yao, R.; Xu, T.; Zhang, S. The impact of heatwaves on human perceived thermal comfort and thermal resilience potential in urban public open spaces. Build. Environ. 2023, 242, 110586. [Google Scholar] [CrossRef]
  35. Climate Data Cheltenham Data. Available online: https://en.climate-data.org/europe/united-kingdom/england/cheltenham-6563/ (accessed on 29 September 2023).
  36. Cortesão, J.; Lenzholzer, S. Research through design in urban and landscape design practice. J. Urban Des. 2022, 27, 617–633. [Google Scholar] [CrossRef]
  37. Lenzholzer, S.; Duchhart, I.; Koh, J. ‘Research through designing’ in landscape architecture. Landsc. Urban Plan. 2013, 113, 120–127. [Google Scholar] [CrossRef]
  38. Lenzholzer, S.; Brown, R.D. Post-positivist microclimatic urban design research: A review. Landsc. Urban Plan. 2016, 153, 111–121. [Google Scholar] [CrossRef]
  39. Lenzholzer, S. Research and design for thermal comfort in Dutch urban squares. Resour. Conserv. Recycl. 2012, 64, 39–48. [Google Scholar] [CrossRef]
  40. Cortesão, J.; Lenzholzer, S.; Klok, L.; Jacobs, C.; Kluck, J. Generating applicable urban design knowledge. J. Urban Des. 2020, 25, 293–307. [Google Scholar] [CrossRef]
  41. Tsoka, S.; Tsikaloudaki, A.; Theodosiou, T. Analyzing the ENVI-met microclimate model’s performance and assessing cool materials and urban vegetation applications—A review. Sustain. Cities Soc. 2018, 43, 55–76. [Google Scholar] [CrossRef]
  42. Bruse, M.; Fleer, H. Simulating surface–plant–air interactions inside urban environments with a three dimensional numerical model. Environ. Model. Softw. 1998, 13, 373–384. [Google Scholar] [CrossRef]
  43. Fahed, J.; Kinab, E.; Ginestet, S.; Adolphe, L. Impact of urban heat island mitigation measures on microclimate and pedestrian comfort in a dense urban district of Lebanon. Sustain. Cities Soc. 2020, 61, 102375. [Google Scholar] [CrossRef]
  44. Abdallah, A.S.H.; Hussein, S.W.; Nayel, M. The impact of outdoor shading strategies on student thermal comfort in open spaces between education building. Sustain. Cities Soc. 2020, 58, 102124. [Google Scholar] [CrossRef]
  45. Jing, L.; Liang, Y. The impact of tree clusters on air circulation and pollutant diffusion-urban micro scale environmental simulation based on ENVI-met. IOP Conf. Ser. Earth Environ. Sci. 2021, 657, 012008. [Google Scholar] [CrossRef]
  46. Alves, F.M.; Gonçalves, A.; del Caz-Enjuto, M.R. The Use of Envi-Met for the Assessment of Nature-Based Solutions’ Potential Benefits in Industrial Parks—A Case Study of Argales Industrial Park (Valladolid, Spain). Infrastructures 2022, 7, 85. [Google Scholar] [CrossRef]
  47. Climate.OneBuilding. Index of /WMO_Region_6_Europe/GBR_United_Kingdom/ENG_England. Available online: https://climate.onebuilding.org/WMO_Region_6_Europe/GBR_United_Kingdom/ENG_England/ (accessed on 28 September 2023).
  48. Jentsch, M.F.; Bahaj, A.S.; James, P.A.B. Climate change future proofing of buildings—Generation and assessment of building simulation weather files. Energy Build. 2008, 40, 2148–2168. [Google Scholar] [CrossRef]
  49. Hirons, A.; Sjöman, H. Tree Species Selection for Green Infrastructure: A Guide for Specifiers; Trees and Design Action Group Trust: London, UK, 2019; ISBN 9780992868642.
  50. Crank, P.J.; Sailor, D.J.; Ban-Weiss, G.; Taleghani, M. Evaluating the ENVI-met microscale model for suitability in analysis of targeted urban heat mitigation strategies. Urban Clim. 2018, 26, 188–197. [Google Scholar] [CrossRef]
  51. ENVI-met. Thermal Comfort Indices Provided by BIO-met. Available online: https://envi-met.info/doku.php?id=apps:biomet (accessed on 24 October 2023).
  52. Jamei, E.; Rajagopalan, P.; Seyedmahmoudian, M.; Jamei, Y. Review on the impact of urban geometry and pedestrian level greening on outdoor thermal comfort. Renew. Sustain. Energy Rev. 2016, 54, 1002–1017. [Google Scholar] [CrossRef]
  53. Klemm, W.; Heusinkveld, B.G.; Lenzholzer, S.; van Hove, B. Street greenery and its physical and psychological impact on thermal comfort. Landsc. Urban Plan. 2015, 138, 87–98. [Google Scholar] [CrossRef]
  54. Yang, J.; Zhao, Y.; Zou, Y.; Xia, D.; Lou, S.; Guo, T.; Zhong, Z. Improving the Thermal Comfort of an Open Space via Landscape Design: A Case Study in Hot and Humid Areas. Atmosphere 2022, 13, 1604. [Google Scholar] [CrossRef]
  55. Lehmann, S. Green Urban Futures. In The Routledge Companion to Ecological Design Thinking; Routledge: New York, NY, USA, 2022; pp. 184–197. ISBN 9781003183181. [Google Scholar]
  56. Russo, A.; Speak, A.; Dadea, C.; Fini, A.; Borruso, L.; Ferrini, F.; Zerbe, S. Influence of different ornamental shrubs on the removal of heavy metals in a stormwater bioretention system. Adv. Hortic. Sci. 2019, 33, 605–612. [Google Scholar]
  57. Russo, A.; Chan, W.T.; Cirella, G.T. Estimating Air Pollution Removal and Monetary Value for Urban Green Infrastructure Strategies Using Web-Based Applications. Land 2021, 10, 788. [Google Scholar] [CrossRef]
  58. Jim, C.Y.; Chen, W.Y. Assessing the ecosystem service of air pollutant removal by urban trees in Guangzhou (China). J. Environ. Manag. 2008, 88, 665–676. [Google Scholar] [CrossRef] [PubMed]
  59. Al-Fouzan, S.A. Using car parking requirements to promote sustainable transport development in the Kingdom of Saudi Arabia. Cities 2012, 29, 201–211. [Google Scholar] [CrossRef]
  60. LGA. Town and City Centre Regeneration: Opportunities and Challenges. 12 May 2021. Available online: https://www.local.gov.uk/town-and-city-centre-regeneration-opportunities-and-challenges-12-may-2021 (accessed on 29 September 2023).
  61. Masson, V.; Marchadier, C.; Adolphe, L.; Aguejdad, R.; Avner, P.; Bonhomme, M.; Bretagne, G.; Briottet, X.; Bueno, B.; de Munck, C.; et al. Adapting cities to climate change: A systemic modelling approach. Urban Clim. 2014, 10, 407–429. [Google Scholar] [CrossRef]
  62. Sturiale, L.; Scuderi, A.; Timpanaro, G. Citizens’ perception of the role of urban nature-based solutions and green infrastructures towards climate change in Italy. Front. Environ. Sci. 2023, 11, 1105446. [Google Scholar] [CrossRef]
  63. Konijnendijk, C.C. Evidence-based guidelines for greener, healthier, more resilient neighbourhoods: Introducing the 3–30–300 rule. J. For. Res. 2023, 34, 821–830. [Google Scholar] [CrossRef] [PubMed]
  64. Nieuwenhuijsen, M.J.; Dadvand, P.; Márquez, S.; Bartoll, X.; Barboza, E.P.; Cirach, M.; Borrell, C.; Zijlema, W.L. The evaluation of the 3-30-300 green space rule and mental health. Environ. Res. 2022, 215, 114387. [Google Scholar] [CrossRef]
  65. Coseo, P.; Hamstead, Z. Just, nature-based solutions as critical urban infrastructure for cooling and cleaning airsheds. In Nature-Based Solutions for Cities; McPhearson, T., Kabisch, N., Frantzeskaki, N., Eds.; Edward Elgar Publishing Limited: Cheltenham, UK, 2023; pp. 105–145. ISBN 9781800376762. [Google Scholar]
  66. Epelde, L.; Mendizabal, M.; Gutiérrez, L.; Artetxe, A.; Garbisu, C.; Feliu, E. Quantification of the environmental effectiveness of nature-based solutions for increasing the resilience of cities under climate change. Urban For. Urban Green. 2022, 67, 127433. [Google Scholar] [CrossRef]
  67. Frantzeskaki, N.; McPhearson, T.; Collier, M.J.; Kendal, D.; Bulkeley, H.; Dumitru, A.; Walsh, C.; Noble, K.; van Wyk, E.; Ordóñez, C.; et al. Nature-Based Solutions for Urban Climate Change Adaptation: Linking Science, Policy, and Practice Communities for Evidence-Based Decision-Making. Bioscience 2019, 69, 455–466. [Google Scholar] [CrossRef]
  68. Stefanakis, A.I.; Calheiros, C.S.C.; Nikolaou, I. Nature-Based Solutions as a Tool in the New Circular Economic Model for Climate Change Adaptation. Circ. Econ. Sustain. 2021, 1, 303–318. [Google Scholar] [CrossRef]
Figure 1. Site location of North-Place car park in Cheltenham (Source: Google Earth, 2023).
Sustainability 15 15855 g001
Figure 2. Design scenario with 30% nature-based implementation outcome.
Sustainability 15 15855 g002
Figure 3. Design scenario with 50% nature-based implementation outcome.
Sustainability 15 15855 g003
Figure 4. Mapped results from ENVI-met using Leonardo tool for comparison of existing scenarios 2017 and 2050. (Larger and more readable versions of these images can be found in the Supplementary Material).
Sustainability 15 15855 g004
Figure 5. Mapped results from, ENVI-met using Leonardo tool for comparison of 30% NBS scenarios 2017 and 2050 (Larger and more readable versions of these images can be found in the Supplementary Material).
Sustainability 15 15855 g005
Figure 6. Mapped results from, ENVI-met using Leonardo tool for comparison of 50% NBS scenarios 2017 and 2050. (Larger and more readable versions of these images can be found in the Supplementary Material).
Sustainability 15 15855 g006
Figure 7. PMV value mapped for each scenario in 2017 and 2050. (Larger and more readable versions of these images can be found in the Supplementary Material).
Sustainability 15 15855 g007
Figure 8. Chart showing potential air temperature for existing scenarios and 30% NBS in 2017 and 2050.
Sustainability 15 15855 g008
Figure 9. Chart showing potential air temperature for existing scenarios and 50% NBS in 2017 and 2050.
Sustainability 15 15855 g009
Figure 10. Chart showing mean radiant temperature for existing scenarios and 30% NBS in 2017 and 2050.
Sustainability 15 15855 g010
Figure 11. Chart showing mean radiant temperature for existing scenarios and 50% NBS in 2017 and 2050.
Sustainability 15 15855 g011
Figure 12. Chart showing mean radiant temperature for 30% NBS scenarios and 50% NBS in 2017 and 2050.
Sustainability 15 15855 g012
Disclaimer/Publisher’s Note: The statements, opinions and data contained in all publications are solely those of the individual author(s) and contributor(s) and not of MDPI and/or the editor(s). MDPI and/or the editor(s) disclaim responsibility for any injury to people or property resulting from any ideas, methods, instructions or products referred to in the content.

