1. Introduction
Australian cities are among the most sprawling in the world [
1], with population densities consistently in the lowest deciles of international city comparisons, despite having urban footprints in the highest, producing dwelling densities in the range of 5 dwellings/hectare across metropolitan Perth and 9 dwellings/hectare across greater metropolitan Sydney [
2]. The result of this, dependent on the city, is that only 37–44% of Australian urban populations live in neighbourhoods with above-average walkability [
3], many of which are, due to the lower densities on the urban fringe, concentrated into higher-density inner-urban areas.
The ongoing discussion around future urban sustainability and the merits of compact cities with regard to financial and ecological sustainability [
4] has led all Australian capital cities to introduce policies for a proportion of new housing to be delivered within the existing urban boundary [
5,
6,
7], with, for example, Melbourne aiming for 71%, Brisbane 60%, and Perth 47%. While this indicates that each city is aiming for some form of urban densification and consolidation and has been using various mechanisms to achieve this for decades [
8], it also shows that planned urban expansion is still an important part of the housing solution, as it is globally [
9]. This is understandable, particularly in an Australian planning and housing environment that is largely decentralist [
10], with car-dependent suburbs being, historically, the business as usual response to housing need [
11]. However, with the increased focus on urban consolidation, questions need to be asked about how best to plan for the densification of cities, which, in the context of Australia, are comprised mostly of low-density suburbs. This is particularly important when we consider the rationale behind compactness, which is arguably for future sustainability. By purely focusing on housing, the only metric supplied by state planning leadership, we are not delivering the full suite of services to make a city truly compact; more so, in the context of the suburbs, adding houses to poorly serviced areas does little to reduce car dependence. In this article, we explore suburban redevelopment, showing, based on individual land sale and redevelopment patterns, the potential futures for suburban areas in terms of density uplift and the need to consider the alteration of land use practises to provide space for the additional services needed to make them truly compact.
Modes of Planning for Redevelopment
In an attempt to categorise the forms of densification, Puustinen et al. [
12] produced four typologies of densification type: policy-driven large-scale brownfield; policy-driven densification of strategic areas; owner-driven high-density; and owner-driven incremental redevelopment. The distinction between policy and owner-driven, as well as between high-density and incremental, is critical here and will lead much of the debate below.
Policy-driven density occurs via two main mechanisms: brownfield redevelopment and strategic area redevelopment. Brownfield redevelopment is typically ex-industrial, often a single or collection of larger land parcels, and, in the Australian context, often of the scale to warrant its own structure planning to consider the range of uses needed for large/new population increases, including transit routes, shopping, affordable housing, recreation, and social/civic infrastructure, for example, the Arden Structure Plan for North Melbourne [
13]. The scale and tabula rasa nature of these projects also often require partnerships among multiple agencies and sectors to deliver and develop the land. The second mechanism, strategic area redevelopment, is typically associated with transit-oriented development or development focused on large commercial districts and multi-functional areas. These areas are zoned for denser residential development and already have the level of service access and amenity required to accommodate population increases, or at least the capacity, in terms of land use coding, to extend existing services. Unlike brownfield developments, strategic redevelopment is far more incremental in terms of development timing, working with the existing (and potentially future planned) urban morphology to gradually increase density over the demarked (zoned) area. Locally labelled ‘Activity Centers’ [
14], the strategic future importance of these areas, combined with the complexity of function and built form, as with brownfield sites, affords them a considerable master/structure planning budget.
Though most often connected with inner-urban environments, the sprawling and ageing nature of Australian cities is showing regenerative potential in the established, middle-ring areas of cities. Taking Melbourne (2021) as an example, we can see in
Table 1 that the pipeline volume of new dwellings across both brownfield and strategic areas is actually higher in middle-ring locations, through to a lesser degree in terms of 10+ storey development, with mid-scale apartments and attached ‘townhouses’ (2–3 storey, attached, and a relatively recent rediscovery of the housing typology in the Australian housing landscape) making up the shortfall. Notable also is the fact that middle-ring municipalities produced almost half of the city’s high-rises in 2016 [
15], showing that middle-ring areas can produce significant apartment outcomes.
Turning to density increases outside of these areas, we now consider incremental non-strategic development, which is locally termed ‘greyfield’ development [
17] and distinct from the US term [
18], in that it focuses on the redevelopment, or partial sale/redevelopment, of existing small suburban residential lots. While these lots are well located in that they are not on the urban fringe and have established hard and soft infrastructure, they do not have the same infrastructural capacity as strategic areas. However, and again using Melbourne as an example, while greyfield suburban developments only produced 19% of the net dwelling increase in 2005–2016, they were responsible for 46% of all development projects, meaning that while the output is low, typically 2–4 dwellings, the volume of projects is near half of all developments and is occurring throughout the middle-ring suburbs that comprise the majority of the greater city [
19]. Modeling this forward and using a variable indicating redevelopment potential discussed below, it was calculated that 615,468 out of 1,595,050 dwellings across greater Melbourne (38.5%) were redevelopable [
17], which will at the very least double, if not triple, or quadruple suburban populations. However, despite the scale of this density uplift, they do not afford the level of future planning available to strategic areas, leaving suburbs to the processes of ‘soft densification’ [
20,
21]. While this is a necessary planning prioritisation due to limited municipal funding, the lack of future visioning for non-strategic areas is problematic in that hard and soft infrastructural provision runs the risk of not being fit for demand, especially when the scale of density increase (cumulatively) in non-strategic areas will, in terms of projects and land volume, outstrip that of strategic centres. But it also speaks to the issue of holistic compactness [
22] (p. 3) and ‘density done well’ [
23], or the need to consider a range of additional outcomes rather than simply housing, broadly adding some level of localised amenity concurrently [
24]. While there are a host of issues related to compactness, which we will briefly elaborate on below, here we are specifically speaking to the need for destinations.
The concept of a 15 min city [
25] has achieved a high profile in urban planning circles, with, as with infill policies, all Australian capital cities having some form of state policy based on localised access to services. The Melbourne variant, ‘20 min neighbourhoods’ [
5], has, since 2016, aimed for a highly localised polycentric city of urban villages where all day-to-day services can be accessed within a 20 min return walk; effectively, a city of 1 km buffers around centres of commercial activity. This is largely achievable in dense inner-urban areas or around strategic centres, but most definitely not in most of suburban Melbourne, which, based on the low population density and catchment requirements for viable businesses, has sparse commercial land use zoning and is lacking the destinations required to make an area walkable [
26,
27,
28,
29,
30]. However, with piecemeal suburban redevelopment, many suburbs are approaching the densities required to support local, walkable business centers, calculated at 25 dwellings per hectare in the Australian context [
31]. Meaning that these policies could soon become viable, but only if planners put their minds to future land use provisions for new services and destinations.
Based on the above, the three premises of this article are, at least in the Australian context, that: urban densification appears to be inevitable; densification without additional amenity does not meaningfully contribute to the compact city agenda, other than increasing densities in under-serviced areas; and in suburban environments, current planning and policy settings are not considering future densities and their ability to deliver “density done well” at the neighbourhood scale.
To resolve this issue, new planning arrangements are needed to allow for the slow evolution of densifying residential areas into mixed-use areas that can service the day-to-day needs of future resident populations. This article begins by outlining key tensions relating to urban compactness in literature and then outlines the evidence and reasoning that have led us to the three key premises of this article, which are followed by a discussion on possible planning responses.
2. Method
To illustrate the scale of the issue, this paper starts at the greater city scale, showing how all municipalities in all Australian state capital cities are increasing in dwelling volume. This scale of analysis uses Australian Bureau of Statistics (ABS) census data, counting dwellings—dwelling structure (STRD) [
32] at the municipal level. For reasons of scale, density here is calculated as gross neighbourhood density [
33], which is replicated throughout for consistency.
The focus then shifts to one city for deeper analysis. Melbourne was chosen for its good selection of walkable neighbourhoods, allowing for a wider analysis than smaller cities, plus the sheer volume of unwalkable suburban form that stretches between forty-five and sixty kilometres from the CBD, making it ideal in terms of walkability and the suburban sprawl typical of all Australian cities. Melbourne also has the advantage of having a publicly accessible unit-level geospatial database of all (re)development.
The Housing Development Dataset (HDD) [
34] is an annual survey of all buildings and all building works in Melbourne, producing a layer of existing stock and annual change. The geospatial layers are at a land-parcel level and include variables for initial dwellings, resultant dwellings, net increase, units on the parcel, and so forth. Our research used these layers to show the location and scale of redevelopment. While the net increase per development was higher within Activity Center boundaries, this data proved that redevelopment is occurring throughout the entire city, with more projects occurring in the under-serviced suburbs, and at the homeowner-driven, low-density incremental scale of density increase, producing an average of 2.4 dwellings per redevelopment [
19].
To assess the level of future development, the Redevelopment Potential Index, as developed by Newton [
35], was recreated for all of Melbourne. This index incorporates a number of land valuation data points to show the level of under-capitalisation of the land; specifically, capital improved value dived by land value, which, when 1, indicates all value is in the land and the building is (rates wise) worthless. Early work by Newton showed that values greater or equal to 0.7 have a high redevelopment probability, and though this necessarily needs tempering with land use regulation, heritage, prestige value, and so forth, in the typical Australian suburban environments considered below, it remains a good indicator of potential turnover and densification. This was used to show the volume of residential redevelopment potentially forthcoming in suburban areas, which could feasibly support a less car-dependent morphology by introducing new commercial destinations.
With the understanding that walkable neighbourhoods need to be 25–35 d/ha (gross), the final methodological process was to identify the scale of commercial land use (as a proxy for destinations) that future densities could functionally service in terms of financial viability and population catchment. To show the scale of potential intervention, these volumes of commercial land were applied over two distinct neighbourhoods to illustrate the volume of land that could ultimately lead to the creation of new walkable destinations in currently poorly serviced suburbs.
3. Tensions of Compactness
The debate around urban centralisation versus decentralisation, according to Breheny [
36], has been running since 1935 with the ideological clash between Wright and Le Corbusier, both of whom were reacting to Howard’s thoughts on urban decay and evacuation; the former proposing garden cities, the latter, higher, through better planned, urban concentrations. The actual product, in terms of urban outcome, saw both partly come to fruition, with automobiles leading to suburban flight while slum clearing activities, combined with engineering advances and land-market pressures, led to inner-urban medium- and high-rise precincts. The latter has become valorised, with urban living being championed by the canons of urban theory, celebrating the inner-urban form [
37], the inner-urban lifestyle [
38], the inner-urban social mix [
39], the social and creative effect of urban agglomeration [
40,
41], and being the height of cultural production and consumption [
42]. Counter-wise, suburban living has largely been expressed as its antithesis [
43], despite housing the vast majority of city dwellers, calculated at 77.1% in Australia, with less than 14% in its activity centres [
44], and being areas of significant cultural creation and consumption [
45], though largely relegated to “the scrap-heap of economic dynamism” [
46] (p. 9—taken from Bain 2018).
It must be noted, however, that dense urbanism is not without its issues, and until reasonably recently, with the inner-urban regeneration policies of most global cities of the late 1980s onwards, these areas suffered the opposite issue of the suburbs, in that they were saturated with services but without the residential population to make them viable outside of office hours. Locally, programmes such as “Postcode 3000” [
47] saw municipal planners aim to reinvigorate inner Melbourne by promoting the inner city as a residential destination as well as a commercial one, thus balancing the land use and making it into the city that today ranks as one of the most liveable internationally, making it truly compact in terms of a holistic approach to land use.
Dantzig and Saaty coined the term Compact City [
48], but it was Newman and Kenworthy’s [
49] international coverage of gasoline use linked to urban population density that ignited the contemporary debate on compact cities, or at the very least provided a minimum density metric defining compact (35 dwellings per hectare) and a significant evidence-base for its discussion. In the spirit of the dialectic, Hall’s [
50] response to Newman and Kenworthy’s work calls it “Altogether misguided and dangerous,” arguing, among other things, that urban morphology and poly-centrality, not just density, are critical components, mirroring contemporary thoughts on developing more holistic, compact solutions that incorporate pluralistic and divergent pressures, including heritage conservation [
51], greenspace provision [
52], and urban heat island [
53]. While these issues were raised quite early on in the argument for more compact urban form [
54], compact cities have become the solution for sustainability (ibid.), walkability and health [
55], and the optimisation of infrastructure expenditure [
56]. Effectively becoming a panacea capable of resolving every social, economic, and ecological sustainability problem facing humanity in the 21st century [
57], all of which could, arguably, be addressed by any form of city if effectively governed [
58].
The most common forms of criticism relating to compact cities occur in relation to biassed or ill-defined data and feigned ignorance of the negative aspects of compactness. While an older review and the subject of much debate, Gordon and Richardson [
59] sum up the critique by calling into question every aspect of compactness, concluding that compact cities produce reduced amenity and equity for increased public and private costs. More recently, Neuman [
58] points to the spurious definitions of sustainability throughout the literature and, indeed, the ability of built-form outcomes to deliver on all fronts. Haarstad et al. [
60] and McFarlane [
61], though acknowledging that future cities will be compact, raise a host of issues such as overcrowding, gentrification, and ecological outcomes of compactness, which have been poorly addressed, pointing to compact cities as being an ideological agenda flowing from institutional neoliberal hegemony, which actually generates inequities and is largely resisted for fear of outpricing, congestion, and infrastructural overuse [
24]. This last point speaks to the paradox of the compact agenda, which is firstly paradoxical due to its promotion of the very issues that led to the rise of urban planning in the first place, i.e., overcrowding, noise, and pollution [
57], and secondly because quality of life, across social, economic, and sustainability factors, may actually be higher in the suburbs. While the paradox is discounted by many, with Mouratidis [
62], for example, showing that neighbourhood satisfaction is higher in denser areas and depression is lower in denser urban areas [
63], it should be noted that many such studies centre around areas that were planned for density (such as Amsterdam and Copenhagen) and not areas that had density thrust upon them in an uncoordinated fashion. This is the crux of what we want to explore below.
4. Three Novel Premises on Urban Density
Here we present evidence and commentary about the three premises on urban density based on which we propose there is a need to update urban policy and planning in the Australian suburban context.
4.1. Densification Is Inevitable
Irrespective of the debate around compactness, Australian cities are experiencing a significant volume of infill and density increases.
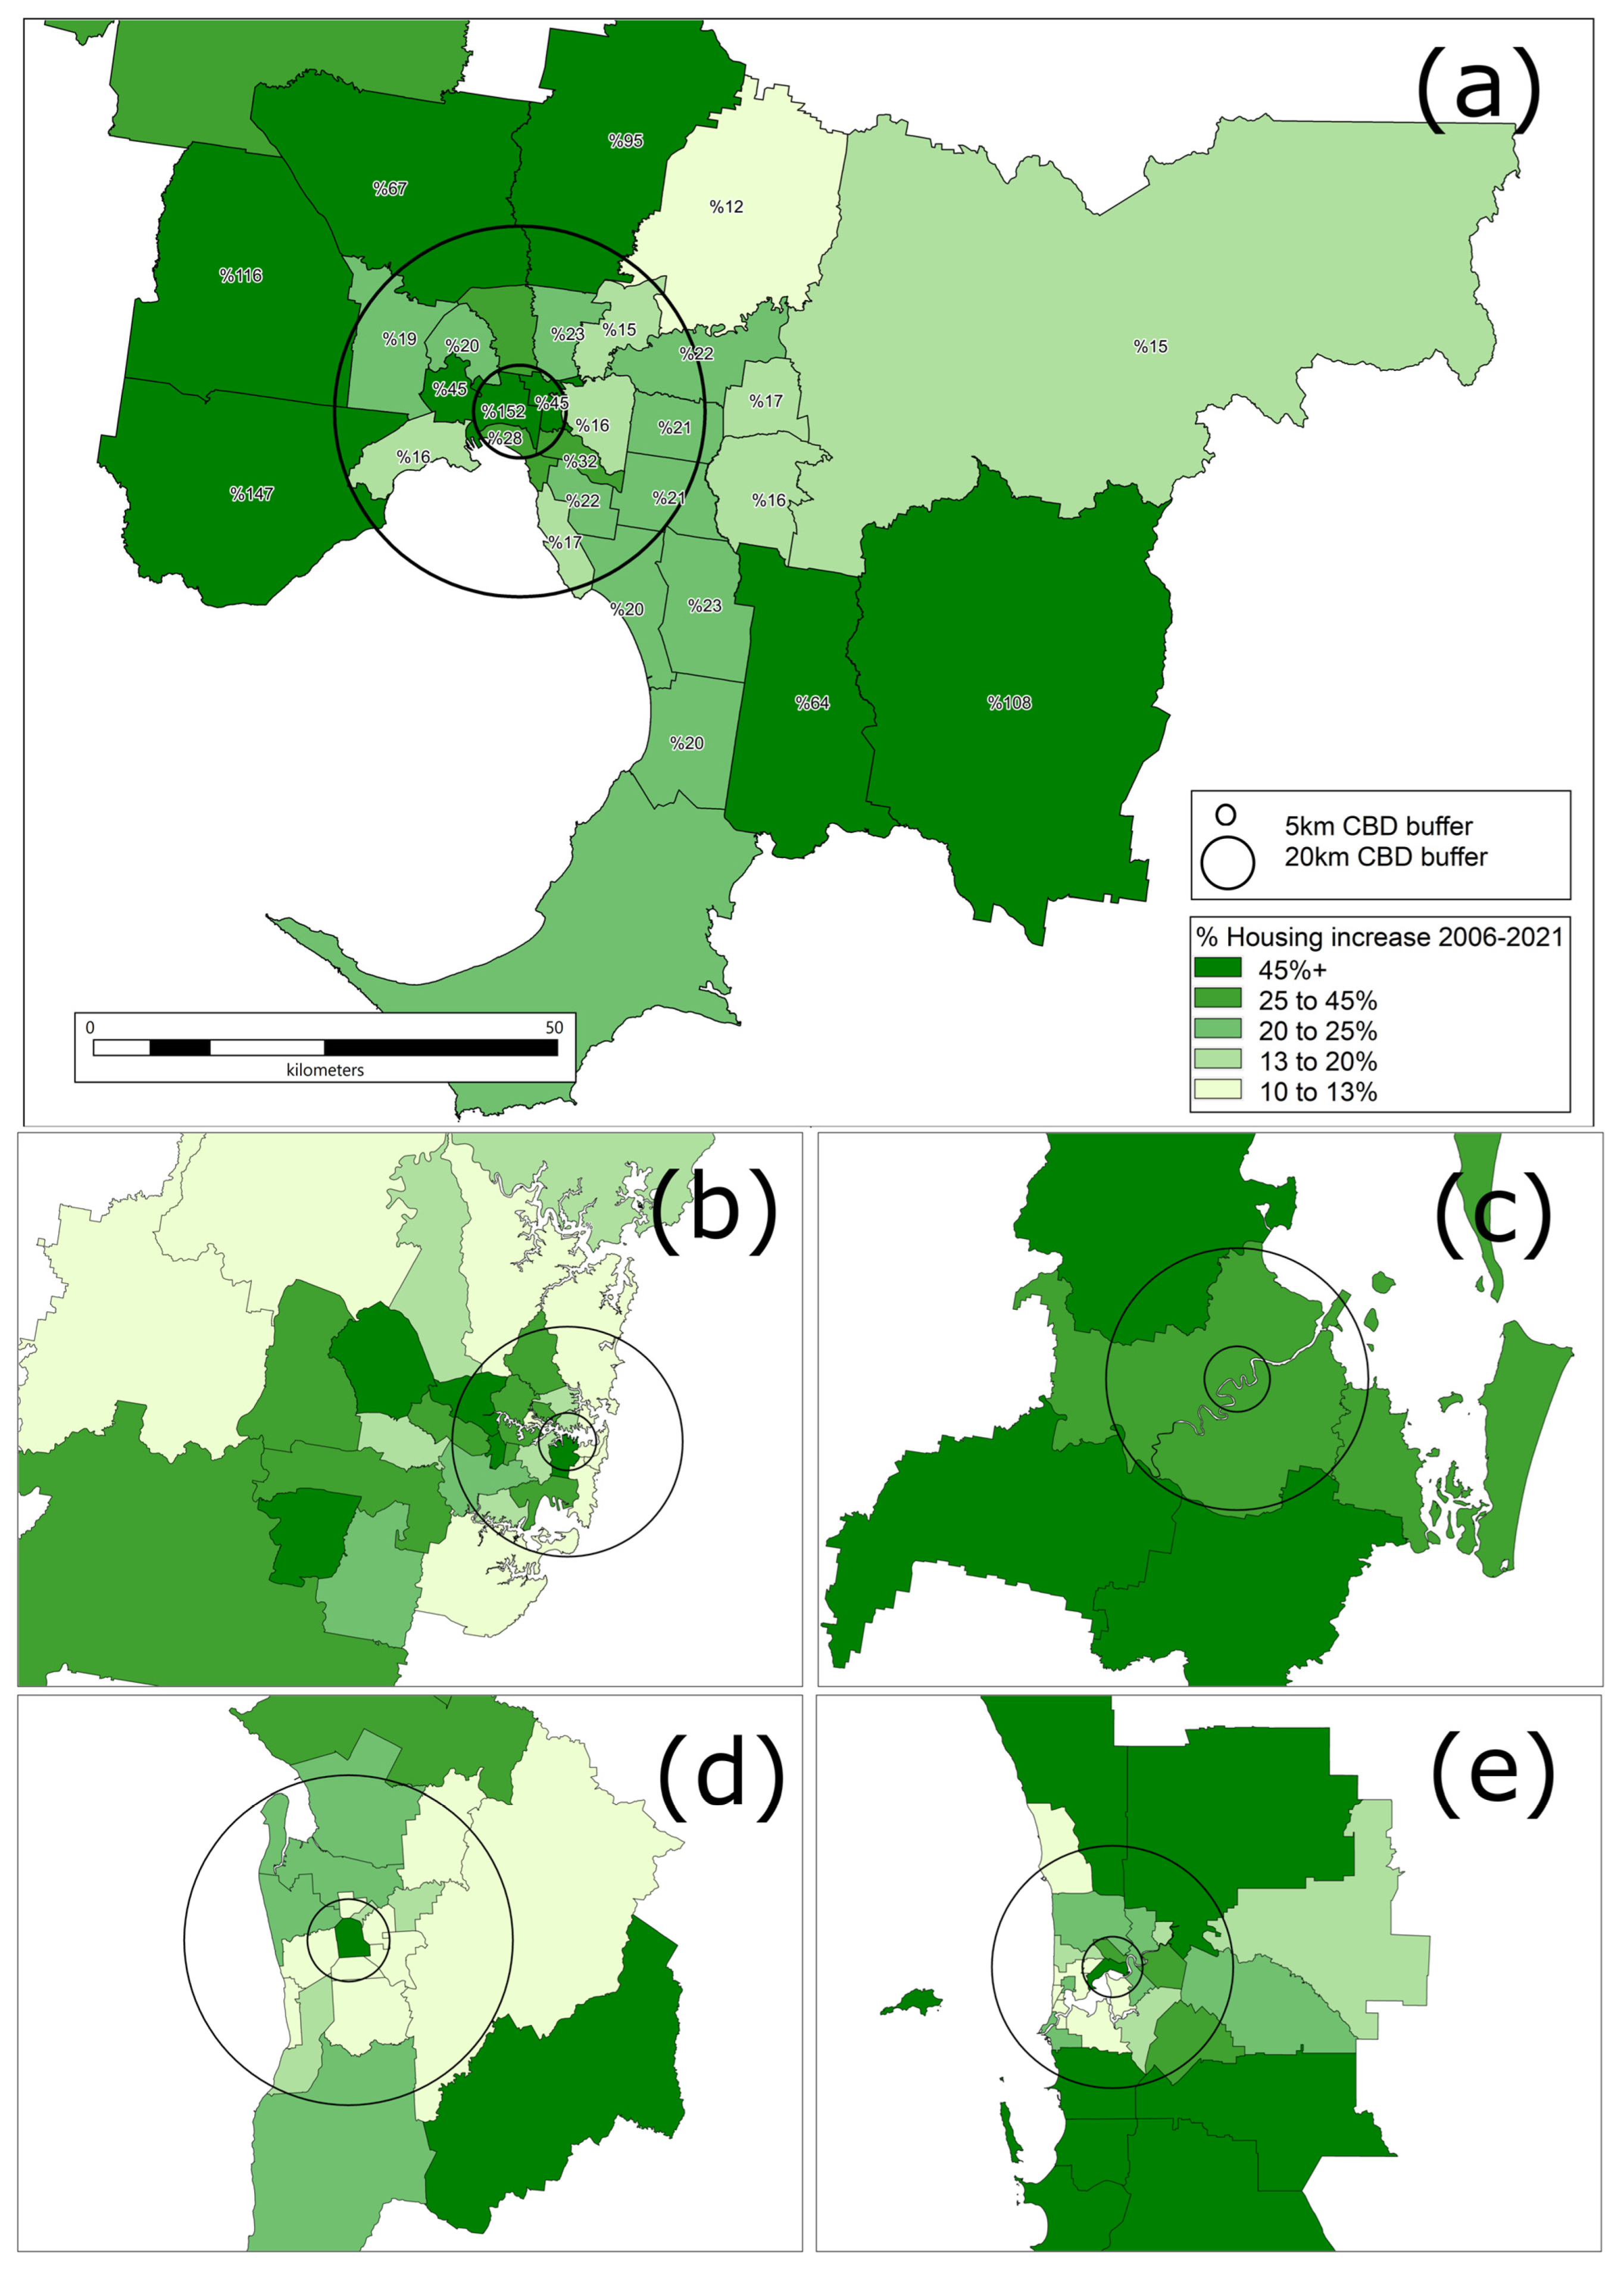
Table 2 shows the actual change in housing volumes over inner, middle, and outer municipalities across Australia’s 4 largest cities. Brisbane is excluded here due to its being one large municipality, making assessment in this category impossible. While development in the outer municipalities continues, showing the ongoing planned expansion of all cities, redevelopment of the middle-ring municipalities is evident throughout, though to varying degrees.
Figure 1 graphically represents the dwelling changes. Melbourne percentage changes are included on the map for illustrative purposes, while the remaining cities are purely colour-coded. A 5 km and 20 km ring from the CBD has been added for scale and to roughly illustrate inner, middle, and outer municipalities; this will obviously vary based on the size of the greater city, with Sydney and Melbourne middle-ring municipalities stretching to 30+ km from the CBD. Though starting from a lower base, outer areas show volume increases between 30,000 and 50,000 dwellings for Melbourne, roughly 20,000 for Sydney and Perth, and 10,000 for Adelaide. Inner municipalities are also all experiencing high levels of growth in apartments, while middle-ring municipalities are showing increases of roughly 20%. As another point of note and to temper the later discussion on future redevelopment, dwelling volume increases are noticeably lower in the more affluent municipalities of all cities, where prestige value and conservative planning regimes are practised to a greater extent [
65].
We can clearly see that all municipalities show dwelling increases, but for the remainder of the article, we will be focusing on the middle-ring councils, which are areas that are going through small-scale incremental change with a lesser probability of being adjacent to walkable services.
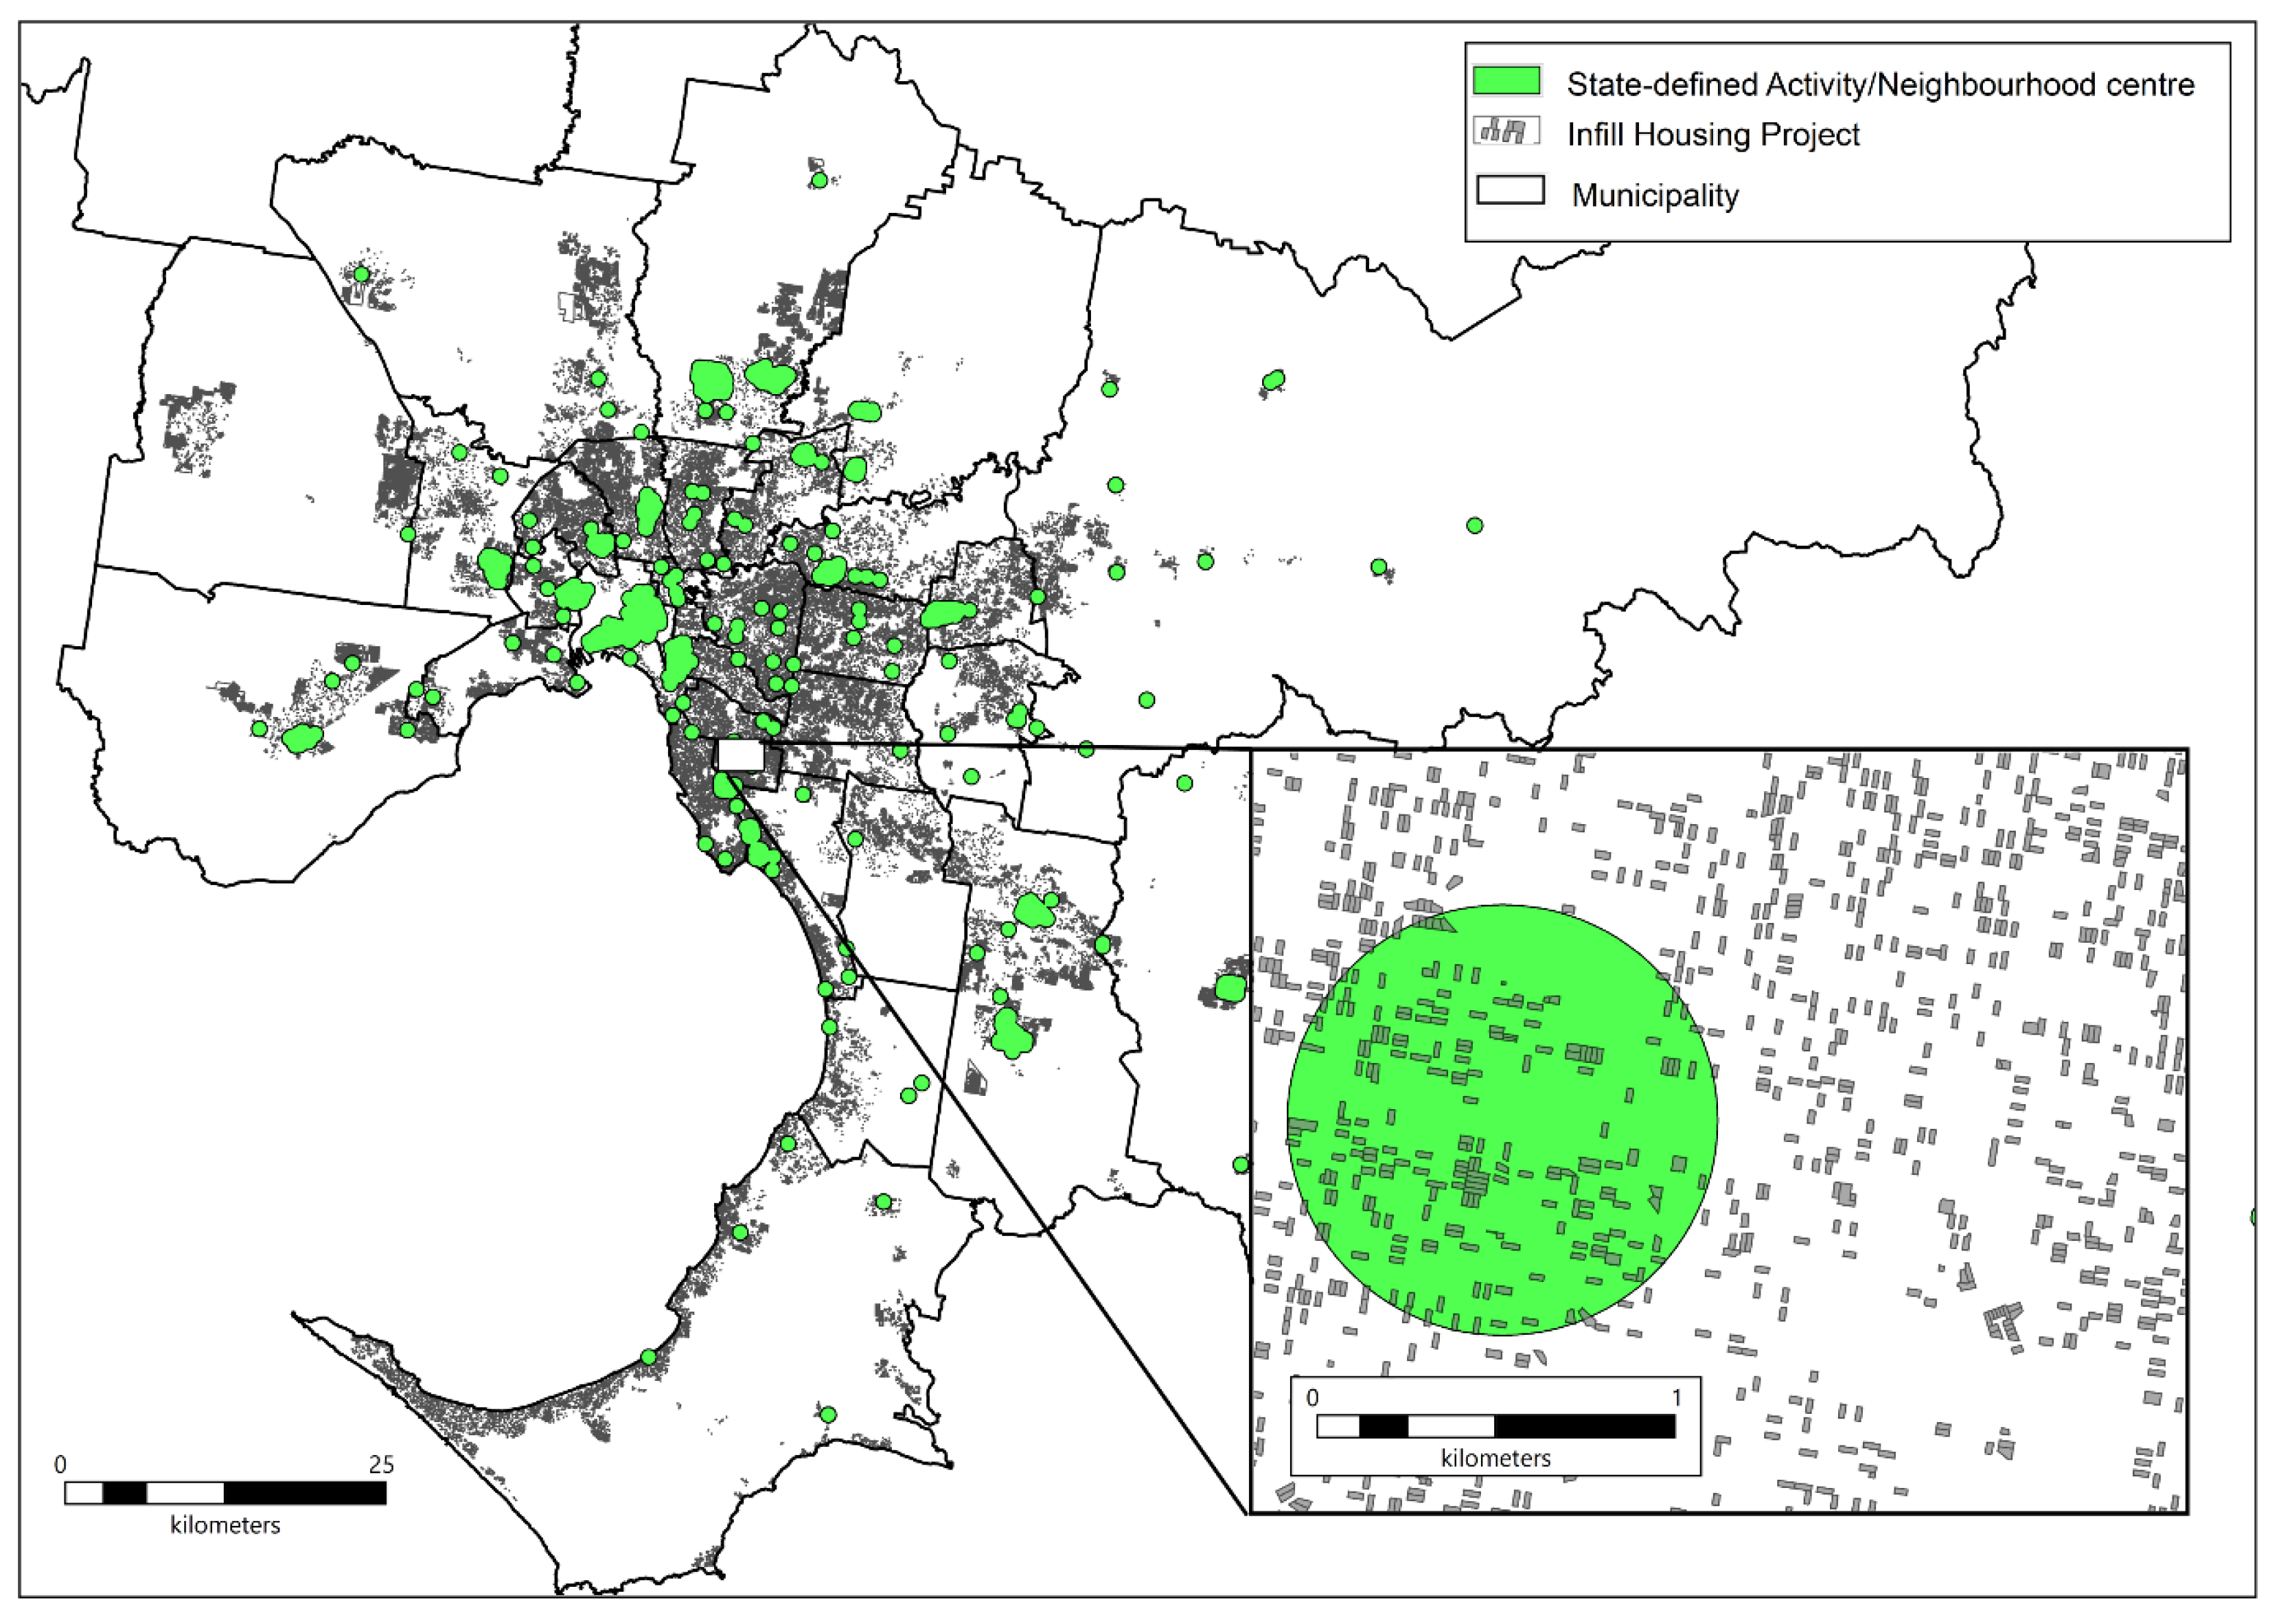
Figure 2 shows all incremental redevelopment projects from 2006 to 2016 in Melbourne using the HDD dataset, showing all development for the period [
34]. To ensure their acceptability for the ‘incremental’ category, projects were excluded that: produced greater than 100 units; were not zoned residential in the year 2000; were designated broad-hectare development; or were subject to an ex-industrial environmental audit. This is overlaid with areas that attract strategic investment from state planning authorities. These “Activity Centres” and high-level “Neighbourhood Centres” represent fully functional commercial precincts, with day and night-time economies and the full suite of services required for all day-to-day activity, representing the vision for the Melbourne strategic vision of a city of 20-minute neighbourhoods [
5]. As should be evident from the Figure, the vast majority (90%) of projects occurred outside of these strategic areas, and while producing less yield than Activity Center development, this shows that higher levels of amenity, or service access, are not necessarily a magnet for redevelopment and that redevelopment (and the following increased density) is near universal, based more on market pressures, subdivision patterns, planning regulations, and the capacity of the sum of these factors to deliver more housing on a lot.
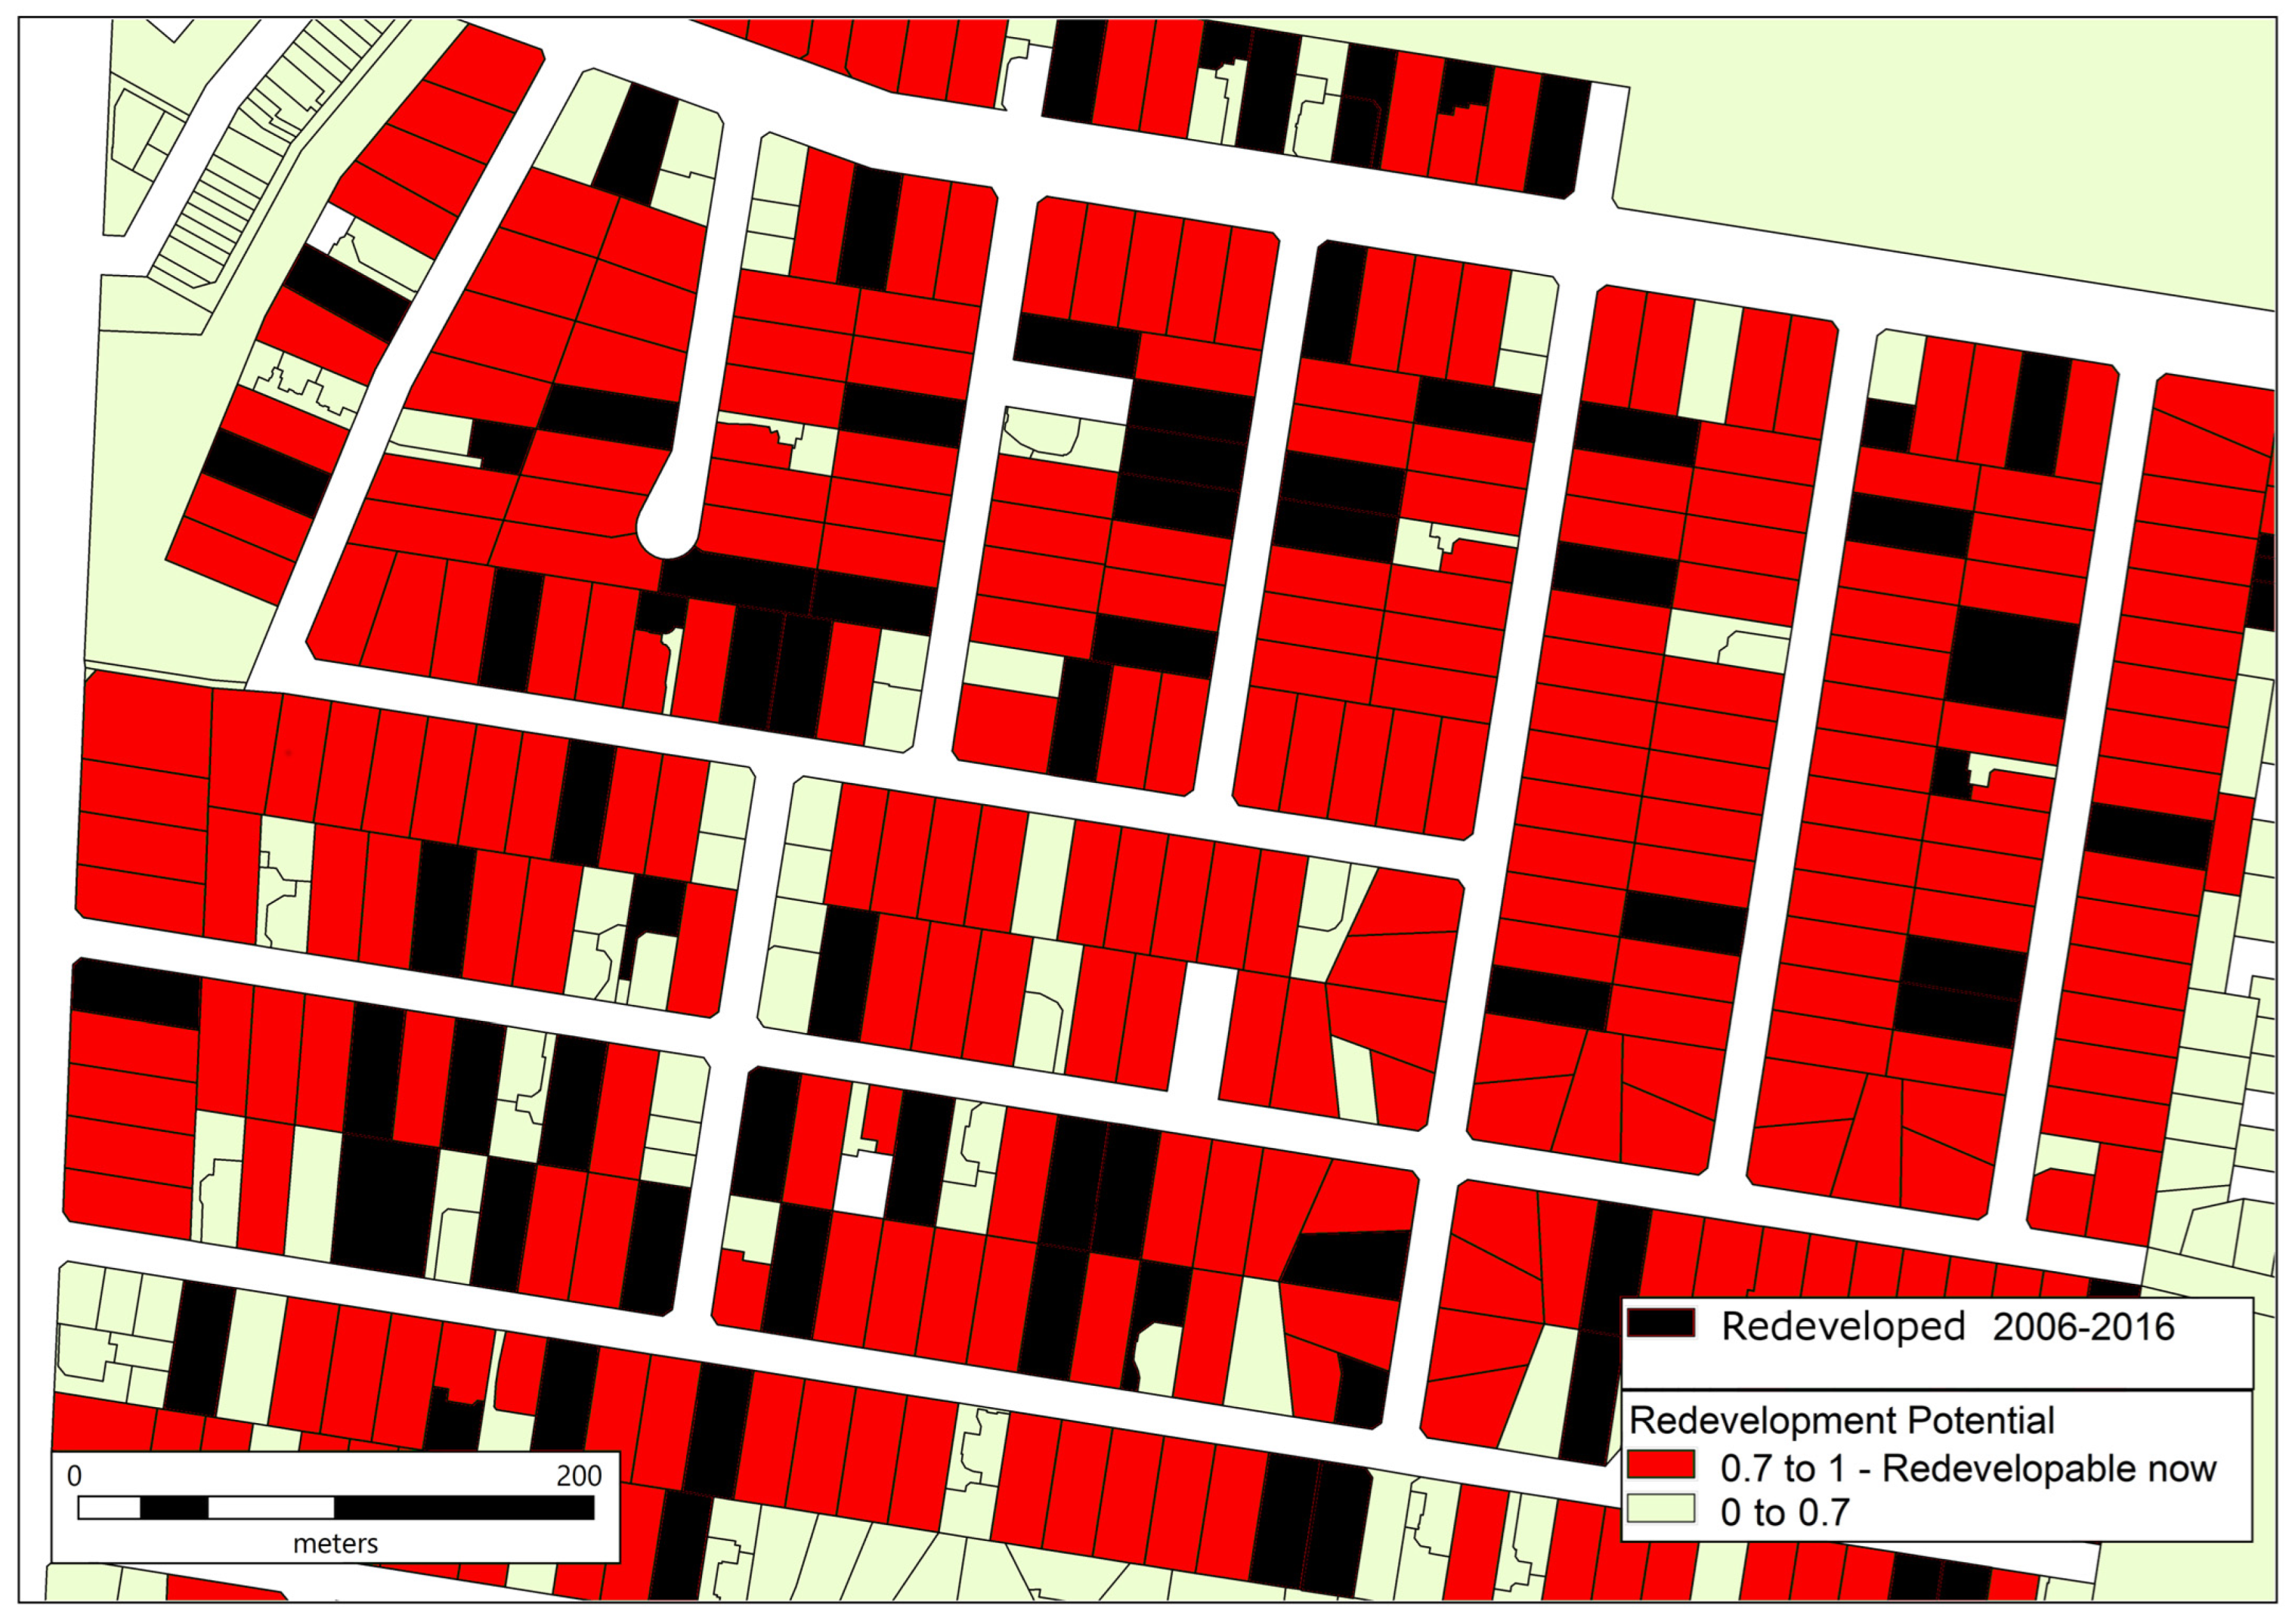
To illustrate a common pattern of change,
Figure 3 shows the infill development in a middle-ring council of Melbourne in 2006–2016. The scale is roughly 1.5 by 0.5 km, comprising 577 dwellings, with 86 redeveloped in 2006–2016 (black). The average redevelopment net increase per lot was 1.4 dwellings, meaning that for every original house, an additional 1.4 dwellings are being added. While the rate of net increase is reasonably low and seems sparse, it is, on average, more than doubling the housing density on each site. And while this may not seem that significant, particularly when only 15% of the lots have been developed, this occurred over a mere ten-year period and in a reasonable conservative council with low-density neighbourhood protection high on its agenda.
Figure 3 also shows land parcels where the house on the land parcel is worth, at most, 30% of the total value (red), meaning that there is considerable market pressure on that land to redevelop, which will only increase with time. As such, this land will become future infill, and, due to dire housing needs [
66], increasing land values, and the need to optimise financial returns for development, it is more likely to experience higher net increases than there have been to date. We would therefore assume that the population density of this area, which is almost exclusively suburban, would at least double, if not triple, over the next 30 years. This figure is typical of the layout and redevelopment patterns of Australian suburbs, which comprise the majority of Australian cities, and without providing more land for non-residential use, are effectively reducing the amenity of areas per additional dwelling, highlighting the aforementioned paradox of compactness.
This presents us with both an issue and an opportunity. The issue is that areas like these were planned for low densities (currently roughly 10 dwellings/hectare), and land use for anything other than residential is low, as it was designed for car-dependence. The population increase will therefore place additional pressure on existing services, which may become overstretched or depleted by the new population. However, the opportunity that this creates is to use this additional population to plan for greater levels of local access to services and to help deliver a more balanced, compact agenda that increases amenity along with housing densities. Given that this opportunity will be demand-driven, the first step in creating a more localised amenity is to find the volume of services that can be supported at specific dwelling densities.
4.2. Densification Needs Amenity to Contribute to True Compactness
In order to create the walkable environments necessary for state compact city policies to be achieved, increases in density will have to come with greater service access, or incrementally densifying suburbs will simply become denser car-dependent sites, not contributing to the wider agenda of compactness. With the assumption that commercially zoned land (including mixed use and their localised variants) offers the most possibility in terms of non-residential and service supply land use, we assessed the volume of commercial land per person and per dwelling at the municipal scale for greater Melbourne.
Table 3 shows that there is significantly more commercially zoned land per person (and per dwelling) in the inner municipal areas, due to the CBD effect and the location of work destinations. However, once we move out from the inner municipalities and into the suburbs, well-serviced or otherwise, there is a reasonably consistent level of commercial land supply, at roughly 9–12 m
2 per resident and 20–30 m
2 per dwelling (with some exceptions due to planning for future interstate logistics nodes, i.e., Whittlesea). What this indicates is that the volume of commercial land is, regardless of accessibility, reasonably static over large areas.
While municipal scales allow for the calculation of commercial zoning at a mass level, they do little to assist in defining the localised level of required non-residential space. To assist with this, we now move onto an examination of local commercial areas and precincts.
Table 4 shows a selection of (sub)urban centres in Melbourne, examining the area of commercial zoning, the square metres of commercial land per dwelling, the distance to the next significant precinct, and the dwelling density (city-block method).
As we would expect, the commercial area per dwelling in areas with higher densities is roughly half of the municipal average, dropping from 20–30 m2 per dwelling to 10–15 m2 per dwelling. This is largely due to the day-to-day focus of these areas, which excludes large-format commercials, and the reduction in car-parking requirements due to greater walkability. The opposite is the case in lower-density areas, where the municipal average density is effectively doubled and quadrupled around some of the very large centres, though more typically hovering around 50 m2 per dwelling. This is due to two key factors. The first is the significant volume of car parks in these precincts, which reduces the efficiency of the land. The second is that these areas were not meant to be walkable; they are designed to capture a wider, car-dependent population, so using a walkable capture on them is, prima facie, redundant. However, this does begin to define the capture area for these precincts, which, for Parkmore, is a 4 km diameter ring, or roughly 3 km2 of residential land to service it; a factor illustrated in the greater distances between larger sites. The higher density centres are, however, economically functional at just over 1 km away from each other, illustrating that a city comprised of urban villages is economically feasible in terms of service demand if there are the appropriate densities to service them.
4.3. Current Suburban Planning and Policy Settings Do Not Generate “Good Density”
The typical form of low-density suburbs, in terms of zoning, is near complete coverage with residential zones, interspaced with open space and public use zones, incorporating schools and public services. Commercial zoning is largely restricted to large lots, typically 10+ hectares, that service a catchment of 2–3 km, often with a regional attraction. Peripheral car parking, combined with their location on major highways, makes these areas reasonably hostile to pedestrians. The only placemaking that they offer is within the walls of the centre, significantly reducing the ability of the site to become a fully functional centre offering both daytime and nighttime economies. The result is that, outside of large centres, these areas lack destinations.
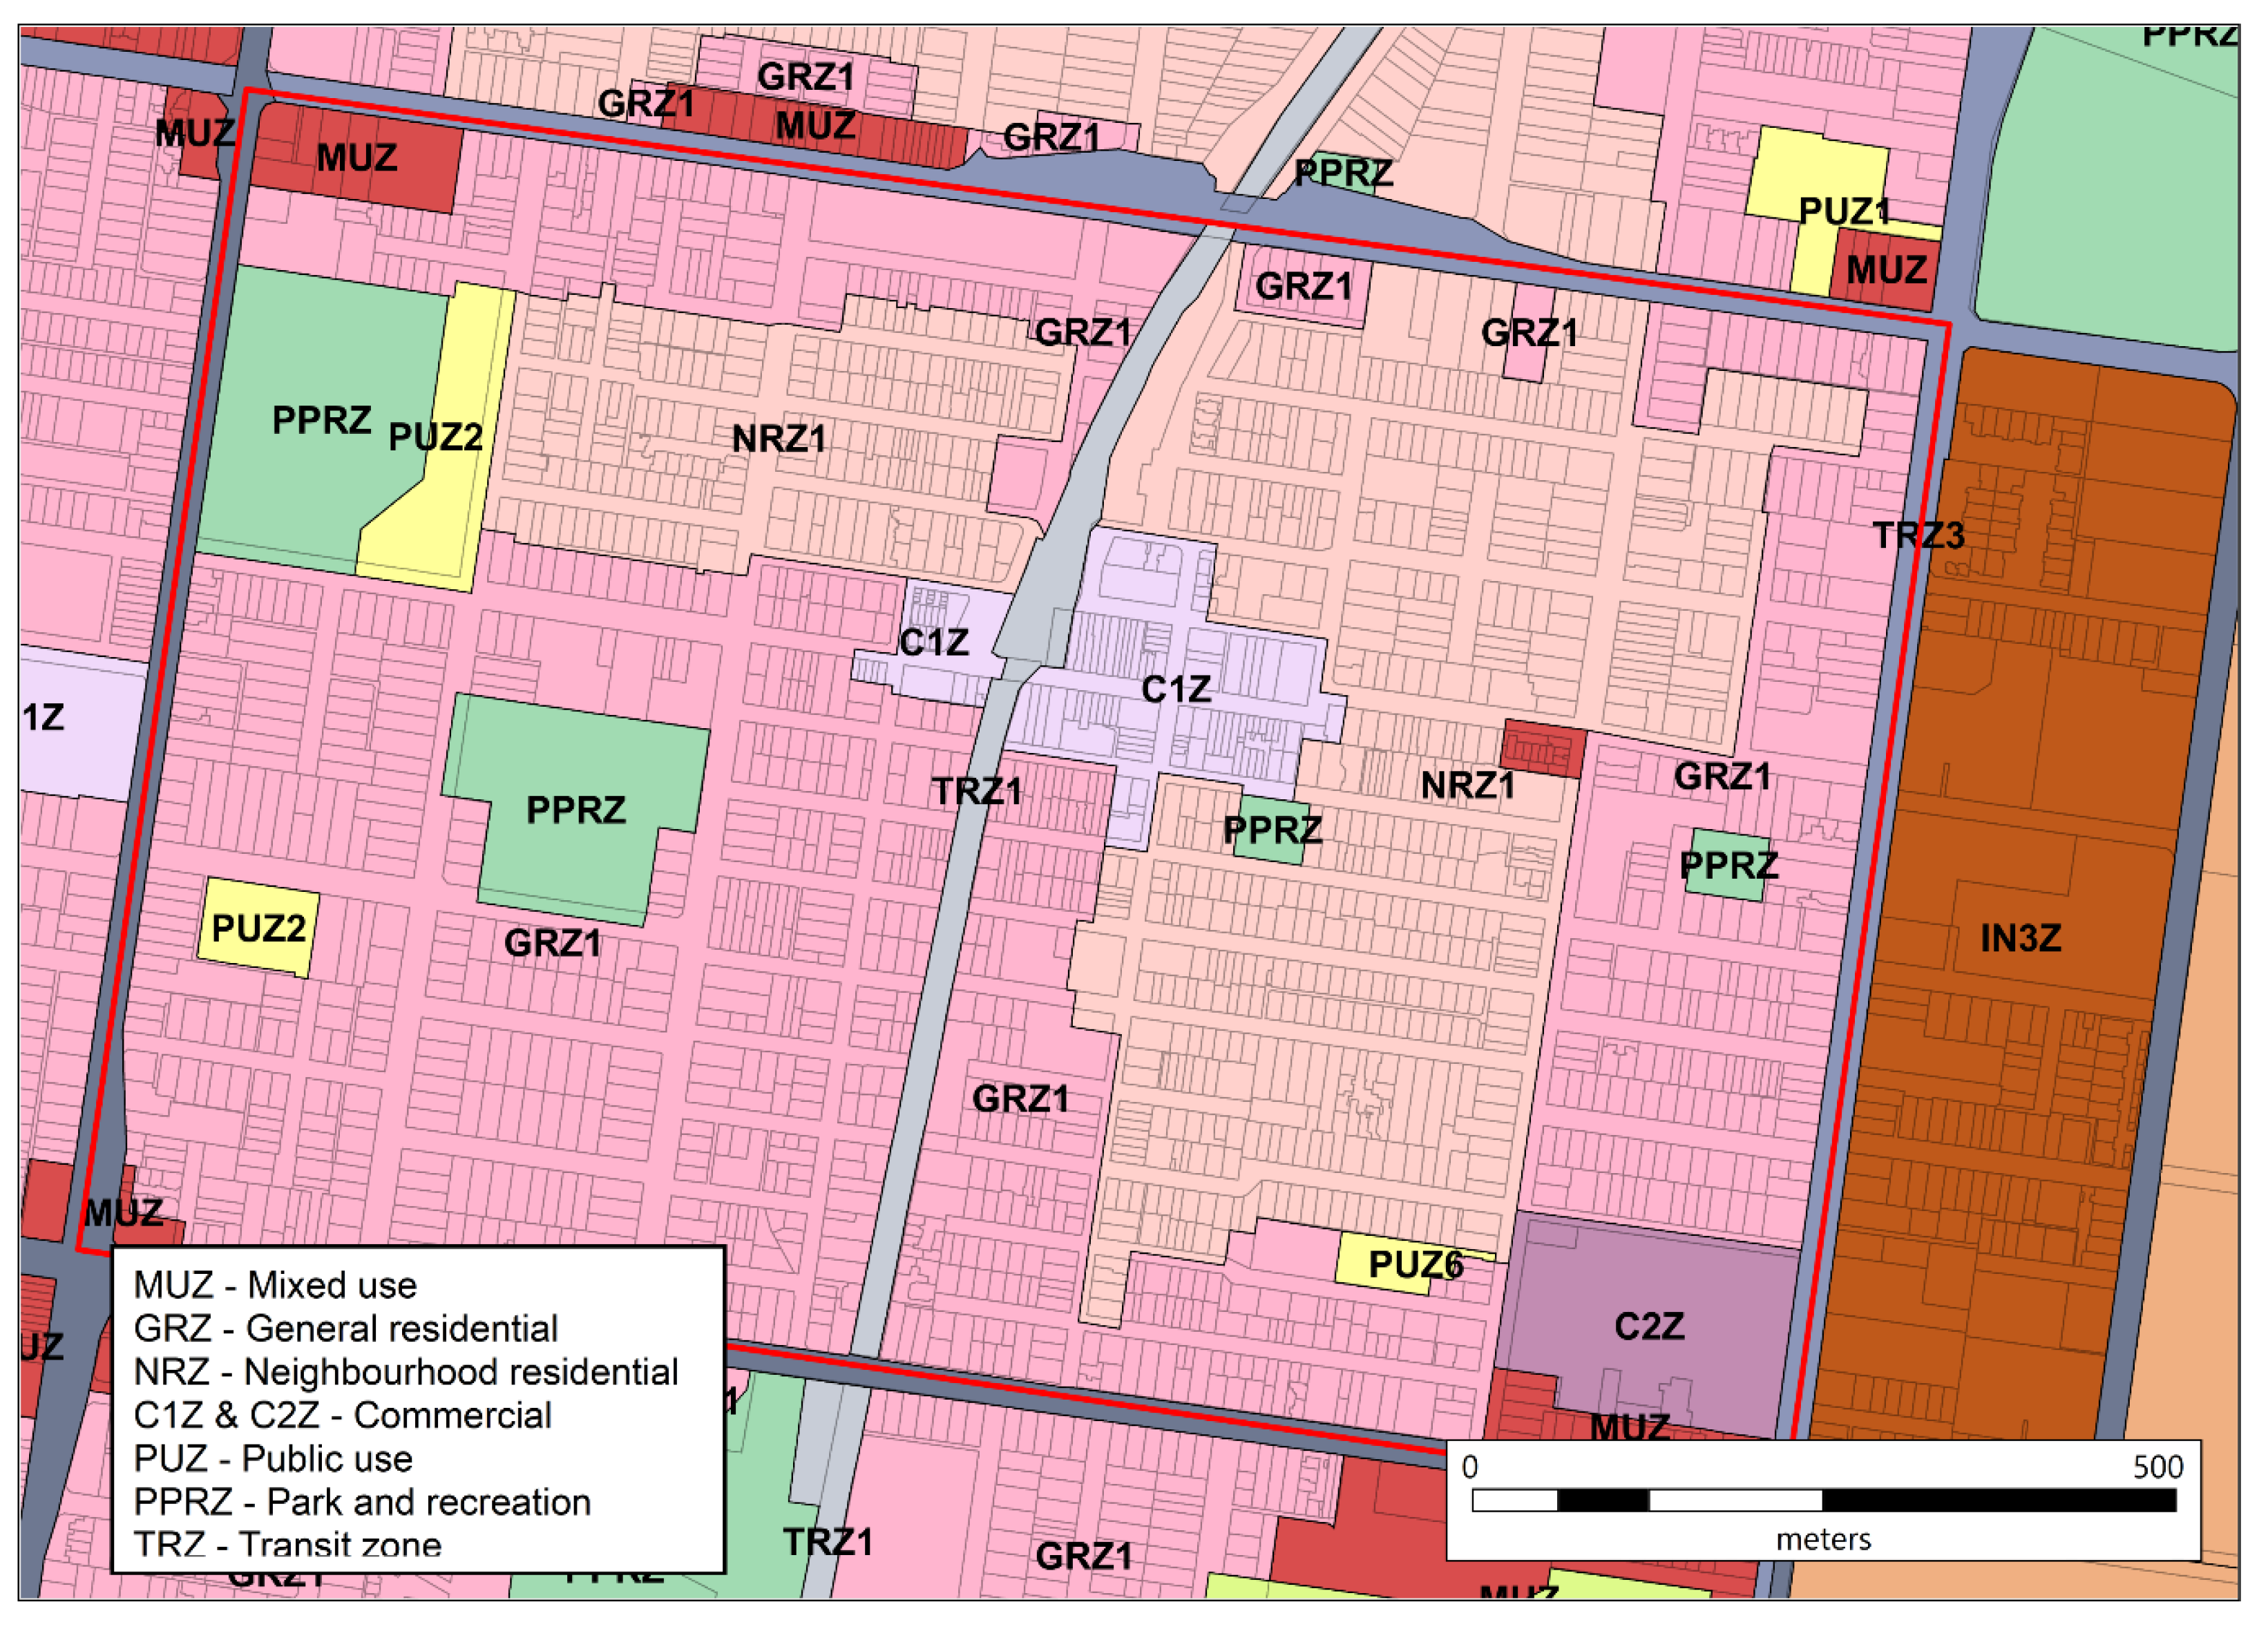
As a visual comparison
Figure 4 and
Figure 5 show the difference in land use outcomes. In
Figure 4, a successful urban village, we can see the variance in zones. The area of analysis (1.03 km
2) contains 2369 dwellings, a dwelling density of 24 d/ha (gross, or 40 d/ha city-block method). While the majority is still residential (both general residential and neighbourhood protected), it contains 3.5 ha of commercial land to its centre and a significant distribution of mixed-use, park, and public space throughout the area of analysis, providing multiple destinations.
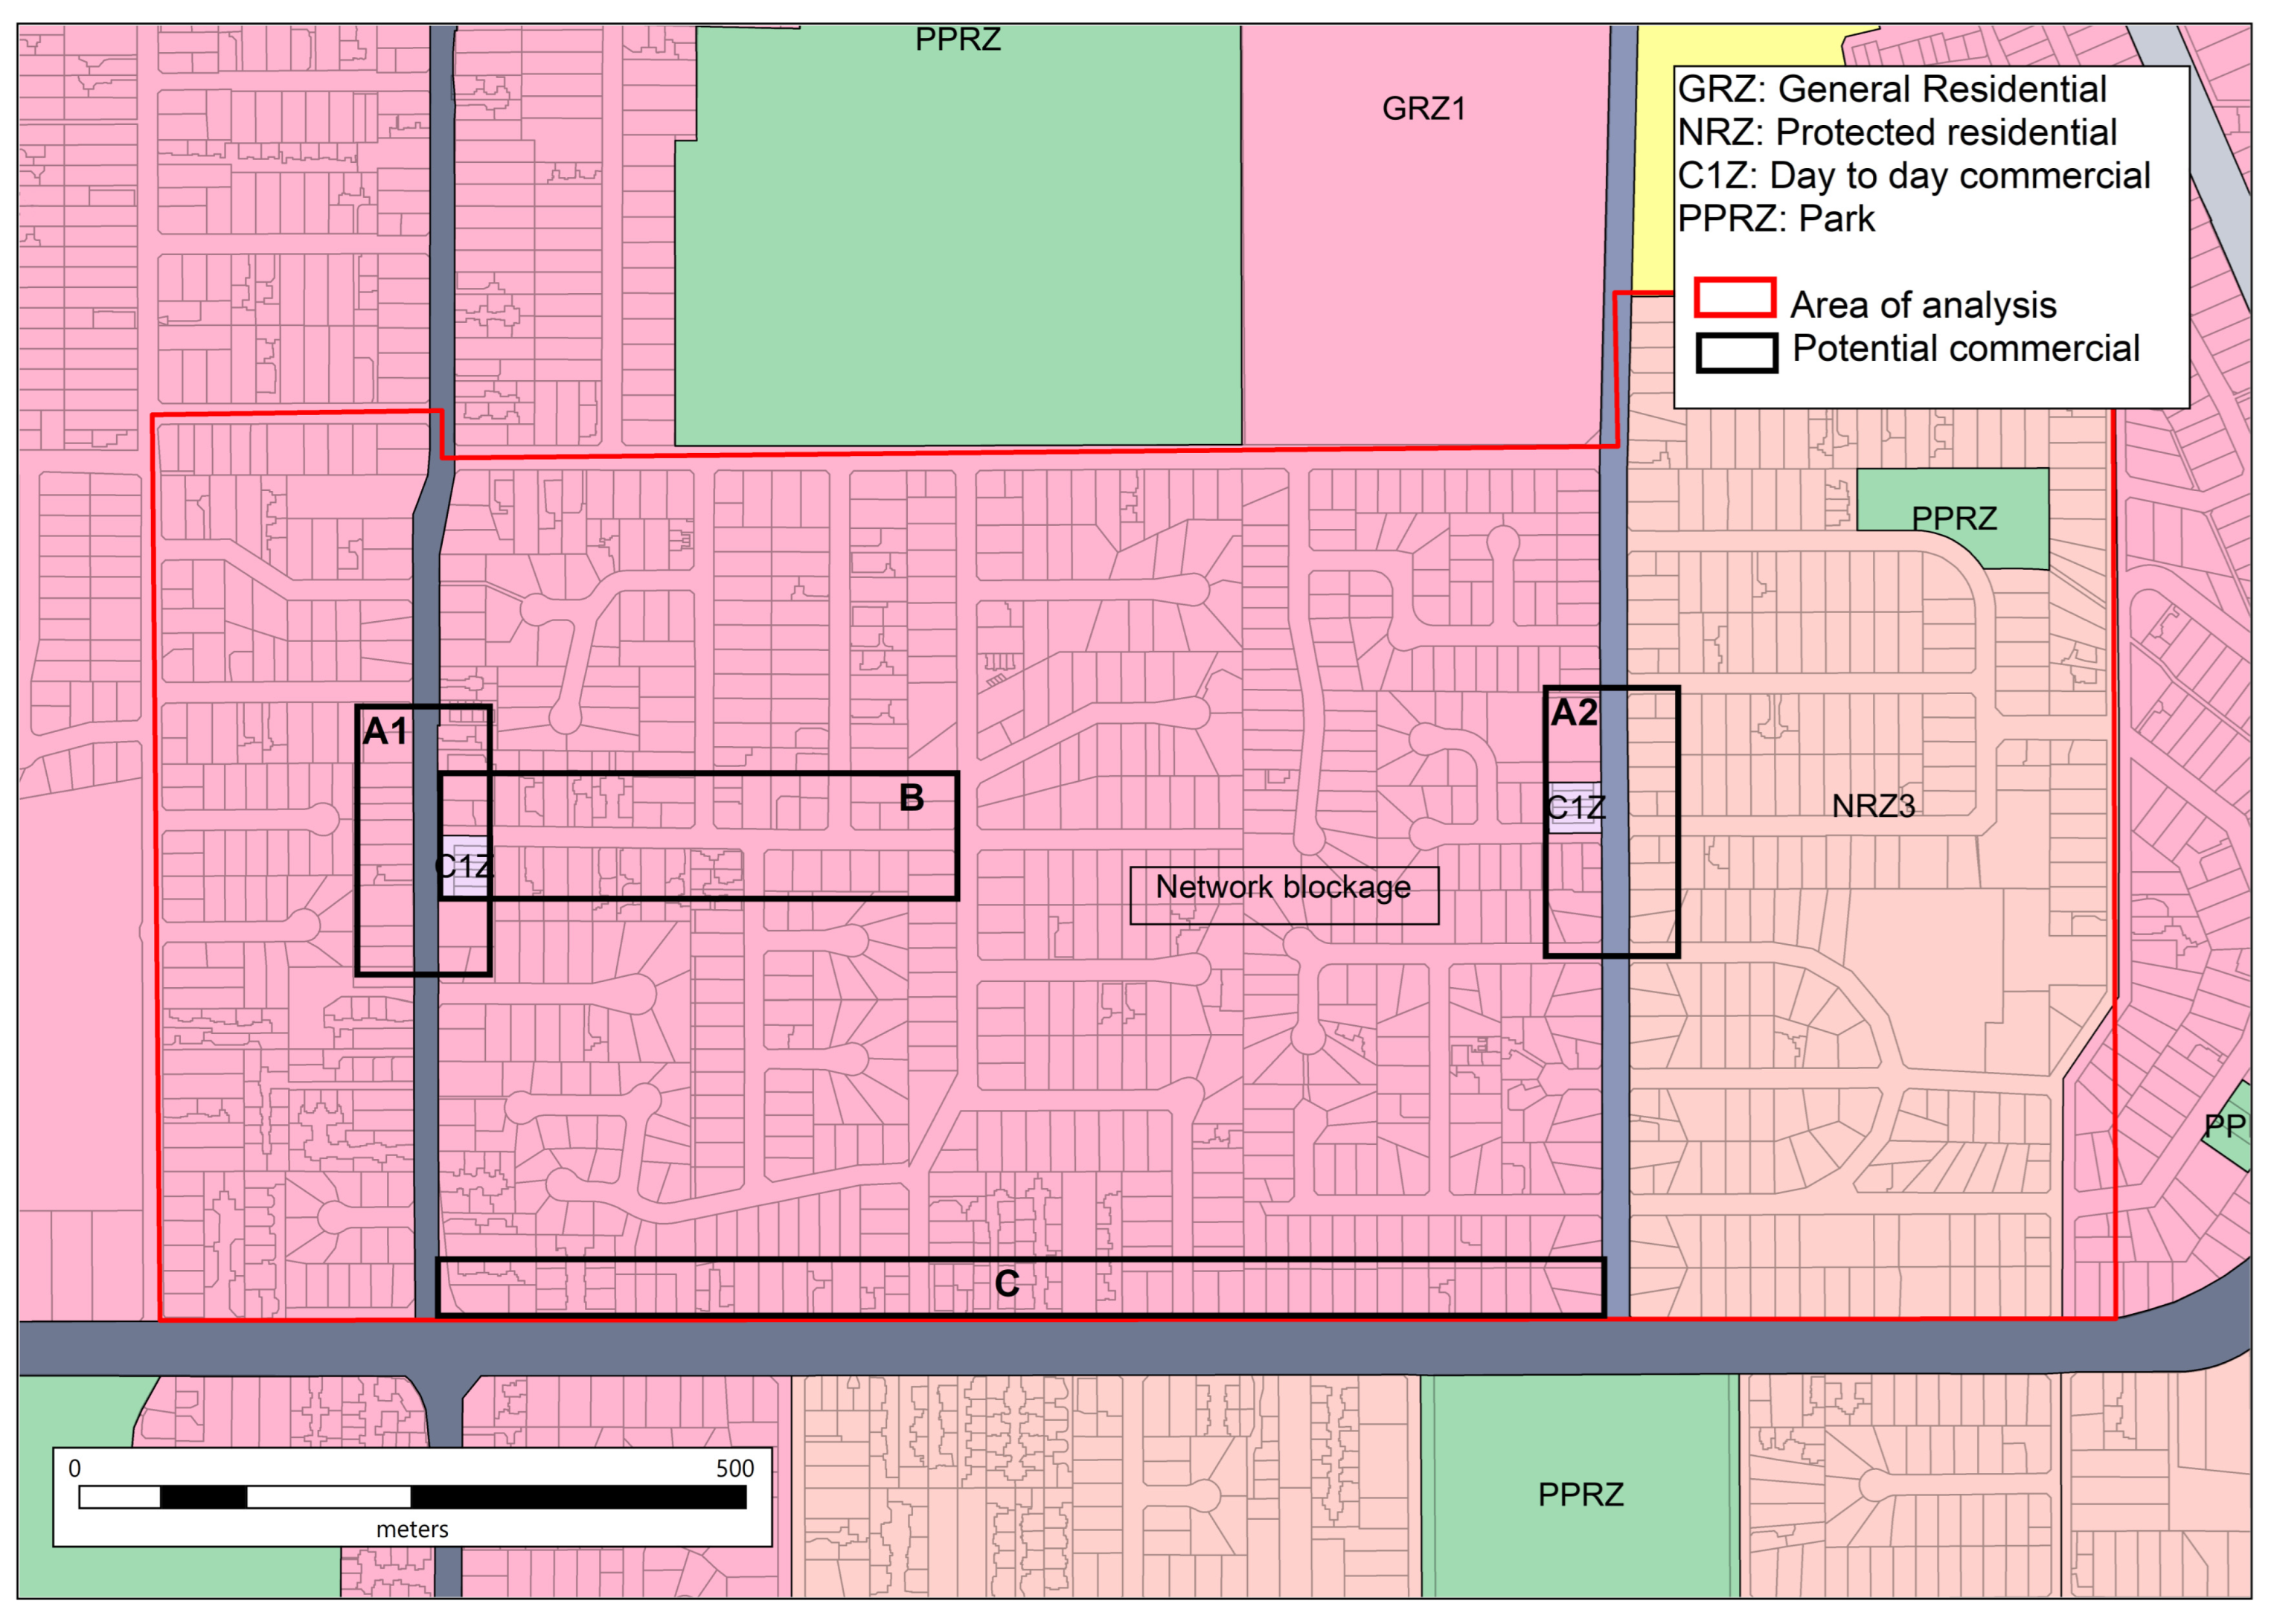
Figure 5 (Heathmont, 30 km East of Melbourne’s CBD), however, shows a landscape dominated by residential land use, boarded to the south by a 4-lane highway, and with nearby commercial land (not on the map) bisected by a train line and highway, i.e., a vehicle-oriented ‘edge condition’ being fed by vehicular traffic. Two small commercial zones exist in the analysis area (both 1500 m
2). Original suburban subdivision lots are typically in the realm of 700–800 m
2, and after infill subdivision, they approximate 200 m
2. The area currently has 1351 dwellings, of which 884 are yet to be subdivided. Current subdivision patterns in this area are producing on average 3 dwellings per lot, but with apartments being planned along the Southern Highway, this will probably increase. Allowing for the existing average of 3 dwellings per lot, this brings the number of potential dwellings in the area of analysis to 3119 (≈32 d/ha gross), meaning that it can potentially support, or in fact need, its own centralised commercial strip/centre, particularly when the planned commercial land was initially zoned for roughly 1000 dwellings and with car dependence in mind. If we take the commercial area of an urban village (≈10 m
2), it will mean that we would need an additional 2.4 hectares of commercial land, roughly 30 existing lots, to enable this area to become a fully serviced precinct.
Hypothetical new commercial precincts are indicated on the map to show the scale of this intervention. Their location is meant purely for illustration and discussion for future visioning purposes only. Area A shows leveraging and expanding existing commercial sites on medium-tier roads. Both sites contain large, underutilised abutting land parcels. As a note, this intervention is necessarily divided to accommodate the road network blockage caused by cul-de-sac streets. Area B leverages existing commercial land, pushing into suburban fabric and using wide, low-volume street frontage as its focal point. Area C uses commercial roadside “ribbon zoning” (long shallow zoning along roads or other features) typical in this context and, while offering the least potential in terms of place-making due to the high volume of traffic on an edge condition, is probably, due to local precedent, the most politically viable. Returning to the road network, this area only contains 35 road intersections, as opposed to 122 in the urban village above. Also, only three of them are 4-way intersections, as opposed to 47 (38%); therefore, questions need to be raised about suburban networks and their capacity to support a walkable environment, for which further analysis is required. Roads and intervention location aside, the take-home message from the illustration is the scale of commercial zoning the area could feasibly accommodate and require at the densities that are forthcoming with infill. As proof of the forthcoming demand-led increase in local amenity, we briefly turn to areas that are approaching 25 d/ha.
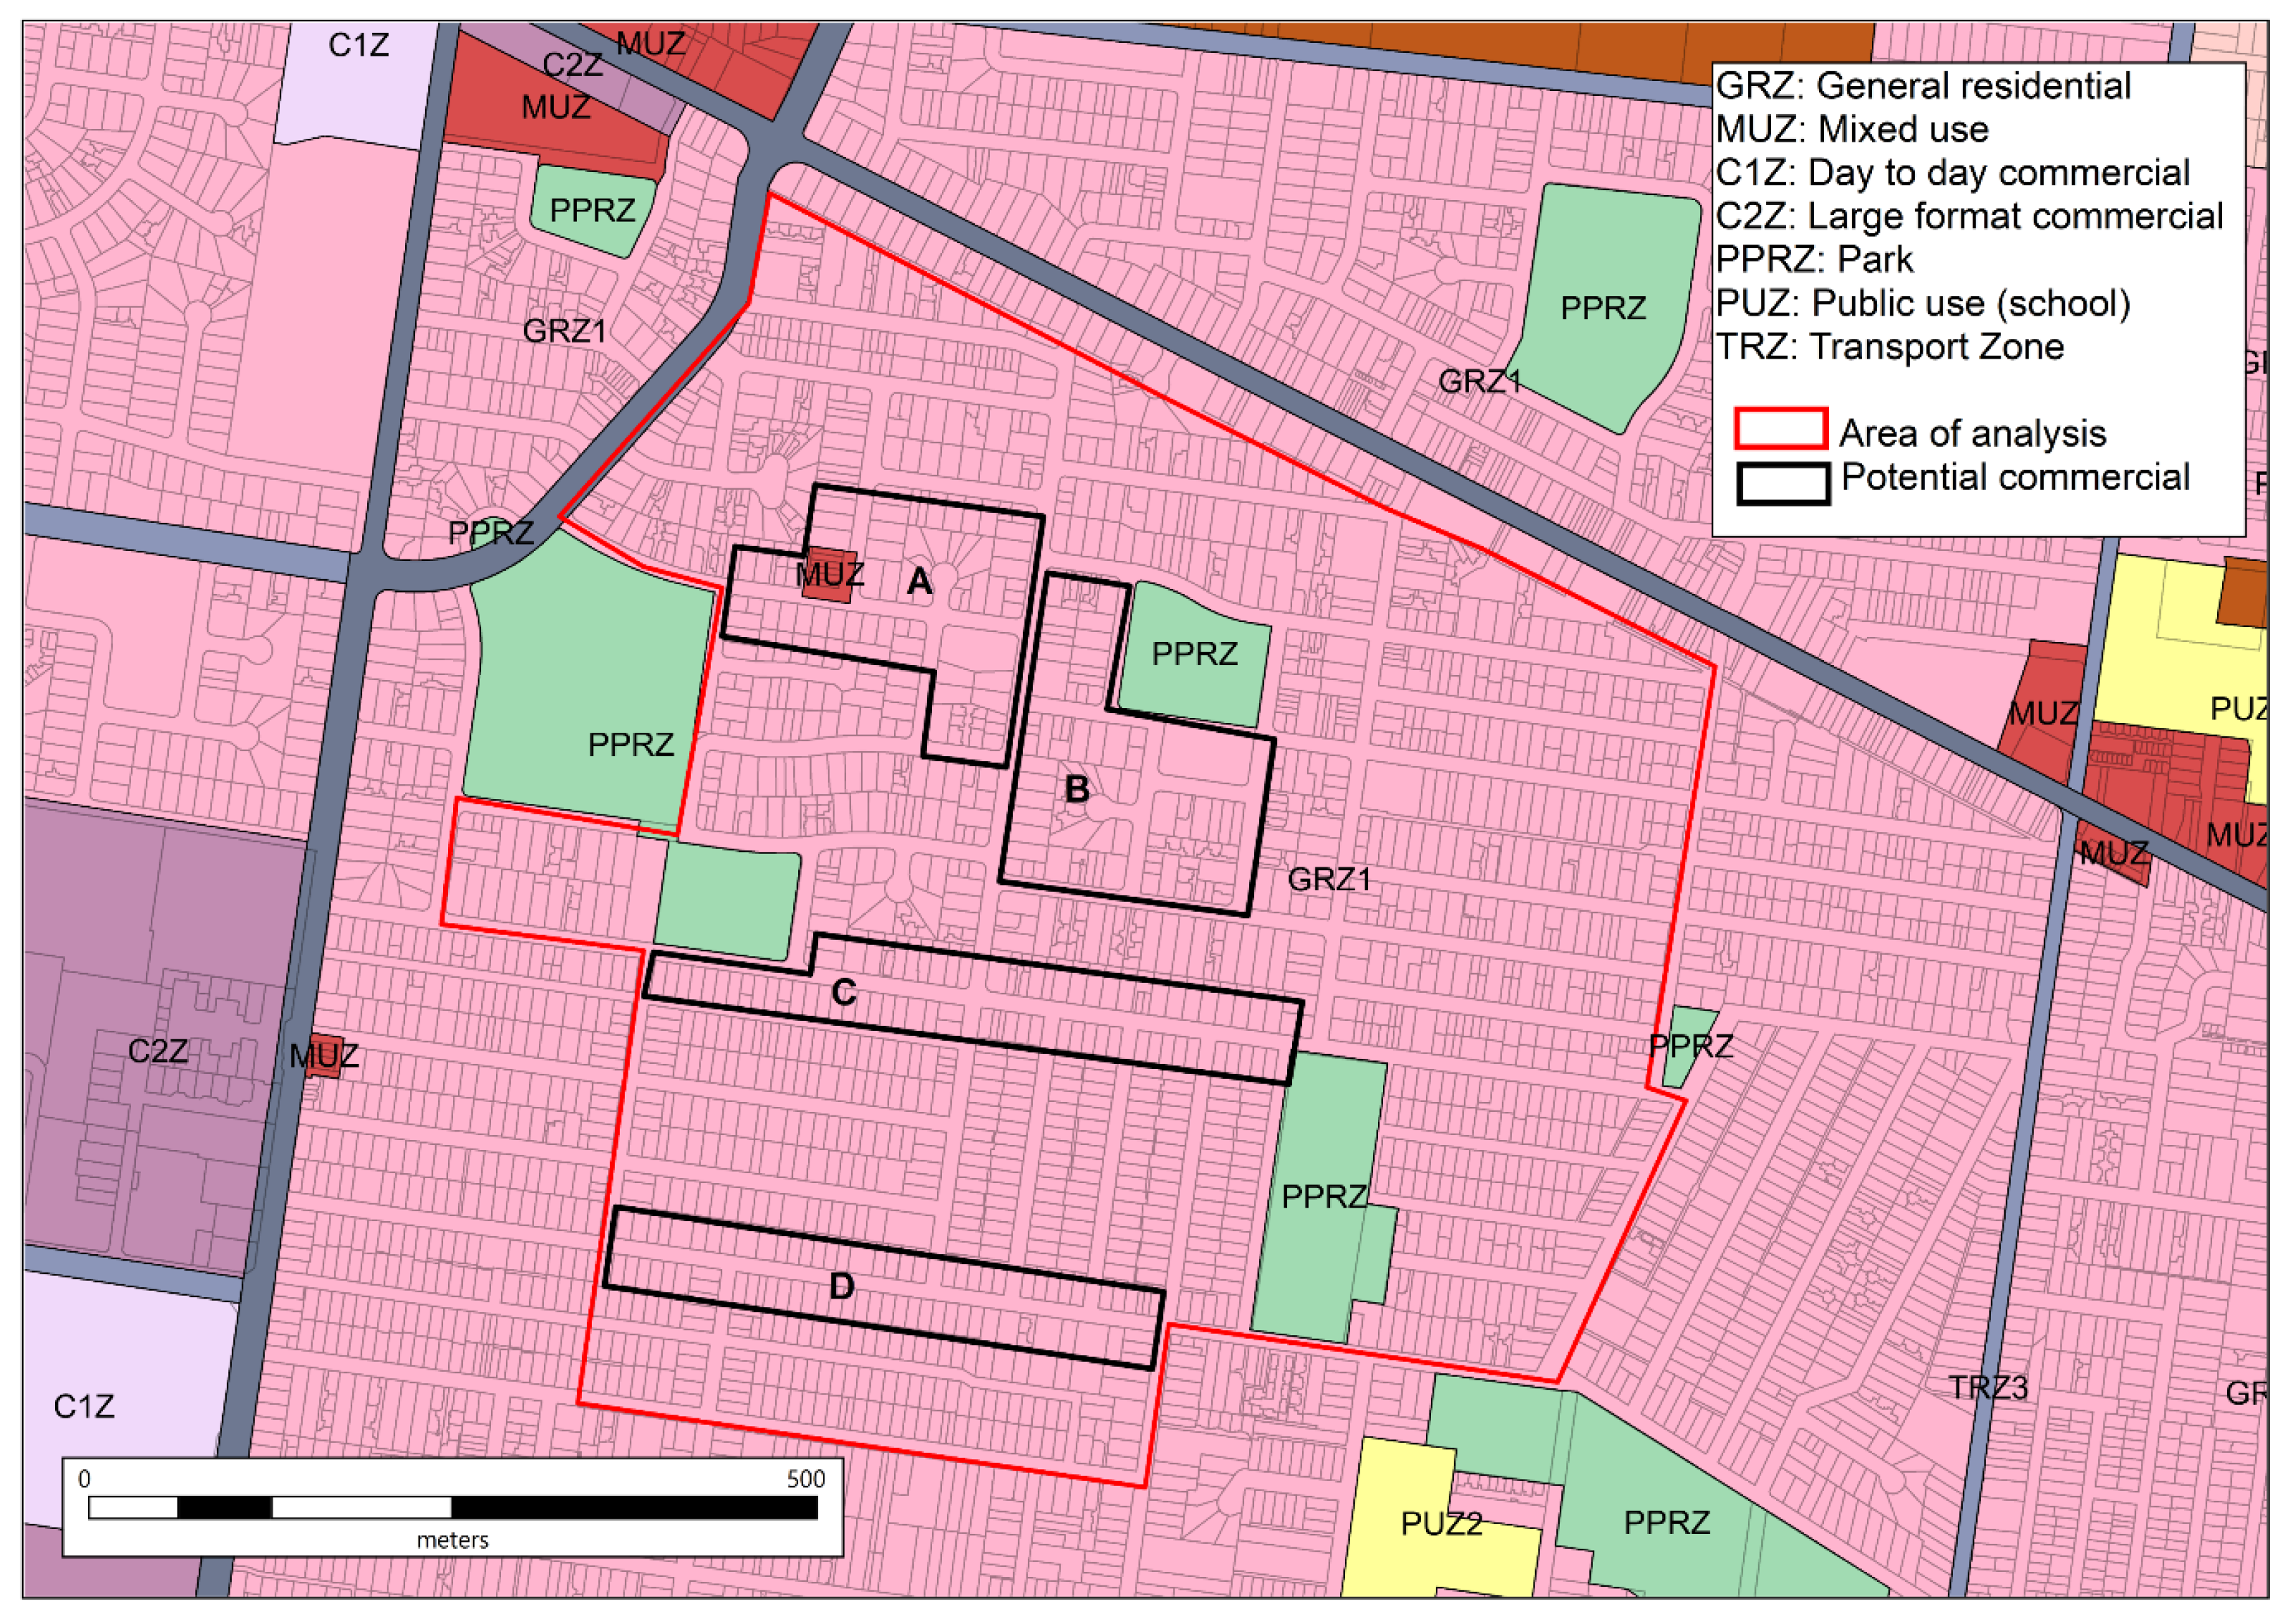
West Footscray (
Figure 6), being far closer to the Melbourne CBD (8 km), is more urban in terms of morphology and as such a very different context, though there are some similarities, particularly the highway-driven ‘edge condition’ of much of the commercial and mixed-use zoning, servicing vehicular ‘through’ traffic for speciality shops or offering low-tier services, such as fast food and liquor. Original subdivision lot sizes are smaller here, typically 400 m
2, producing new infill subdivisions of 150 m
2 or less. Of the 1820 existing dwellings within the bounded 1 km
2 area of research (18 d/ha), 1300 exist on their original lot, meaning that, at a redevelopment rate of 1:3, the number of dwellings in the assessment area will potentially be 4500, double that of the above urban village, and with only 2500 m
2 of mixed use internal to the area. Using the commercial area per dwelling for an urban village (≈10 m
2/dwelling), the area would require, and could arguably support, 4.6 hectares of additional commercial land, or 115 existing lots capable of turning from residential to commercial. Hypothetical commercial precincts are included in the map to illustrate the scale of potential interventions.
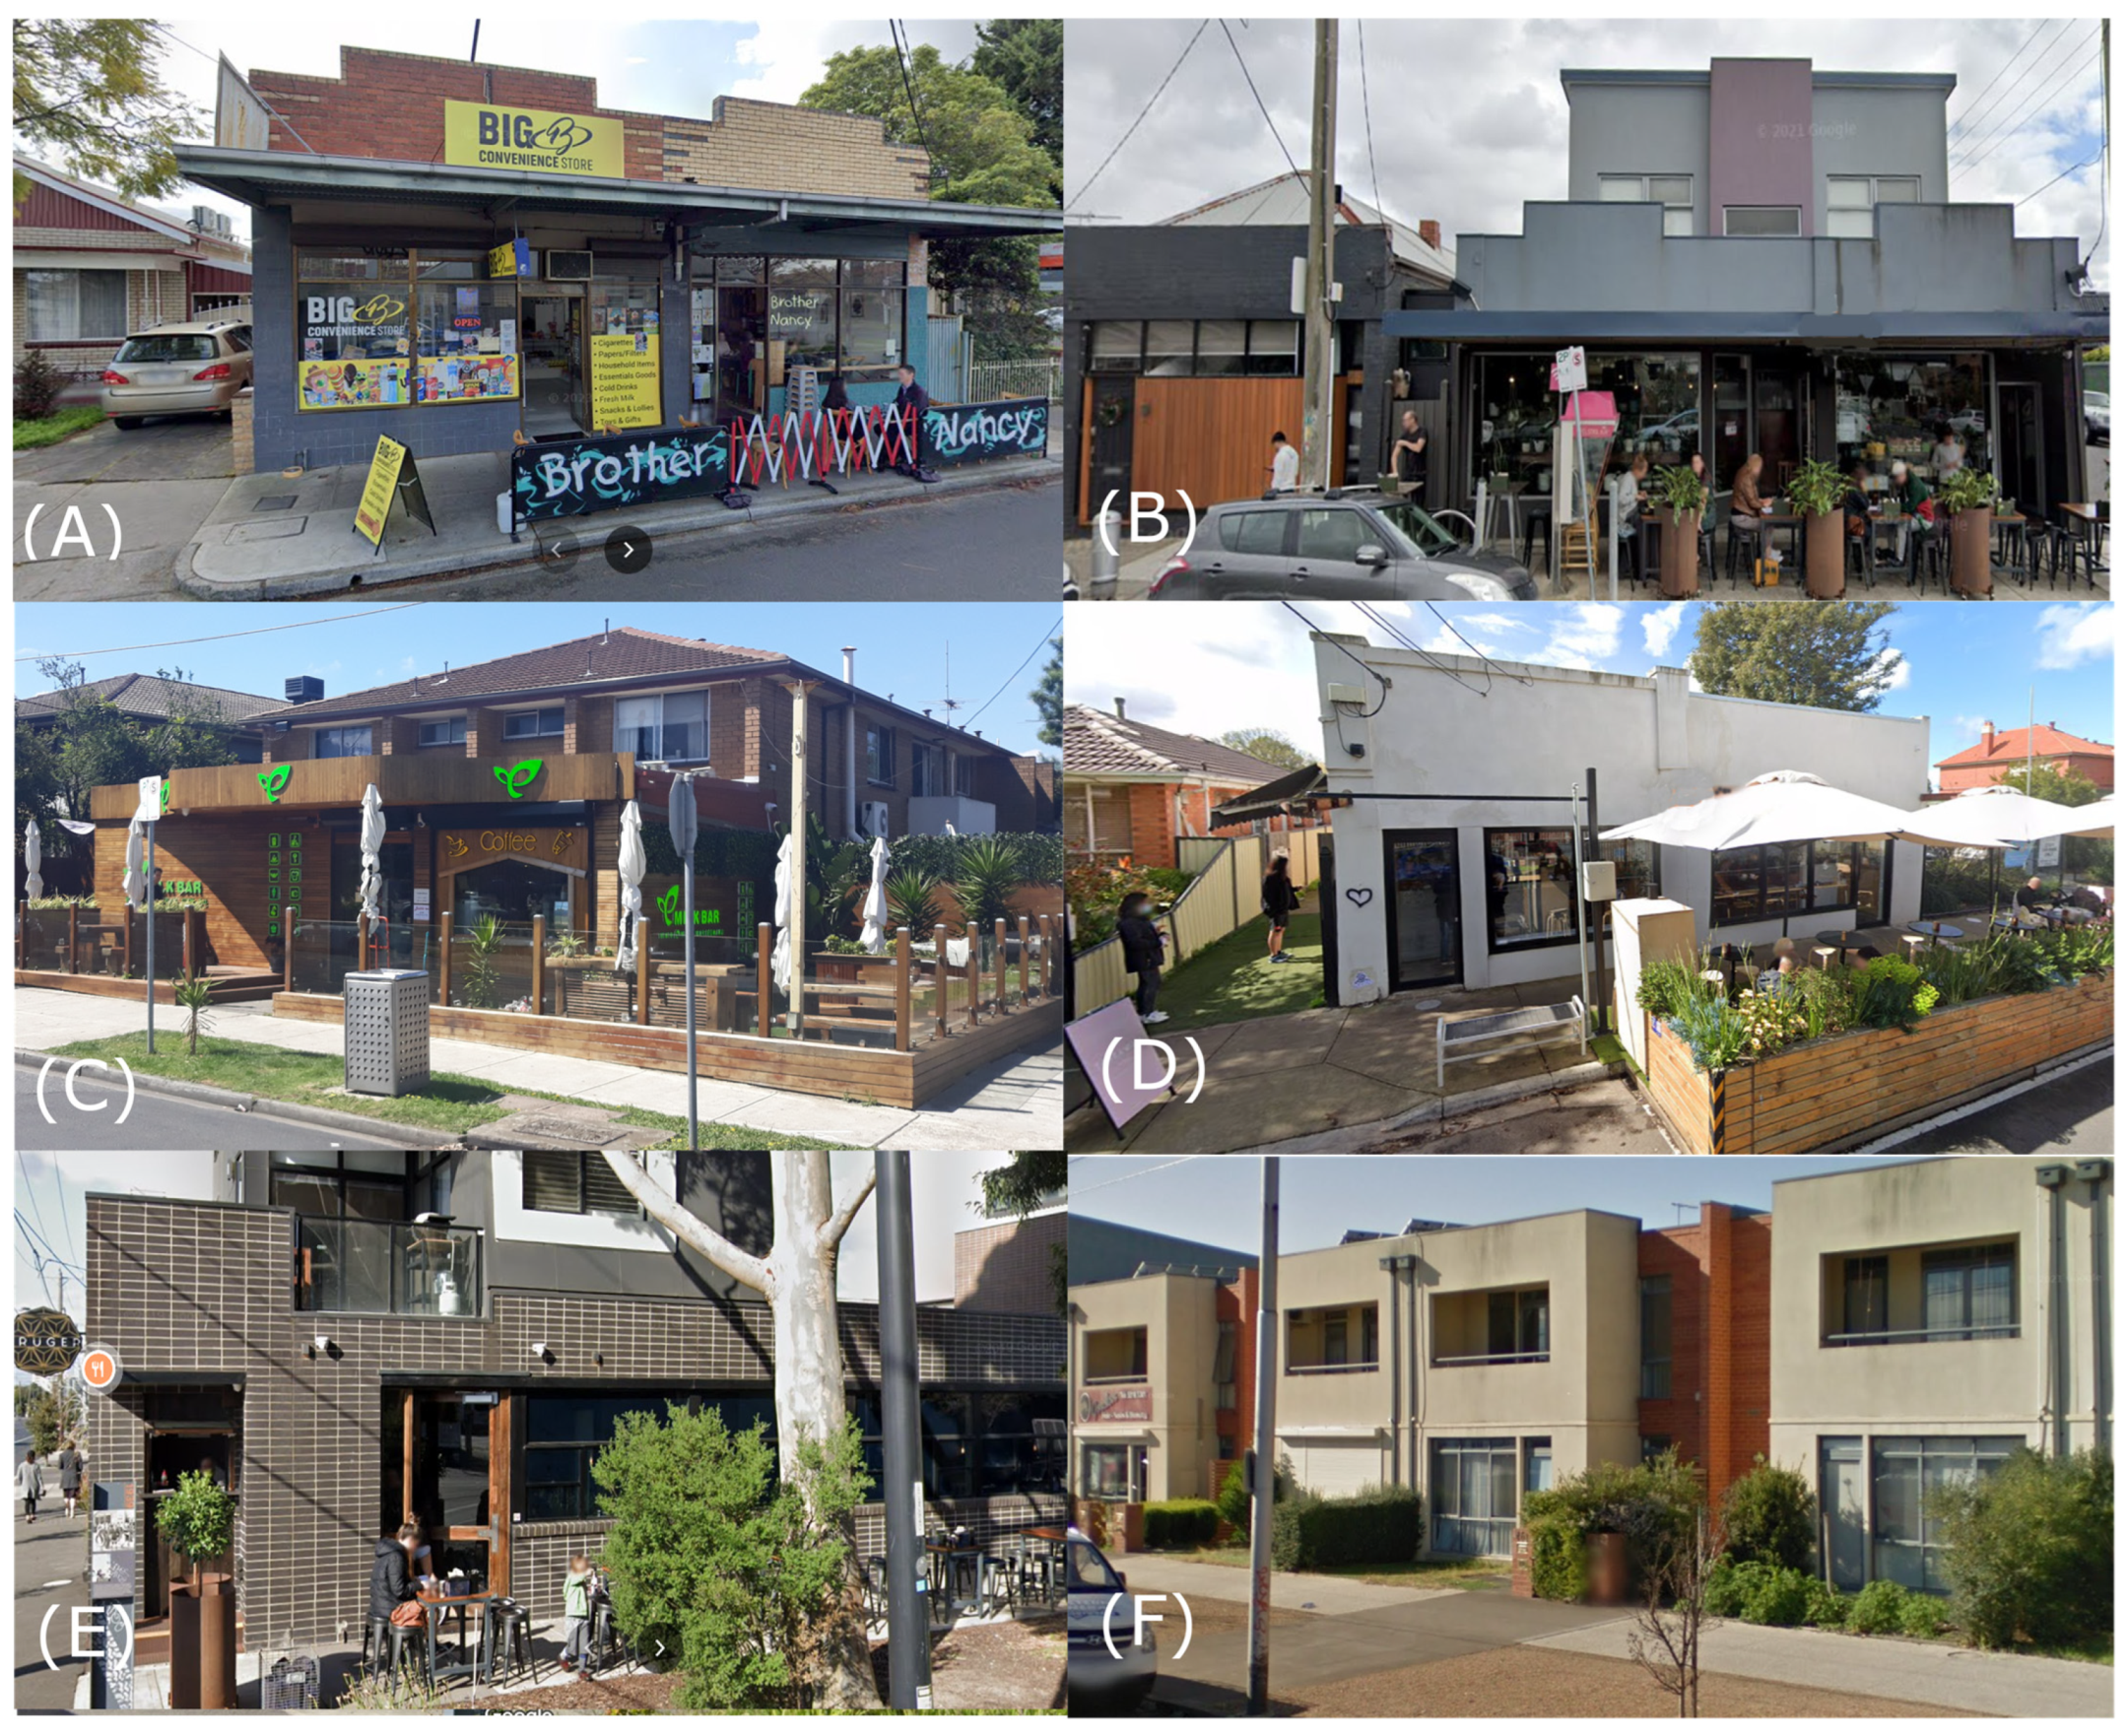
The lack of commercial zoning in this area, despite currently having 18 d/ha, is starting to provoke demand-led adaptation of housing, particularly where the dwelling fronts directly to the kerbside.
Figure 7 provides some examples showing how a range of typologies are achieving this. From the top left:
- A.
A mid-block (not a corner lot–locally typified as an old corner shop) light commercial duplex, the width of a typical house, and the result of a 1970s subdivision. While the built form was established in the 1970s, these were used residentially until reasonably recently, becoming reactivated in the last 5 years. Note the existing, bungalow style, with residential suburban form to the left.
- B.
A corner lot redevelopment, with residential above, is now operating as a café. Note that the building to the left has been allowed an extension to the kerb, allowing for the business to extend over a second lot due to the precedent and existing commercial/social licence, indicating the possibility of this built form spreading along the street.
- C.
A 6-pack multi-residential block of units has been retrofitted to allow the front 2 units, plus the car-parking associated with these units, to be utilised for commercial use while remaining in a residential zone.
- D.
A mid-block development was retrofitted as a cafe, reinforcing that not only corner lots can be used for this purpose. The surrounding built form can be seen to the left. As a point of note, many residences around this area have kerbside frontage to their side, with small city-block areas, indicating that this area, especially given its access to existing services (abutting a school, 50 m from a popular dog park, adjacent to a suburban thoroughfare), already has both the social licence and the built form to become a centre of localised activity.
- E.
The ground floor of a three-story building is part of a 2-hectare brownfield redevelopment. This shows the potential for future dwellings (infill redevelopments), where mixed-use can be considered for the ground floor if setbacks are reduced for nominated areas.
- F.
A mixed-use typology on the edge of a separate two- and three-story brownfield (infill) redevelopment It is mixed-use in that half of these dwellings are being used for residential and half for commercial–their fit-out allows for mixed modes of usage.
These are typically low-impact businesses, allowable under the planning scheme with a permit and minor internal alterations that speak to local laws regarding noise, waste and water disposal, and health/work standards. Their existence shows the viability of new businesses in the area and the need for local destinations that these new businesses satisfy. Again, it is crucial to note that this is only at 18 d/ha. When the area is fully built out, it could achieve upwards of 45 d/ha, more than doubling the catchment population, which will inevitably produce more bottom-up responses as local entrepreneurs seek venues to take advantage of this increase in demand for services in an area with no commercially zoned land within a walkable catchment. While online delivery services may erode the need for some aspects of commercial districts, we would argue that hands-on services, plus the need for spaces of sociality [
68], are, particularly with the rise of working from home [
69], becoming as critical in suburbs as they are in Activity Centres.
5. Discussion and Possible Planning Responses
To this point, we have established that suburbs are increasing in density, that, despite significant increases around Activity Centres, a good proportion of these density increases are occurring in low-serviced areas, and that the forthcoming density increases could support additional local services, which are beginning to appear in densifying areas that have business-appropriate structures. As such, these areas are evolving into higher density forms and, either naturally or with planning assistance, could create the conditions needed to deliver the various walkability, liveability, and ‘local living’ policies advocated by all Australian State planning authorities. But this raises the question of whether or how to intervene. Do we let this continue as is, producing small, haphazard islands of local services? Do we go on the front foot and look at local area rezoning? Or do we implement a mixture of both?
As a brief note on Australian planning schemes, although some discretion is allowable in terms of granting planning approvals, such as in Activity Centres, where “Height and setback controls can be appropriate so long as they are not aimed at restricting the built form but at facilitating good design outcomes.” [
70] Australian planning regimes are generally non-discretionary, opting instead for the hard residential coding found in the US, where setbacks and heights (or expected densities and floor space ratios) are explicitly stated in the variously jurisdictional planning schemes [
71]. A product of this is a uniformity of housing products that directly reflect the planning codes of the time, as in [
72], meaning we can predict redevelopment outcomes based on zone requirements.
Considering the first option, a laissez-faire approach would see residential infill increase densities reasonably equally across a suburb. The redevelopments would deliver mostly two-story semi-detached houses or smaller detached units running the length of a driveway, which is the typical redevelopment option on small single lots due to zoning requirements (and market/developer viability). In some instances, on larger or amalgamated lots, we may see low-scale apartments, though these would need to show impact assessment and more likely occur in lower-amenity areas such as along main roads and highways. We can reasonably assume then that a similar uniform residential suburban outcome will be produced, though obviously denser. Accompanying this, and in existing structures that concurred with commercial layout (on street frontage, corner lots, etc.), we would then see opportunistic low-scale commercial activity. The limited supply of these structures (as setbacks are rigidly enforced) would see only small pockets of isolated activity. And while there may be some contagion effect due to precedence and social licence, allowing abutting structures to retrofit and be built to the street, we would see an opportunity lost in terms of developing a site that can accommodate the wider commercial functions necessary to satisfy the full functionality of an Activity Centre.
Next, and taking a top-down approach, in an attempt to synchronise and optimise outcomes for a consolidated new centralised commercial district, we could consider a rezoning of one area to commercial. While this would give a clear signal to local area outcomes, it is highly problematic. In terms of political feasibility, rezoning would raise significant community concern over land value, negative externalities, and the location of the new precinct, making its implementation inordinately cumbersome and costly for local governments. In terms of built form feasibility, the proposal would be reliant on a whole-scale redevelopment of sites to bring them into line with local laws and community expectations in the form of a commercial centre, which, again, would require far more coordination and funding than the local government has capacity for. And finally, in terms of economic viability, should a commercial area be created, it will not necessarily be fully leased until the area has achieved the required density and the use of the area obtains a social licence for use, which may take 20+ years to achieve. So, in an attempt to masterplan a grand vision, local authorities may find that an overengineered planning solution renders the outcome obsolete for the immediate future while also requiring significant resources to achieve, which may be better served elsewhere. However, a middle ground exists—one that allows for the slow change of the built environment while also steering local area regeneration towards a consolidated outcome.
Given that these suburban areas are primed for significant, though fragmented, future redevelopment, there is an opportunity to influence the built form outcomes so that the resultant buildings reflect the function of dwellings while also, potentially, being able to function as businesses. This would first require identifying an appropriate area, variously through road network analysis, market analysis for precinct redevelopment potential, and the range of planning activities indicated by Dunning et al. [
20], to provide planning guidance for soft densification processes. Following which, and to satisfy political feasibilities, community visioning exercises to locate a new suburban centre would be required, as in [
73,
74]. Then, by applying the preferred rate of commercial area per dwelling to the precinct (≈10 m
2/dwelling), the scale of intervention can be determined in terms of the number of land parcels that the precinct would need as commercial going forward. Following this, planners could gently influence development outcomes in the selected area by, for example, removing front and side setback requirements, setting multi-use ground-floor standards for new builds, or promoting land-assembly policies to allow greater massing, so that when the need for more commercial space did arise, the built form for its activation, plus the allowable land-uses, were already in existence, allowing for a fluid transition between residential and commercial activity.
The benefits of this approach are, firstly, that no master planning is required, which significantly reduces the economic burden of local authorities. Instead, a reasonably simple visioning exercise with the community, combined with marginal alterations to setback controls through the planning scheme, would suffice. Significantly, this approach also allows for the consolidation of services into one area and the creation of future precincts by setting the rules for future redevelopment, not for existing forms, meaning that the issue of the timing of sales for land assembly and redevelopment becomes irrelevant, as all (or most) buildings in the selected area will eventually conform to the desired future character, creating opportunities for destination creation and local area activation in parallel with residential development.
6. Conclusions
The purpose of this article was to first show that urban (re)development is occurring reasonably universally throughout Australian cities. While underlying land-value, derived through locational and service access factors, will have an impact on the typological outcomes and resultant density increases, it does not have an impact on the volume of these projects, with, for Melbourne, nearly 50% of all development projects being suburban infill unattached to Activity Centres or their spillover effect. Density increases are therefore almost universally guaranteed, though to varying degrees, based on market and political factors.
We also raised concerns about purely density-driven compact city policies in areas with little or no access to services. Though some areas in middle- and outer-ring areas are geared for higher scales of development and zoned appropriately, most of the land in Australian cities is not being planned for low-density, with commercial centres being necessarily sparse due to large catchment areas to accommodate the lower population density. The result of this is vast tracts of purely residential land. Adding more dwellings to these areas does not collectively create a compact city; it just creates disamenity by producing a denser, poorly serviced residential area, an issue that critics of compact cities regularly speak to.
Important in the discussion about compact cities is the issue of available and viable commercial space. To illustrate this issue, we showed that, across Melbourne, there is a consistent metric of roughly 25 m2 of commercial space per dwelling, per municipality, irrespective of location (excluding CBD locations). Examining the commercial area of a range of successful urban villages across Melbourne, we found that, in areas with 25 dwellings per hectare, each dwelling could service roughly 10 m2 of commercial space. While only calculated for Melbourne, it shows that there is a reasonably consistent volume of commercial space that becomes viable at specific densities, meaning that, as suburban densities increase, underserviced areas could begin to have their own centres, adding amenity back to the densifying area and contributing to a more holistic application of the compact city agenda.
Given that urban densities are increasing throughout and that many suburbs in middle-ring councils will eventually get to walkable densities, we finally suggest that there is an opportunity here to plan for the future of these areas. Acknowledging that a fully top-down or bottom-up strategy would be less than ideal, we therefore propose a soft, incremental planning process—one that; as land parcels are redeveloped; slowly begins to alter the built form to allow for a fluid transition from residential towards more commercial or mixed use; and vice versa; as demand dictates.
The timeliness of this debate coincides with recent changes to the Victorian planning scheme, with the Victorian Premier delivering a housing statement pushing for 800,000 new homes over 10 years [
75], as well as major changes to state-controlled aspects of the planning scheme to fast-track major developments and proposed changes to municipal aspects of local planning schemes, allowing government-designed medium-rise typologies [
76] as-a-right when proximate to Activity Centres and transport hubs. While these changes will lead to more homes in well-serviced locations, questions remain about those areas that are and will remain poorly serviced without some thought to future land use.
In conclusion, as one of the most suburban countries in the world and with some of the most sprawling cities, Australia has some way to go to achieve compact urban form. While still, in part, planning for more urban sprawl, housing infill targets, combined with large suburban land parcels of mostly detached housing stock and significant market pressures on land and housing supply, have seen single-lot redevelopment become a reasonably typical process for middle-ring suburban landowners. A product of this is that suburbs are densifying, but with most of the land being non-strategic, many areas are densifying without a clear vision for the future in terms of service demand.
Over the next few decades, we will see our suburbs at densities that can afford their own walkable commercial centres, but without strategic investment, they will remain the car-dependent environments that they currently are. Capacity constraints at the municipal level have, to date, made precinct planning at this scale unviable; however, by incorporating ad-hoc infill into a regeneration process and gently guiding the built form outcomes towards multi-functionality, we can begin to slowly create the new (sub)urban centres of the future, delivering a more holistic compact city model to the suburbs.


