Article

Short-Term Nitrous Oxide Emissions from Cattle Slurry for Silage Maize: Effects of Placement and the Nitrification Inhibitor 3,4-Dimethylpyrazole Phosphate (DMPP)

by
Arezoo Taghizadeh-Toosi
1,2,3,*,
Khagendra Raj Baral
1,4,
Peter Sørensen
1 and
Søren O. Petersen
1
1
Department of Agroecology, Aarhus University, 8830 Tjele, Denmark
2
Danish Technological Institute, Skejby, 8200 Arahus, Denmark
3
Centre for Ecology & Hydrology, Lancaster Environment Centre, Lancaster LA1 4AP, UK
4
Agri-Environment Branch, Agri-Food and Biosciences Institute, Belfast BT9 5PX, UK
*
Author to whom correspondence should be addressed.
Sustainability 2023, 15(22), 15810; https://doi.org/10.3390/su152215810
Submission received: 7 September 2023 / Revised: 2 November 2023 / Accepted: 8 November 2023 / Published: 10 November 2023
(This article belongs to the Section Soil Conservation and Sustainability)

Abstract

:
Cattle slurry is an important nitrogen source for maize on dairy farms. Slurry injection is an effective measure to reduce ammonia emissions after field application, but with higher risk of nitrous oxide emission than surface application. This study compared soil mineral nitrogen dynamics and nitrous oxide emissions with two ways of application. First, traditional injection at 25 cm spacing between rows followed by ploughing (called “non-placed slurry”), and second, injection using a new so-called goosefoot slurry injector that placed the slurry in ploughed soil as a 30 cm broad band at 10 cm depth below maize crop rows with 75 cm spacing (named “placed slurry”). Furthermore, the effect of treating slurry with the nitrification inhibitor 3,4-dimethylpyrazole phosphate (DMPP) in Vizura® was tested with both application methods. The field experiment was conducted on a sandy loam soil in a temperate climate. Both nitrous oxide emissions, and the dynamics of soil mineral nitrogen, were monitored for eight weeks after slurry application and seeding of maize using static chambers. The level of nitrous oxide emissions was higher with non-placed compared to placed slurry (p < 0.01), mainly due to higher emissions during the first four weeks. This might be due to higher rates of nitrification and in turn stimulation of denitrification. In both placed and non-placed slurry treatments, Vizura® caused higher soil ammonium concentrations and lower nitrate concentrations (p < 0.001), particularly from 3 to 8 weeks after slurry application. The final level of soil nitrate was similar with and without the nitrification inhibitor, but higher with placed compared to non-placed slurry. Adding Vizura® to non-placed slurry reduced nitrous oxide emissions by 70% when compared to untreated slurry. Surprisingly, there was a non-significant trend towards higher cumulative emissions from placed slurry with the nitrification inhibitor compared to untreated slurry, which was due to higher emissions in the last part of the monitoring period (5–7 weeks after slurry application). Possibly, degradation of the nitrification inhibitor and nitrification activity inside the slurry band as the soil dried promoted nitrous oxide emissions by this time. In summary, placement of untreated slurry in a broad band under maize seeds reduced nitrous oxide emissions compared to non-placed slurry with more soil contact. A comparable reduction was achieved by adding a nitrification inhibitor to non-placed slurry. The pattern of nitrous oxide emissions from placed slurry treated with the inhibitor was complex and requires more investigation. The emission of nitrous oxide was highest when nitrate accumulated in soil around decomposing cattle slurry, and mitigation strategies should aim to prevent this. This study demonstrated a potential for mitigation of nitrous oxide emission by placement of cattle slurry, which may be an alternative to the use of a nitrification inhibitor.

1. Introduction

In agroecosystems, nitrogen (N) is an essential nutrient and a key limiting factor for the growth and development of crops [1]). Animal manure has been used as a source of N for centuries. Generally, the application of organic fertilizers increases the risk for environmental losses via ammonia volatilization, leaching, or emissions of other N gases including nitrous oxide (N2O) emissions. Intensive dairy production is dominated by liquid manure management [2]. Field application of liquid manure (slurry) involves risks for the environment such as ammonia volatilization, leaching, and N2O emissions. Ammonia volatilization from slurry is effectively reduced by injection or immediate incorporation [3,4]. When cattle slurry is applied before seeding of spring crops such as maize, nitrate (NO3) leaching is a risk depending mainly on soil type and rainfall during spring [5]. Nitrous oxide has a high global warming potential (GWP) of 265 with a 100-year time horizon and plays a central role in the depletion of stratospheric ozone [6,7]. Both nitrification and denitrification processes are potential sources of N2O from agricultural soil. However, studies under controlled laboratory conditions (e.g., [8]) as well as field conditions [9] have found that denitrification and nitrifier denitrification are the main sources of N2O emissions. These various environmental risks must be managed by optimizing practices for the use of slurry as a fertilizer, including treatment and choice of application method.
Following field application, manure-saturated soil volumes result in the development of organic hotspots supporting nitrification and denitrification for several weeks [10,11]. With a high content of ammoniacal N, water, and easily degradable carbon (C), manure hotspots can become anoxic because of diffusional constraints and elevated oxygen (O2) consumption rates for microbial respiration, and in anoxic volumes, degradable C is available for denitrification [12,13]. The slurry application method determines the contact between soil and manure, and the balance between oxic and anoxic degradation.
The conversion of ammonia to nitrite and nitrate in the soil around manure hotspots is often the limiting factor in coupled nitrification–denitrification. Preventing nitrification, using a nitrification inhibitor [14], can be an effective strategy to mitigate N2O emissions from manure-treated soil [15]. Nitrification inhibitors can desynchronize C and N turnover after slurry application by limiting the availability of NO3 as electron acceptor for denitrification. Synthetic nitrification inhibitors have been widely shown to suppress the activity of ammonia-oxidizing bacteria by inhibition of ammonia monooxygenase (AMO), the enzyme responsible for the first step in the oxidation of ammonium (NH4+) to nitrite (NO2), thereby reducing the nitrification rate and the risk for subsequent losses through NO3 leaching or denitrification and N2O emissions [16,17,18]. Nitrification inhibitors are sensitive to temperature, and at 20 °C, the inhibitory effect is lost within 5–6 weeks.
Silage maize as feed for dairy cattle is a main crop in Denmark, especially on sandy soils, and approximately 7% of the total agricultural area is under maize [19]. Cattle slurry is widely used as a fertilizer for maize. Traditionally, cattle slurry is injected before soil ploughing and seed bed preparation to reduce N losses. Another strategy to decrease environmental N losses, including N2O emissions, after slurry application is to improve the ability of living roots to take up nutrients such as N. This can be achieved by placing the slurry close to crop seeds for better root nutrient access [20]. Maize seedlings prefer uptake of NH4+ over NO3 [21]. In addition, placement of slurry close to maize seeds can increase the initial phosphorus uptake of the young plants [20]. The infiltration of slurry liquid into the soil is impeded by sealing effects [22], and water retention by organic dry matter in the manure [23]. After placement of slurry under the seed, suspended and dissolved slurry organic matter becomes lodged inside pores surrounding the slurry-saturated soil [24], resulting in increased retention of N in the root zone. Placement of slurry provides a more concentrated distribution of slurry C and N than is the case with non-placed slurry, increasing the risk for N2O emissions. This study evaluated a new injection tine design to increase the soil–manure contact area, but the effect on N2O emissions was unknown.
The main objective of this study was to investigate the effects of: (1) cattle slurry application method (traditional direct injection and ploughing vs. placement as a broad band under maize), and (2) use of a nitrification inhibitor (Vizura® with the active compound 3,4-dimethylpyrazole phosphate (DMPP)), on soil mineral nitrogen and N2O emission dynamics during the initial growth of maize. It was hypothesized that (1) DMPP would reduce N2O emissions independent of slurry distribution in soil, and (2) placement of slurry would reduce N2O emissions compared to non-placed slurry by enhancing the plant removal of soil mineral N from the soil solution.

2. Materials and Methods

2.1. Field Experiment

The field experiment was conducted in 2020 at Foulumgaard (56°49′ N, 9°56′ E), an experimental farm at Viborg campus of Aarhus University, Denmark. The 3 × 18 m2 experimental plots were established to evaluate N and P utilization of maize. The plots were organized as a randomized block design with three replications (Table 1), except that nonfertilized sampling positions had to be placed in a separate plot of the same field. The soil is a sandy loam based on ground morainic deposits from the last glaciation classified as a Mollic Luvisol according to the WRB (FAO) system [25] with 9% clay, 9.3% silt, 42.8% fine sand, and 38.8% coarse sand. Total soil organic carbon and pH were 1.5% and 5.3, respectively.
The cattle slurry was obtained from a local farm. It contained 5.6% dry matter, 3.4 kg total N Mg−1, and 1.9 kg NH4+-N Mg−1. All fertilized plots received cattle slurry at a rate of 110 kg NH4+-N ha−1, equivalent to 57 Mg ha−1. Where required, the nitrification inhibitor Vizura® (BASF, 97 Ludwigshafen, Germany) with the active compound 3,4-dimethylpyrazole phosphate (DMPP) was admixed in the slurry tanker at a rate corresponding to 2 l ha−1 before field application. In treatments without placement (called non-placed slurry), cattle slurry was injected using a traditional closed-slot injector with narrow tines at 10 cm depth at a band width of 25 cm. This was immediately followed by ploughing (0–25 cm depth) before seeding. In treatments with slurry placement, cattle slurry was injected into ploughed soil in a broad band (about 30 cm broad) with the upper edge of the slurry band at 10 cm soil depth. Here, slurry injection was performed with a 26 cm wide goosefoot tine and a roller to ensure an accurate injection depth. The distance between tines was 75 cm, corresponding to the distance between maize rows in this trial. Maize (Zea mays) was sown at 5 cm depth immediately over the injection bands with placed slurry. All fertilized treatments also received 27 kg N ha−1 in ammonium sulphate as a starter fertilizer placed 5 cm beside the seeds [20].

2.2. N2O Measurements

Monitoring of N2O took place between 29 April and 22 June 2020 with a total of 12 sampling days, i.e., three times during the first week and then at weekly intervals. Flux measurements were conducted using 37 cm × 27 cm × 22 cm static chambers placed over 35 cm × 25 cm × 15 cm support frames of stainless steel that were permanently installed within or between maize crop rows. The chambers were made of PVC and covered with an outer layer of Aluthermo Quattro (Adflexion Aps, Odense, Denmark) for insulation and reflection of solar radiation. They had a butyl rubber septum for gas sampling and a rubber seal at the bottom. Elastic straps were used to fix the chambers to the ground on either side; this ensured a tight seal during measurements. The support frames were placed with the long side perpendicular to crop rows, i.e., row and interrow positions together covered 70 of the 75 cm row and interrow area. The support frames were installed immediately after slurry application, and only temporarily removed for seeding after 5–6 days.
Gas sampling was generally completed between mid-morning and noon. Ten milliliter gas samples were collected using a 10 mL plastic syringe with hypodermic needle immediately after chamber deployment, and at three additional time points. Each time, the syringe was purged several times with headspace air before withdrawing the gas sample. Gas samples were stored in pre-evacuated 6 mL exetainer vials (Labco Ltd., Ceredigion, UK) until analysis for N2O using an Agilent 7890 (Agilent, Nærum, Denmark) gas chromatograph configured as previously described [26].

2.3. Soil Sampling

Soil samples were collected in the five main treatments (Table 1) on the same days as gas sampling. Six individual subsamples were randomly taken from each treatment and block using an auger (2 cm diameter, 0–20 cm depth), and from each plot were pooled and transferred to zip-lock plastic bags and stored at 2 °C until analyzed. Soil samples were mixed and sieved (<6 mm mesh size), and subsamples were taken for analysis of NH4+-N and NO3-N, within two days of soil sampling. Approximately 10 g of soil was extracted in 40 mL of 1 M KCl for 30 min (end-over-end) and then allowed to settle. The supernatant was filtered (1.6 μm glass microfiber filters; VWR, Spånga, Stockholm, Sweden) and frozen at −20 °C for later analysis on an AA500 Autoanalyzer (SEAL analytical GmbH, Norderstedt, Germany). Gravimetric soil water content was determined by drying 10 g of soil for 24 h at 105 °C.

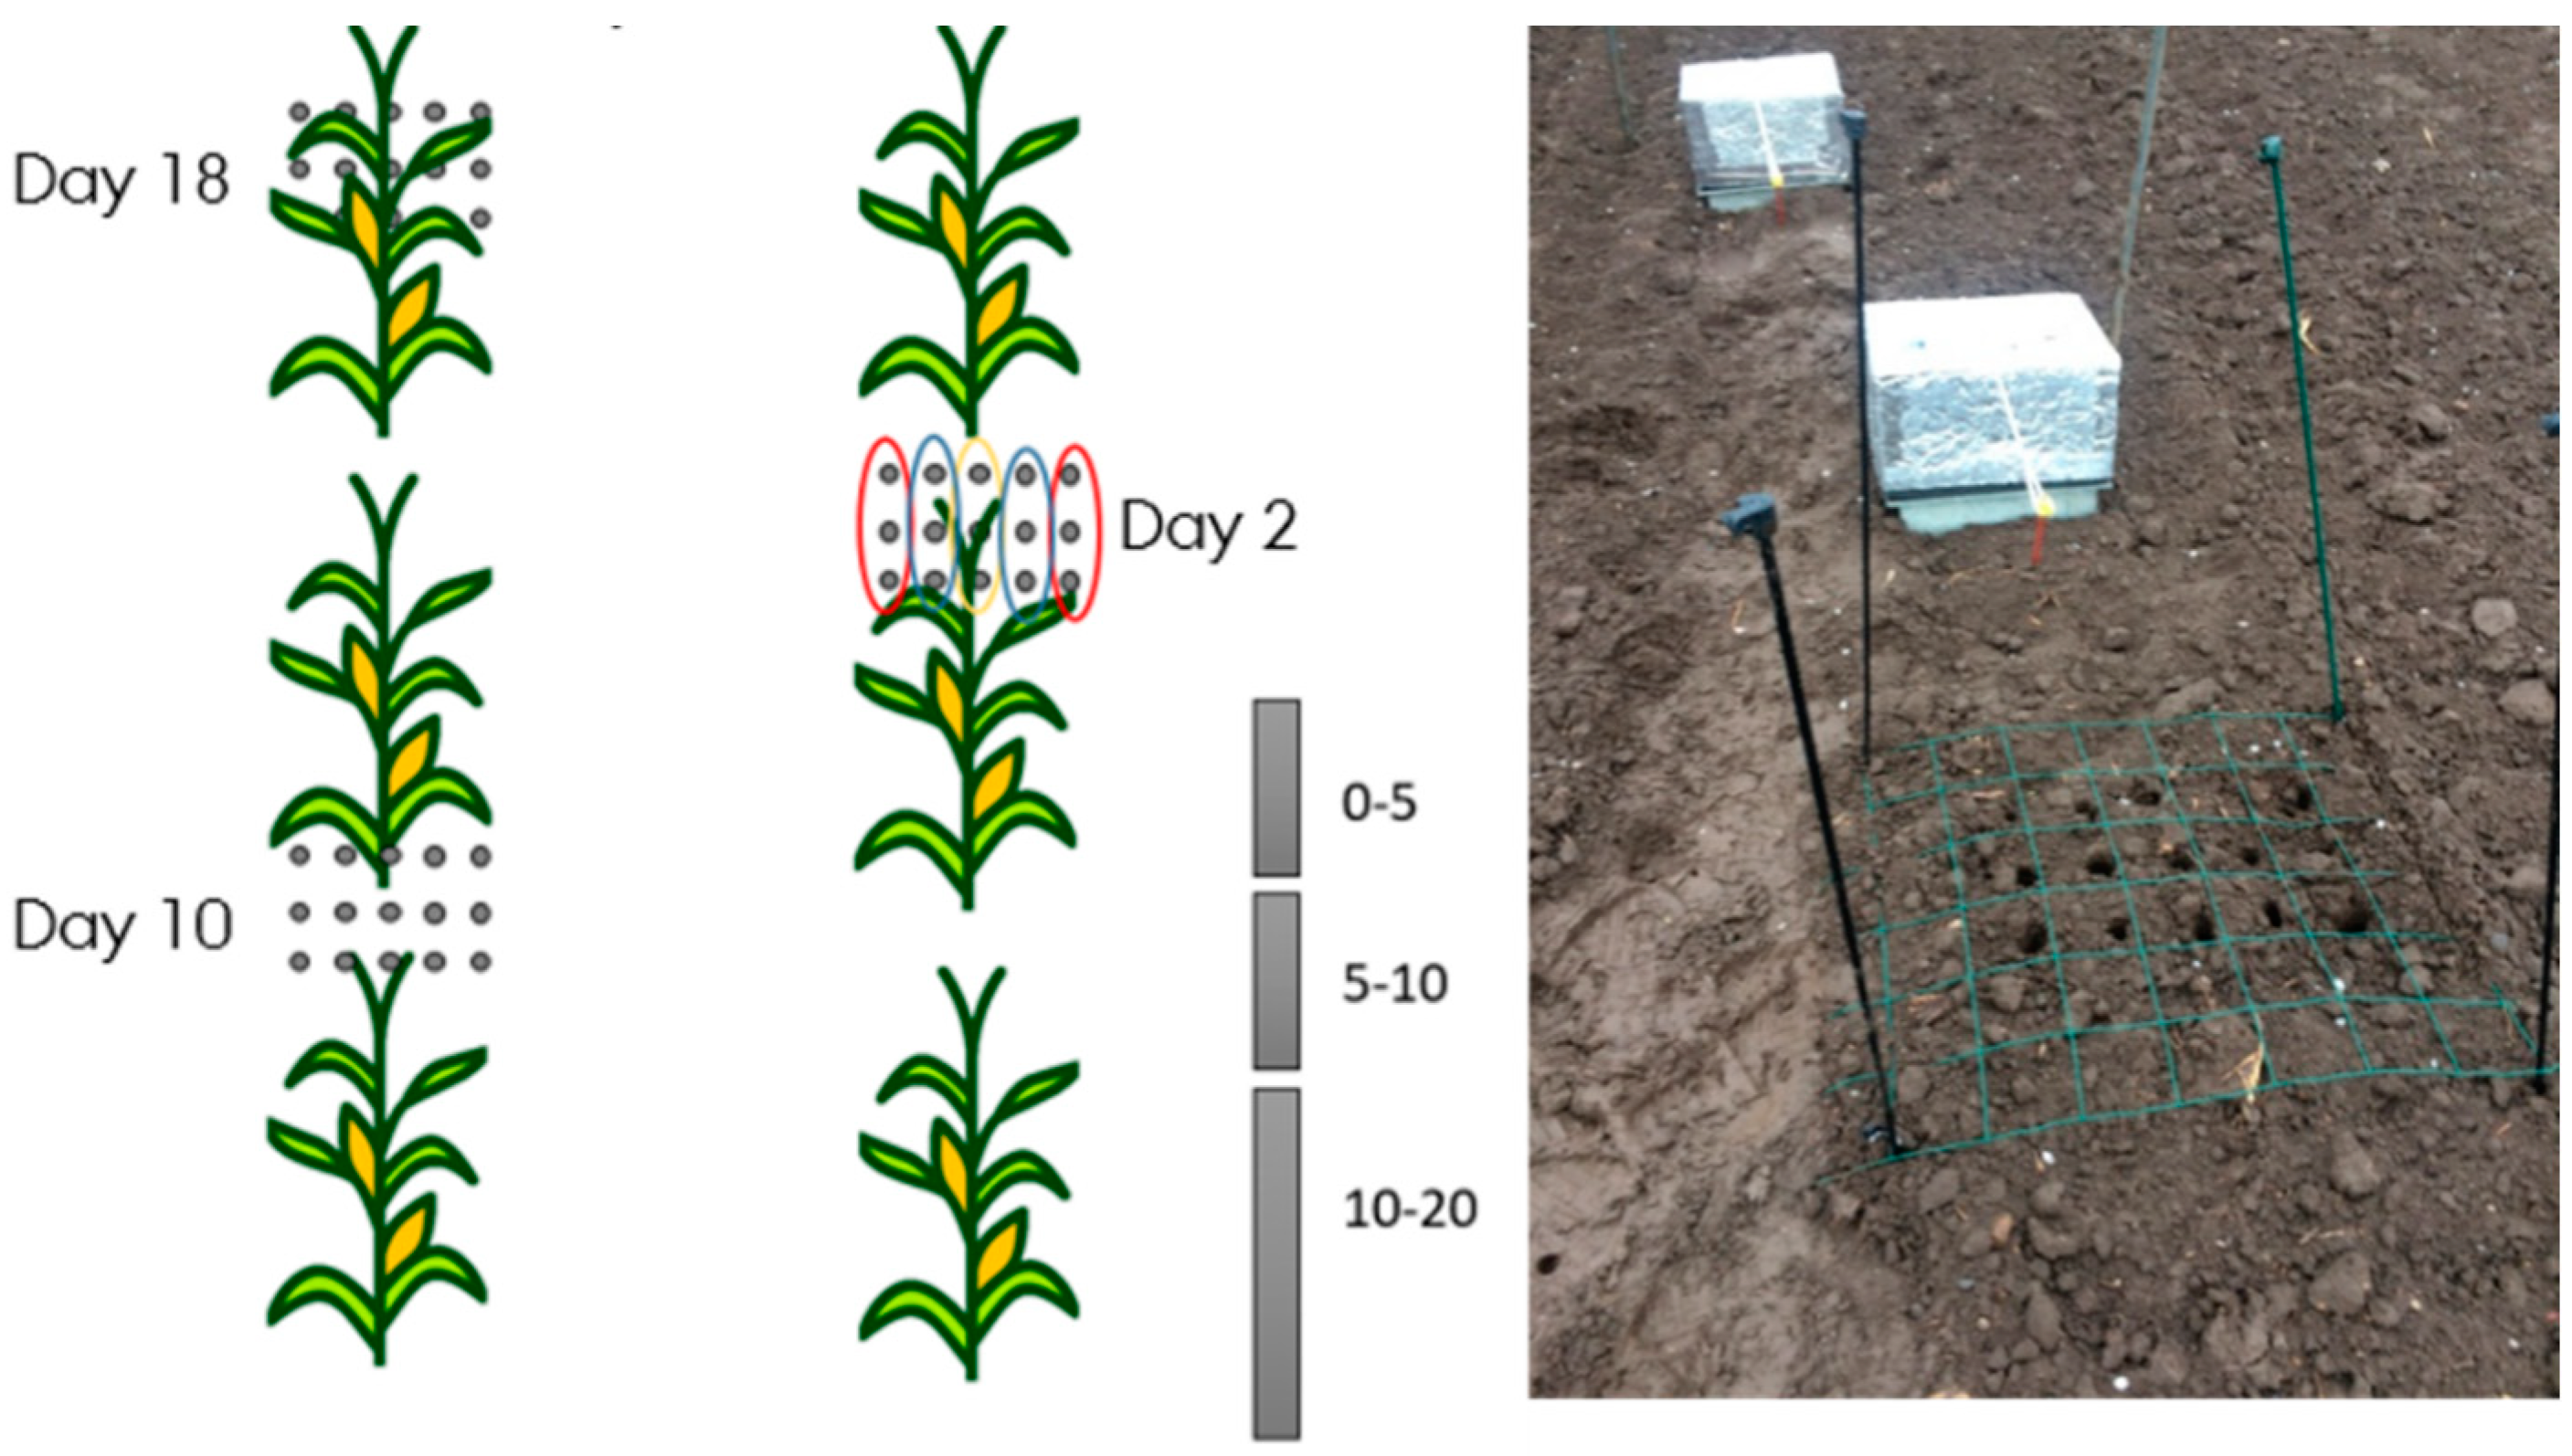
2.4. Distribution of Mineral N after Placement

In a separate activity, additional soil samples were taken on day 2, 10, and 18 of the monitoring periods to map the horizontal and vertical distribution of mineral N after placement of cattle slurry with or without Vizura. Soil samples (2 cm diam., 0–20 cm depth) were taken at the center of the slurry band, and at 10 and 20 cm distance on either side. These samples were taken in three different positions along the length of the slurry band 10 cm apart. Each soil core was subdivided into three depth intervals (0–5, 5–10, and 10–20 cm depth), and subsamples from each distance and depth were then pooled for analysis. For each depth, three subsamples were pooled in the in-row position, and six subsamples per depth at 10 and 20 cm distance from the crop row. Hence, there were in total nine pooled samples from each of the two treatments. With three replicated field plots and three sampling days, there were 162 individual soil samples for analysis of moisture content and mineral N (NH4+-N and NO3-N), as explained above.

2.5. Data Analyses

Nitrous oxide fluxes were calculated using the HMR package available as a package in the R programming language [27]. Table 1 shows an overview of treatments and chamber placements.
Statistical analyses of the data were performed using R programming language version 4.1.2. Temporal N2O fluxes and cumulative N2O were analyzed for the interrow (IR) and within-row (Row) positions, separately as well as together, and in both cases excluding control treatments (0N). Mineral N data for all main treatments were analyzed. Main and interacting effects of slurry application method and use of Vizura were investigated with block as a random factor in the analyses. All data were analyzed with the linear mixed effect (lme) function of the nlme package using the restricted maximum likelihood (REML) method. Model assumptions, i.e., normality and homogeneity of variance were assessed using diagnostic plots of residuals. To satisfy model assumptions, the daily and cumulative N2O emissions and mineral N (from both main treatments and the separate samplings around placed slurry) were log-transformed. For time series of N2O emissions and mineral N data, autocorrelation between sampling positions were accounted with the corAR1 function. Pairwise comparisons between treatments were performed using the estimated marginal means (emmeans) function. The p-values were adjusted using Tukey’s HSD method, and the hypothesis rejection threshold was 0.05.

3. Results

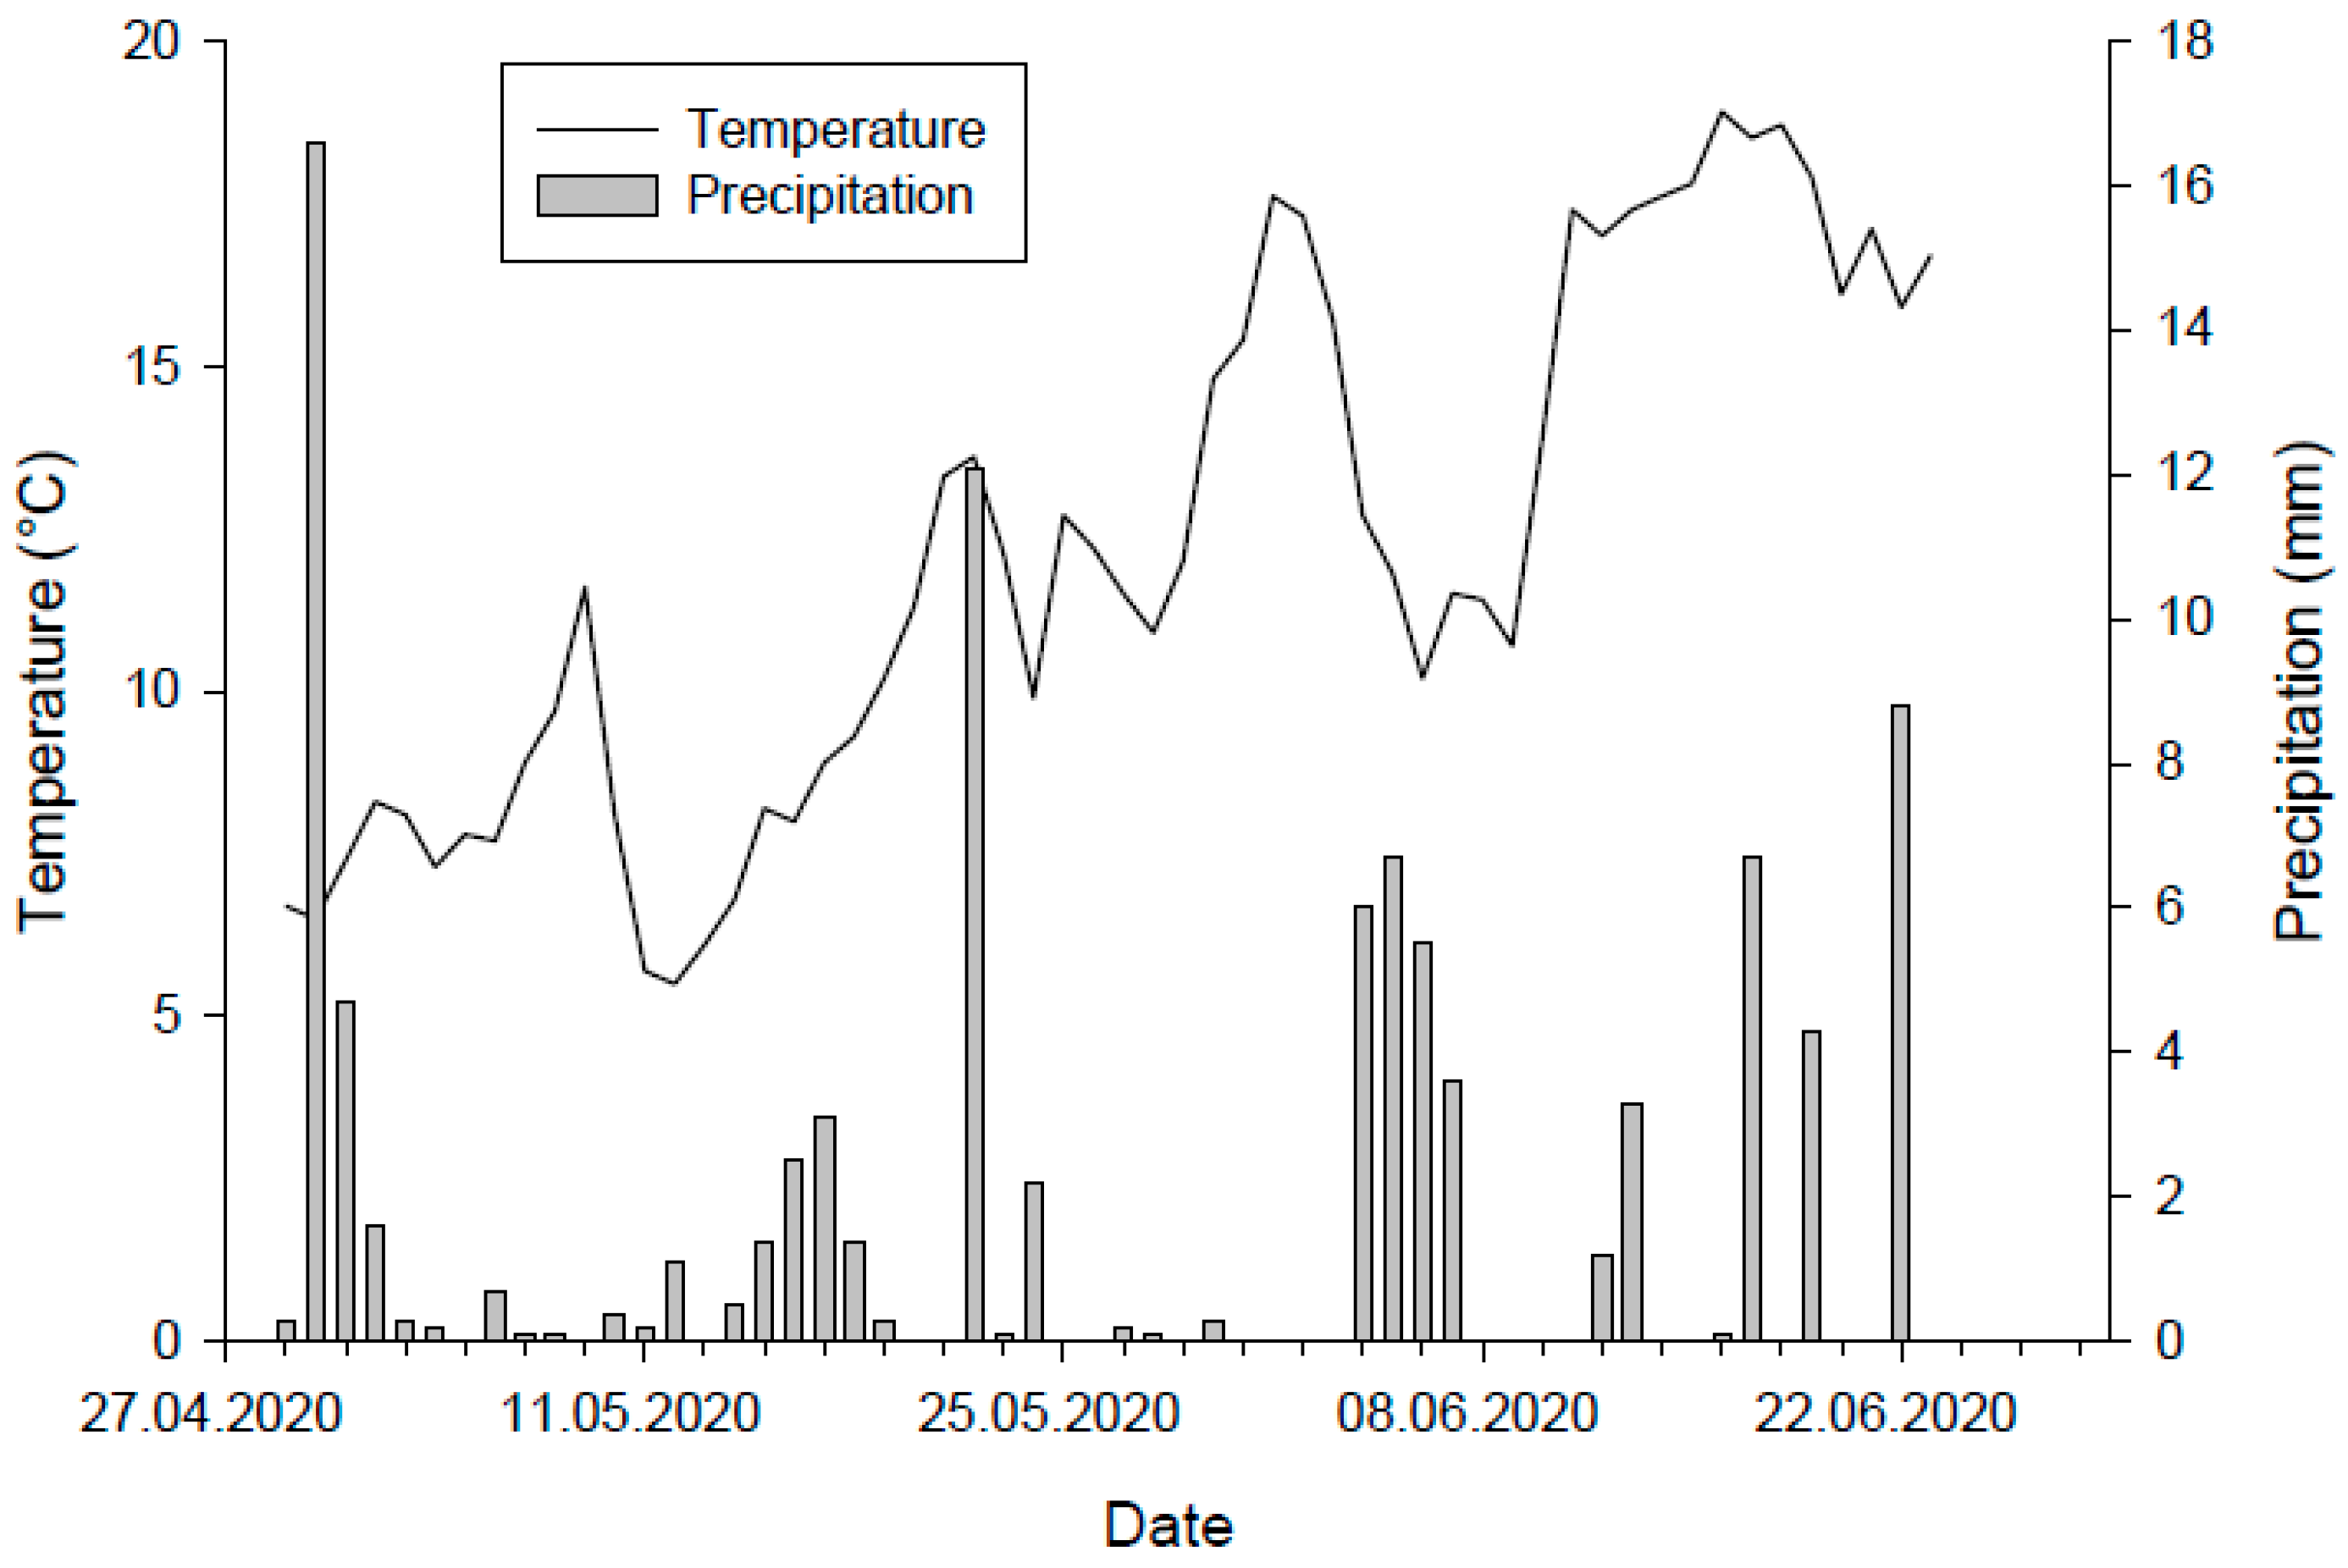
3.1. Environmental Conditions

Figure 1 shows daily average air temperature and precipitation during the monitoring period. The daily mean air temperature ranged from 5.5 to 18.9 °C. Daily rainfall ranged from 0 to a maximum of 17 mm, the latter occurring one day after placement of slurry, and the cumulative rainfall was 97 mm during the period of measurement.

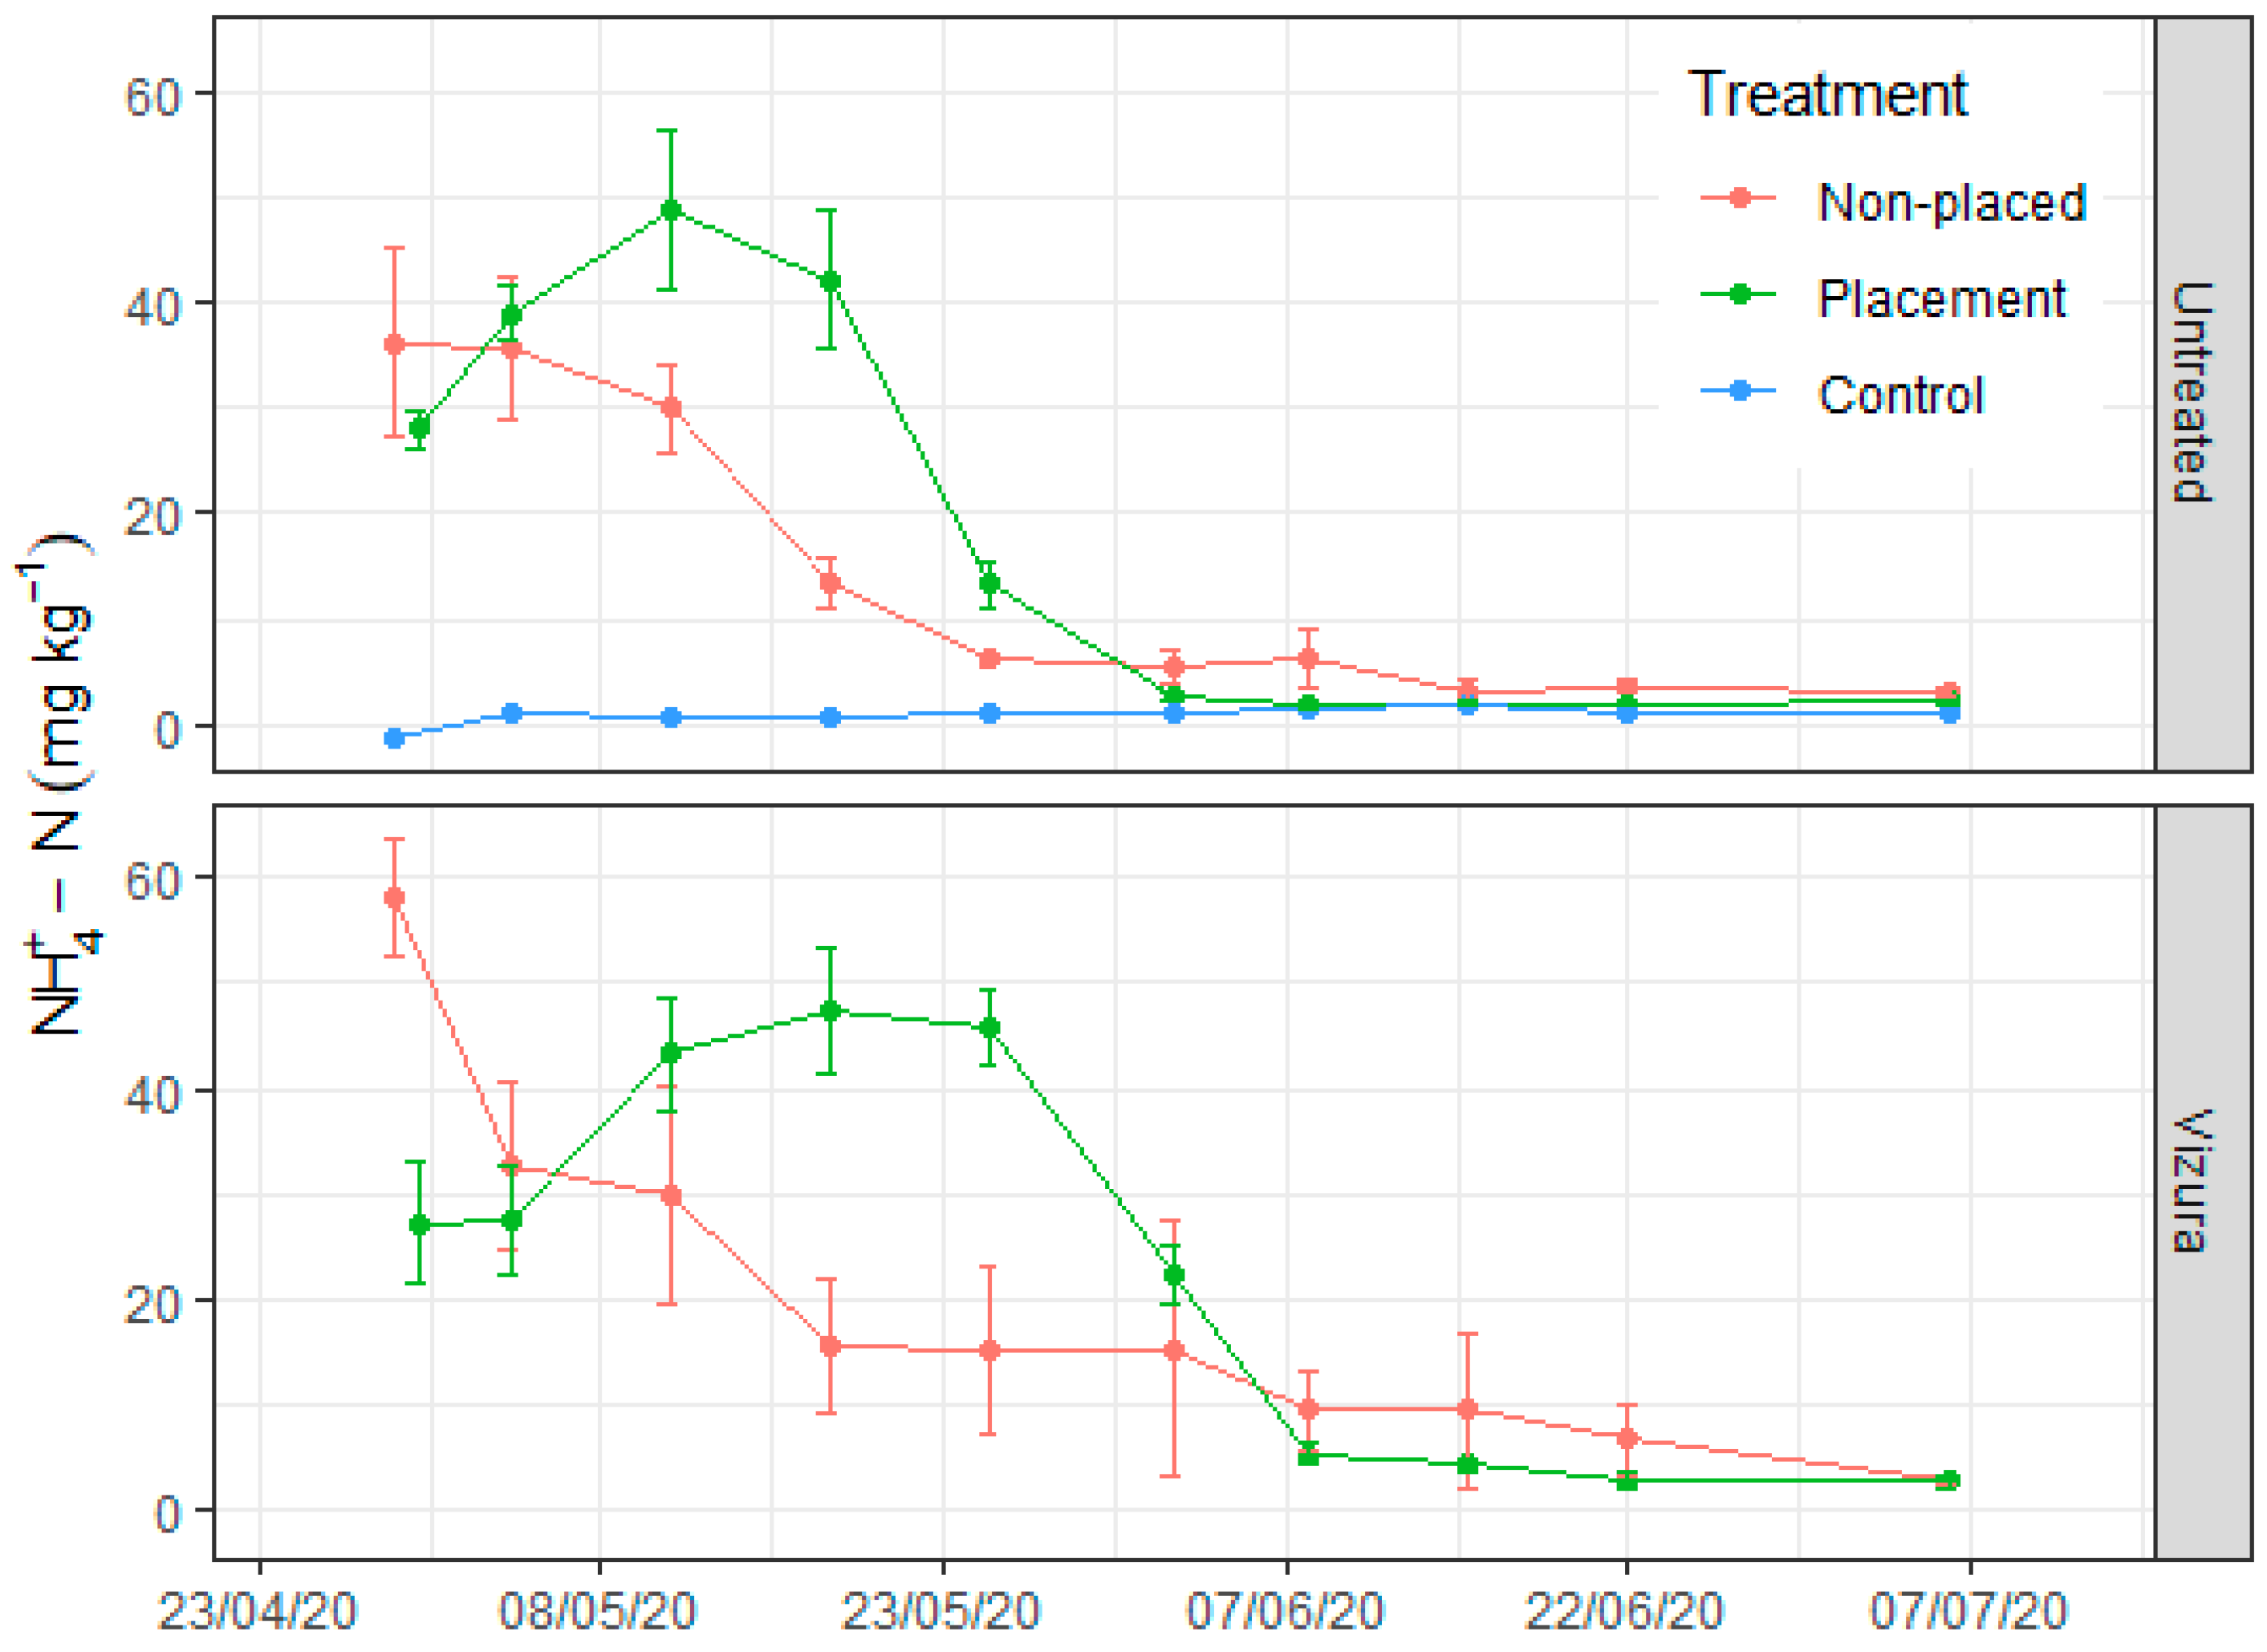
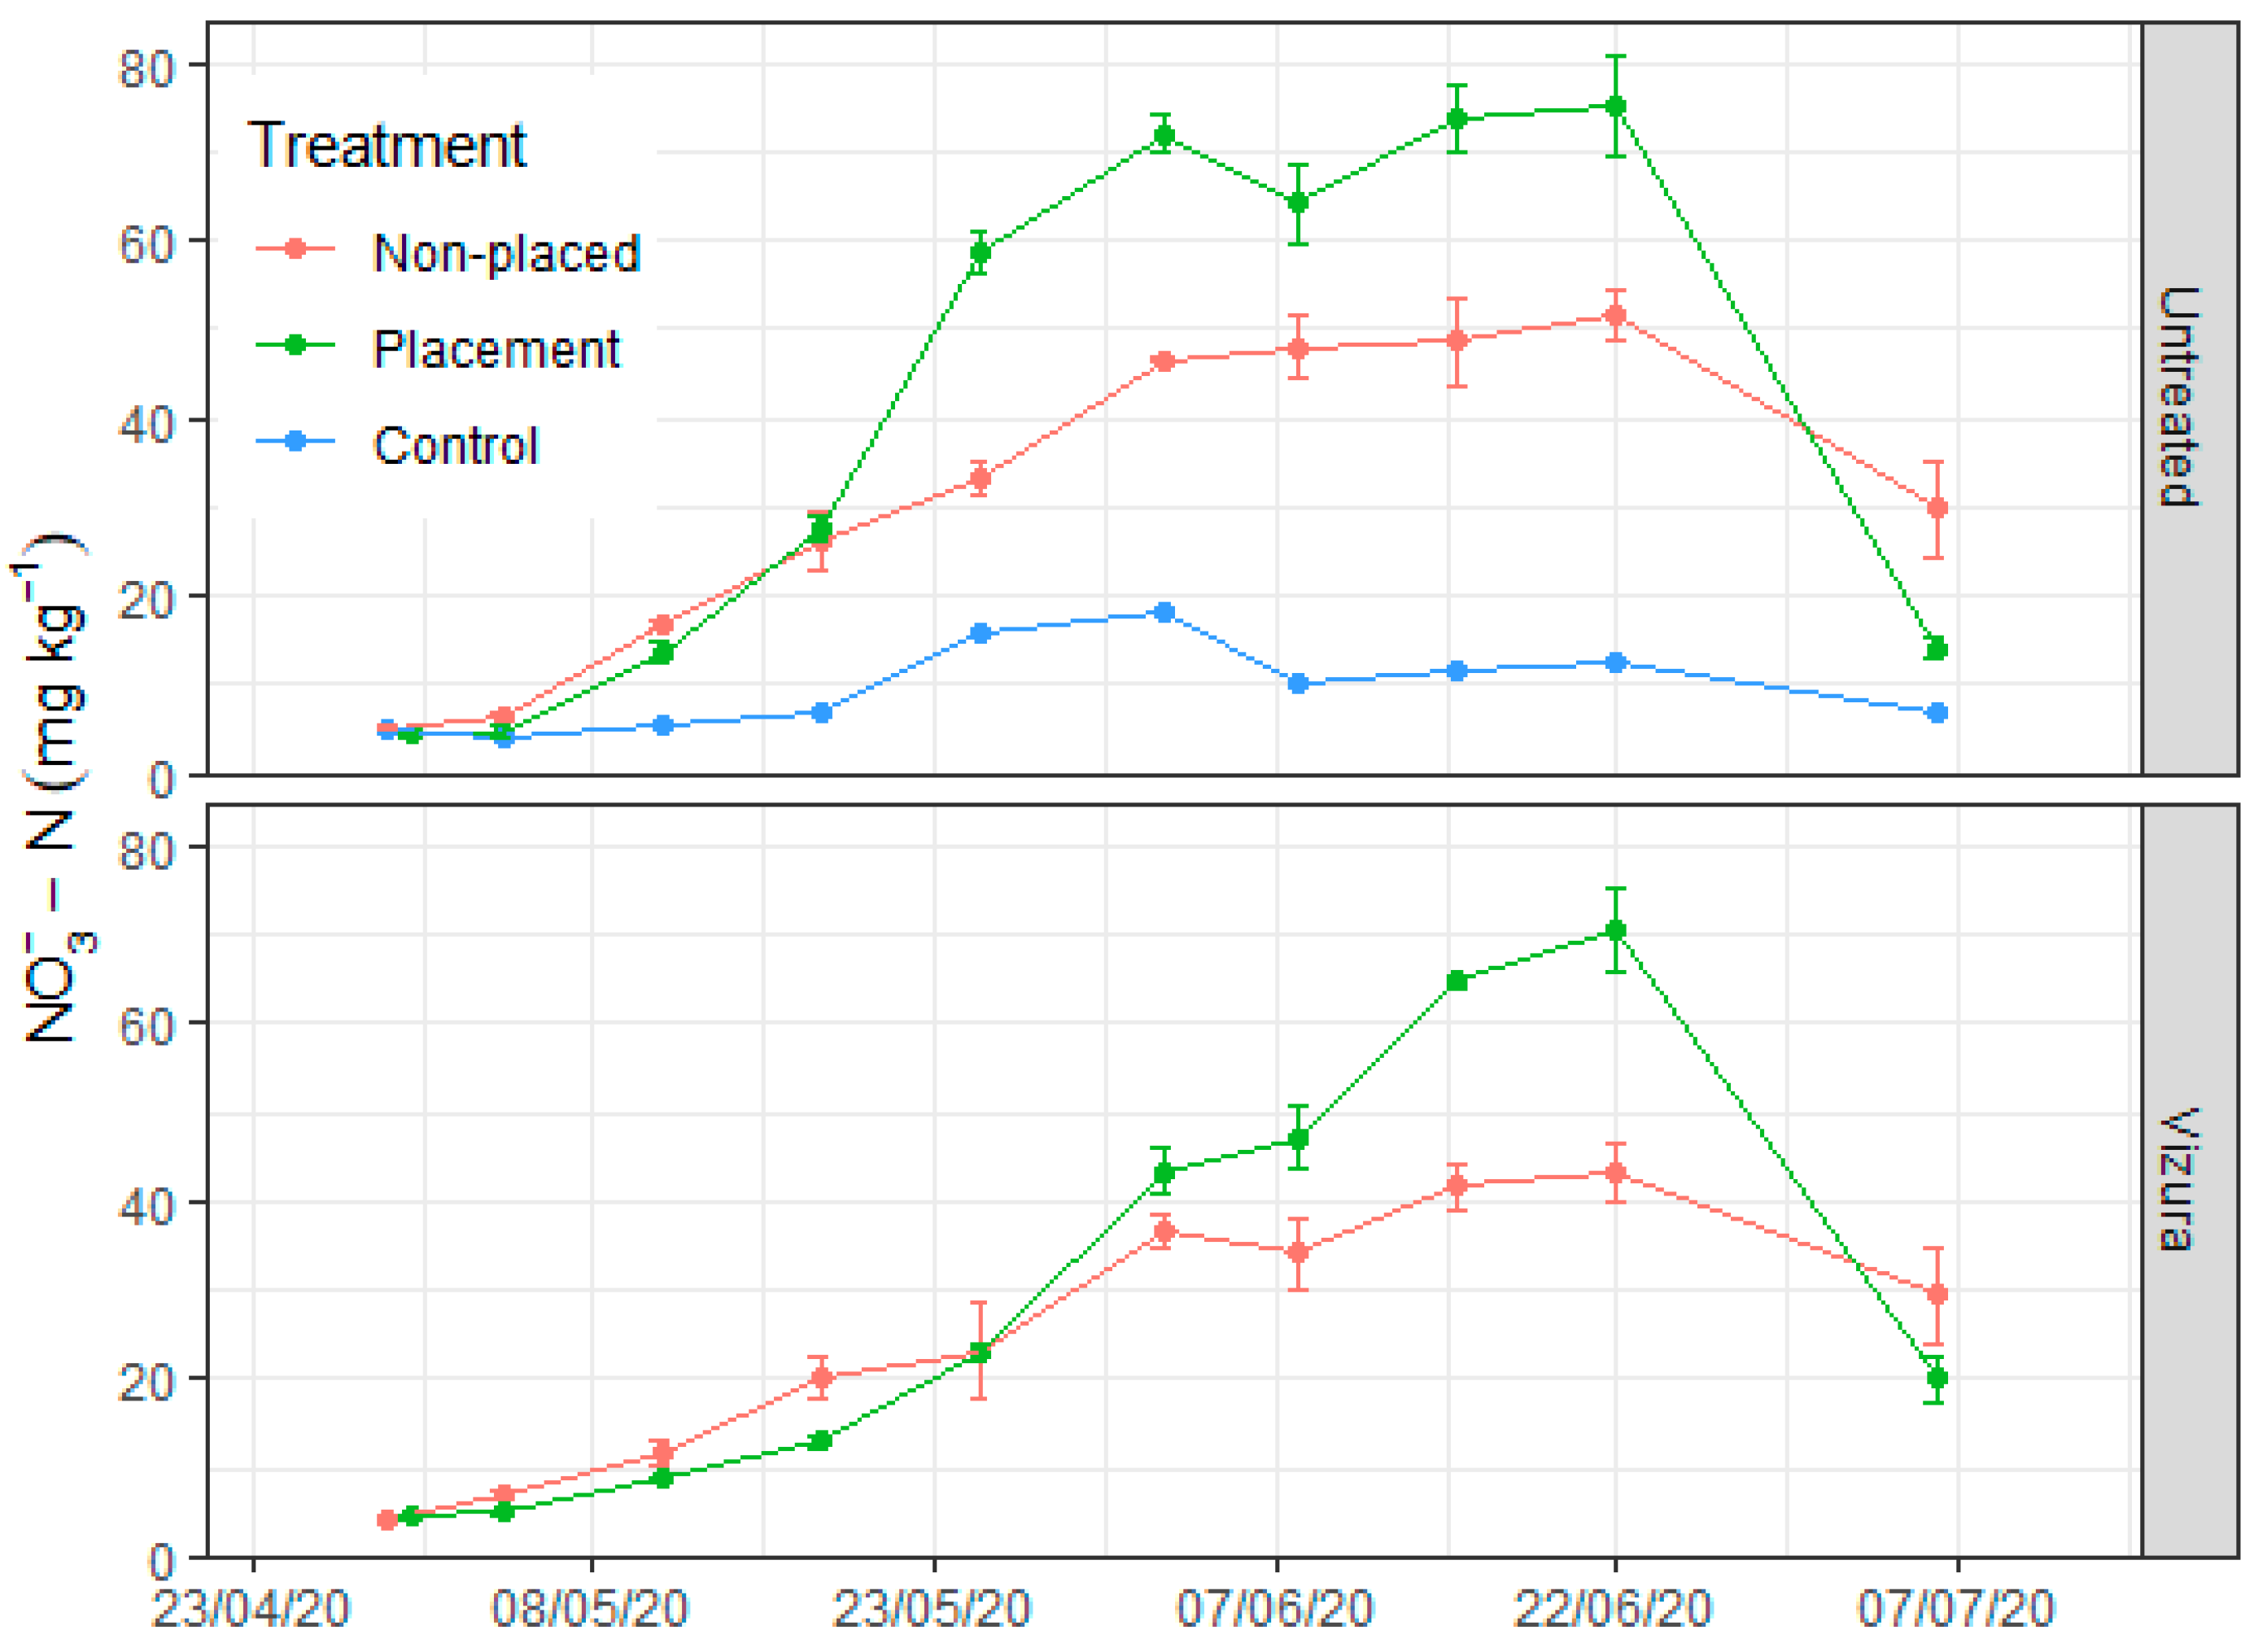
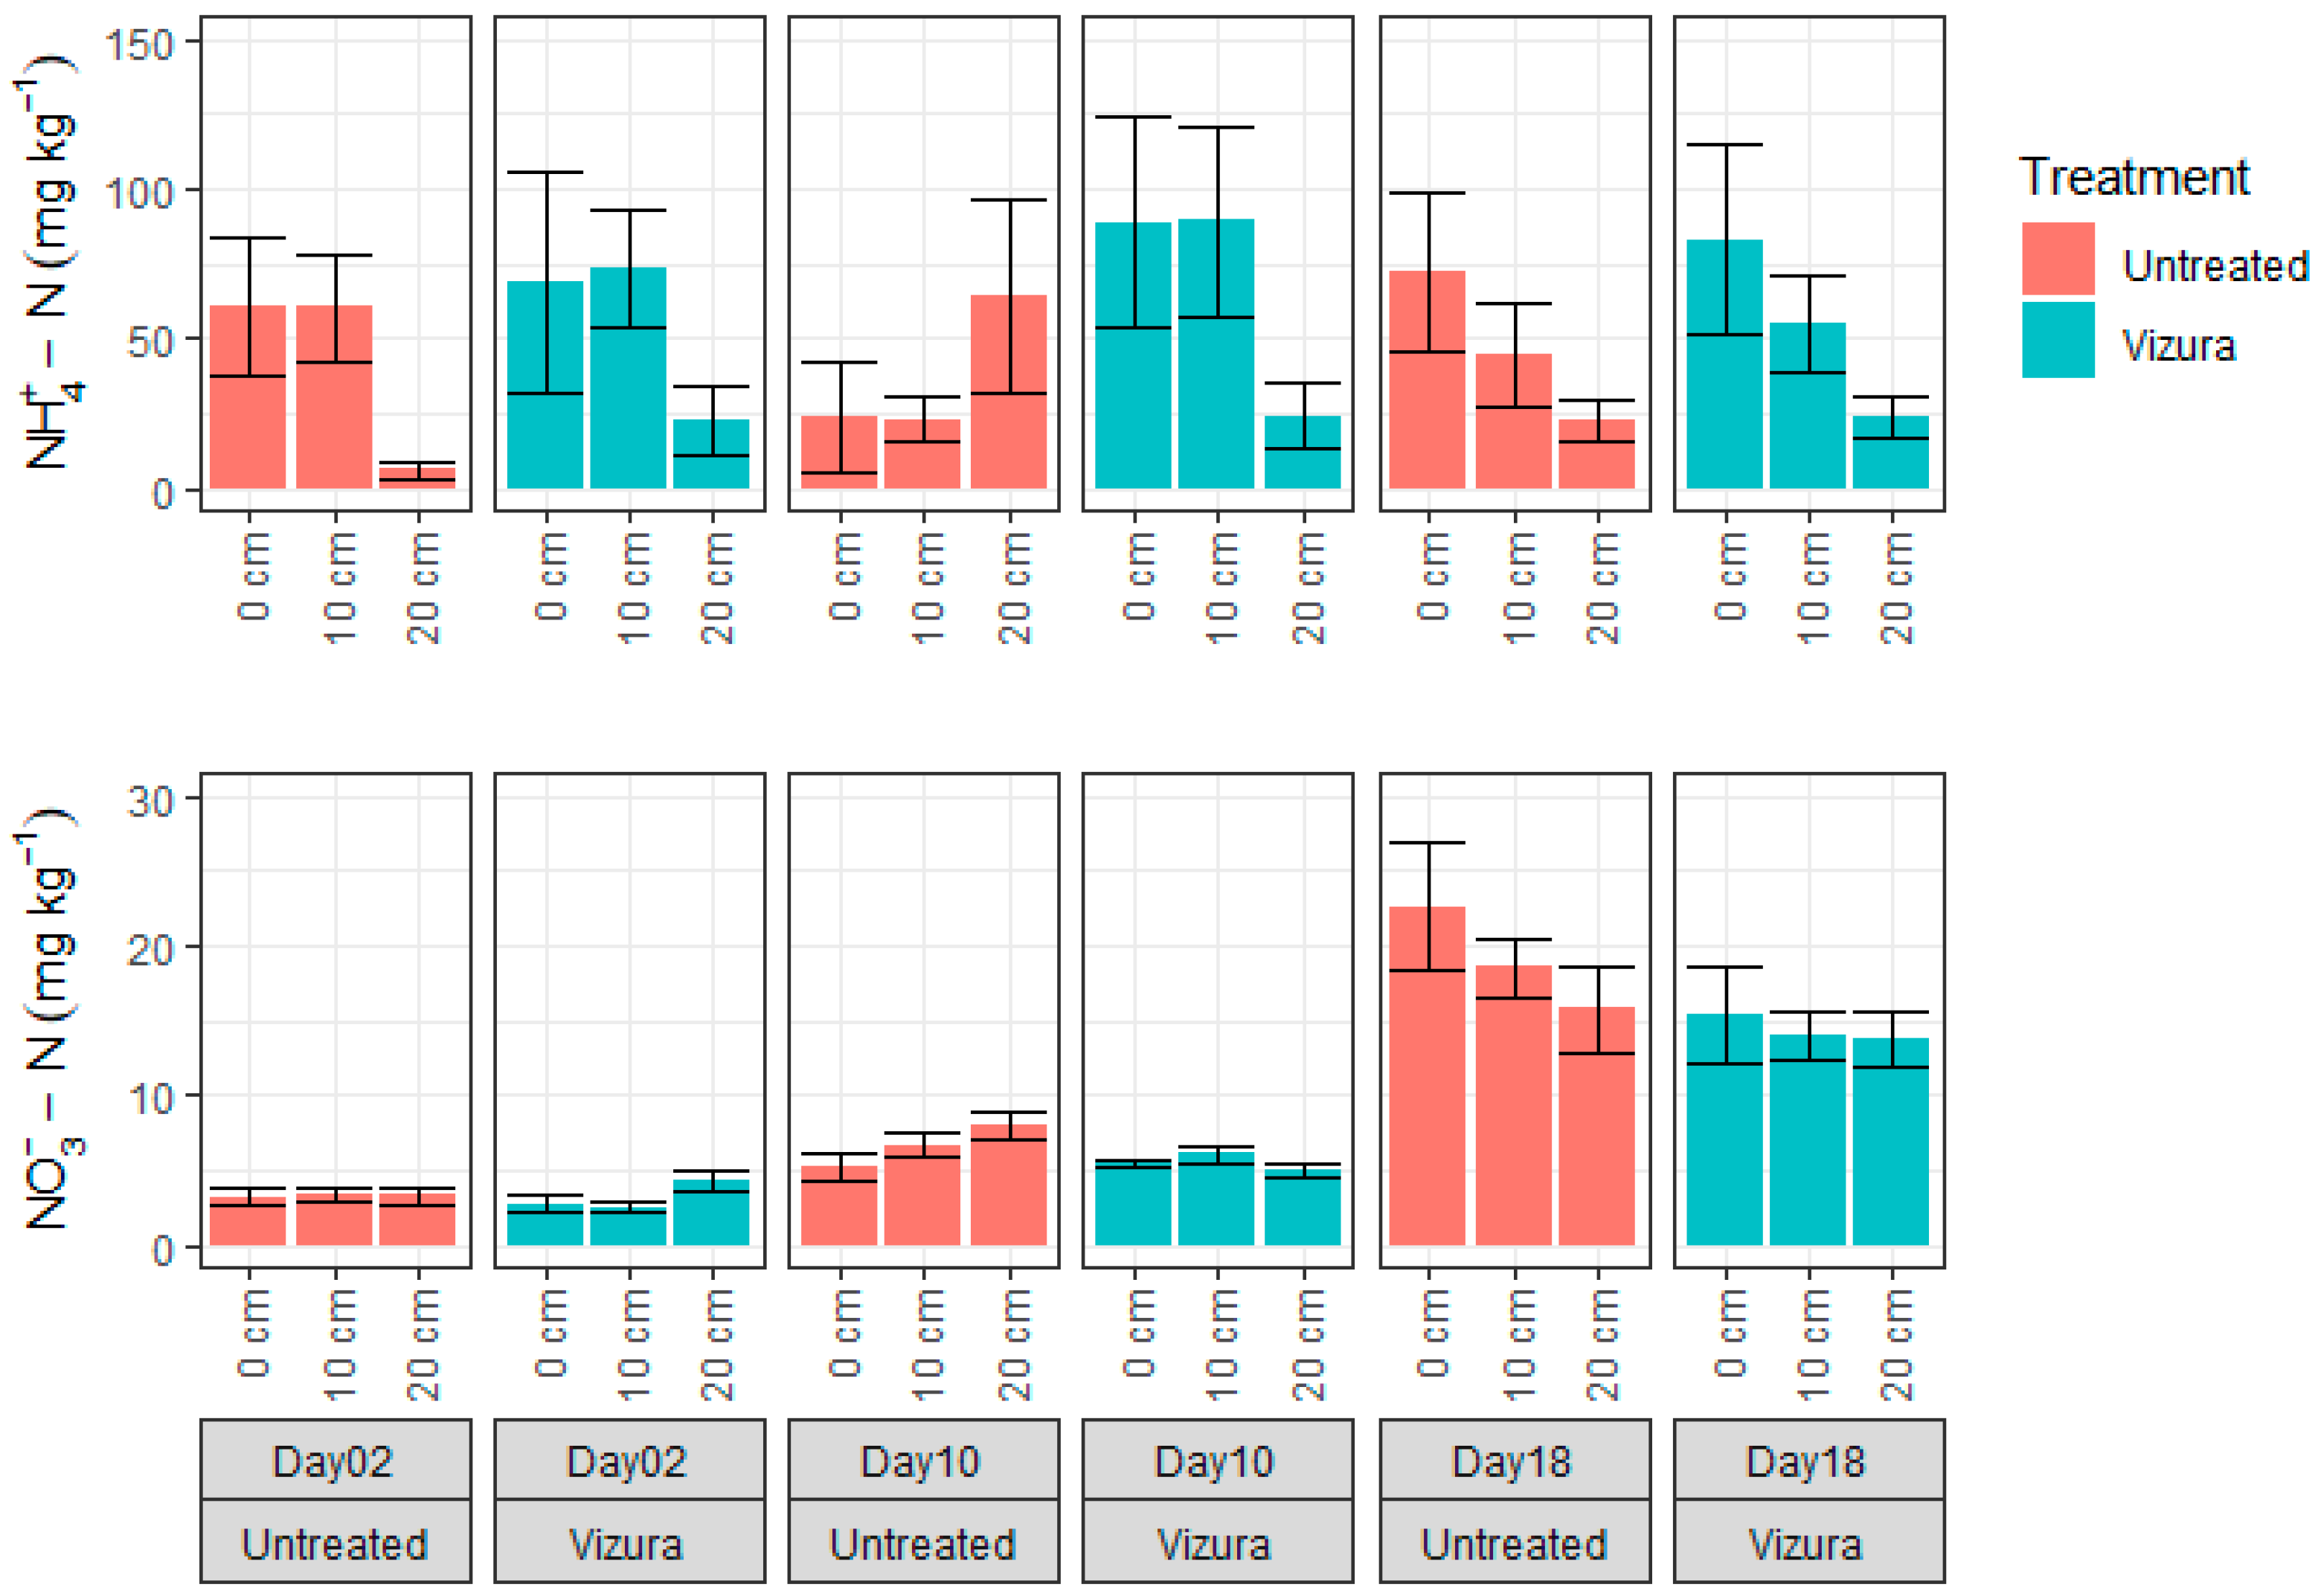
3.2. Soil Moisture and Mineral N Dynamics

Soil gravimetric water content on the sampling days varied between 18 and 21% during the experimental period; assuming a bulk density of 1.37 g cm−3, which was the bulk density recorded in a neighboring field under similar management (ploughed soil, crop residues removed). The calculated range in water content corresponded to 48–56% water-filled pore space (WFPS). The application of 110 kg NH4+-N corresponded to an average of 34 mg NH4+-N kg−1 dry wt. soil. This was close to the values observed on day 1 except for a higher value in the treatment with non-placed cattle slurry amended with Vizura (Figure 2, top). With application of non-placed slurry, soil NH4+-N concentrations showed a declining trend during May irrespective of the use of Vizura and then stabilized, but at a higher level in the treatment with Vizura. A different pattern was seen after placement of the slurry (Figure 2, bottom). Here, both treatments showed an increase to around 50 mg NH4+-N kg−1 in early (unamended slurry) or late May (Vizura-amended slurry). Then followed a period with rapid disappearance in both treatments, but with a 10–14 d delay in the presence of Vizura. The statistical analyses showed significant effects of date and treatment with Vizura on NH4+-N content, but no overall difference between application methods was observed (Table 2).
Following the application of slurry, irrespective of treatment and application method, the NO3-N concentration increased gradually during the monitoring period, but with different temporal dynamics. With untreated cattle slurry, the increase was faster during May with placed compared to non-placed slurry, and the final level reached during June was higher, 70–80 mg NO3-N kg−1, with placement of the slurry, compared to 50 mg NO3-N kg−1 with injection (Figure 3). When treated with Vizura, the development of NO3-N concentrations were more similar between injected and placed slurry until late May, when the NO3-N level plateaued at around 40 mg NO3-N kg−1 with injection but continued to increase to reach 70 mg NO3-N kg−1 with placement of the slurry. There was no overall difference between application methods, but a highly significant effect of treating the slurry with Vizura, and significantly different temporal dynamics with and without Vizura (Table 2).

3.3. Mineral N Distribution after Placement of Slurry
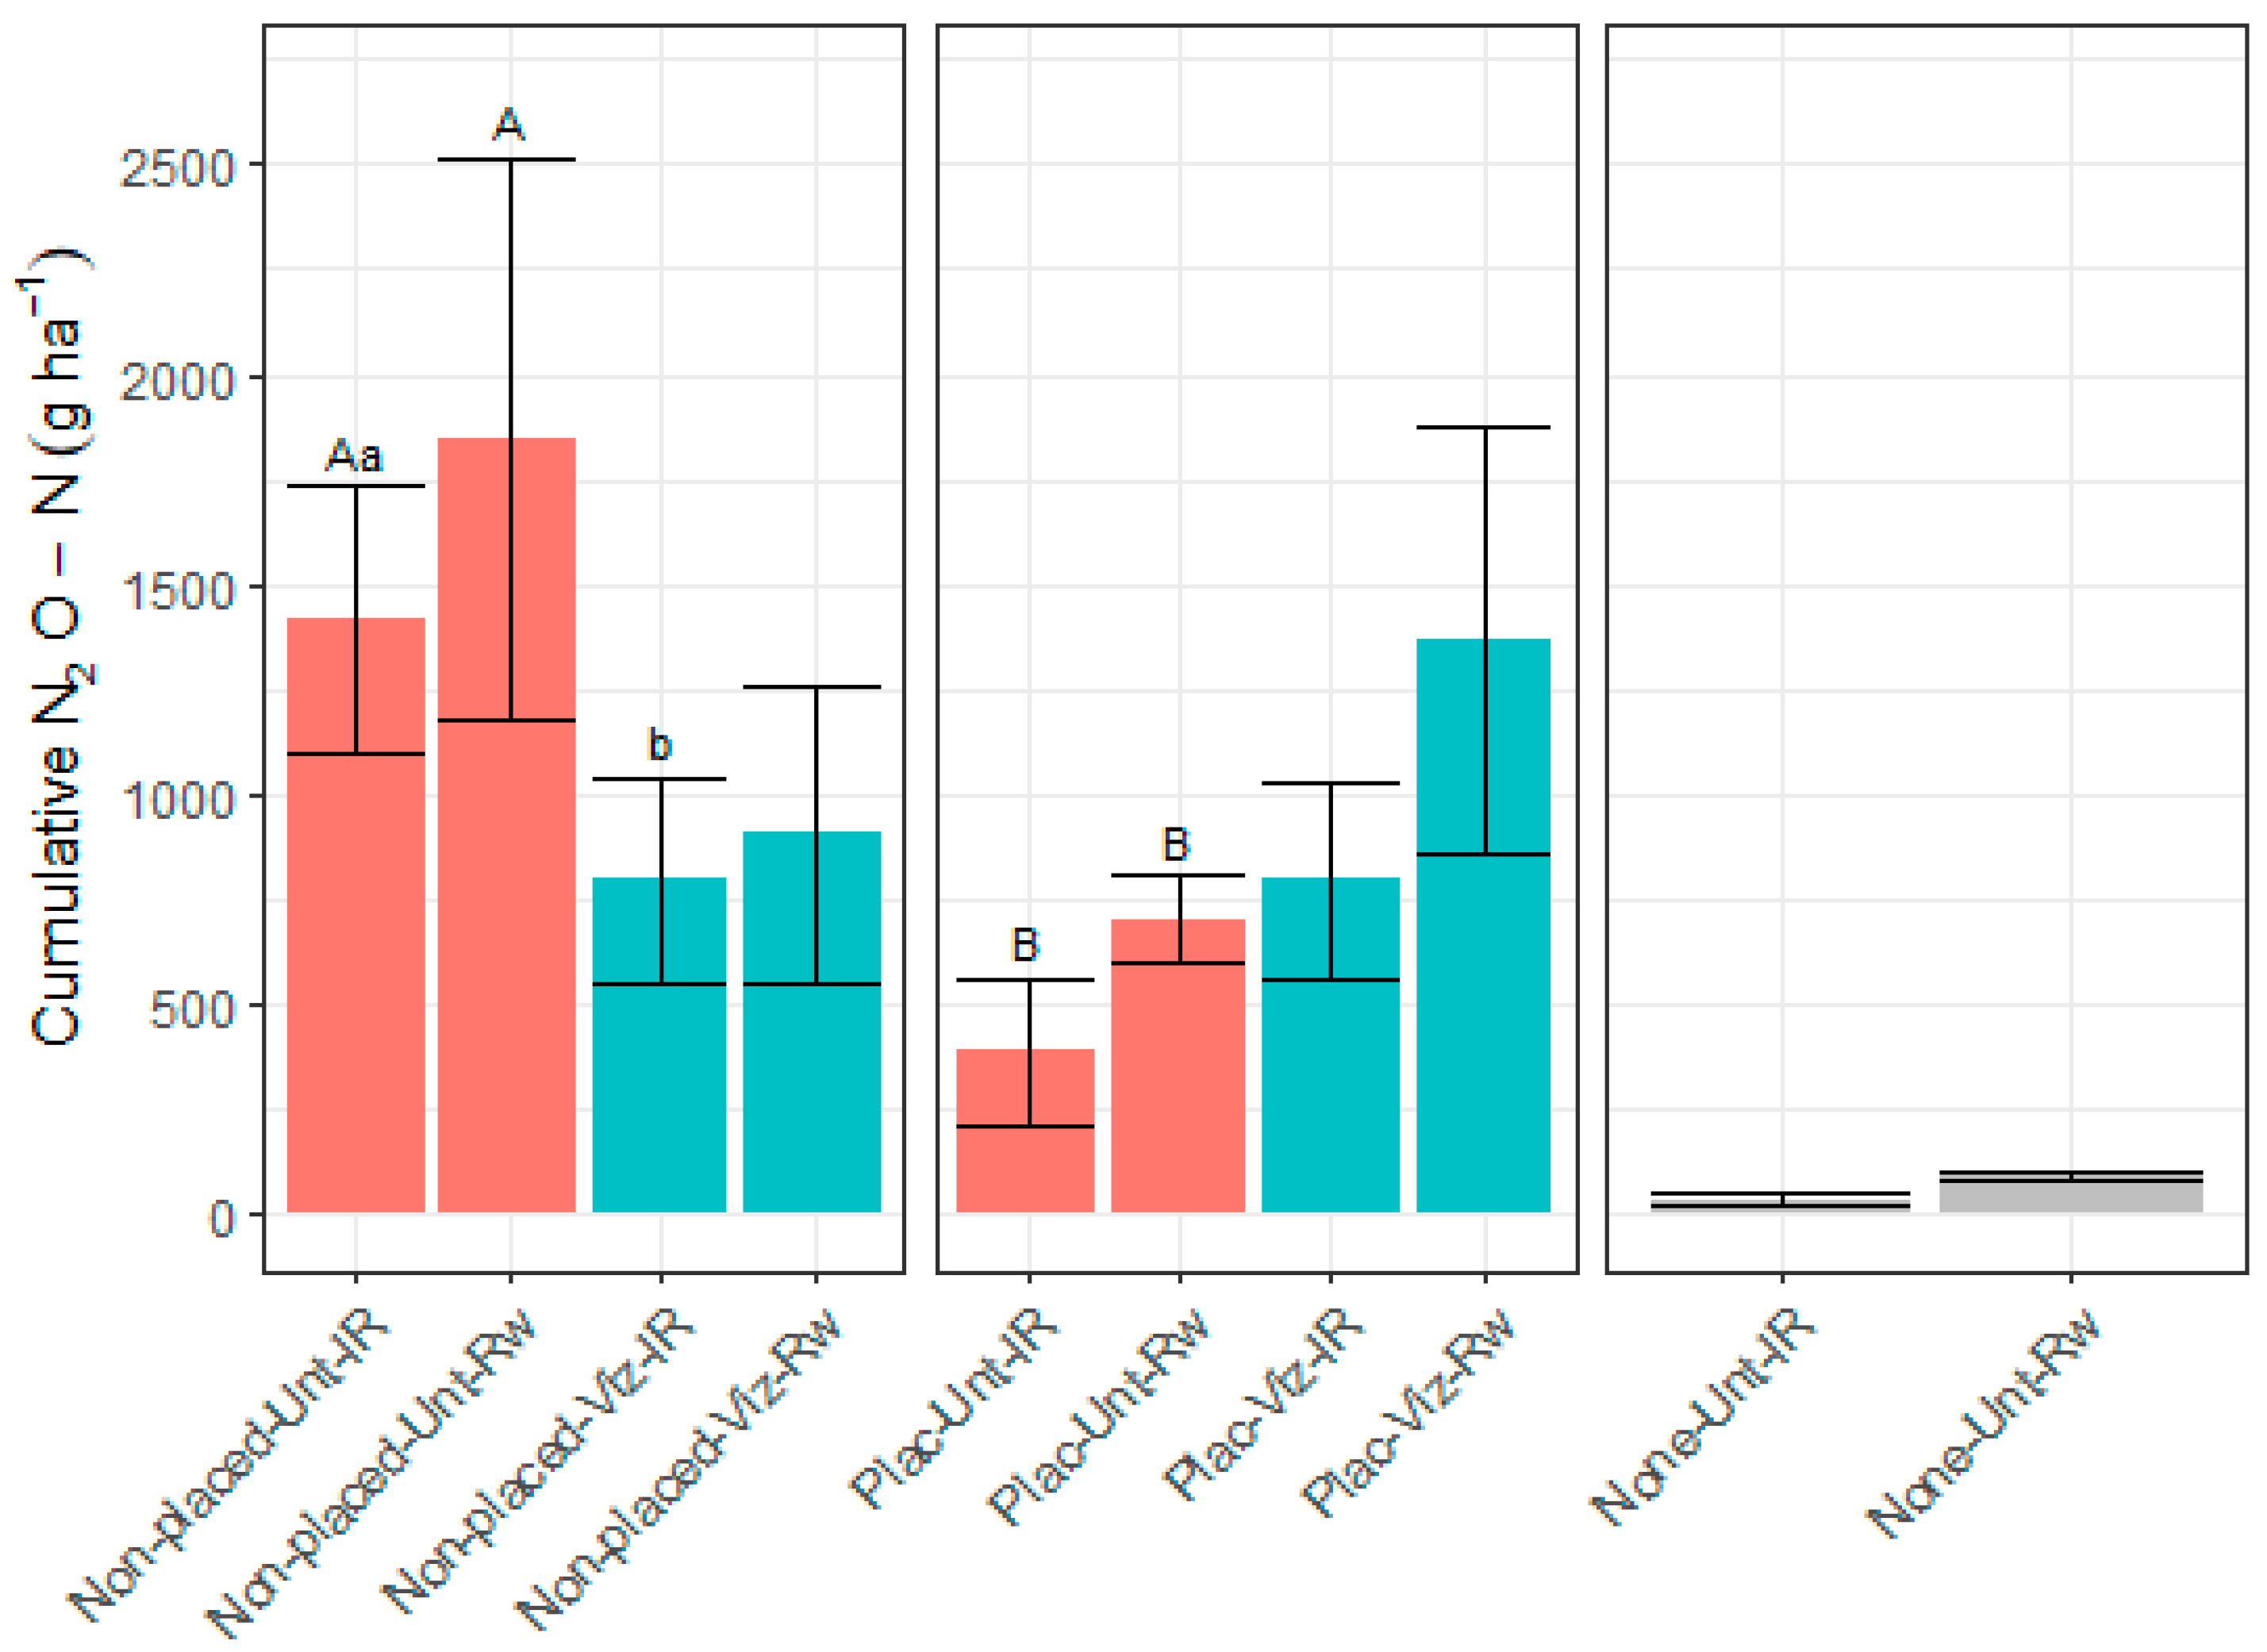
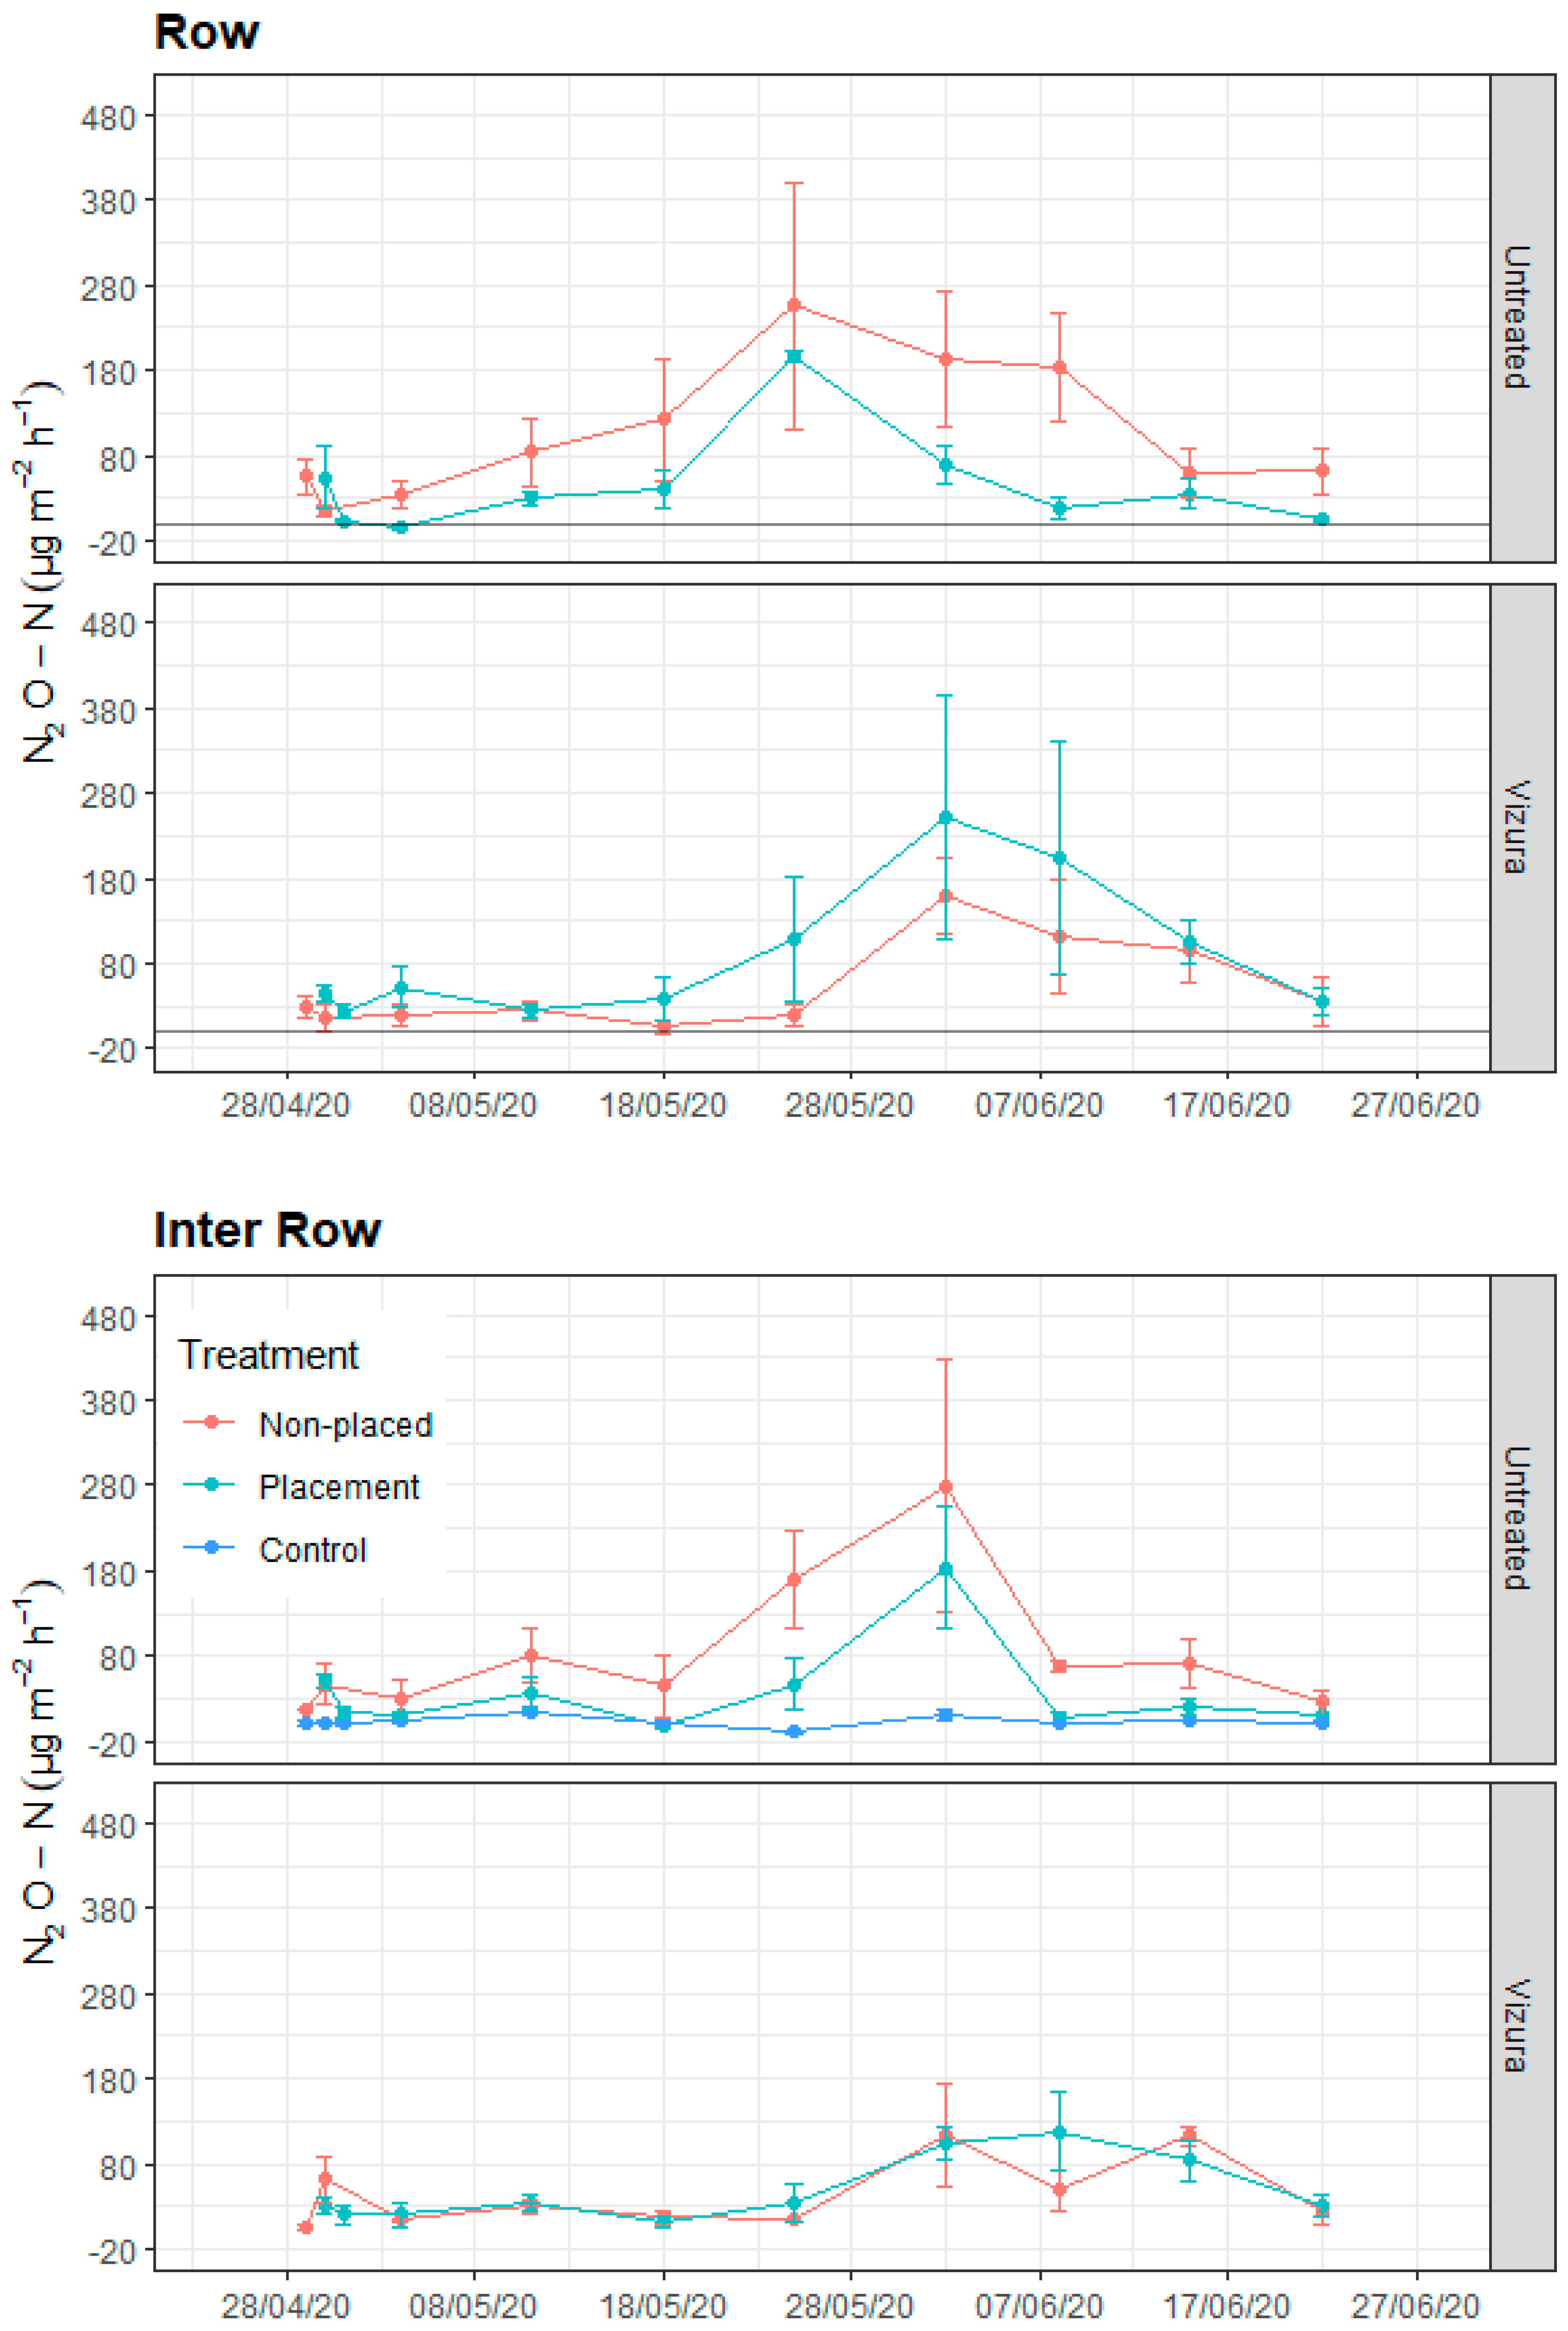
The distribution of NH4+-N and NO3-N in the soil profile with placed slurry was determined after 2, 10, and 18 days (Figure 4). The results for untreated and Vizura-treated slurry are summarized by depth interval in Figure 5, and by distance from the row in Figure 6. There was some variability in NH4+-N concentrations that probably reflected heterogeneity in how the soil structure broke and voids filled with slurry during placement. Ammonium was concentrated at 10–20 cm depth, as expected, and remained at the same level during the 18-day period. Some accumulation of NO3-N was seen at all depths, but a reduction in NO3-N accumulation with Vizura was only recorded in the 5–20 cm layers and not at 0–5 cm depth receiving little or no slurry with placement (Figure 5). The width of the injection tine used for placement of slurry was 26 cm, and in accordance with this, the NH4+-N concentrations at 20 cm distance from the row were low and changed little between day 2 and day 18 (Figure 6). By day 18, there was a trend of NO3-N accumulation where untreated cattle slurry had been placed, whereas in the treatment with Vizura, the accumulation was similar at all distances.

3.4. N2O Emissions

The temporal dynamics of N2O emissions are shown in Figure 7, with separate plots for within-row (Row) and interrow (IR) positions. The results of an analysis of variance are shown in Table 3. Trends were similar but with a tendency for higher emissions from within-row sampling positions. During May, there was a gradual increase in N2O emissions after injection both with and without placement of slurry without Vizura, but from end of May/early June this trend was reversed, and N2O emissions declined during June and were close to zero at the last sampling.
The N2O emissions after application of Vizura-treated slurry remained low during most of May, followed by a period of increasing emissions from both within-row and interrow positions. This increase was greater with placed compared to non-placed slurry (Figure 7). The N2O emissions from Vizura-treated slurry also declined and were close to zero at the last sampling. During June, N2O emissions were significantly higher from treatments with Vizura-amended slurry compared to untreated slurry, as indicated in the analysis of variance and pairwise comparisons (Table 3). For interrow positions, there was a significant interaction (p < 0.001) between slurry application method and treatment with Vizura (Table 3).
The cumulative N2O emissions during the monitoring period are shown in Figure 8, and the associated analysis of variance in Table 4. This analysis was based on average emissions from interrow and within-row positions. Nitrous oxide emissions differed significantly between application methods and was higher from non-placed compared to placed cattle slurry. However, there was a strong interaction (p < 0.001) with slurry treatment. For untreated slurry, the N2O emission was lower from placed slurry, but the opposite pattern was true for slurry treated with Vizura where placed slurry showed higher cumulative N2O emission during the monitoring period (Figure 8). All treatments except the control received 221 kg N ha−1 in cattle slurry plus mineral N fertilizers, and cumulative N2O emissions constituted 2.8 and 0.3% of slurry N in non-placed slurry without and with Vizura®, respectively. The N2O emissions constituted 0.3 and 0.4% of slurry N without and with the inhibitor in placed slurry.

4. Discussion

Application technique can influence the potential for gaseous losses from liquid manure in the form of ammonia (NH3) and N2O emissions, which are, respectively, lower, and higher with incorporation or injection compared to surface application [28]. The enhanced N2O emissions from incorporation as opposed to surface application of slurry are likely driven by the decomposition of labile organic C in compounds such as volatile fatty acids [29]. If the oxygen (O2) demand by the slurry exceeds the supply, denitrification is enhanced when NO3 is present [30,31]. Elevated concentrations of water-soluble C were measured in the slurry injection zone for at least 40 d after application under field conditions [32], and throughout a 20-day incubation experiment with simulated injection [33]. The labile C in this environment is probably protected by a higher water content in manure-saturated soil [23], which impedes diffusive transport of O2 and helps maintain anaerobic conditions. Hence, liquid manure incorporation leads to the development of organic hotspots with a potential for N2O emissions in the weeks following incorporation [34].
Injection (or acidification) of manure is mandatory when applied to bare soil according to local legislation in Denmark (Ministry of Food, Agriculture and Fisheries, 2022). In this study, slurry injection followed by ploughing (non-placement) resulted in higher cumulative N2O emissions than placement of slurry in a band under crop rows (Figure 8 and Table 4), mainly because of higher emissions from untreated slurry during May. With 25 cm spacing between injection tines and subsequent ploughing, the contact between slurry and soil was probably greater for non-placed slurry compared to the placed slurry applied at 75 cm spacing and with no further disturbance. A larger surface area would promote the exchange of O2, NH4+ and NO3 between manure and soil. This in turn would stimulate the decomposition of labile C and N transformations [35] and support the growth of microbial populations, including nitrifiers and denitrifiers, around manure–soil interfaces [36]. The faster onset of NO3-N accumulation with untreated non-placed slurry (Figure 3) could thus be due to a higher NH4+ availability for nitrifiers, and more coupled nitrification–denitrification during May enhancing N2O emissions compared to placed slurry (Figure 7). This interpretation is consistent with the lower initial N2O emission and effect of the nitrification inhibitor with non-placed slurry (Figure 7).
Variation in soil temperature or moisture can shift the balance between O2 supply and demand and result in N2O emission spikes or multiday peaks on top of the emission driven by the manure applied [37]. In accordance with this, an increase in N2O emissions was observed with untreated slurry after 20th May that followed a temperature increase of nearly 10° C and a 12 mm rain event during the previous week (Figure 1). Similarly, there was an increase in N2O emissions from placed slurry after this change in temperature and rainfall.
Nitrification inhibitors are chemical compounds that reduce primarily bacterial oxidation of ammonia (NH3) to nitrite (NO2) in fertilized soil. The addition of nitrification inhibitors has been frequently reported to reduce both N2O and NO emissions from agricultural soils, although their efficiency depends on soil conditions [16,38]. Nitrification inhibitors can reduce N2O emissions from slurry by desynchronizing C and NO3 availability for denitrifiers after field application. However, they may be less effective in wet soil with low nitrification activity and a higher potential for complete reduction in NO3 to N2 [15]. In the present study, treating cattle slurry with DMPP reduced N2O emissions for non-placed slurry, as hypothesized, and the reduction of 70% was in line with or higher than previous studies [39,40]. Ammonia oxidation was clearly delayed, but there were higher N2O emissions from placed slurry treated with DMPP in the last part of the monitoring period (Figure 7) with a non-significant tendency for higher cumulative emissions from this treatment (Figure 8). Therefore, the effect of DMPP on N2O emissions did not extend into June. The air temperature had increased prior to this period and reached 18 ° C in mid-June. The rate of nitrification increases with temperature to a maximum at 30 °C in most soils [41]. The inhibition of ammonia oxidation from DMPP is effective at 5 °C where the effect may last for several months [14], but this effectiveness declines with increasing temperature. A recent study with pasture soil reported a half-life at 15 °C of 12–17 days for DMPP [42], and the increasing rates of NO3 accumulation observed in June may thus have been due to DMPP degradation.
During June, the emission of N2O from placed slurry treated with DMPP was significantly higher than from untreated slurry (Figure 7). Denitrification has been found to be the main source of N2O emissions from soil amended with cattle slurry [43], but the distribution and average concentrations of NO3 were similar in placed slurry with and without Vizura®. We propose that the higher N2O emissions were due to nitrification activity taking place in close association with the slurry treated with Vizura®. By the time the inhibition from DMPP was relieved in June, some O2 reaching interior parts of the placed slurry probably allowed for nitrification to proceed under O2 limited conditions, which are known to enhance N2O emission via ammonia oxidation [44] or nitrifier denitrification [45]. It is also possible that nitrifier activity throughout the slurry layer enhanced denitrification activity in nearby anoxic microsites via coupled nitrification–denitrification. A higher NO3 availability tends to increase the N2O:N2 product ratio of denitrification [46], and furthermore, a stimulation of N2O reductase activity [47] could have ceased with degradation of DMPP; both mechanisms would tend to increase N2O emissions.
Nitrous oxide emissions approached the background level around the time of the last sampling, but a risk for environmental losses would continue to exist until N uptake was complete (Figure 3). A possible reason for the decline in N2O emissions is that by this time, the pool of reactive C-sustaining denitrification had become depleted, and the manure–soil mixture was therefore dominated by aerobic decomposition.
Placement in a broad band reduced cumulative N2O emissions compared to non-placed injection. However, the results showed an interaction with respect to the effect of Vizura® on cumulative N2O emissions, which resulted in a reduction in emissions when slurry was injected without placement and the opposite trend with placed slurry (Figure 8). The discussion above points to a loss of nitrification inhibitor efficiency over time, and to nitrifier activity under oxygen-limited conditions in the manure layer of placed slurry. Unfortunately, the last measurement of soil mineral N distribution (Figure 6) took place in mid-May, and the spatial resolution was also insufficient to evaluate this suggestion.
The placement of slurry was expected to improve nutrient availability for the crop. In a separate part of the field study which investigated N and P use efficiency, ref. [20] found that placement of cattle slurry increased the dry matter yield and N uptake of maize at harvest compared to injected slurry, but only in the presence of the nitrification inhibitor. It usually takes several weeks after seeding before the N uptake by maize significantly affects soil mineral N content, and in accordance with this, the NO3-N concentrations remained constant during the last two weeks of the monitoring period where NH4+ pools had become depleted (Figure 3). The final plateau was higher with placed compared to non-placed slurry irrespective of treatment with the nitrification inhibitor, indicating that environmental N losses had been reduced due to placement. However, soil NO3 in mid-June was very similar in slurry with and without DMPP and did not suggest a difference in N uptake by the crop at this time. Presumably, NO3 was lost through leaching or gaseous emissions after the monitoring ended, but before crop N uptake was complete, and the potential for loss was higher with non-placed compared to placed slurry, and with untreated compared to Vizura treated slurry.

5. Conclusions

Placement of slurry in a broad band under maize rows reduced N2O emissions from untreated slurry. A nitrification inhibitor, DMPP, reduced N2O emissions for several weeks with non-placed slurry application, most likely because NO3 availability limited denitrification. However, unexpectedly, no effect of DMPP was observed on cumulative N2O emission after placement of the slurry, where N2O production from slurry with the inhibitor increased after several weeks, presumably as a result of DMPP degradation while an oxygen-limited environment was still maintained. This suggests that additional measures may be needed to avoid NO3 accumulation while slurry decomposition is still intense, such as slurry pretreatment to reduce the oxygen demand. Understanding the interactions between slurry distribution, slurry properties, and nitrification inhibitor efficacy is crucial for recommendations to mitigate N2O emissions. Further research is needed to consider the interactions of slurry treatment and application methods to reduce N2O emissions in agroecosystems.

Author Contributions

A.T.-T.: Conceptualization, investigation, performing field measurements and laboratory analyses, data analysis, writing—original draft. K.R.B.: Formal analysis, writing—review and editing. S.O.P.: Conceptualization, supervision, writing—review and editing. P.S.: Project administration, conceptualization, review and editing, funding acquisition. All authors have read and agreed to the published version of the manuscript.

Funding

This research was funded by GUDP (34009-18-1345) for providing financial support for the study performed as part of the Gyllemajs project.

Institutional Review Board Statement

Not applicable.

Informed Consent Statement

Not applicable.

Data Availability Statement

The data can be made available upon request.

Acknowledgments

We would like to thank Maja Hørning Skjødt for gas sampling, Bodil Stensgaard and Karin Dyrberg for gas analysis, and Marianne Ahrenfeldt M Stevenson for mineral nitrogen analysis. The authors thank technical support at Department of Agroecology, Aarhus University, Henrik Nørgaard and Jens Bonderup Kjeldsen for field operations and sampling, and Peter Storegård, Department of Biological and Chemical Engineering, Aarhus University for constructing the injection machine for slurry placement.

Conflicts of Interest

The authors declare no conflict of interest or state.

References

  1. Spiertz, J.H.J. Nitrogen, sustainable agriculture, and food security. A review. Agron. Sustain. Dev. 2010, 30, 43–55. [Google Scholar] [CrossRef]
  2. Leip, A.; Weiss, F.; Wassenaar, T.; Perez, I.; Fellmann, T.; Loudjani, P.; Tubiello, F.; Grandgirard, D.; Monni, S.; Biala, K. Evaluation of the Livestock Sector’s Contribution to the EU Greenhouse Gas Emissions (GGELS)—Final Report; European Commission, Joint Research Centre: Ispra, Italy, 2010. [Google Scholar]
  3. Webb, J.; Pain, B.; Bittman, S.; Morgan, J. The impacts of manure application methods on emissions of ammonia, nitrous oxide and on crop response—A review. Agric. Ecosyst. Environ. 2010, 137, 39–46. [Google Scholar] [CrossRef]
  4. Hafner, S.D.; Pacholski, A.; Bittman, S.; Burchill, W.; Bussink, W.; Chantigny, M.; Carozzi, M.; Génermont, S.; Häni, C.; Hansen, M.N.; et al. The ALFAM2 database on ammonia emission from field-applied manure: Description and illustrative analysis. Agric. For. Meteorol. 2018, 258, 66–79. [Google Scholar] [CrossRef]
  5. Lemaire, G.; Charrier, X.; Hébert, Y. Nitrogen uptake capacities of maize and sorghum crops in different nitrogen and water supply conditions. Agronomie 1996, 16, 231–246. [Google Scholar] [CrossRef]
  6. Ravishankara, A.R.; Daniel, J.S.; Portman, R.W. Nitrous oxide (N2O): The dominant ozone-depleting substance emitted in the 21st century. Science 2009, 326, 123–125. [Google Scholar] [CrossRef] [PubMed]
  7. Myhre, G.; Shindell, D.; Bréon, F.-M.; Collins, W.; Fuglestvedt, J.; Huang, J.; Koch, D.; Lamarque, J.-F.; Lee, D.; Mendoza, B.; et al. Anthropogenic and natural radiative forcing. In Climate Change 2013: The Physical Science Basis. Contribution of Working Group I to the Fifth Assessment Report of the Intergovernmental Panel on Climate Change; Stocker, T.F., Qin, D., Plattner, G.-K., Tignor, M., Allen, S.K., Boschung, J., Nauels, A., Xia, Y., Bex, V., Midgley, P.M., Eds.; Cambridge University Press: Cambridge, UK; New York, NY, USA, 2013. [Google Scholar]
  8. Zhu, X.; Burger, M.; Doane, T.A.; Horwath, W.R. Ammonia oxidation pathways and nitrifier denitrification are significant sources of N2O and NO under low oxygen availability. Proc. Natl. Acad. Sci. USA 2013, 110, 6328–6333. [Google Scholar] [CrossRef]
  9. Ibraim, E.; Denk, T.; Wolf, B.; Barthel, M.; Gasche, R.; Wanek, W.; Zhang, S.; Kiese, R.; Butterbach-Bahl, K.; Eggleston, S.; et al. Denitrification is the main nitrous oxide source process in grassland soils according to quasi-continuous isotopocule analysis and biogeochemical modeling. Glob. Biogeochem. Cycles 2020, 33, e2019GB006505. [Google Scholar] [CrossRef]
  10. Rice, C.W.; Tiedje, J.M.; Sierzega, P.E.; Jacobs, L.W. Stimulated denitrification in the microenvironment of a biodegradable organic waste injected into soil. Soil Sci. Soc. Am. J. 1988, 52, 102–108. [Google Scholar] [CrossRef]
  11. Nielsen, T.H.; Nielsen, L.P.; Revsbech, N.P. Nitrification and coupled nitrification-denitrification associated with a soil-manure interface. Soil Sci. Soc. Am. J. 1996, 60, 1829–1840. [Google Scholar] [CrossRef]
  12. Akiyama, H.; Yan, X.; Yagi, K. Evaluation of effectiveness of enhanced-efficiency fertilizers as mitigation options for N2O and NO emissions from agricultural soils: Meta-analysis. Glob. Chang. Biol. 2010, 16, 1837–1846. [Google Scholar] [CrossRef]
  13. VanderZaag, A.C.; Jayasundara, S.; Wagner-Riddle, C. Strategies to mitigate nitrous oxide emissions from land applied manure. Anim. Feed. Sci. Technol. 2011, 166–167, 464–479. [Google Scholar] [CrossRef]
  14. Zerulla, W.; Barth, T.; Dressel, J.; Erhardt, K.; Horchler von Locquenghien, K.; Pasda, G.; Rädle, M.; Wissemeier, A. 3,4-Dimethylpyrazole phosphate (DMPP)—A new nitrification inhibitor for agriculture and horticulture. Biol. Fertil. Soils 2001, 34, 79–84. [Google Scholar] [CrossRef]
  15. Peixoto, L.; Petersen, S.O. Efficacy of three nitrification inhibitors to reduce nitrous oxide emissions from pig slurry and mineral fertilizers applied to spring barley and winter wheat in Denmark. Geoderma Reg. 2023, 32, e00597. [Google Scholar] [CrossRef]
  16. Ruser, R.; Schulz, R. The effect of nitrification inhibitors on the nitrous oxide (N2O) release from agricultural soils—A review. J. Plant Nutr. Soil Sci. 2015, 178, 171–188. [Google Scholar] [CrossRef]
  17. Beeckman, F.; Motte, H.; Beeckman, T. Nitrification in agricultural soils: Impact, actors and mitigation. Curr. Opin. Biotechnol. 2018, 50, 166–173. [Google Scholar] [CrossRef]
  18. Zhou, X.; Wang, S.; Ma, S.; Zheng, X.; Wang, Z.; Lu, C. Effects of commonly used nitrification inhibitors dicyandiamide (DCD), 3,4-dimethylpyrazole phosphate (DMPP), and nitrapyrin—On soil nitrogen dynamics and nitrifiers in three typical paddy soils. Geoderma 2020, 380, 114637. [Google Scholar] [CrossRef]
  19. Danmarks-Statistik. Landbrugsstatistik. Available online: https://www.dst.dk/ (accessed on 1 December 2022).
  20. Pedersen, I.F.; Nyord, T.; Sørensen, P. Tine tip width and placement depth by row-injection of cattle slurry influence initial leaf N and P concentrations and final yield of silage maize. Eur. J. Agron. 2022, 133, 126418. [Google Scholar] [CrossRef]
  21. Zhang, H.Q.; Zhao, X.Q.; Chen, Y.L.; Zhang, L.Y.; Shen, R.F. Case of a stronger capability of maize seedlings to use ammonium being responsible for the higher 15N recovery efficiency of ammonium compared with nitrate. Plant Soil 2019, 440, 293–309. [Google Scholar] [CrossRef]
  22. Miller, M.H.; Robinson, J.B.; Gillham, R.W. Self-Sealing of earthen liquid manure storage ponds: I. A Case study1. J. Environ. Qual. 1985, 14, 533–538. [Google Scholar] [CrossRef]
  23. Petersen, S.O.; Nissen, H.H.; Lund, I.; Ambus, P. Redistribution of slurry in soil as influenced by organic matter content and injection method. J. Environ. Qual. 2003, 32, 2399–2409. [Google Scholar] [CrossRef]
  24. Barrington, S.F.; Madramootoo, C.A. Investigating seal formation from manure infiltration into soils. Trans. ASAE 1989, 32, 851–856. [Google Scholar] [CrossRef]
  25. Krogh, L.; Greve, M.H. Evaluation of world reference base for soil resources and FAO soil map of the world using nationwide grid soil data from Denmark. Soil Use Manag. 1999, 15, 157–166. [Google Scholar] [CrossRef]
  26. Petersen, S.O.; Hoffmann, C.C.; Schäfer, C.-M.; Blicher-Mathiesen, G.; Elsgaard, L.; Kristensen, K.; Larsen, S.E.; Torp, S.B.; Greve, M.H. Annual emissions of CH4 and N2O, and ecosystem respiration, from eight organic soils in Western Denmark managed by agriculture. Biogeosciences 2012, 9, 403–422. [Google Scholar] [CrossRef]
  27. Pedersen, A.R.; Petersen, S.O.; Schelde, K. A comprehensive approach to soil atmosphere trace-gas flux estimation with static chambers. Eur. J. Soil Sci. 2010, 61, 888–902. [Google Scholar] [CrossRef]
  28. Hou, Y.; Velthof, G.L.; Oenema, O. Mitigation of ammonia, nitrous oxide and methane emissions from manure management chains: A meta-analysis and integrated assessment. Glob. Chang. Biol. 2015, 21, 1293–1312. [Google Scholar] [CrossRef]
  29. Guenzi, W.D.; Beard, W.E. Volatile fatty acids in a redox controlled cattle manure slurry. J. Environ. Qual. 1981, 10, 479–482. [Google Scholar] [CrossRef]
  30. van Groenigen, J.W.; Kasper, G.J.; Velthof, G.L.; Van den Pol van Dasselaar, A.; Kuikman, P.J. Nitrous oxide emissions from silage maize fields under different mineral nitrogen fertilizer and slurry applications. Plant Soil 2004, 263, 101–111. [Google Scholar] [CrossRef]
  31. Rochette, P.; van Bochove, E.; Prévost, D.; Angers, D.; Côté, D.; Bertrand, N. Soil carbon and nitrogen dynamics following application of pig slurry for the 19th consecutive year. II. Nitrous oxide fluxes and mineral nitrogen. Soil Sci. Soc. Am. J. 2000, 64, 1396–1403. [Google Scholar] [CrossRef]
  32. Comfort, S.D.; Kelling, K.A.; Keeney, D.R.; Converse, J.C. The fate of nitrogen from injected liquid manure in a silt loam soil. J. Environ. Qual. 1988, 17, 317–322. [Google Scholar] [CrossRef]
  33. Petersen, S.O.; Henriksen, K.; Blackburn, T.H. Coupled nitrification-denitrification associated with liquid manure in a gel-stabilized model system. Biol. Fertil. Soils 1991, 12, 19–27. [Google Scholar] [CrossRef]
  34. Velthof, G.L.; Mosquera, J. The impact of slurry application technique on nitrous oxide emission from agricultural soils. Agric. Ecosyst. Environ. 2011, 140, 298–308. [Google Scholar] [CrossRef]
  35. Sørensen, P.; Jensen, E.S. Mineralization-immobilization and plant uptake of nitrogen as influenced by the spatial distribution of cattle slurry in soils of different texture. Plant Soil 1995, 173, 283–291. [Google Scholar] [CrossRef]
  36. Nielsen, T.H.; Revsbech, N.P. Diffusion Chamber for Nitrogen-15 Determination of Coupled Nitrification-Denitrification around Soil-Manure Interfaces. Soil Sci. Soc. Am. J. 1994, 58, 795–800. [Google Scholar] [CrossRef]
  37. Molodovskaya, M.; Singurindy, O.; Richards, B.K.; Warland, J.; Johnson, M.S.; Steenhuis, T.S. Temporal variability of nitrous oxide from fertilized croplands: Hot moment analysis. Soil Sci. Soc. Am. J. 2012, 76, 1728–1740. [Google Scholar] [CrossRef]
  38. Di, W.; Cárdenas, L.M.; Calvet, S.; Brüggemann, N.; Loick, N.; Liu, S.; Bol, R. The effect of nitrification nhibitor on N2O, NO and N2 emissions under different soil moisture levels in a permanent grassland soil. Soil Biol. Biochem. 2017, 113, 153–160. [Google Scholar]
  39. Misselbrook, T.H.; Cardenas, L.M.; Camp, V.; Thorman, R.E.; Williams, J.R.; Rollett, R.J.; Chambers, B.J. An assessment of nitrification inhibitors to reduce nitrous oxide emissions from UK agriculture. Environ. Res. Lett. 2014, 9, 115006. [Google Scholar] [CrossRef]
  40. Dittert, K.; Bol, R.; King, R.; Chadwick, D.; Hatch, D. Use of a novel nitrification inhibitor to reduce nitrous oxide emission from N-15-labelled dairy slurry injected into soil. Rapid Commun. Mass Spectrom. 2001, 15, 1291–1296. [Google Scholar] [CrossRef]
  41. Subbarao, G.V.; Ito, O.; Sahrawat, K.L.; Berry, W.L.; Nakahara, K.; Ishikawa, T.; Watanabe, T.; Suenaga, K.; Rondon, M.; Rao, I. Scope and strategies for regulation of nitrification in agricultural systems—Challenges and opportunities. Crit. Rev. Plant Sci. 2006, 25, 303–335. [Google Scholar] [CrossRef]
  42. Chibuike, G.; Saggar, S.; Palmada, T.; Luo, J. The persistence and efficacy of nitrification inhibitors to mitigate nitrous oxide emissions from New Zealand pasture soils amended with urine. Geoderma Reg. 2022, 30, e00541. [Google Scholar] [CrossRef]
  43. Meng, X.; Ma, C.; Petersen, S.O. Sensitive control of N2O emissions and microbial community dynamics by organic fertilizer and soil interactions. Biol. Fertil. Soils 2022, 58, 771–788. [Google Scholar] [CrossRef]
  44. Bollmann, A.; Conrad, R. Influence of O2 availability on NO and N2O release by nitrification and denitrification in soils. Glob. Chang. Biol. 1998, 4, 387–396. [Google Scholar] [CrossRef]
  45. Wrage, N.; Velthof, G.L.; van Beusichem, M.L.; Oenema, O. Role of nitrifier denitrification in the production of nitrous oxide. Soil Biol. Biochem. 2001, 33, 1723–1732. [Google Scholar] [CrossRef]
  46. Wu, D.; Well, R.; Cárdenas, L.M.; Fuβ, R.; Lewicka-Szczebak, D.; Köster, J.R.; Brüggemann, N.; Bol, R. Quantifying N2O reduction to N2 during denitrification in soils via isotopic mapping approach: Model evaluation and uncertainty analysis. Environ. Res. 2019, 179, 108806. [Google Scholar] [CrossRef] [PubMed]
  47. Friedl, J.; Scheer, C.; Rowlings, D.W.; Deltedsco, E.; Gorfer, M.; De Rosa, D.; Grace, P.R.; Müller, C.; Keiblinger, K.M. Effect of the nitrification inhibitor 3,4-dimethylpyrazole phosphate (DMPP) on N-turnover, the N2O reductase-gene nosZ and N2O:N2 partitioning from agricultural soils. Sci. Rep. 2020, 10, 2399. [Google Scholar] [CrossRef]
Figure 1. Daily average air temperature and precipitation during experimental period.
Sustainability 15 15810 g001
Figure 2. Soil NH4+-N at 0–20 cm depth in all treatments during experimental period (error bars represent s.e.m.; n = 3) shown for different treatments, which include slurry treatments (untreated and Vizura-treated) and slurry application methods (non-placed and placement).
Sustainability 15 15810 g002
Figure 3. Soil NO3-N at 0–20 cm depth in all treatments during the experimental period (error bars represent s.e.m.; n = 3) shown for different treatments, which include slurry treatments (untreated and Vizura-treated) and slurry application methods (non-placed and placement).
Sustainability 15 15810 g003
Figure 4. Separate soil samplings took place in placed slurry treatments after 2, 10, and 18 d, with three 2 cm diam. soil cores taken at 0, 10, and 20 cm distance from the crop row in each block, as indicated in the schematic (left; see text for additional details). A picture of soil sampling on day 2 after slurry application is also shown (right).
Sustainability 15 15810 g004
Figure 5. Soil NH4+-N and NO3-N at different soil depths on the days of separate soil samplings, which show the vertical distribution of slurry N after placement (error bars represent s.e.m.; n = 3).
Sustainability 15 15810 g005
Figure 6. Soil NH4+-N and NO3-N at 0–20 cm depth at different distances from the plant row on the days of separate soil samplings showing the horizontal distribution of slurry N after placement (error bars represent s.e.m.; n = 3).
Sustainability 15 15810 g006
Figure 7. Nitrous oxide (N2O) emissions from the different treatments; untreated and Vizura-treated cattle slurry applied with non-placed injection or placement (error bars represent s.e.m.; n = 3). Asterisk show statistically significant pairwise differences (p = 0.05).
Sustainability 15 15810 g007
Figure 8. Cumulative N2O emissions from row (RW) and interrow soil (IR) with placed and non-placed cattle slurry that was untreated (Unt) or treated with Vizura (Viz) and compared with soil without N application (error bars represent s.e.m.; n = 3). Lower-case letters indicate pairwise differences between slurry treatments (untreated and Vizura-treated), while capital letters indicate pairwise differences between slurry application methods (non-placed vs. placed).
Sustainability 15 15810 g008
Table 1. An overview of treatments and chamber placements for N2O emissions in the experiment.
Treatment Application MethodSlurry TreatmentSampling Position
Plac-Unt-RwPlacedUntreatedRow
Plac-Unt-IRPlacedUntreatedInterrow
Plac-Viz-RwPlacedVizura Row
Plac-Viz-IRPlaced Vizura Interrow
Non-placed-Unt-RwNon-placedUntreatedRow
Non-placed-Unt-IRNon-placedUntreatedInterrow
Non-placed-Viz-RwNon-placedVizuraRow
Non-placed-Viz-IRNon-placedVizura Interrow
ControlNANARow and interrow
NA—not applicable.
Table 2. Analysis of variance (ANOVA) for NH4+-N and NO3-N contents in soil, excluding the control. Significance of p values: *** < 0.001; ** < 0.01; * < 0.05; non-significance (ns) > 0.05.
TreatmentsNum DFDen DFFp
Ammonium-N
Intercept193643.74***
Application method1933.26ns
Slurry treatment19316.61***
Date109325.88***
Slurry application * slurry treatment1930.18ns
Slurry treatment * date10931.85ns
Nitrate-N
Intercept1947685.17***
Application method1942.40ns
Slurry treatment19417.54***
Date1094100.39***
Application method * slurry treatment11940.29ns
Slurry treatment * date10943.16**
Table 3. Three-way analysis of variance (ANOVA) for temporal N2O-N emissions, excluding the untreated control. Significance of p values: *** < 0.001, * < 0.05, non-significance (ns) > 0.05.
Num DFDen DFFp
Within-row
Intercept1101976.07***
Application method11011.66ns
Slurry treatment11010.33ns
Date111014.77***
Application method * slurry treatment110120.44ns
Slurry treatment * date111012.18*
Inter-row
Intercept12252701.87***
Application method12255.75*
Slurry treatment12250.07ns
Date1122510.83***
Application method * slurry treatment122525.98***
Slurry treatment * date112252.47ns
Table 4. Two-way analysis of variance (ANOVA) for cumulative N2O-N emissions, excluding the untreated control. Significance levels: *** p < 0.001; ** p < 0.01; * p < 0.05; ns—non-significant.
Num DFDen DFFp
Intercept1123705.57***
Application method11236.93**
Slurry treatment11230.08ns
Date11230.11ns
Application method * slurry treatment11233.64***
Slurry treatment * date11231.98ns
Disclaimer/Publisher’s Note: The statements, opinions and data contained in all publications are solely those of the individual author(s) and contributor(s) and not of MDPI and/or the editor(s). MDPI and/or the editor(s) disclaim responsibility for any injury to people or property resulting from any ideas, methods, instructions or products referred to in the content.

