Article

Analyzing the Factors Driving the Changes of Ecosystem Service Value in the Liangzi Lake Basin—A GeoDetector-Based Application

1
School of Urban Design, Wuhan University, Wuhan 430072, China
2
School of Architecture and Urban-Rural Planning, Fuzhou University, Fuzhou 350108, China
*
Author to whom correspondence should be addressed.
Sustainability 2023, 15(22), 15763; https://doi.org/10.3390/su152215763
Submission received: 26 September 2023 / Revised: 27 October 2023 / Accepted: 2 November 2023 / Published: 9 November 2023
(This article belongs to the Section Environmental Sustainability and Applications)

Abstract

:
The Liangzi Lake Basin (LLB) is an important ecological buffer for Wuhan’s urban agglomeration. It involves the ecological security of the middle reaches of the Yangtze River. Historical land misuse has altered the topography and impacted the ecosystem services value (ESV). Amid urbanization, it is vital to highlight changing land use methods and their effects on ESV valuation, understanding the underlying drivers comprehensively. The research is centered on the LLB as its designated study region, and utilizes remote sensing satellite data spanning from 2000 to 2020. This data is combined with a value equivalence table to quantify ESV. The GeoDetector method is employed to investigate the driving factors behind ESV fluctuations. The findings indicate a substantial shift in land use patterns within the LLB between 2000 and 2020. Notably, arable land decreased by 6.28% and water bodies decreased by 0.92%, while built-up areas expanded by 5.14% and forest land expanded by 2.05%. During this period, the LLB’s ecosystem services value decreased by approximately 2.035 billion yuan. This drop was mainly due to reduced water areas resulting from urbanization, negatively impacting the ecological regulatory services provided by these water bodies. Based on the geoprobe model, possible drivers of changes in ESV in the LLB were identified, with human activity intensity and NDVI detection results being the most obvious. The research emphasized protecting and restoring key ecological areas, like water bodies and forests, to maintain a delicate balance between the environment and socio-economic development. Additionally, they exemplify the effectiveness of ecological policies, including initiatives such as “Returning Farmland to Forest or Pasture” (RFFP), and the prohibition of lake and field reclamation.

1. Introduction

Ecosystem services (ES) refer to the essential processes through which ecosystems provide valuable benefits for human life and the Earth’s life-sustaining systems [1]. The development of these services has consistently served as a critical indicator of the overall condition of the ecosystem [2]. Amidst the ongoing urbanization trend, the reconfiguration of the environment has placed substantial pressure on ES, notably due to the detrimental impact of changes in land use on ecosystem integrity [3,4].
The connection between land use and the natural environment is intricate, representing a critical channel for the interplay between human activities and the natural world, and a pivotal element impacting the natural environment and ecosystems [5]. With the acceleration of urbanization, the conflicts between human activities and land have continued to intensify. This has given rise to environmental contamination, such as land pollution [6,7], water source contamination [8], and vegetation degradation [9], further heightening these conflicts [10]. Current research has shown that land use affects the spatial and temporal distribution of biological resources and interferes with fundamental ecological processes, such as material exchange and water cycling [11], leading to habitat fragmentation [12], the disruption of stable landscape ecological patterns, disturbing supply-demand relationships at the supply and demand levels of ecosystem services, and generation of resistance to ecosystem service flows [13,14]. The ecosystem services value (ESV) represents a measurable gauge of the capacity of ecosystem services, frequently employed to evaluate the well-being of ecosystem functions. First introduced by Costanza et al. [15], subsequent scholars adopted the equivalence factor approach proposed by Xie et al. [16], which has become a prevalent method for assessing the ESV. However, the factors influencing changes in ESV are evidently not adequately considered, underscoring the necessity for a comprehensive analysis and identification of the factors contributing to fluctuations in ESV.
The distinct advantage of Geodetector lies in its unique factor detection module and reliable statistical methodology for identifying key driving factors [17]. Currently, many scholars are increasingly utilizing this method to uncover influential factors. For instance, Guo et al. [18] employed Geodetector to scrutinize the key influencing factors behind desertification changes in the Yellow River source area. Similarly, in the study by Zhang et al. [19], Geodetector was employed to analyze the determinants of the ecological quality of Chinese urban agglomerations, revealing that 73.68% of the ecological quality of the urban agglomerations was influenced by the expansion of the city’s built-up area and per capita GDP. Furthermore, Wang et al. [20] used Geodetector to explore the factors shaping the spatial layout of the ecological network in Jinan City during the urbanization process, focusing specifically on the impact of changes in land use on the degradation of ecological network components.
Situated within the Wuhan urban agglomeration, the Liangzi Lake Basin (LLB) serves as a crucial ecological barrier in the Yangtze River region [21], playing a vital role in water conservation and biodiversity protection. Acknowledged as a vital wetland in Asia, the LLB ensures regional ecological security. The 2022 14th Conference of the Parties (COP14) to the Convention on Wetlands in Wuhan underscored the global significance of wetlands in addressing climate change and biodiversity loss. However, rapid urban expansion, particularly in the Wuhan City Circle and surrounding satellite cities, has led to significant changes in land use and increased ecological risks. Human activities have posed a serious threat to the ecological stability of the LLB, leading to issues such as water eutrophication [22,23] and sediment pollution [24], impacting the region’s ability to provide vital ecosystem services. Presently, most of the research related to the LLB is concentrated on aspects such as water environment, aquatic flora, and fauna habitats [25,26], with relatively limited attention given to ES. To address the research gaps in this area and considering its unique status and significant ecological value, the primary objective of this study is:
  • To analyze the evolving trends in land use patterns within the LLB between 2000 and 2020.
  • To quantify the repercussions of land use alterations on LLB’s ESV.
  • To elucidate the key drivers contributing to fluctuations in ESV within the LLB.

2. Materials and Methods

2.1. Study Area

The LLB (approximately between 30°05′ and 30°18′ N latitude and 114°21′ and 114°39′ E longitude) is in the southeast of Hubei Province, China. It lies across the Jiangxia District of Wuhan and Ezhou City, and borders the Yangtze River to the north. As shown in Figure 1, the lake extends over an approximate area of 304.3 km2, making it the largest lake in Hubei Province. The lake is an important fishing ground in Hubei Province and one of the ten most famous lakes in China.
Wuhan and its satellite cities are situated in the subtropical monsoon climate region, receives abundant rainfall, and receives adequate sunlight, resulting in a vast area of water surfaces. The topography of LLB predominantly consists of mountainous terrain with gradual slopes, creating a conducive environment for the formation of wetlands and lakes. The extensive wetlands in the region provide an excellent habitat for a diverse array of aquatic flora and fauna. The biodiversity index for aquatic plants in the lake area ranges from two to three, with dominant species including green algae and diatoms. Furthermore, aquatic animals such as rotifers, crucian carp, and bream flourish in this ecosystem [27]. The ample food resources in the LLB also draw a diverse array of rare waterfowl and migratory birds, rendering it one of the most ecologically diverse wetlands in China.
Throughout the course of history, LLB was once connected to the Yangtze River, and during high water levels, it linked with Bao’an Lake and Yae’er Lake, creating extensive water areas with pristine water quality [28]. Nonetheless, owing to extensive land reclamation efforts along the lake’s shores, the lake’s surface area gradually decreased. It was not until 1958 that LLB became entirely separated from Yae’er Lake, Bao’an Lake, and Sanshan Lake. To address the increasing demand for agricultural land resulting from population growth, the “encircling the lake for agricultural purposes” endeavors around LLB reached their zenith in the early 1970s. By 1972, the water area of LLB had contracted to a mere 334 km2, whereas prior to the reclamation, it had encompassed an area of 454.6 km2. It was not until 1980 that this situation began to improve [29,30]. However, despite subsequent policies prohibiting lake encirclement and reclamation, unsustainable urbanization, agriculture, and industrial activities continued to seriously disrupt the ecological balance in the LLB [31,32]. As of December 2022, the formal release of the “Wuhan-East Hubei-Huangshi Planning and Construction Outline” has once again presented new challenges for the ecological preservation and economic construction of the LLB.

2.2. Data Source and Processing

To measure the time dynamic of land-use patterns and changes in ecosystem service values, we captured LLB remote sensing data from the Geospatial Data Cloud Platform database for the years 2000, 2010, and 2020. Through the process of remote sensing image interpretation, we classified the land use within this area into seven distinct categories: arable land, forest, shrub, grassland, waterbody, wasteland, and construction land. Simultaneously, we collected demographic and GDP statistical data specific to this region, as presented in Table S2.
The utilization of land use transition matrices, rooted in the principles of Markov chain theory [33,34], serves as a standard method for elucidating the direction and extent of changes in land type composition within a particular geographic area. These matrices are conventionally formulated using Equation (1):
S i j = S 11 S 12 S 1 n S 21 S 22 S 2 n S n 1 S n 2 S n n
In the equation, S represents the area, i is the land use type before the transfer, j indicates the land use type after the transfer, n indicates how much land type has been transformed, and Sij represents the area of land transferred between the two types, i and j.
To assess the value of ecosystem service, methods proposed by Constanza [15] were adopted. Based on Costanza’s research and the conditions in China, Chinese scholar Xie and his peers [35] put forward the “China Land Ecosystem Service Value Equivalent Factor Table” to calculate the value of ecosystem services of different land-use types in LLB. Leveraging the national average grain procurement price as a benchmark, we assign a value of zero to the amount of land designated for construction. Subsequently, we have employed Formulas (2) and (3) to compute ESV values, with the detailed outcomes provided in Table 1.
E S V f = ( A k × V C f k )
E S V = k = 1 n ( A k × V C k )
In the equations, ESVf denotes the ecological service value of the f-th factor, ESV indicates the total value, VCfk denotes the coefficient for service function value, specifically referring to the coefficient corresponding to the f-th service function value within the k-th land use pattern. VCk represents the ecological service function value coefficient per hectare (in RMB/CNY) for the kth land-use pattern, and Ak symbolizes the extent of land designated for the k-th land use pattern.

2.3. Driving Factors Identification

In most social sciences, GeoDetector is often used as an effective tool for clarifying drivers and detecting spatially stratified heterogeneity [36,37]. It typically encompasses four integral segments, which are factor detection, interaction analysis, risk area identification, and ecological assessment [38]; this study only involves the factor detector and interaction detector. Considering the intricate nature of the ecosystem service framework, as referenced in prior research by Huang et al. [39], we have determined the driving factors for the study area, delineating them into two key dimensions: natural factors and economic development. Normalized difference vegetation index (NDVI), elevation, rainfall, relief, slope, temperature, and soil type were selected as the main drivers (explanatory variables) from the natural factors [40]. Additionally, considering the economic development aspect, we have identified three specific factors: GDP, human activity intensity, and population density. All of these ten factors have been defined as explanatory variables for this study.

2.3.1. Factor Detector

q-statistics was used in the factor detector of GeoDetector [41,42], as seen in Equation (4):
q = 1 1 N σ 2 i = 1 m N i σ i 2
In the equation, q denotes the detected value of each driving factor on dependent variables, with a range of [0, 1], m represents the number of samples of the detected factor, N is the number of units in the study area, and ơ2 and ơi2 stand for the variance of ESV in the sub-regions and in the study area, respectively.

2.3.2. Interaction Detector

The primary aim of detecting interactions is to pinpoint the interplay between diverse influencing factors. It can evaluate whether the relationship of the detected factors on ESV is enhanced, weakened, or independent after the interaction. Through a comparative examination of the outcomes generated by single-factor detectors and interaction detectors, it is possible to assess the connections between factors, interactions, and ESV. the relationship can be divided into five intervals, as shown in Table 2.

3. Results

3.1. The Land Use Patterns and Transformations in the Liangzi Lake Basin

3.1.1. The Changes of Land Use Patterns

Despite the passage of time, arable land, forests, and water bodies remain the most prominent land use categories (Figure 2). Arable land is primarily concentrated at lower elevations near water sources, owing to specific constraints related to altitude and water resources. Forests were primarily situated in the higher-altitude areas of the southern and southeastern regions of LLB. Under the influence of the RFFP program, the forested area has been consistently on the rise, indicating a shift from a fragmented state towards a more integrated and cohesive forest landscape. The water body’s distribution was mainly along with the lakes and rivers, but intensified human activities have led to bank and watershed erosion to some extent.
During the period from 2010 to 2020, there was a significant acceleration in the growth of developed land in the region, largely attributable to the ongoing urbanization process. Although there was a slight reduction in arable land, it remained the dominant land use type in the region, comprising 58.38% to 64.66% of the total land area. Additionally, there was a notable increase in forested land, with a gain of nearly 13,635 hectares from 2000 to 2020. Conversely, there was a decrease of nearly 6000 hectares in water bodies, mainly due to factors such as lake sedimentation and encroachment on lake boundaries. Table 3 provides a detailed breakdown of land area changes for various land use patterns. Notably, the fluctuation between arable land and construction land in the LLB underscores the significant influence of human activities on land use transitions within this area.

3.1.2. The Features of Modifications in Land Utilization

As determined through the analysis of the land use transition matrix, the findings are summarized in Table 4. Over the course of a decade, land use changes affected a substantial area of approximately 59,000 hectares. Notably, the majority of these changes involved the conversion to arable land, totaling around 20,740 hectares. The increase in arable land primarily resulted from conversions of forested areas and water bodies, with each contributing to approximately 50% of the total expansion. Meanwhile, a considerable area of approximately 36,860 hectares of arable land was converted to other patterns: 34.3% into forest and 37.6% into construction land. Within the spectrum of land use changes, construction land underwent the most significant transformation, with a substantial conversion of 15,010 hectares into construction land. Conversely, only 190 hectares of construction land were reverted to other land use patterns. The major contributor to the newly gained construction land was arable land, accounting for 92.5% of the total. No remarkable alteration occurred in the water body area during this decade.
In the interval from 2010 to 2020, the area of land undergoing conversion surpassed that observed during the period from 2000 to 2010, totaling 73,450 hectares across various land use types, as indicated in Table 5. Arable land is the largest area transferred out of land use; about 48,700 hectares of arable land is converted to other land use types, while forest land is the largest land use type transferred in. About 99.9% of the transferred area comes from arable land, which makes the transferred area of forest land as high as more than 23,000 hectares, and it also reflects that the work of RFFP in the LLB in the last 10 years has achieved remarkable results.
Meanwhile, there has been a significant alteration in land utilization, with nearly 19,000 hectares of land having transitioned into construction areas, and a substantial 93.2% of this converted space originating from arable land. Conversely, the presence of water bodies has diminished over this period. This continuous growth of construction areas aligns with the backdrop of accelerated urbanization. The primary hallmark of the change in land use during this period has been the notable expansion of construction zones, which have encroached upon sizeable portions of previously cultivated arable land.

3.2. The Characteristics and Evolution of the Ecosystem Services Value in the Liangzi Lake Basin

3.2.1. The Composition of the Ecosystem Services Value in the Liangzi Lake Basin

Based on Equations (2) and (3), the ESV in LLB was calculated and listed in Table 6. As indicated in Table 6, it can be seen that among all the ESV in the basin from 2000 to 2020, the waterbodies, arable lands, and forest contributed the majority of ESV, taking up 99.9% of the total. Despite arable land occupying the largest land area among all the land use patterns, its ESV only constituted 10% of the total values. While water bodies took up about 13% to 14% of the area in all the selected patterns, they occupied a large proportion of about 70% in ESV, ranking first among all the land use patterns.

3.2.2. The Changes of the Ecosystem Services Value in the Liangzi Lake Basin

To illustrate the disparities and developmental trends of ESV in the LLB, we analyzed land use data from 2000, 2010, and 2020, computing the ESV for these three benchmark years. As shown in Figure 3, the overall ESV in the LLB area demonstrates a tendency to stabilize over the years depicted. The spatial feature of ESV distribution revealed that the central water area exhibited a high value, whereas the surrounding regions had comparatively lower values. The high value was attributed to the achievements of ecological restoration projects like RFFP. However, the overall trend of ESV evolution showed a decline.
Between 2000 and 2020, there was a decrease of 2.035 billion CNY in the overall ESV. The loss was primarily due to the decrease in water bodies area, followed by the decrease in arable lands. Both arable lands and water bodies have experienced a notable decline in ESV over the past two decades, with water bodies demonstrating the most conspicuous fluctuations in ESV from 2010 to 2020 while forests underwent an increase throughout the entire study period. The other land use patterns, due to their relatively small size and gentle fluctuations in area during the 20 years, did not indicate significant ESV changes.
From the first classification of ES, as shown in Figure 4, it can be found that each ESV class has undergone a reduction of various degrees. Among these, the regulation service value displayed the most substantial decrement, followed by the decrement in the provision service value. Meanwhile, a prominent growth occurred in the value of the supporting service, as indicated in Figure 5. In the context of secondary categorization, it is clear that there has been a decline in the value associated with food and materials production, air purification, environmental purification, hydrological regulation, nutrient cycling maintenance, and the aesthetics of landscapes.

3.3. Determining the Factors behind ESV Changes in LLB

The factor detector of GeoDetector can figure out various driving factors and their impacts on ESV. The strengths and size of the impacts are, in decreasing order, human activity intensity and rainfall, as shown in Table 7. Among the social and economic factors, human activity intensity emerged as the most influential factor affecting ESV spatial heterogeneity in the LLB, with a q value reaching 0.786865, securing the top position among all factors. As discussed in Section 3.1, concerning land use trends, it is evident that human activities drive the reduction in arable land and water areas in the Great Lakes region while facilitating the expansion of urban land. This illustrates that the rapid urbanization of the Great Lakes region has come at the expense of diminished arable land and water areas. In addition, an important role was played by NDVI in shaping the spatial heterogeneity of ESV in the LLB.

3.4. Interaction Detection for the Ecosystem Services Value Change in the Liangzi Lake Basin

Using an interaction detector, the integrated impact of two different factors on the ESV can be investigated, as shown in Figure 6. Upon the interaction of these factors, it became evident that the influence of explanatory factors was notably amplified. This indicated that the combined impact of multiple factors played a more substantial role in shaping the spatially stratified heterogeneity of ESV. Additionally, the interaction type between these factors exhibited a bi-factor enhancement [45]. Among all the interactions, the impact of human activity intensity and NDVI were significantly enhanced when they interacted with other variables. When these two interacted, the q value came up to 0.89, which meant when NDVI was influenced by human activity, the influential strength of the interacted factor to the spatial stratified heterogeneity of ESV would greatly increase. Upon a careful examination and comparison of the outcomes from both the interaction test and the factor test, it became evident that human activities had significantly interfered with the natural environment in LLB. This interference stands as the primary factor contributing to the degradation of its ecological service function. Therefore, limiting and adjusting the progress of urban development and land use, and strictly controlling the ecological conservation red lines will benefit the improvement of ESV in the LLB. In the future, the LLB will persistently face the formidable challenges of aligning economic development with ecological conservation. To ensure the effective operation of ecosystem services within the watershed, the utmost priority should be placed on safeguarding natural ecosystems and mitigating the negative effects stemming from human activities on these ecosystems.

4. Discussion

The dominant land use categories in the LLB encompass arable land, forests, and water bodies. Over a period from 2000 to 2020, a significant decline has been observed in the area covered by both water bodies and arable land within the LLB. Simultaneously, the area allotted for construction has been progressively growing, and urban sprawl in the region might be the primary cause of this. To meet agricultural production demands, there has been a renewed intensification of farming activities around the lake [46,47,48]. This initiative is poised to accelerate shifts in the region’s land utilization patterns, consequently leading to changes in ESV. These findings are consistent with the research conducted by other scholars in the field [49,
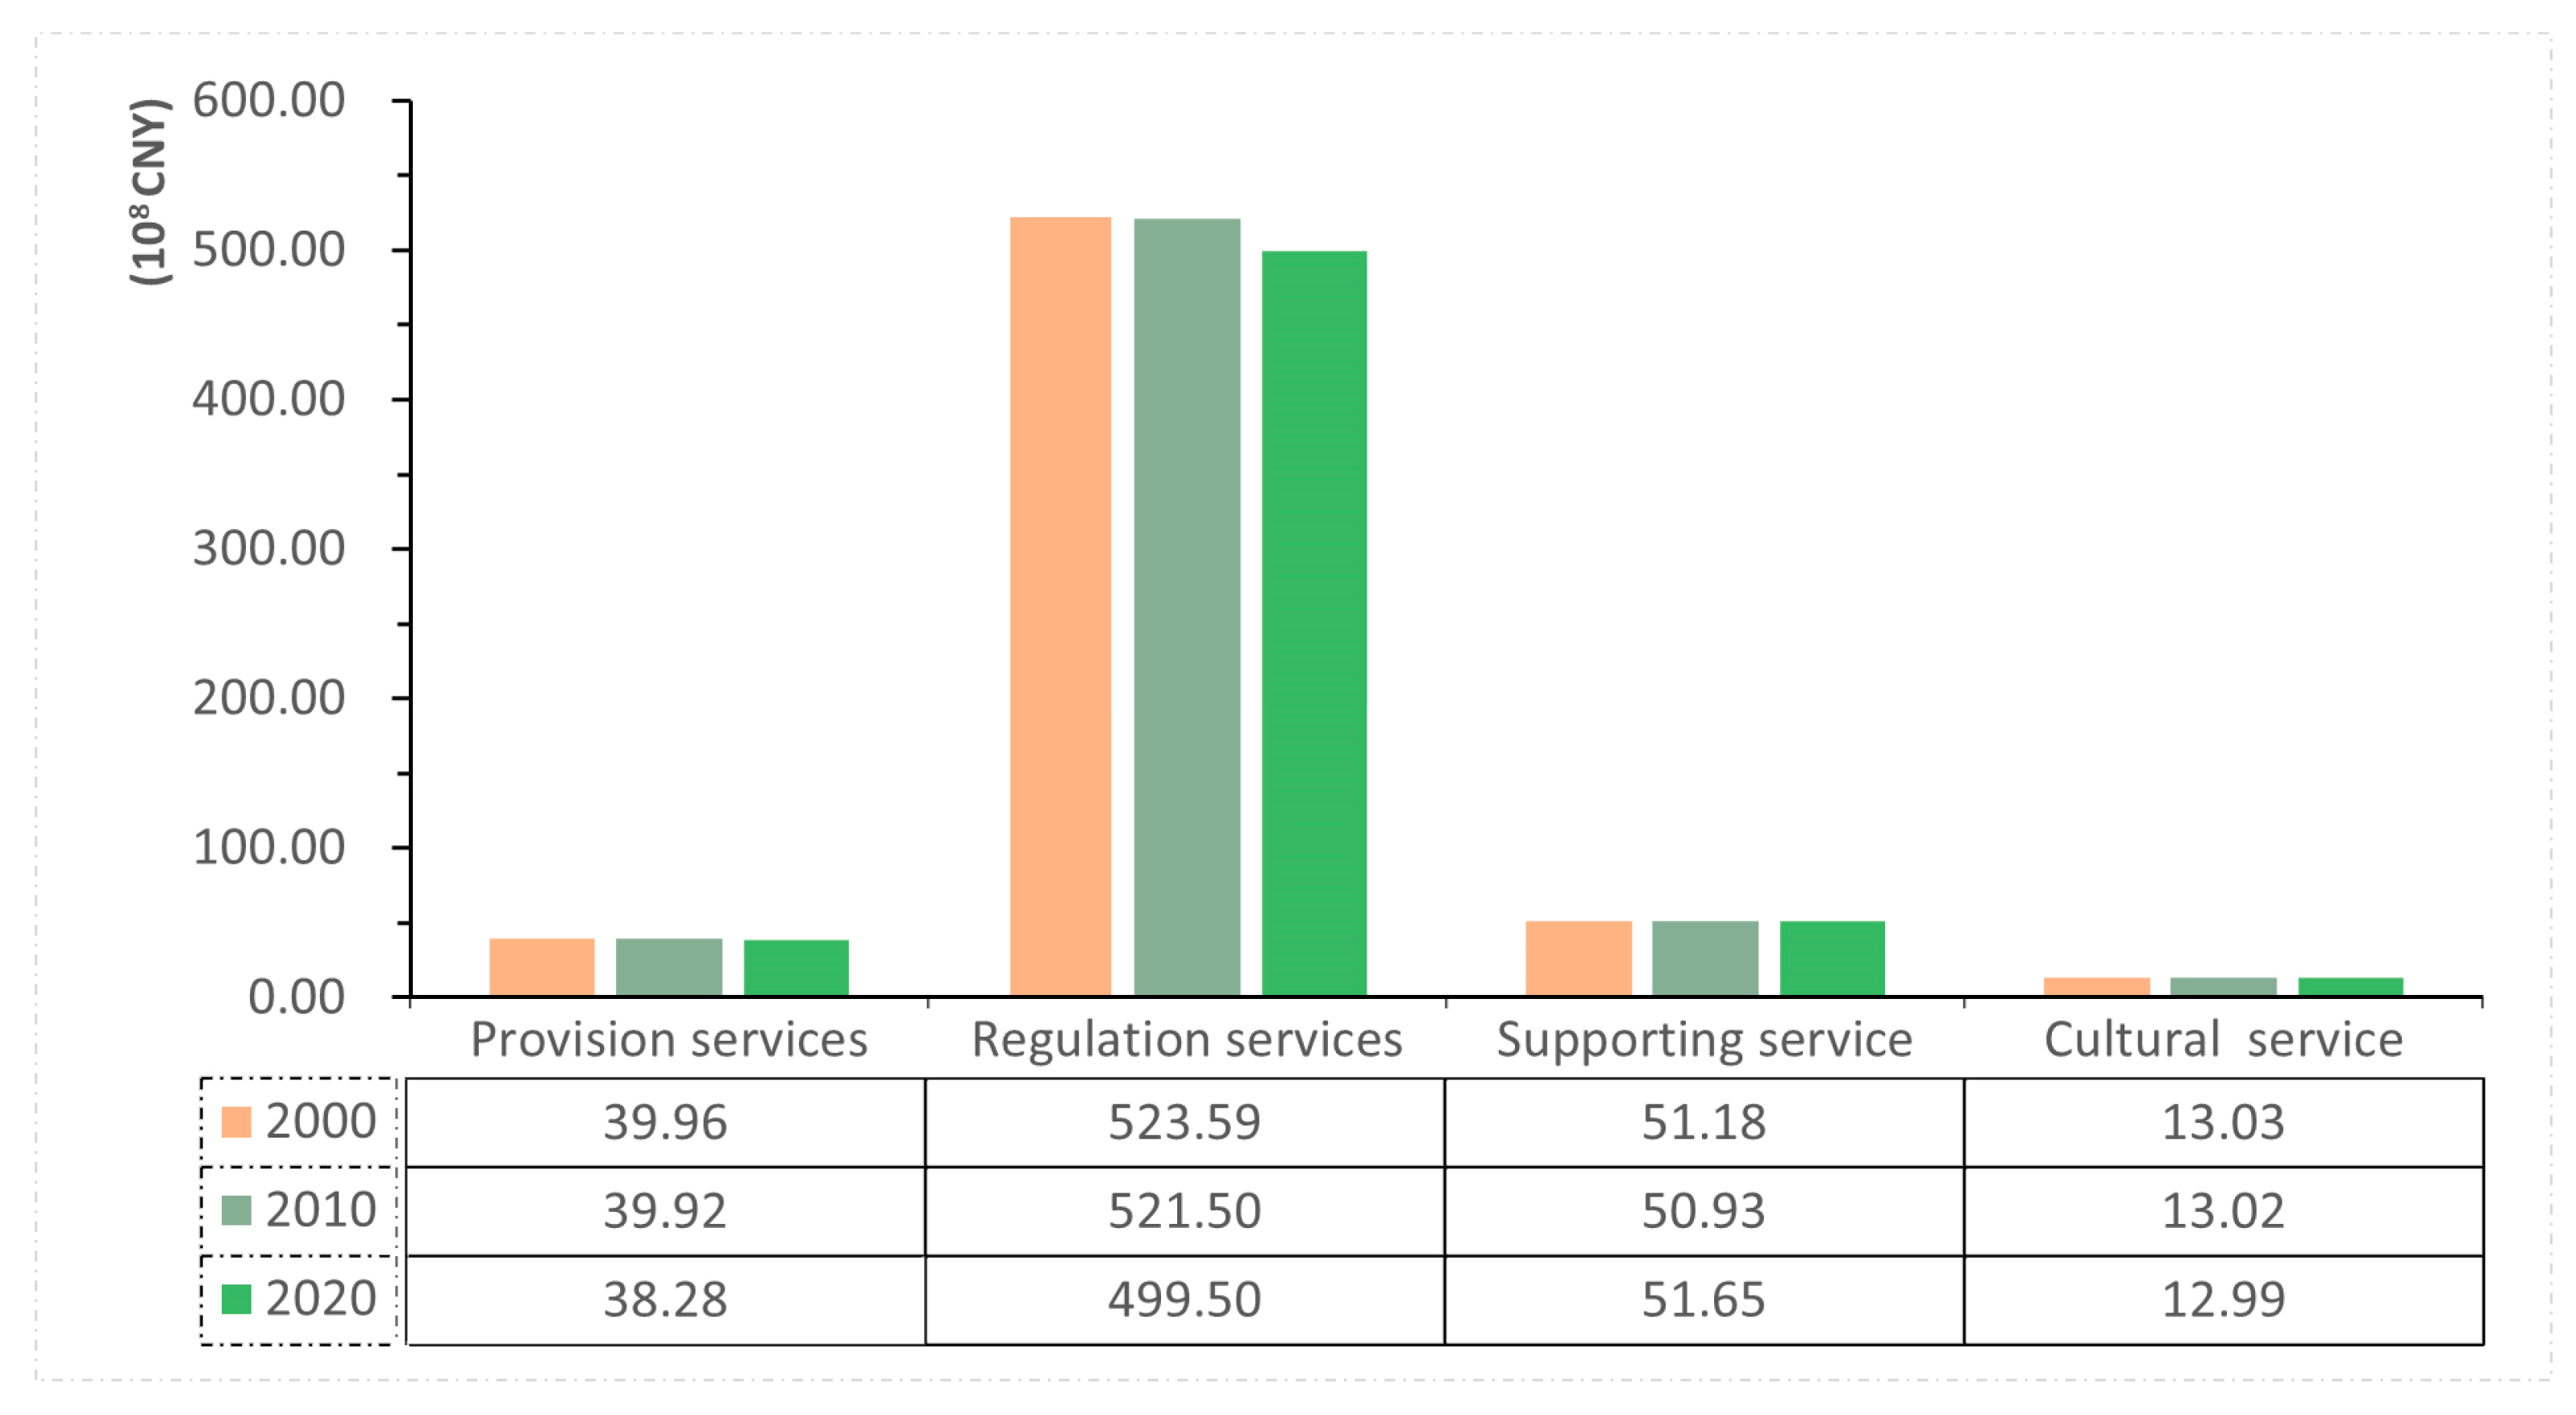
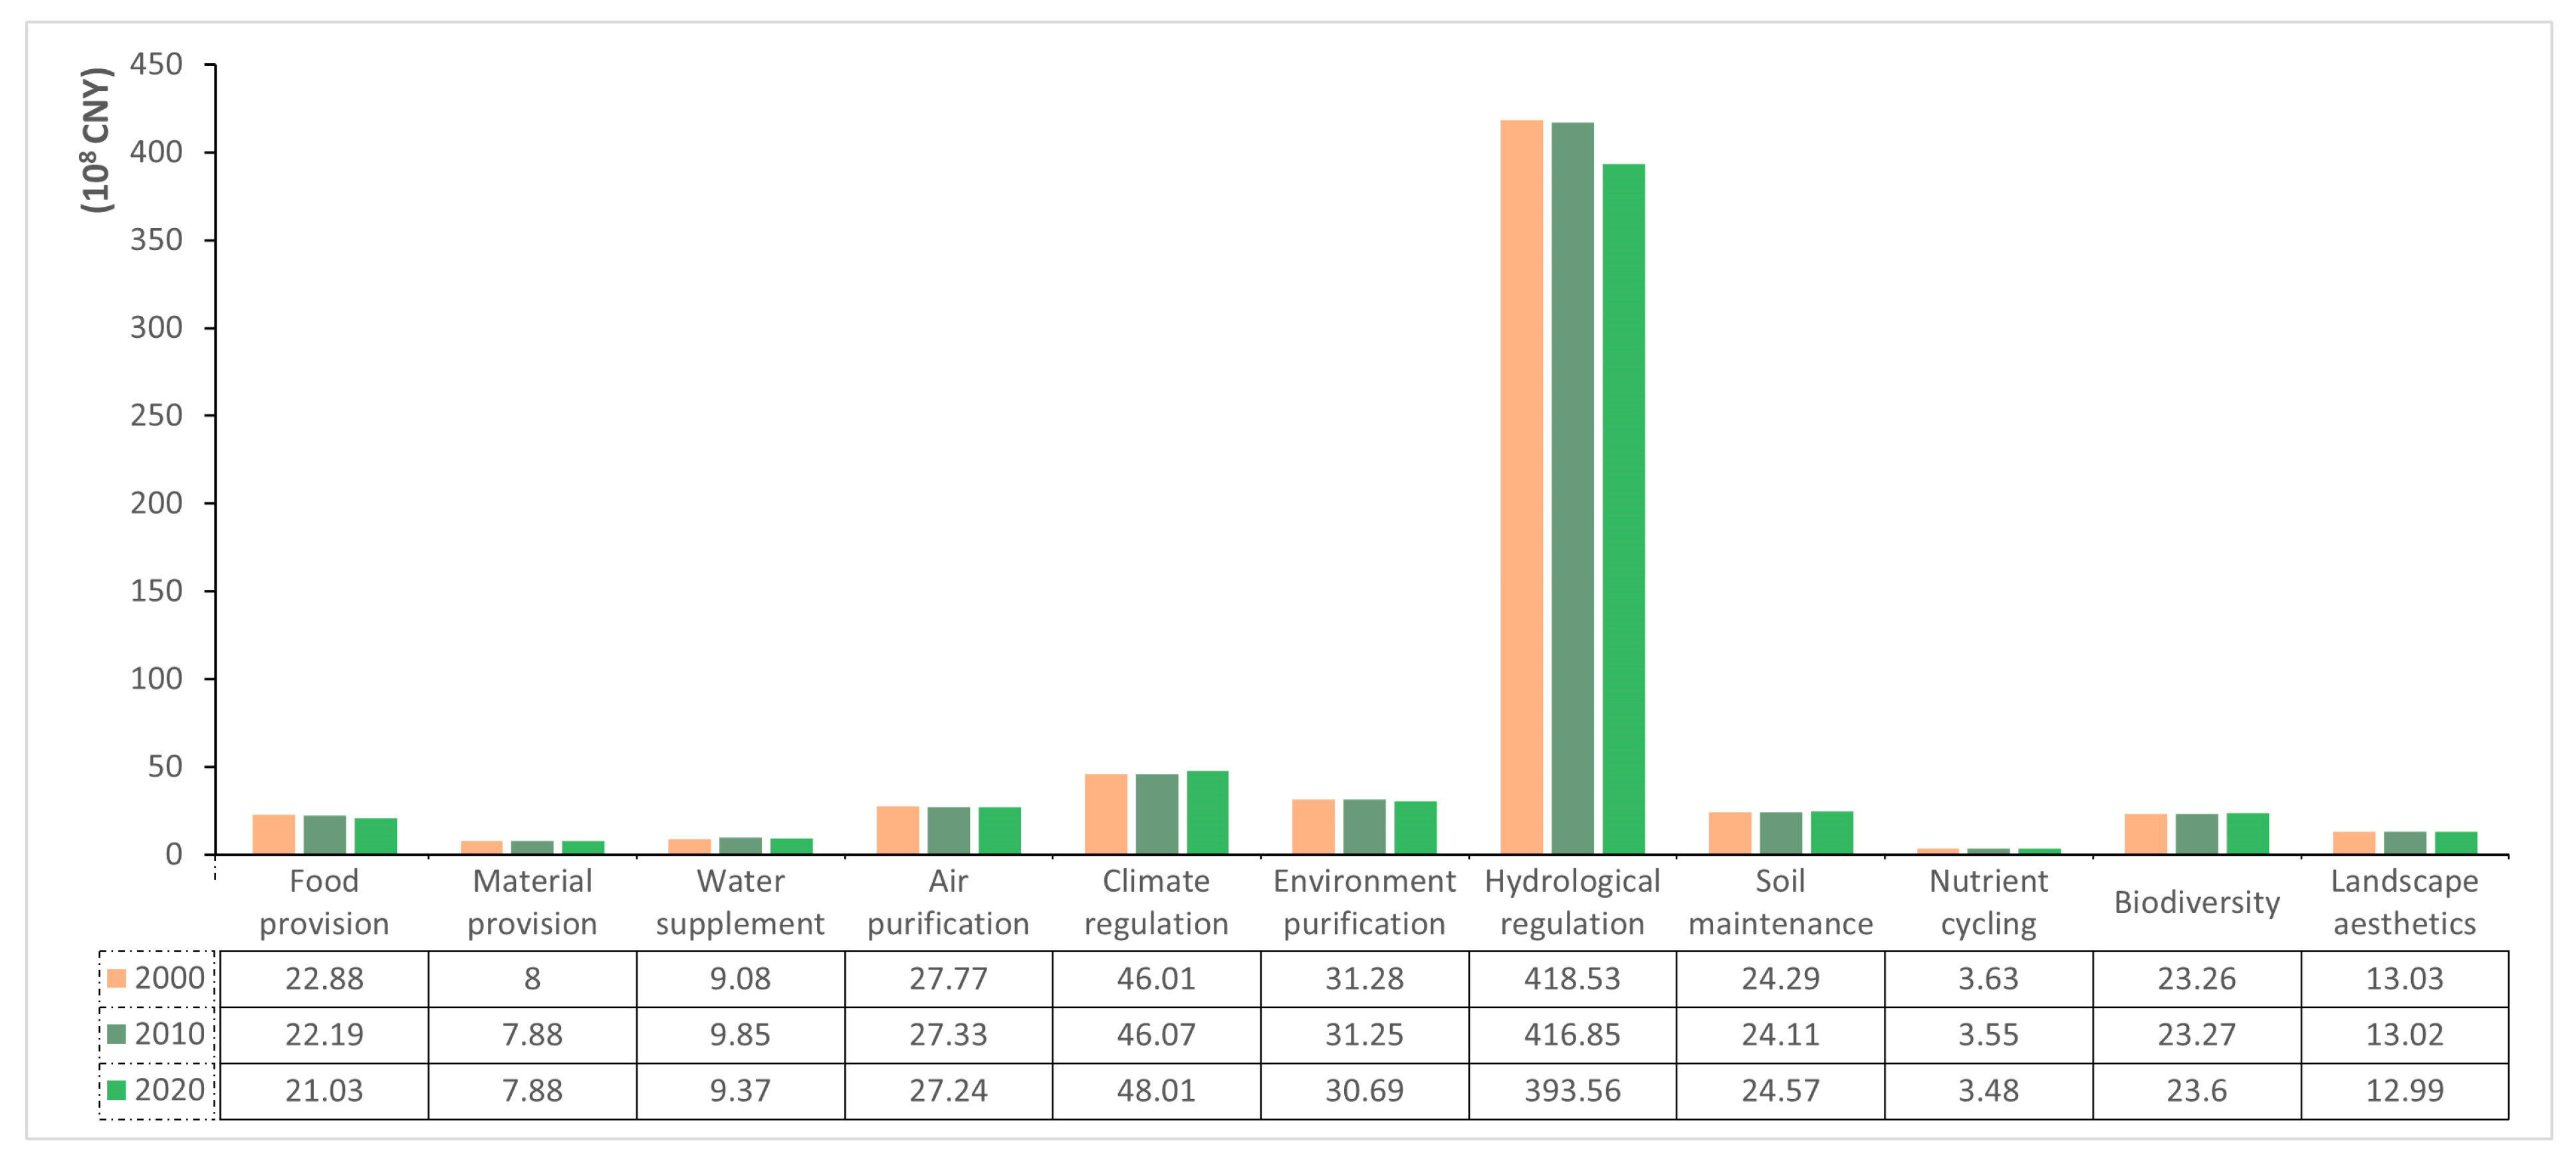
50]. Between 2000 and 2020, the collective ESV within the study area witnessed a decline of 2.035 billion CNY. Some ecosystem services have experienced different degrees of decline, with the regulation service showing the most significant decrease. The main reason for the decrease can be traced to the reduced water area caused by lake reclamation and urban expansion [51]. The growth of metropolitan areas in cities surrounding the LLB has led to a substantial reduction in arable lands, wetlands, and water bodies [52]. Consequently, the decrease in the extent of these land use patterns was unquestionably linked to a decline in their corresponding ecosystem services.
The Yangtze River Economic Belt, encompassing the LLB, holds a significant position as an economic corridor in China. However, the concentration of cities inevitably triggers a rise in human activities, intensifying the strain on the ecosystem’s carrying capacity. In the examination of the primary influencing factors, the impact of human activities emerged as the foremost driver of ESV, notably evident in the interaction of two factors. This finding underscores the pivotal role of socio-economic development in elucidating the ESV changes, aligning with the various ecological challenges that have surfaced amid the region’s rapid growth [53]. Hence, prioritizing ecological conservation alongside economic development is imperative. However, when it comes to different levels of administrative divisions and more complex geographical environments, the scope of factors of and the reliability of the data of GeoDetector can be limited for further research.
In terms of population, the number of residents in the study area has increased by about 510,000 between 2000 and 2020. The most significant surge in population, comprising roughly 370,000 individuals, was observed in Jiangxia District (Data source: see Table S1). The growth of population echoed the changes in land use patterns; the surge in population led to urban expansion and intensive human activities [54,55]. These factors have amplified land utilization practices and brought about substantial modifications to the land use patterns of the LLB. As a result, extensive land and water areas have been encroached upon to facilitate urban development, resulting in serious environmental pollution and degradation in ecosystem services.
Unreasonable land utilization practices have resulted in the degradation of ecosystem functions. However, scientific and effective ecological policies can mitigate or offset the adverse consequences of rapid urbanization, as best exemplified by the ecological restoration project in the Three Gorges Reservoir area [56]. Presently, the reduction in water surface area and arable land within the LLB continues to pose a significant hazard to ecosystem services. Consequently, cities surrounding the LLB must implement ecological conservation and restoration measures. For example, vigorously supporting the RFFP and similar projects reduce the intrusion of high-speed rails, expressways, and other transportation facilities into ecological spaces [57,58,59]. Moreover, it is imperative for decision-makers and planners, when devising future planning policies and development projects, to exercise strict control over ecological conservation boundaries and arable land protection boundaries. This measure will help decelerate the trajectory of construction growth while enhancing the extent of water bodies and the prevalence of forests within the land utilization framework. Integrating ecosystem preservation into urban planning and lake basin development is pivotal to realizing the goal of aligning urban expansion with ecological preservation [60].

5. Conclusions

Comprehensive research on ESV encompasses various fields, including ecology, geography, humanities, and social economics. This multidisciplinary approach adds to the uncertainty and complexity of the research. In this study, we delve deeply into the characteristics of changes in ecosystem service values within the region, primarily focusing on land use dynamics. Furthermore, we employ the GeoDetector methodology to meticulously scrutinize the driving forces influencing shifts in ecosystem service values within the basin and the interplay among these factors. This detailed analysis provides a precise quantitative assessment of the intrinsic factors responsible for the fluctuations in ecosystem service values. The study’s findings indicate that the intensity of human activities and the NDVI were the primary drivers of changes in ecosystem service values in the LLB during the study period. The rapid urbanization experienced has resulted in significant alterations to the region’s land-use structure, with substantial encroachments on lakes and arable land, consequently leading to a pronounced decrease in ecosystem service values. This study’s outcomes enhance our comprehension of ecosystem service values in the LLB, offering crucial theoretical support for forthcoming ecological restoration projects and economic development initiatives.
In order to more accurately depict the temporal variations in ecosystem service values, this study relied on statistical data from the years 2000, 2010, and 2020. Nevertheless, it is essential to recognize that ecosystem services operate as continuous, ongoing processes, and therefore, solely utilizing data from these three benchmark years may not comprehensively represent the overall changes that transpired over a 20-year period. In forthcoming research, the inclusion of data from additional years and diverse regions should be contemplated to heighten the precision of research outcomes. Furthermore, the integration of other theoretical models, such as the FLUS model [61], could be explored to simulate the evolution of ESV under various scenarios and multifaceted influences, thereby affording a more accurate characterization and prediction of the spatiotemporal dynamics of ESV over extended timeframes.
Concerning the evaluation of ecosystem values, this study employed a method predicated on the national average value per unit area. This method assumes uniformity in ESV across the entire land surface, although in actuality, variations may exist. At the same time, further attention needs to be paid to differences in the quality of the water body itself in the assessment to improve the accuracy of the study [62]. However, it is essential to emphasize that the primary focus of this study was to perform a driver analysis, and as a result, the impact of ESV heterogeneity on the research findings remained relatively limited. In future research endeavors, opportunities exist to further enhance and refine the accuracy of this particular aspect.

Supplementary Materials

The following supporting information can be downloaded at: https://www.mdpi.com/article/10.3390/su152215763/s1.

Author Contributions

Y.Z.: conceptualization, supervision. T.C.: data curation, writing—original draft, visualization. J.W.: writing—review and editing, X.X.: conceptualization, supervision. All authors have read and agreed to the published version of the manuscript.

Funding

This research was funded by the National Natural Science Foundation of China’s “Vehicle-Mounted AR-HUD Map Load Measurement, Information Transmission and Virtual-Real Fusion Visualization” project (42271458), the National Natural Science Foundation of China’s “Spatial and temporal evolution mechanism of ecosystem services and control strategies in the Yangtze River Basin from the perspective of heterogeneity” project (72174158), the National Natural Science Foundation of China’s “Study on the Evolution Mechanism and Conservation Strategy of Urban Ecosystems under the Perspective of Multi-dimensional Urbanisation” project (71774124).

Institutional Review Board Statement

Not applicable.

Informed Consent Statement

Informed consent was obtained from all subjects involved in the study.

Data Availability Statement

The data that supports the findings of this study are available in the Supplementary Material of this article.

Conflicts of Interest

The authors declare no conflict of interest.

References

  1. Comberti, C.; Thornton, T.F.; Echeverria, V.W.; Patterson, T. Ecosystem services or services to ecosystems? Valuing cultivation and reciprocal relationships between humans and ecosystems. Glob. Environ. Chang. Hum. Policy Dimens. 2015, 34, 247–262. [Google Scholar] [CrossRef]
  2. Bi, J.; Hao, R.; Li, J.; Qiao, J. Identifying ecosystem states with patterns of ecosystem service bundles. Ecol. Indic. 2021, 131, 108195. [Google Scholar] [CrossRef]
  3. Díaz, S.; Settele, J.; Brondízio, E.S.; Ngo, H.T.; Agard, J.; Arneth, A.; Balvanera, P.; Brauman, K.A.; Butchart, S.H.M.; Chan, K.M.A.; et al. Pervasive human-driven decline of life on Earth points to the need for transformative change. Science 2019, 366, eaax3100. [Google Scholar] [CrossRef] [PubMed]
  4. Foley, J.A.; DeFries, R.; Asner, G.P.; Barford, C.; Bonan, G.; Carpenter, S.R.; Chapin, F.S.; Coe, M.T.; Daily, G.C.; Gibbs, H.K.; et al. Global consequences of land use. Science 2005, 309, 570–574. [Google Scholar] [CrossRef] [PubMed]
  5. Sterling, S.M.; Ducharne, A.; Polcher, J. The impact of global land-cover change on the terrestrial water cycle. Nat. Clim. Chang. 2013, 3, 385–390. [Google Scholar] [CrossRef]
  6. Xie, T.; Hou, Y.; Chen, W.; Wang, M.; Lu, S.; Li, X. Impact of urbanization on the soil ecological environment: A review. Acta Ecol. Sin. 2019, 39, 1154–1164. [Google Scholar] [CrossRef]
  7. Shen, H.; An, R.; Shi, H.; Liu, X.; Zhang, A. Heavy Metal Pollution and Influencing Factors of Agricultural Land in a Typical Watershed in Hunan Province. Res. Environ. Sci. 2021, 34, 715–724. [Google Scholar]
  8. Guo, J.; Wang, C.; Huang, D.; Li, L.; Lian, H. Pollution characterization and water quality assessment of Dongting Lake. Environ. Chem. 2019, 38, 152–160. [Google Scholar] [CrossRef]
  9. Ezaidi, S.; Aydda, A.; Kabbachi, B.; Althuwaynee, O.F.; Ezaidi, A.; Haddou, M.A.; Idoumskine, I.; Thorpe, J.; Park, H.J.; Kim, S.W. Multi-temporal Landsat-derived NDVI for vegetation cover degradation for the period 1984–2018 in part of the Arganeraie Biosphere Reserve (Morocco). Remote Sens. Appl. Soc. Environ. 2022, 27, 100800. [Google Scholar] [CrossRef]
  10. Vihervaara, P.; Rönkä, M.; Walls, M. Trends in Ecosystem Service Research: Early Steps and Current Drivers. Ambio 2010, 39, 314–324. [Google Scholar] [CrossRef]
  11. Jin, T.; Zhang, X.; Xie, J.; Liang, J.; Wang, T. Study on hydrological response of runoff to land use change in the Jing River Basin, China. Environ. Sci. Pollut. Res. 2023, 30, 101075–101090. [Google Scholar] [CrossRef] [PubMed]
  12. Gong, Z.; Su, S.; Du, B.; Guan, H.; Zhang, Q. Habitat selection and dispersal of red-crowned cranes during breeding period in Zhalong Wetland National Nature Reserve. J. Nat. Resour. 2021, 36, 1964–1975. [Google Scholar] [CrossRef]
  13. Shao, D.; Wu, D. Analysis on the Effect of Landscape Fragmentation on Ecosystem Service Value: A Case Study of Suzhou. Resour. Environ. Yangtze Basin 2020, 29, 2436–2449. [Google Scholar]
  14. Metzger, J.P.; Villarreal-Rosas, J.; Suárez-Castro, A.F.; López-Cubillos, S.; González-Chaves, A.; Runting, R.K.; Hohlenwerger, C.; Rhodes, J.R. Considering landscape-level processes in ecosystem service assessments. Sci. Total Environ. 2021, 796, 149028. [Google Scholar] [CrossRef] [PubMed]
  15. Costanza, R.; d’Arge, R.; de Groot, R.; Farber, S.; Grasso, M.; Hannon, B.; Limburg, K.; Naeem, S.; O’Neill, R.V.; Paruelo, J.; et al. The value of the world’s ecosystem services and natural capital. Nature 1997, 387, 253–260. [Google Scholar] [CrossRef]
  16. Xie, G.; Zhang, C.; Zhen, L.; Zhang, L. Dynamic changes in the value of China’s ecosystem services. Ecosyst. Serv. 2017, 26, 146–154. [Google Scholar] [CrossRef]
  17. Wang, J.; Xu, C. Geodetector: Principle and prospective. Acta Geogr. Sin. 2017, 72, 116–134. [Google Scholar] [CrossRef]
  18. Guo, B.; Wei, C.; Yu, Y.; Liu, Y.; Li, J.; Meng, C.; Cai, Y. The dominant influencing factors of desertification changes in the source region of Yellow River: Climate change or human activity? Sci. Total Environ. 2022, 813, 152512. [Google Scholar] [CrossRef]
  19. Zhang, L.; Fang, C.; Zhao, R.; Zhu, C.; Guan, J. Spatial–temporal evolution and driving force analysis of eco-quality in urban agglomerations in China. Sci. Total Environ. 2023, 866, 161465. [Google Scholar] [CrossRef]
  20. Wang, C.; Wang, Q.; Liu, N.; Sun, Y.; Guo, H.; Song, X. The impact of LUCC on the spatial pattern of ecological network during urbanization: A case study of Jinan City. Ecol. Indic. 2023, 155, 111004. [Google Scholar] [CrossRef]
  21. Liu, Y.; Zhang, X.; Kong, X.; Wang, R.; Chen, L. Identifying the relationship between urban land expansion and human activities in the Yangtze River Economic Belt, China. Appl. Geogr. 2018, 94, 163–177. [Google Scholar] [CrossRef]
  22. Zhao, Y.; Li, T.; Huang, B.; Feng, Y.; Lei, M.; Zhuo, H.; Wu, Y. Evolution characteristics and driving factors of water quality and eutrophication of typicallakes in the middle reaches of the Yanatze River from 2016 to 2020. J. Lake Sci. 2022, 34, 1441–1451. [Google Scholar] [CrossRef]
  23. Wu, C.; Wu, X.; Ge, X.; Ren, W.; Feng, L.; Yang, J.; Tan, Y. Optical Properties of Five Typical Lakes in Southeastern Hubei Province. J. Hydroecol. 2022, 43, 96–104. [Google Scholar] [CrossRef]
  24. He, X.; Shi, M. Distribution Characteristics and Ecological and Health Risk Assessment of Phthalic Acid Esters in Surface Water and Sediment of Liangzi Lake, China. Environ. Monit. China 2021, 37, 115–127. [Google Scholar] [CrossRef]
  25. Zhang, Q.; Dong, X.; Yao, M.; Chen, S.; Yang, X. Historical information on aquatic vegetation revealed by sedimentary diatoms: A case study on Liangzi Lake. Acta Hydrobiol. Sin. 2014, 38, 1024–1032. [Google Scholar] [CrossRef]
  26. Ge, J.; Cai, Q.; Liu, J.; Liu, S.; Pu, Y.; Mei, W. The present situation and evaluation of plant diversity of Lake Liangzihu wetland. China Environ. Sci. 2003, 23, 451–456. [Google Scholar]
  27. Wu, W.; Wang, L.; Zhang, B. Investigation on biodiversity of aquatic organisms and water quality in Liangzi Lake. Environ. Sci. Technol. 2014, 37, 199–204. [Google Scholar]
  28. Li, Z.; Sun, D. Study on the Ecological Environment Protection of Liangzi Lake; Li, Z., Sun, D., Eds.; Science Publishers: Beijing, China, 2009; Volume 2, pp. 10–16. [Google Scholar]
  29. Liu, J. Remote sensing monitoring and analysis of the volume variation of flood storage in Liangzi Lake in Hubei Province in past 45 years. China Flood Drought Manag. 2019, 29, 29–35. [Google Scholar] [CrossRef]
  30. Wu, W.; Wang, L.; Zhang, B.; Liao, Q.; Zhu, Y.; Tang, J. Baseline survey and evaluation on environment of Liangzi Lake Basin. Water Resour. Prot. 2015, 31, 98–102. [Google Scholar] [CrossRef]
  31. Peng, K.; Jiang, W.; Ling, Z.; Hou, P.; Deng, Y. Evaluating the potential impacts of land use changes on ecosystem service value under multiple scenarios in support of SDG reporting: A case study of the Wuhan urban agglomeration. J. Clean. Prod. 2021, 307, 127321. [Google Scholar] [CrossRef]
  32. Qin, Y.; Li, Y.; Wu, L.; Chen, H.; Li, Z.; Huang, Y. Analysis on the spatial-temporal patterns of water quality in Lake Liangzi. Lake Sci. 2016, 28, 994–1003. [Google Scholar] [CrossRef]
  33. Tariq, A.; Yan, J.; Mumtaz, F. Land change modeler and CA-Markov chain analysis for land use land cover change using satellite data of Peshawar, Pakistan. Phys. Chem. Earth Parts A/B/C 2022, 128, 103286. [Google Scholar] [CrossRef]
  34. Mansour, S.; Al-Belushi, M.; Al-Awadhi, T. Monitoring land use and land cover changes in the mountainous cities of Oman using GIS and CA-Markov modelling techniques. Land Use Policy 2020, 91, 104414. [Google Scholar] [CrossRef]
  35. Xie, G.; Lu, C.; Leng, Y.; Zheng, D.; Li, S. Ecological assets valuation of the Tibetan Plateau. J. Nat. Resour. 2003, 18, 189–196. [Google Scholar] [CrossRef]
  36. Zhang, X.; Shen, J.; Sun, F.; Wang, S.; Wan, Y. Spatiotemporal Distribution and Driving Force Analysis of the Ecosystem Service Value: A Typical Case Study of the Coastal Zone, Eastern China. Sustainability 2023, 15, 14172. [Google Scholar] [CrossRef]
  37. Xu, L.; Du, H.; Zhang, X. Driving forces of carbon dioxide emissions in China’s cities: An empirical analysis based on the geodetector method. J. Clean. Prod. 2021, 287, 125169. [Google Scholar] [CrossRef]
  38. Han, J.; Wang, J.; Chen, L.; Xiang, J.; Ling, Z.; Li, Q.; Wang, E. Driving factors of desertification in Qaidam Basin, China: An 18-year analysis using the geographic detector model. Ecol. Indic. 2021, 124, 107404. [Google Scholar] [CrossRef]
  39. Huang, H.; Zhou, Y.; Qian, M.; Zeng, Z. Land Use Transition and Driving Forces in Chinese Loess Plateau: A Case Study from Pu County, Shanxi Province. Land 2021, 10, 67. [Google Scholar] [CrossRef]
  40. Peng, W.; Kuang, T.; Tao, S. Quantifying influences of natural factors on vegetation NDVI changes based on geographical detector in Sichuan, western China. J. Clean. Prod. 2019, 233, 353–367. [Google Scholar] [CrossRef]
  41. Wang, J.; Zhang, T.; Fu, B. A measure of spatial stratified heterogeneity. Ecol. Indic. 2016, 67, 250–256. [Google Scholar] [CrossRef]
  42. Wang, J.; Li, X.; Christakos, G.; Liao, Y.; Zhang, T.; Gu, X.; Zheng, X. Geographical Detectors-Based Health Risk Assessment and its Application in the Neural Tube Defects Study of the Heshun Region, China. Int. J. Geogr. Inf. Sci. 2010, 24, 107–127. [Google Scholar] [CrossRef]
  43. Wang, Z.; Wang, J.; Han, J. Spatial prediction of groundwater potential and driving factor analysis based on deep learning and geographical detector in an arid endorheic basin. Ecol. Indic. 2022, 142, 109256. [Google Scholar] [CrossRef]
  44. Peng, W.; Fan, Z.; Duan, J.; Gao, W.; Wang, R.; Liu, N.; Li, Y.; Hua, S. Assessment of interactions between influencing factors on city shrinkage based on geographical detector: A case study in Kitakyushu, Japan. Cities 2022, 131, 103958. [Google Scholar] [CrossRef]
  45. Wang, W.; Samat, A.; Abuduwaili, J.; Ge, Y. Quantifying the influences of land surface parameters on LST variations based on GeoDetector model in Syr Darya Basin, Central Asia. J. Arid Environ. 2021, 186, 104415. [Google Scholar] [CrossRef]
  46. Du, Y.; Xue, H.; Wu, S.; Feng, L.; Fei, X.; Wei, X. Lake area changes in the middle Yangtze region of China over the 20th century. J. Environ. Manag. 2011, 92, 1248–1255. [Google Scholar] [CrossRef]
  47. Hou, X.; Feng, L.; Tang, J.; Song, X.-P.; Liu, J.; Zhang, Y.; Wang, J.; Xu, Y.; Dai, Y.; Zheng, Y.; et al. Anthropogenic transformation of Yangtze Plain freshwater lakes: Patterns, drivers and impacts. Remote Sens. Environ. 2020, 248, 111998. [Google Scholar] [CrossRef]
  48. Cui, L.; Gao, C.; Zhao, X.; Ma, Q.; Zhang, M.; Li, W.; Song, H.; Wang, Y.; Li, S.; Zhang, Y. Dynamics of the lakes in the middle and lower reaches of the Yangtze River basin, China, since late nineteenth century. Environ. Monit. Assess. 2013, 185, 4005–4018. [Google Scholar] [CrossRef]
  49. Xie, C.; Huang, X.; Mu, H.; Yin, W. Impacts of Land-Use Changes on the Lakes across the Yangtze Floodplain in China. Environ. Sci. Technol. 2017, 51, 3669–3677. [Google Scholar] [CrossRef]
  50. Uisso, A.M.; Tanrıvermiş, H. Driving factors and assessment of changes in the use of arable land in Tanzania. Land Use Policy 2021, 104, 105359. [Google Scholar] [CrossRef]
  51. Liu, N.; Liu, C.; Xia, Y.; Da, B. Examining the coordination between urbanization and eco-environment using coupling and spatial analyses: A case study in China. Ecol. Indic. 2018, 93, 1163–1175. [Google Scholar] [CrossRef]
  52. Wang, Q.; Wang, H.; Chang, R.; Zeng, H.; Bai, X. Dynamic simulation patterns and spatiotemporal analysis of land-use/land-cover changes in the Wuhan metropolitan area, China. Ecol. Model. 2022, 464, 109850. [Google Scholar] [CrossRef]
  53. Yang, X.; Dong, X.; Chen, X.; Wang, R.; Wang, Q.; Lin, Q.; Xu, M. Past Environmental Changes and Management Sugestions for Lakes in the Yangtze River Economic Belt. Proc. Chin. Acad. Sci. 2020, 35, 977–987. [Google Scholar] [CrossRef]
  54. de Espindola, G.M.; Carneiro, E.; Façanha, A.C. Four decades of urban sprawl and population growth in Teresina, Brazil. Appl. Geogr. 2017, 79, 73–83. [Google Scholar] [CrossRef]
  55. Talkhabi, H.; Ghalehteimouri, K.J.; Mehranjani, M.S.; Zanganeh, A.; Karami, T. Spatial and temporal population change in the Tehran Metropolitan Region and its consequences on urban decline and sprawl. Ecol. Inform. 2022, 70, 101731. [Google Scholar] [CrossRef]
  56. Huang, C.; Teng, M.; Zeng, L.-X.; Zhou, Z.; Xiao, W.; Zhu, J.; Wang, P. Long-term changes of land use/cover in the Three Gorges Reservoir Area of the Yangtze River, China. Chin. J. Appl. Ecol. 2018, 29, 1585–1596. [Google Scholar] [CrossRef]
  57. Li, W.; Wang, W.; Chen, J.; Zhang, Z. Assessing effects of the Returning Farmland to Forest Program on vegetation cover changes at multiple spatial scales: The case of northwest Yunnan, China. J. Environ. Manag. 2022, 304, 114303. [Google Scholar] [CrossRef]
  58. Xin, L.; Li, X. China should not massively reclaim new farmland. Land Use Policy 2018, 72, 12–15. [Google Scholar] [CrossRef]
  59. Xu, Y.; Zhang, T.; Shao, C. Afforestation increases ecosystem productivity and carbon storage in China during the 2000s. Agric. For. Meteorol. 2021, 296, 108227. [Google Scholar] [CrossRef]
  60. Estoque, R.C.; Murayama, Y. Landscape pattern and ecosystem service value changes: Implications for environmental sustainability planning for the rapidly urbanizing summer capital of the Philippines. Landsc. Urban Plan. 2013, 116, 60–72. [Google Scholar] [CrossRef]
  61. Liu, P.; Hu, Y.; Jia, W. Land use optimization research based on FLUS model and ecosystem services–setting Jinan City as an example. Urban Clim. 2021, 40, 100984. [Google Scholar] [CrossRef]
  62. Hallouin, T.; Bruen, M.; Christie, M.; Bullock, C.; Kelly-Quinn, M. Challenges in Using Hydrology and Water Quality Models for Assessing Freshwater Ecosystem Services: A Review. Geosciences 2018, 8, 45. [Google Scholar] [CrossRef]
Figure 1. Location and topography of LLB.
Sustainability 15 15763 g001
Figure 2. Map of land use changes in LLB in the three baseline years.
Sustainability 15 15763 g002
Figure 3. Map of land use changes in LLB in the three baseline years.
Sustainability 15 15763 g003
Figure 4. The changes of first-class ESV in LLB in the three baseline years.
Sustainability 15 15763 g004
Figure 5. The changes of second-class ESV in LLB in the three baseline years.
Sustainability 15 15763 g005
Figure 6. Interaction detection results using GeoDetector.
Sustainability 15 15763 g006
Table 1. The estimated value of the estimated value of ecosystem services per unit area in the LLB (yuan/hm2).
Ecosystem ServiceArable LandForestGrass LandShrubWater BodyConstruction LandWasted Land
Food provision4326.261068.84912.23743.883132.1300
Materials provision959.212466.551342.901683.52900.4900
Water supplement−5187.59849.59743.88861.3432,456.7000
Air regulation3484.498104.394725.605520.383014.68078.30
Climate regulation1820.5524,274.0112,489.3716,561.148965.7200
Environment purification 528.557059.044122.675011.4121,729.150391.52
Hydrological regulation5853.1715,124.279149.7413,115.80400,286.250117.45
Soil maintenance 2035.889877.965755.296734.083641.10078.30
Nutrient cycling567.70755.63442.41508.97274.0600
Biodiversity665.589004.875234.576146.819983.67078.30
Landscape aesthetics 293.643942.572309.952701.467399.66039.15
Total15,347.4482,527.7247,228.6159,588.79491,783.610783.02
Table 2. Interaction between explanatory variables [43,44].
JudgementsInteraction Type
q(*A1 ∩ *A2) − Min(q(*A1), q(*A2)) < 0Weaken, nonlinear
Min(q(*A1), q(*A2)) < q(*A1∩*A2) < Max(q(*A1), q(*A2))Weaken, uni-
q(*A1∩*A2) − Max(q(*A1), q(*A2)) > 0Enhance, bi-
q(*A1∩*A2) = q(*A1) + q(*A2)Independent
q(*A1∩*A2) − (q(*A1) + q(*A2)) > 0Enhance, nonlinear
*A1, *A2 denote the drivers, and ∩ denotes the interaction between *A1 and *A2.
Table 3. Area changes of different land use patterns in LLB.
Land Use PatternPercentage (%)Changed Area (100 hm2)
2000201020202000–20102010–20202000–2020
Arable land64.6662.2358.38–162.14–256.36–418.51
Forest18.4018.6320.4515.19121.15136.35
Grass land0.000.020.010.92–0.340.58
Shrub0.000.000.00–0.04–0.010.05
Water body14.0514.0113.13–0.24–59.01–61.43
Construction land2.895.118.03148.48194.50342.98
Wasted land0.000.000.000.000.070.07
Table 4. The transition matrix of LLB’s land use pattern areas from 2000 to 2010 (103 hm2).
Land Use Pattern (2000)Land Use Pattern (2010)
Arable LandForestWaterConstruction LandTotal*Losses
Arable land393.7012.6310.3413.88430.5536.86
Forest10.71111.380.030.42122.54111.83
Waterbody 10.020.0682.800.7193.5883.56
Construction land0.010.000.1819.0319.2219.21
Total414.44124.0793.3434.04665.89251.45
*Gains20.74111.4483.0020.16235.34214.60
*Losses mean the area lost in one land use pattern during the 10 years. *Gains mean the area added in one land use pattern during the 10 years.
Table 5. The matrix indicating the distribution of land use patterns in LLB (103 hm2).
Land Use Pattern (2010)Land Use Pattern (2020)
Arable LandForestWaterbody Construction LandTotal*Losses
Arable land365.6823.666.7118.33414.3848.71
Forest10.96112.510.010.58124.06113.10
Waterbody12.130.0180.450.7593.3481.21
Construction land0.040.000.2733.7534.0634.02
Total388.91136.1887.4453.41665.84277.04
*Gains23.13112.5280.7435.07251.46228.33
*Losses mean the area lost in one land use pattern during the 10 years. *Gains mean the area added in one land use pattern during the 10 years.
Table 6. ESV and corresponding changes divided by land use pattern from 2000 to 2020.
Land Use PatternESV (108 CNY)Rate of Change (%)
2000201020202000–20102010–20202000–2020
Arable land56.0353.9250.59–3.76–6.18–9.71
Forest79.6880.6688.541.249.7611.12
Grassland0.010.050.03302.68–27.57191.67
Shrub0.000.000.000.000.000.00
Waterbody 362.54361.61338.75–0.25–6.32–6.56
Construction land0.000.000.000.000.000.00
Wasted land0.000.000.000.000.000.00
Total498.26496.23477.91–0.41–3.69–4.08
Table 7. Driving factor detection results using GeoDetector.
Driving Factor*qDriving Factor*q
Human activity intensity0.786865Undulation0.100289
NDVI0.48255Population0.080163
Type of soil0.258572Altitude0.071024
GDP0.129456Temperature 0.059232
Slope0.105106Rainfall0.044439
*q value represents the influential strength of a driving factor.
Disclaimer/Publisher’s Note: The statements, opinions and data contained in all publications are solely those of the individual author(s) and contributor(s) and not of MDPI and/or the editor(s). MDPI and/or the editor(s) disclaim responsibility for any injury to people or property resulting from any ideas, methods, instructions or products referred to in the content.

