Article

Coupling Coordination and Spatiotemporal Evolution of Low-Carbon Logistics, Industrial Agglomeration, and Regional Economy in the Yangtze River Economic Belt

College of Management, Wuhan University of Technology, Wuhan 430070, China
*
Author to whom correspondence should be addressed.
Sustainability 2023, 15(22), 15739; https://doi.org/10.3390/su152215739
Submission received: 7 August 2023 / Revised: 12 October 2023 / Accepted: 18 October 2023 / Published: 8 November 2023
(This article belongs to the Special Issue Low-Carbon Logistics and Supply Chain Management)

Abstract

:
The logistics industry plays a crucial role in the global economy, but also poses significant challenges to the economy, society, and environment due to increasing carbon emissions. Therefore, coordinated development between the logistics industry and regional economy has become a strategic choice for achieving sustainable development. Taking the Yangtze River Economic Belt as an example, this study constructs an evaluation index system of “low-carbon logistics–industrial agglomeration–regional economy” to explore the coupling coordination relationship and spatiotemporal distribution characteristics of the three systems from 2006 to 2020. Furthermore, it analyzes the spatial correlation features and evolutionary trends of the coordinated development among the three systems. The results indicate that during the study period, the coupling coordination degree among the three systems in the Yangtze River Economic Belt showed a fluctuating upward trend but with a relatively low level of coordination. There were significant regional differences, presenting a stepped distribution pattern of “high in the east and low in the west.” The coordinated development among the three systems exhibited a significant positive spatial correlation, with “H–H” and “L–L” agglomerations being dominant. The spatial distribution of coupling coordination degree remained relatively stable, with the overall center of gravity located in the southeast of Hubei Province. The spatial evolution pattern showed a distinct “northeast–southwest” direction. Finally, suggestions for the coordinated and sustainable development of the three systems are put forward.

1. Introduction

Coordinating economic growth with environmental protection is a universal challenge faced by countries around the world. In recent years, the rapid surge in carbon emissions has resulted in substantial global climate warming, imposing significant pressure on the global ecological environment. This phenomenon has concurrently posed severe challenges to the survival and development of humankind [1]. According to data disclosed by the International Energy Agency, China is the world’s largest emitter of carbon dioxide, and its continuously growing economic trend has consistently exerted significant pressure on carbon emissions reduction [2]. In this context, China formally proposed the “dual carbon” goals during the 75th Session of the United Nations General Assembly, aiming to achieve carbon peaking by 2030 and carbon neutrality by 2060. The “dual carbon” goals are conducive to promoting the operation of a green, low-carbon, and sustainable development model, and they represent a crucial aspect of achieving high-quality economic development in China. As an “accelerator” and “third-party source of profits” in the modern economy, the logistics industry has become a fundamental and strategic sector that supports the development of the national economy. The concentrated development of the logistics industry is conducive to enhancing the competitive strength of regional economic development. However, as a composite industry, the main energy consumed by the logistics industry is coal and oil products with high carbon emission factors, which makes it a priority industry for carbon emission management. Scholars argue that a significant portion of global energy consumption, including fossil fuels, and the emission of greenhouse gases, such as carbon dioxide, can be attributed to the development of the logistics system [3]. According to the fifth assessment report of the Intergovernmental Panel on Climate Change (IPCC), if the logistics industry does not change its high energy consumption development pattern, its energy consumption is projected to increase by an additional 80% by 2030. Focusing on the Chinese context, according to statistics from the “China Energy Statistical Yearbook,” the carbon emissions of the logistics industry increased from 70,465.2 million tons in 2010 to 114,231 million tons in 2021. The proportion of the total national carbon emissions attributed to the logistics industry rose from 7.5% to 8.4% during this period. Compared to China’s five major industries, the logistics industry is the only sector that has continuously increased its carbon intensity since 2003 and has demonstrated a stable growth trend [4]. Therefore, the comprehensive energy-saving and emission reduction work plan for the 14th Five-Year Plan period issued by China specifically emphasizes the need to promote energy-saving and emission reduction projects in transportation and logistics, and accelerate the construction of a low-carbon circular economy system.
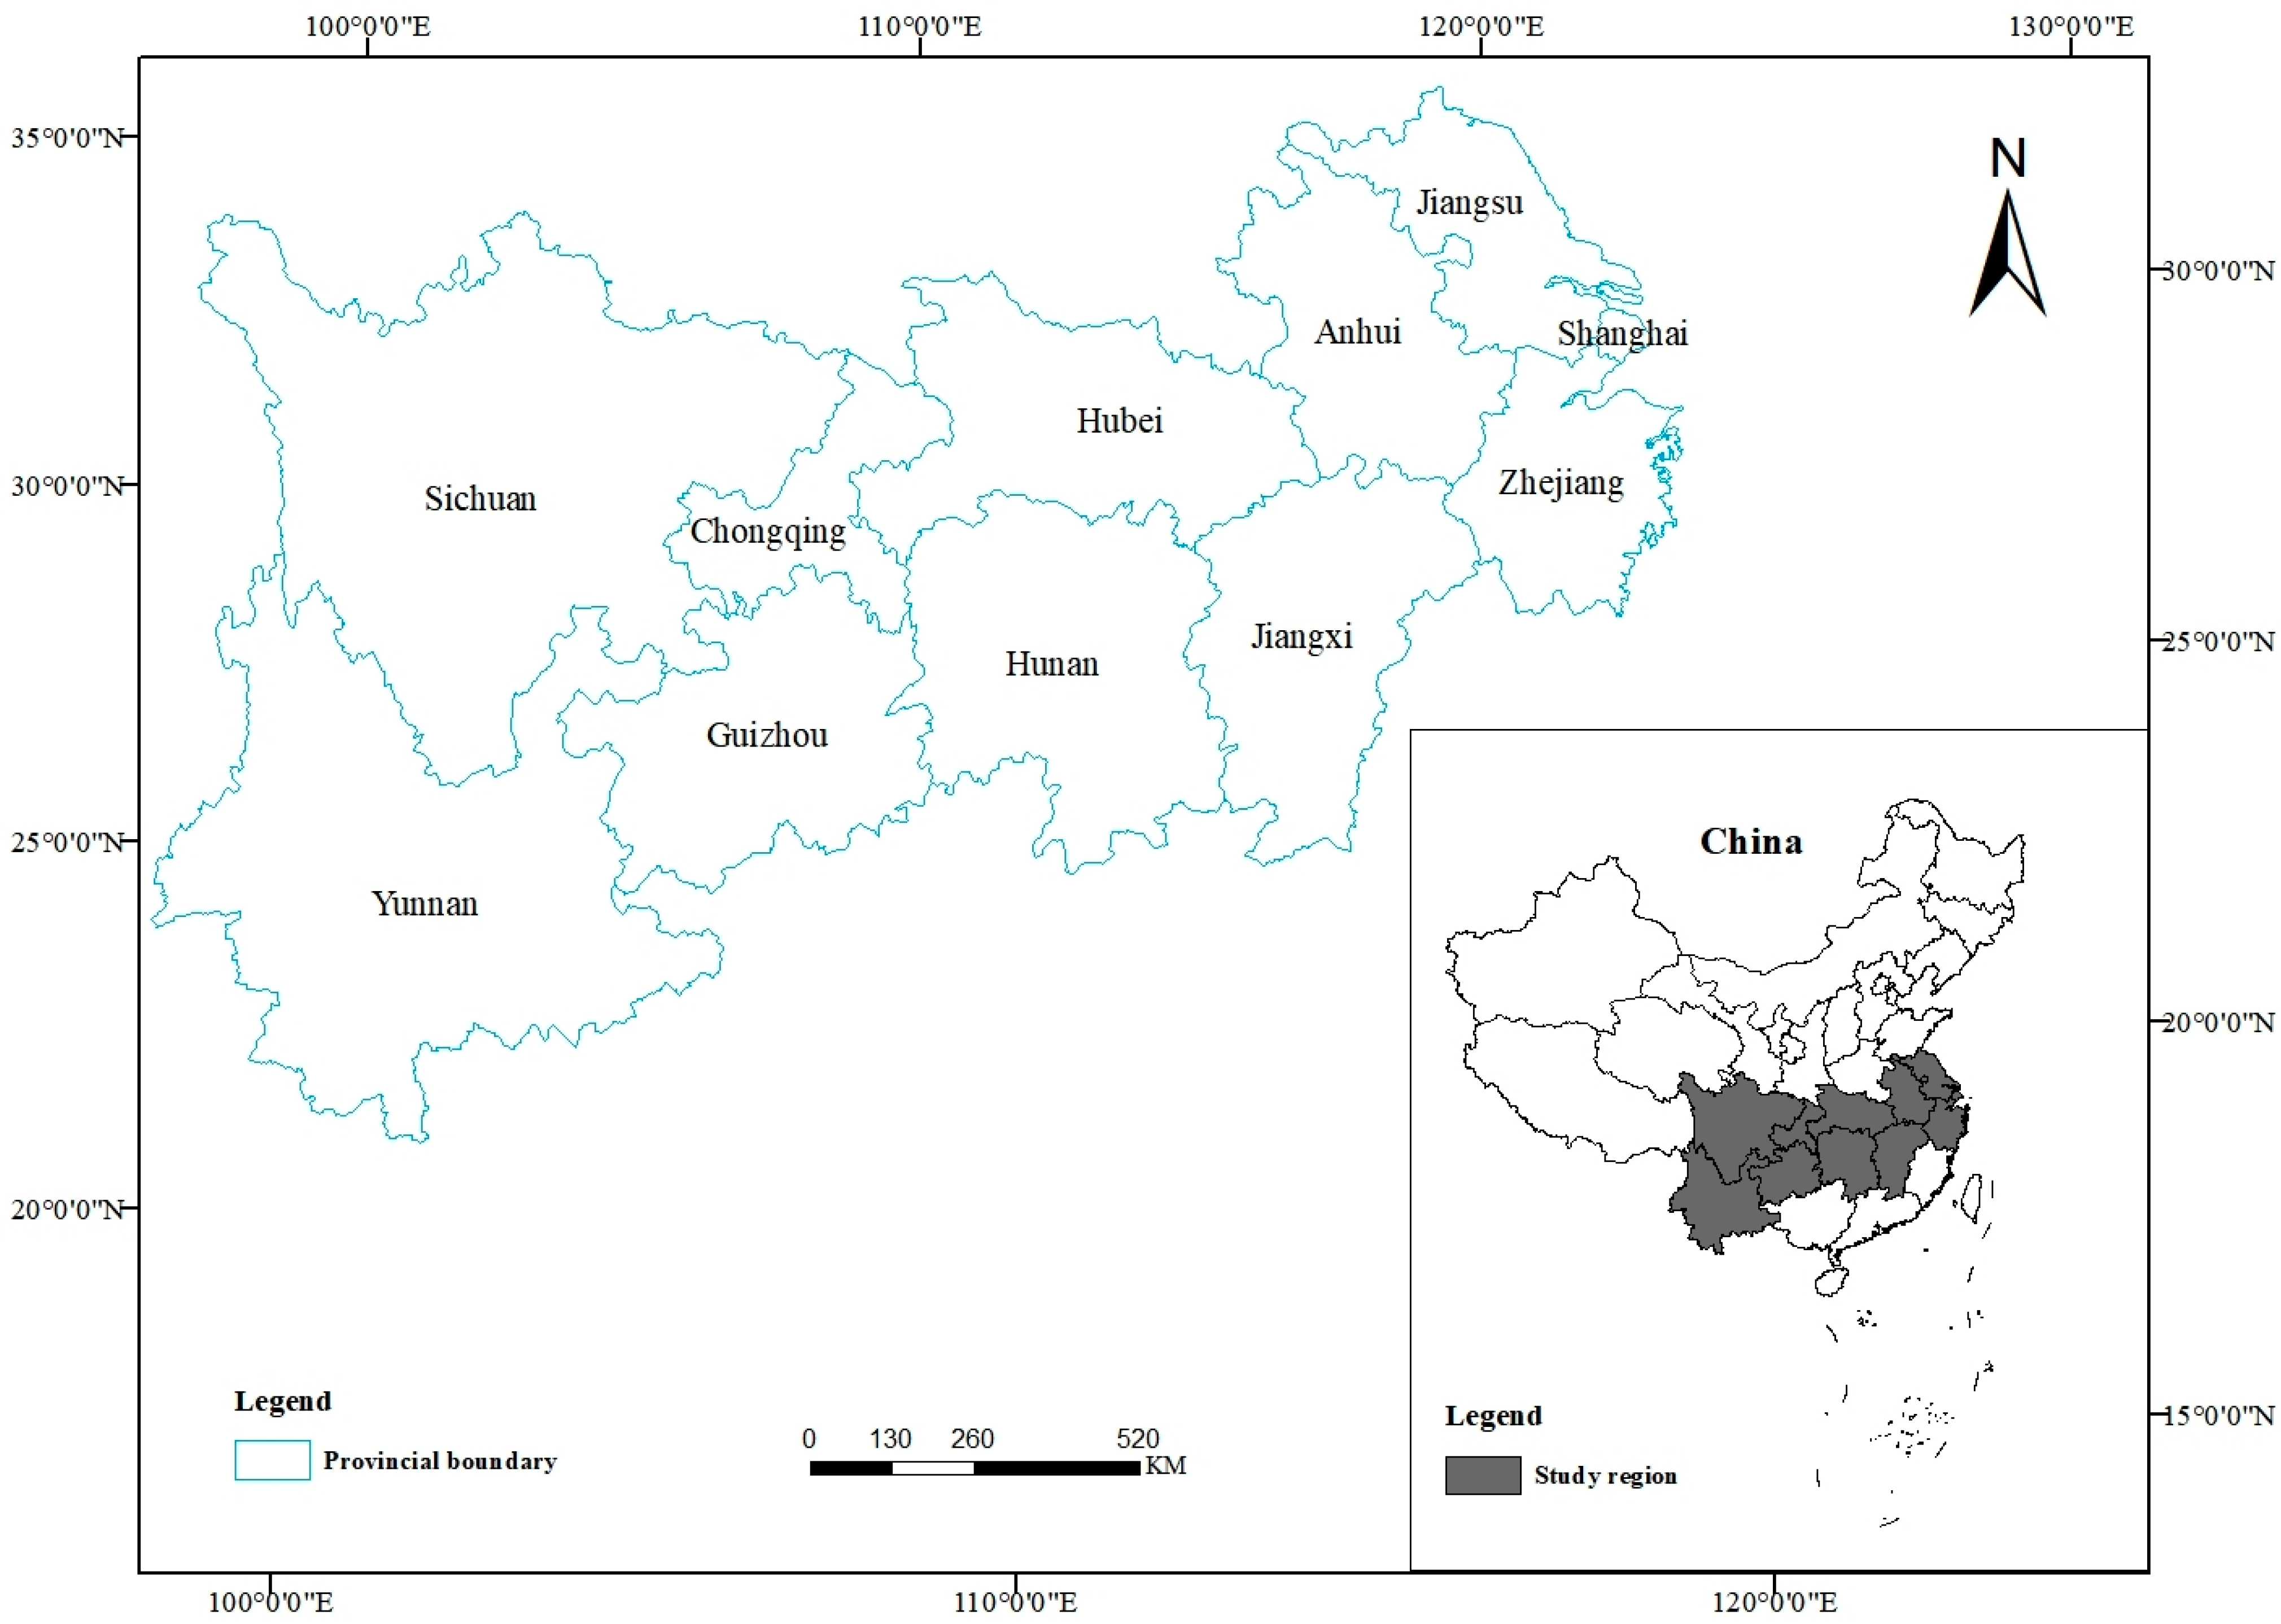
The capability of the logistics industry to achieve low-carbon development serves as a crucial indicator for assessing the potential of industrial agglomeration and economic growth to embark on a sustainable and healthy development path. Industrial agglomeration injects vigorous impetus into regional economic development by optimizing spatial arrangements of production factors and promoting coordinated and interconnected regional economic growth. However, industrial agglomeration also exerts complex and multidimensional impacts on the low-carbon development of the logistics industry. The robust logistics demand resulting from regional economic development drives the agglomeration of the logistics industry, while the fundamental inputs and material support required for low-carbon logistics development need to be provided by the regional economy. There exists a dialectical unity relationship characterized by mutual constraints and mutual promotion among these three factors. The harmonious integration of these three factors mutually promotes their development, whereas their lack of coordination may constrain them. Therefore, this study selects the Yangtze River Economic Belt as the research area, with the following primary objectives: (1) To measure the coupling coordination status and spatiotemporal distribution pattern among low-carbon logistics, industrial agglomeration, and regional economy. (2) To analyze the spatial correlation pattern of the coupling coordination degree among low-carbon logistics, industrial agglomeration, and regional economy. (3) To investigate the spatiotemporal evolution and differentiation characteristics of the synergy among low-carbon logistics, industrial agglomeration, and regional economy. Through an exploration of the aforementioned issues, this study aims to enhance the understanding of the synergistic relationship between regional logistics decarbonization and economic development. It aims to provide a scientific basis for relevant authorities to formulate policies on low-carbon logistics, industrial agglomeration, and regional economy, promoting the coupled and coordinated development of these three systems. This endeavor contributes to providing a framework for achieving comprehensive, coordinated, and sustainable high-quality development of economies and societies worldwide, thereby offering a Chinese solution for the world.
The structure of the remaining sections is as follows. Section 2 provides a literature review. Section 3 describes the research methods and data. Section 4 analyzes the research findings. Section 5 presents the discussion, while Section 6 delineates the research conclusions and policy recommendations of this study.

2. Literature Review

2.1. The Relationship between Low-Carbon Logistics and Regional Economy

Derived from the concept of low-carbon economy, low-carbon logistics represents a novel theoretical framework. Although there is no standardized definition of low-carbon logistics in domestic and international contexts, a comprehensive review of existing research [5,6,7,8] reveals that it embodies the characteristics of “three lows and one high”, namely, low emissions, low pollution, low energy consumption, and high efficiency, aligning with the principles of a low-carbon economy. The ultimate objective of low-carbon logistics is to achieve a low-carbon economy and facilitate circular, benign, and sustainable economic development. Previous studies have predominantly examined the relationship between logistics and regional economy from a macro-level perspective, indicating a mutually reinforcing dynamic between the two. The logistics industry has made increasingly significant contributions to economic development, while rapid economic growth has also propelled the advancement of the logistics sector. Nguyen et al. analyze the positive impact of logistics factors on the Vietnamese economy, and propose that Vietnam could accelerate the development of its logistics industry through measures such as the development of new warehousing facilities and the establishment of regional logistics centers [9]. Mu et al.’s study indicates that economic development exerts a substantial demand-driven influence on national logistics, whereby regional economic development guides the growth of the corresponding regional logistics industry [10]. However, few studies have explored the relationship between low-carbon logistics and regional economic development at the micro-level of green development. Naderi et al. argue that supply chain managers should prioritize achieving low-carbon development. Otherwise, the high energy consumption and high carbon emissions characteristics of the logistics industry will constrain the sustainable development of the economy [11]. Fei et al. highlight the benefits of introducing circular economic operational models to facilitate the establishment of a green logistics system and promote the sustainable development of the logistics industry [12]. Additionally, Su et al. analyze the interactive effects between rural low-carbon logistics development and rural economic construction in China from 2019 to 2022, uncovering a long-term sustainable relationship between rural low-carbon logistics and economic growth [13].

2.2. The Relationship between Industrial Agglomeration and Regional Economy

The study of industrial agglomeration and regional economic development has attracted significant attention in academia, providing a theoretical foundation for examining the relationship between logistics industry agglomeration and regional economic development. Industrial agglomeration in the logistics sector refers to the concentration of logistics enterprises and related institutions that are interconnected in business activities, forming a group within a specific region. By leveraging geographical and regional economic advantages, these entities integrate various logistics functions to enhance logistics operational efficiency [14]. On one hand, the agglomeration of the logistics industry has an impact on regional economic growth. As early as 2014, the State Council of China pointed out in the Medium and Long-Term Development Plan for the Logistics Industry (2014–2020) that the scaled, concentrated, and intensive development of the logistics industry would promote economic growth and drive regional integration. The impact mechanism of logistics industry agglomeration on regional economic growth is mainly reflected in three aspects: scale effect, spillover effect, and radiation effect. In terms of scale effect, due to the presence of individual “rational actors” and the pursuit of profit maximization by enterprises, related logistics industries can achieve economies of scale through agglomeration. They can share information and infrastructure within the agglomeration area, reduce logistics production costs, and consequently increase the output value of the logistics industry in the region, thereby improving economic benefits [15]. In terms of the radiation effect, the external economies of scale generated by agglomeration attract more new external logistics enterprises to establish their presence, thereby creating a “cumulative circular effect” and radiating to the surrounding areas, strengthening connections and interactions with neighboring regions, and driving the overall economic growth of the entire region [16]. Regarding the spillover effect, firms within the cluster generally exhibit higher development potential and can promote regional economic growth through the spillover effects of capital, knowledge, and technology [17]. On the other hand, regional economies also influence the industrial agglomeration of the logistics industry. Within a certain economic space, logistics serves as a medium for the transportation of production and living materials to achieve the objectives of input and output. Thus, the development of regional economies stimulates the growth of logistics demand. Particularly, during periods of rapid economic development, the phenomenon of “logistics shortage” arises, and the agglomeration of the logistics industry can better address this scarcity [18]. The development of economic globalization has facilitated a substantial reduction in tariffs and transportation costs, leading to an increase in the volume of goods flow. This further necessitates the agglomeration of the logistics industry to meet the continuously growing demand for logistics services [19].

2.3. The Relationship between Industrial Agglomeration and Low-Carbon Logistics

Due to the limited availability of literature directly studying the agglomeration of the logistics industry and low-carbon logistics, this paper indirectly explores the relationship between logistics industry agglomeration and carbon emissions. Existing studies on the impact of logistics industry agglomeration on carbon emissions can be categorized into three viewpoints. Firstly, some argue that the agglomeration of the logistics industry can reduce carbon emissions. Logistics industry agglomeration facilitates the shared utilization of advanced low-carbon technology infrastructure, thereby achieving economies of scale, reducing energy consumption, carbon emission costs, and enhancing energy utilization efficiency [20]. Secondly, others contend that industrial agglomeration in the logistics sector may exacerbate carbon emissions. The congestion effects resulting from industry agglomeration can intensify carbon emissions and lead to diseconomies of scale [21]. Thirdly, some argue that the relationship between logistics industry agglomeration and carbon emissions is difficult to determine. With the continuous agglomeration of the logistics industry, there is an inverted U-shaped relationship between logistics carbon emissions and agglomeration. This reflects that the influence of industrial agglomeration on carbon emissions is mainly determined by factors. Only when the degree of factor agglomeration is appropriate can carbon emissions be effectively reduced [22]. Regarding the impact of low-carbon development in the logistics industry on carbon emissions, the introduction of relevant policies and institutions favorable to low-carbon development encourages enterprises to accelerate technological innovation, improve production cleanliness, and promote industrial agglomeration through the “cost sharing effect” and “innovation compensation effect” generated by pollution control expenditures. This collectively enhances industrial efficiency [23]. However, policies and regulations should be appropriately balanced in governing the development of low-carbon logistics. Otherwise, cost factors may lead to the outward relocation of enterprises with significant carbon emissions, thereby affecting the level of agglomeration in the regional logistics industry [24].
The aforementioned studies have, respectively, unveiled the intrinsic mechanisms within the “low-carbon logistics–regional economy,” “industrial agglomeration–regional economy,” and “low-carbon logistics–regional economy” subsystems. These findings provide a theoretical foundation for enhancing logistics efficiency and fostering regional economic development. Building upon this research foundation, this study considers “low-carbon logistics–industrial agglomeration–regional economy” as an integrated whole and constructs a corresponding evaluation indicator system. Utilizing panel data from the period 2006–2020, a measurement of the comprehensive development levels of low-carbon logistics, industrial agglomeration, and regional economy is conducted to understand the development status of each system. On this basis, the study first employs a coupling coordination model to analyze the coupling coordination levels of the three systems, with the aim of investigating the current state of coordinated development among these three systems within the Yangtze River Economic Belt. Secondly, a spatial autocorrelation model is used to further analyze whether there are spatial correlation characteristics in the coupling coordination of the three systems from a static perspective, aiming for a more comprehensive and multidimensional exploration of the spatial relationships in the coordinated development of the three systems within the Yangtze River Economic Belt. Finally, a standard deviation ellipse model is utilized to analyze the spatiotemporal evolution characteristics of the coupling coordination of the three systems from a dynamic perspective. This is conducted with the intention of elucidating the development pattern of the coordinated development among the three systems within the Yangtze River Economic Belt during the research period. These findings will contribute to providing relevant insights for policy recommendations.

3. Materials and Methods

3.1. Study Area

The Yangtze River Economic Belt spans across the eastern, central, and western regions of China, covering nine provinces and two municipalities (Figure 1). It is the longest and widest economic belt in China, exerting the most significant influence, making it a key component of the spatial economic strategy. The central leadership has repeatedly emphasized the strategic positioning of ecological priority and green development for the Yangtze River Economic Belt. As a leading demonstration zone for national ecological civilization construction, the Yangtze River Economic Belt bears the significant mission of achieving carbon peaking and carbon neutrality, as well as the important task of economic and social green transformation. With the support of the Yangtze River as a crucial waterway and the coordinated development of the regional economy, the logistics industry has become an advantageous industry in the Yangtze River Economic Belt, making substantial contributions to the regional economy [25]. Furthermore, this region, accounting for 21.35% of the national land area, generates approximately 40% of the country’s logistics industry value added, indicating a prominent logistics agglomeration effect in the Yangtze River Economic Belt, with strong radiation capabilities [26]. This plays a crucial role in promoting interconnectivity among regions and serves as a catalyst for spatial economic development in the Yangtze River Economic Belt. However, the logistics sector in the Yangtze River Economic Belt has not fully achieved a transformation in its development model, as energy consumption and carbon emissions remain at relatively high levels [27], resulting in a series of environmental issues that contradict the strategic positioning of ecological priority and green development in the region. Therefore, exploring the coupling coordination relationship among low-carbon logistics, industrial agglomeration, and the regional economy in the Yangtze River Economic Belt is of paramount importance in determining the future development direction and formulating relevant development strategies for the region.

3.2. Indicators Selection

The evaluation indicator system for low-carbon logistics is presented in Table 1. Considering the availability of data and the fact that transportation, warehousing, and postal services account for over 85% of the value added in the logistics industry, alternative data from these sectors can be used. Based on Western economic theories, input indicators are selected from four aspects: labor, material, capital, and energy. The labor force is the main driver of value creation in the logistics industry, and the number of employed personnel in the logistics sector is chosen as the measure of labor input [28]. Fixed asset investment is an essential resource for the industry’s operations and is considered as a factor of capital input [29]. Taking into account the impact of price factors, the study uses the 2006 base year and adjusts the fixed asset investment using the Consumer Price Index to account for inflation. Transportation route mileage reflects the scale of regional logistics networks and serves as crucial infrastructure for logistics transportation [30]. Since railways, highways, and waterways account for 98% of China’s freight transport volume, the study selects the total length of railway, highway, and waterway routes as the overall transport route length for each region. Finally, considering the quality of logistics industry development, energy consumption is included as an input indicator. Referring to the studies by Cao et al. and Li et al., six types of energy sources with significant consumption proportions in the Yangtze River Economic Belt are selected (raw coal, gasoline, kerosene, diesel, fuel oil, and natural gas), and their consumption is converted into standard coal consumption using the respective standard coal conversion coefficients [31,32]. Output indicators are divided into expected and unexpected outputs. In the expected outputs, logistics industry value added is considered as an economic output, and freight turnover is regarded as a scale output [33,34]. The logistics industry value added is also adjusted using the 2006 base year. Regarding unexpected output, the carbon emissions of the logistics industry, calculated based on the IPCC carbon emission coefficient method, are considered as the unexpected output [7,35]. The calculation formula is as follows:
Q = i = 1 6 A i × B i × D i
In this context, Q represents the CO2 emissions of the logistics industry, i denotes the energy category, A i stands for the total consumption of the i t h energy source, B i corresponds to the standard coal conversion coefficient for the i t h energy source, and D i represents the carbon emission coefficient for the i t h energy source. The corresponding coefficients were referenced from the 2006 IPCC Guidelines for National Greenhouse Gas Inventories and the annual China Energy Statistical Yearbook.
Regarding the measurement of industrial agglomeration, different scholars employ various methods. Generally, the methods used to measure industrial agglomeration include location entropy, the spatial Gini coefficient, E-G index, Herfindahl coefficient, etc. [36]. To eliminate the differences in scale among logistics industries in different provinces and cities, objectively analyze the level of agglomeration, and consider data availability, this study draws on relevant research on the measurement methods of logistics industry agglomeration [37,38] and adopts the location entropy method to measure the degree of agglomeration in the logistics industry. The calculation formula is as follows:
L Q i t = e i t E i t / e t E t
In the equation, L Q i t represents the agglomeration level of the logistics industry in region i during time period t . e i t and E i t , respectively, represent the employment in the logistics industry in region i and nationwide during time period t , while e t and E t represent the total employment in all industries in region i and nationwide during time period t . The employment in the logistics industry is represented using relevant data from transportation, warehousing, and postal services.
Regional economy is a comprehensive concept, and the sustainable development of a regional economy is not only reflected in the quantity of economic growth but also in the improvement of economic efficiency and the optimization of economic structure. Therefore, this study refers to the research findings of relevant scholars [39,40,41] and selects 11 indicators in terms of economic scale, economic efficiency, and economic structure to measure the development status of regional economy, and utilizes the entropy evaluation method to assess its overall development level. The evaluation index system of the regional economy and the weights of the indicators calculated using the entropy evaluation method are presented in Table 2.

3.3. Data Source

This study utilizes panel data from 11 provinces and cities in the Yangtze River Economic Belt for the years 2006–2020. The data sources include the relevant year’s China Statistical Yearbook, China Energy Statistical Yearbook, China Population and Employment Statistical Yearbook, China Tertiary Industry Statistical Yearbook, statistical yearbooks of the 11 provinces and cities in the Yangtze River Economic Belt, statistical bulletins of the national economic and social development, and the China Economic and Social Big Data Research Platform.

3.4. Research Methods

3.4.1. Super-Efficiency SBM Model Considering Undesired Output

The SBM model, proposed by Tone in 2001, is a non-radial and non-angular efficiency measurement method based on slack variables [42]. It overcomes the limitation of traditional DEA models in neglecting the slack variables in input–output analysis. Furthermore, Tone (2002) developed the super-efficiency SBM model to address the issue of distinguishing and ranking decision making units with efficiency values of 1 [43]. However, this model does not consider undesired outputs. To address this, Tone further proposed an SBM model that incorporates undesired outputs [44]. Therefore, this study refers to existing research and selects the super-efficiency SBM model based on undesired outputs to measure the efficiency of low-carbon logistics [45,46]. The model is as follows:
min ρ = 1 + 1 m i = 1 m s i / x i 0 1 1 q 1 + q 2 ( r = 1 q 1 s r + / y r 0 + t = 1 q 2 s t b / b t 0 ) s . t { j = 1 n x j λ j s x 0 ( i = 1 , , m ) j = 1 n y j λ j + s + y 0 ( r = 1 , , q 1 ) j = 1 n b j λ j s b b 0 ( t = 1 , , q 2 ) 1 1 q 1 + q 2 ( r = 1 q 1 s r + / y r 0 + t = 1 q 2 s t b / b t 0 ) 0 λ j , s i , s r + , s t b 0 ( j = 1 , , n , j j 0 )
In this instance, n represents the number of decision making units; j represents the individual decision making units; m , q 1 , and q 2 represent the number of inputs, desirable outputs, and undesired outputs, respectively; and s i , s r + , and s t b represent the slack variables of inputs, desirable outputs, and undesired outputs, respectively.

3.4.2. Coupling Coordination Degree Model

Coupling refers to the phenomenon in which two or more systems interact and mutually influence each other to achieve synergy [47]. Coupling degree measures the strength of such synergistic relationships, and coupling coordination degree further reflects the level of coordinated development between systems. It has been widely applied to measure the coordinated development of different systems, such as economic development, industrial structure, ecological environment, and technological innovation [48]. In this study, a coupling coordination model is employed to measure the coupling coordination relationship among low-carbon logistics, industrial agglomeration, and regional economy. The calculation method is as follows:
C = { U 1 × U 2 × U 3 ( U 1 + U 2 + U 3 3 ) 3 } 1 / 3
T = α U 1 + β U 2 + λ U 3
D = T × C
In the equation, C represents the coupling degree among low-carbon logistics, industrial agglomeration, and regional economy. U 1 , U 2 , and U 3 , respectively, denote the low-carbon logistics efficiency, industrial agglomeration level, and regional economic development level. T represents the comprehensive evaluation index of the three systems as a whole. α , β , and λ are undetermined coefficients for the low-carbon logistics, industrial agglomeration, and regional economic systems. Following the study by Chen et al. [49], they are set as α = β = λ = 1/3. D represents the coupling coordination degree among the three systems. Referring to the classification of coupling coordination degree levels by Lu et al. [50], this study divides the coupling coordination degree into 10 levels, as detailed in Table 3.

3.4.3. Spatial Autocorrelation

Spatial autocorrelation, as a spatial statistical method, takes into account the spatial dependence within geographic data. It intuitively reflects the distribution of coupling coordination degrees in space and assesses their spatial clustering characteristics [51]. Spatial autocorrelation analysis is divided into global and local spatial autocorrelation. Global spatial autocorrelation is typically used to examine whether a certain attribute value of the research subject exhibits spatial clustering in the overall space, and it is calculated using Equation (7). When I > 0, it indicates the presence of spatial clustering and positive correlation. When I < 0, it indicates spatial dispersion and negative correlation. When I = 0, it indicates the absence of spatial correlation. The global Moran’s I reflects the overall spatial association of attribute values in the study area. However, to further explore the heterogeneity characteristics of local regions, local spatial autocorrelation analysis is required, and it is calculated using Equation (8).
I = i = 1 n j = 1 n ω i j ( x i x ¯ ) ( x j x ¯ ) S 2 i = 1 n j = 1 n ω i j
I i = x i x ¯ S 2 j = 1 n [ ω i j ( x i x ¯ ) ]
In the equation, n represents the number of provincial regions, x i and x j are the observed values of the spatial units, x ¯ is the sample mean, S 2 is the sample variance, and ω i j denotes the spatial weights.

3.4.4. Standard Deviation Ellipse Model

The standard deviation ellipse model is a classic spatial statistical method that accurately captures the distribution characteristics and movement trajectories of elements within a certain spatial domain. It utilizes the distribution features of the long and short axes of an ellipse, as well as the center of gravity, to describe the overall spatial characteristics of the region. The long and short axes represent the degree of dispersion, while the center of gravity indicates the relative position. The calculation equation is provided below:
X ¯ W = i = 1 n ω i x i i = 1 n ω i , Y ¯ W = i = 1 n ω i y i i = 1 n ω i
tan θ = [ ( i = 1 n ω i 2 x ˜ i 2 i = 1 n ω i 2 y ˜ i 2 ) + s q r t ( ( i = 1 n ω i 2 x ˜ i 2 i = 1 n ω i 2 y ˜ i 2 ) 2 + 4 ( i = 1 n ω i 2 x i ˜ y ˜ i ) 2 ) ] 2 i = 1 n ω i 2 x i ˜ y ˜ i
σ x = i = 1 n ( ω i x ˜ i cos θ ω i y ˜ i sin θ ) i = 1 n ω i 2 2
σ y = i = 1 n ( ω i x ˜ i sin θ ω i y ˜ i cos θ ) i = 1 n ω i 2 2
In the equation, x i , y i represents the spatial coordinates of the research subject. ω i denotes the weight at spatial element i . X ¯ W and Y ¯ W refer to the center point coordinates of the standard deviation ellipse. x ˜ i and y ˜ i represent the deviation of the study object’s spatial coordinates from the average center. θ is the azimuth of the ellipse. σ x and σ y signify the standard deviations of the long and short axes of the ellipse, respectively.

4. Results

The research findings of this study are as follows. Section 4.1 and 4.2 present the temporal and spatial distribution characteristics of the coupling and coordination status of the three systems based on the coupling coordination model. Section 4.3 provides the spatial correlation results of the coupling and coordination status of the three systems based on spatial autocorrelation analysis. Section 4.4 outlines the spatiotemporal evolution characteristics of the coupling and coordination status of the three systems based on the standard deviation ellipse model.

4.1. Coupling Coordination Temporal Analysis

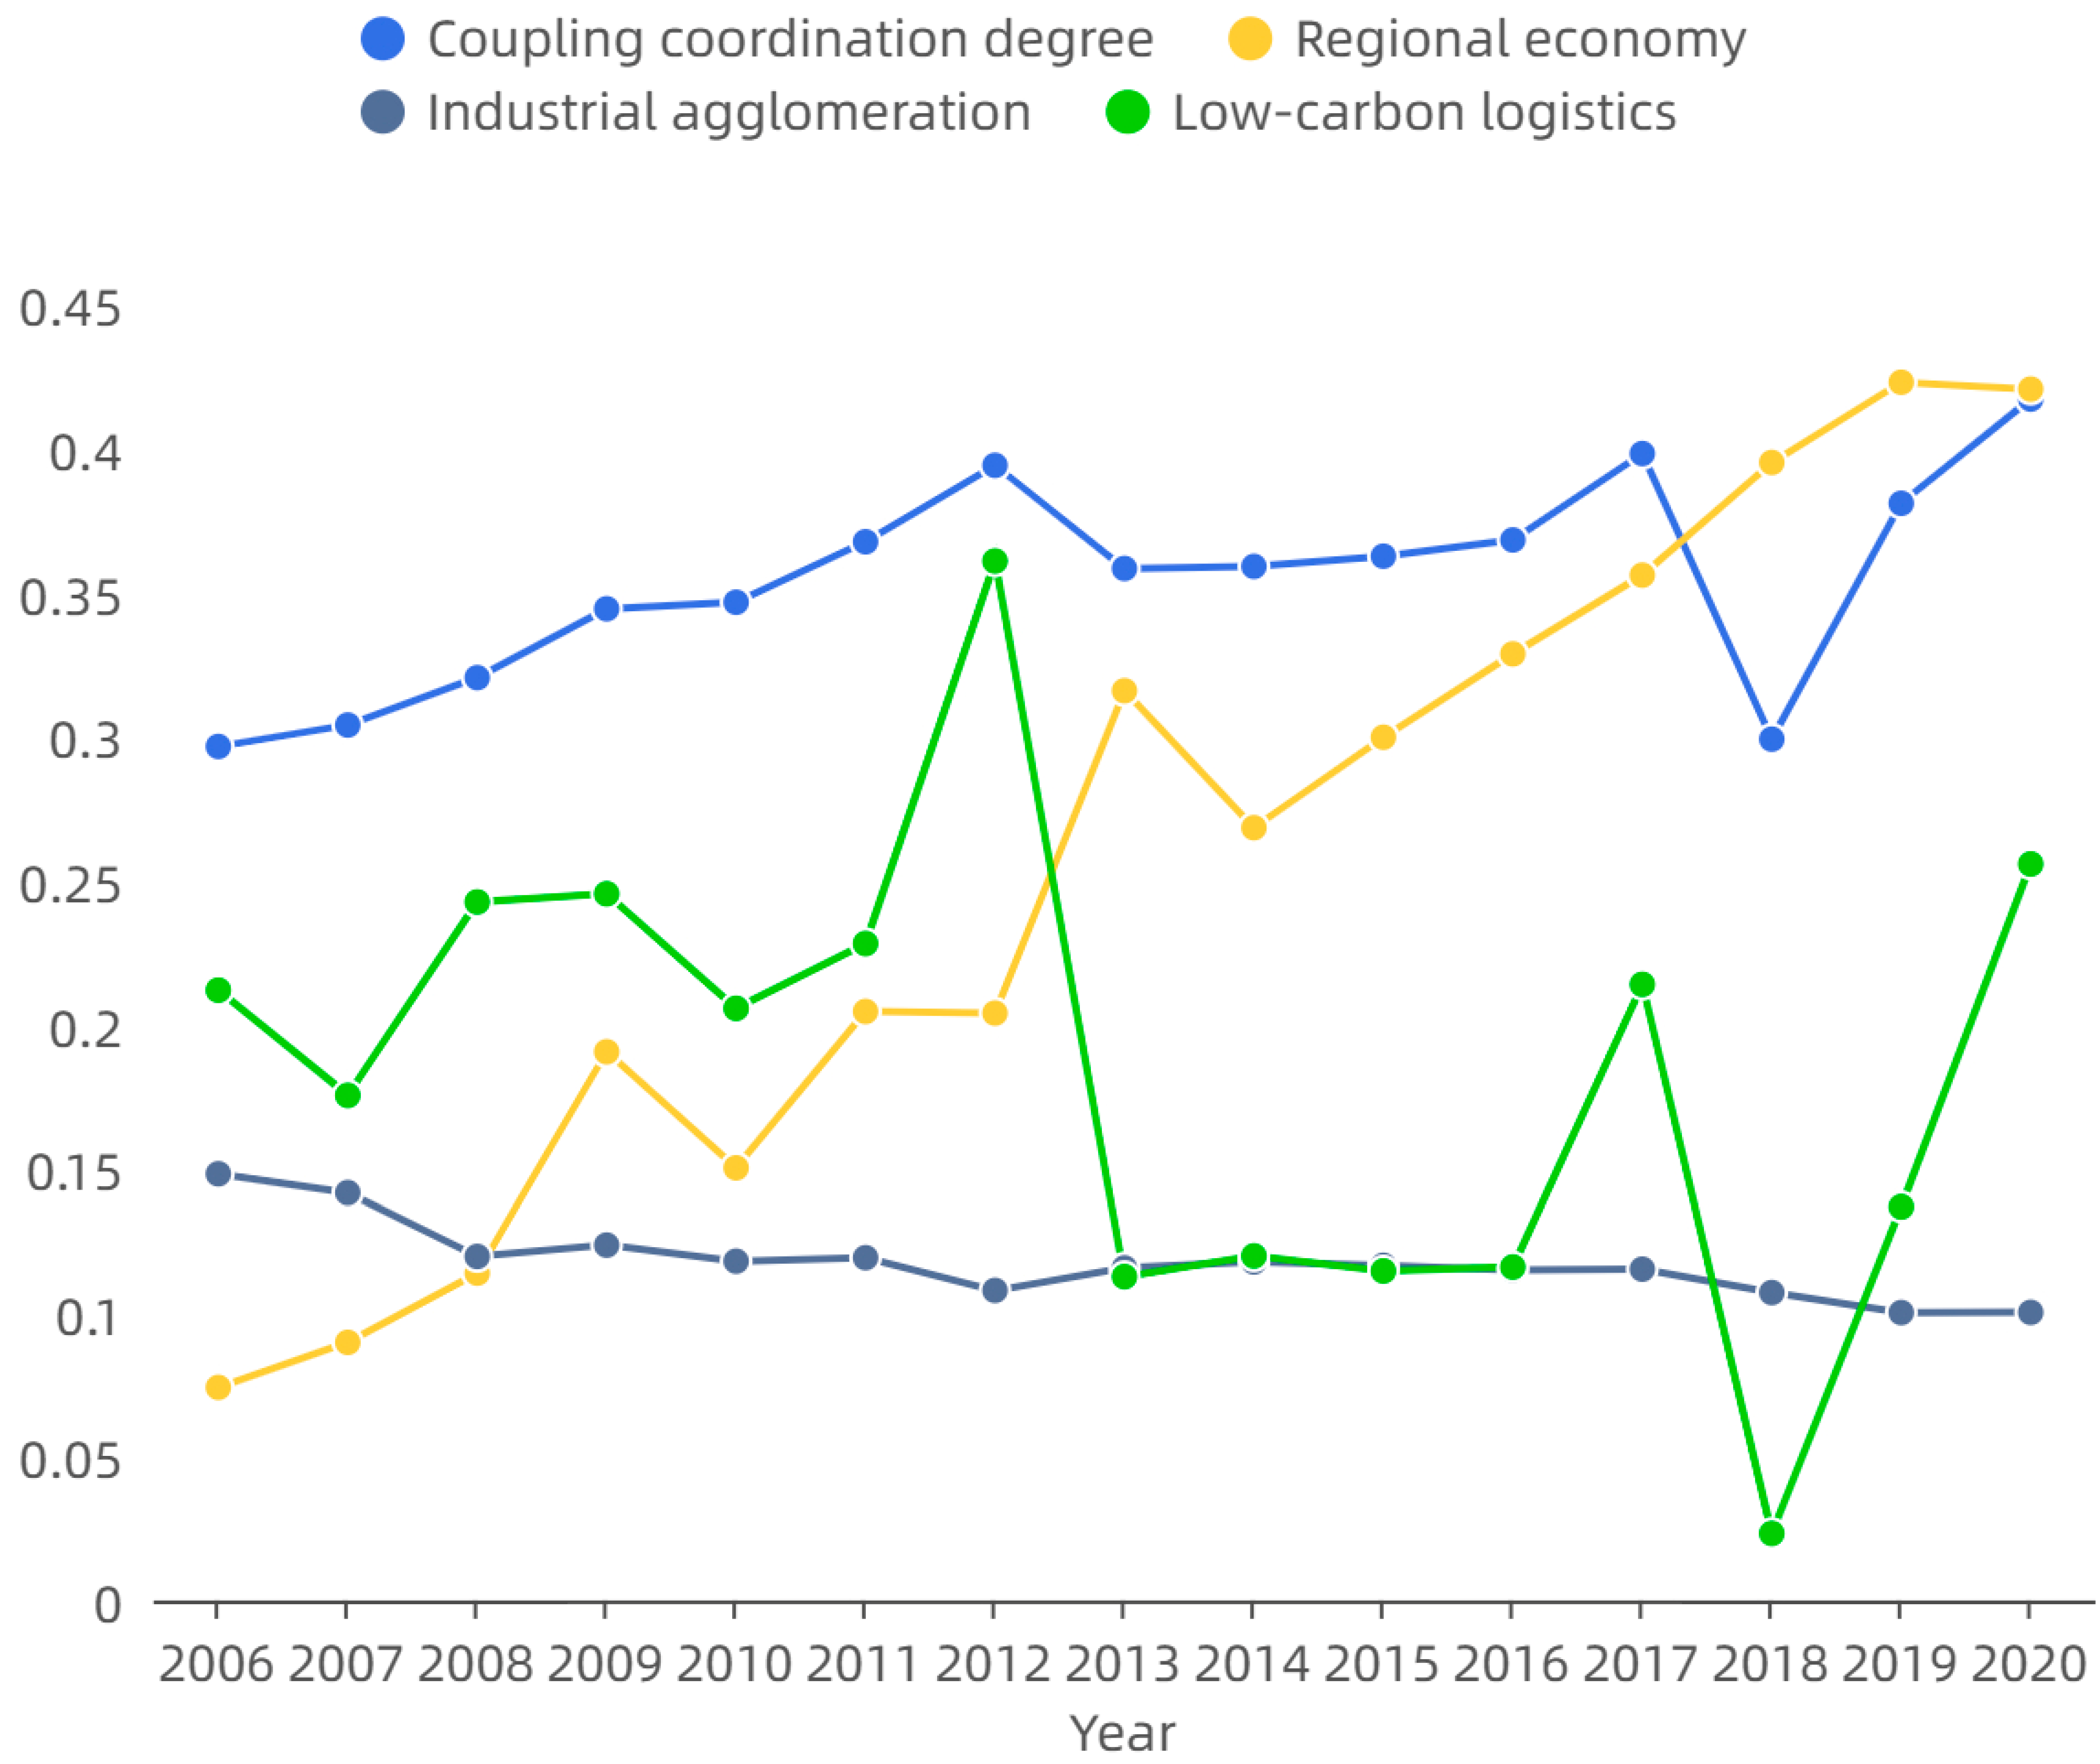
After calculating the comprehensive evaluation values of low-carbon logistics, industrial agglomeration, and regional economy using the panel data from 11 provinces and cities in the Yangtze River Economic Belt for the years 2006–2020, the study further computed the coupling coordination among the three systems using a coupling coordination model. As shown in Figure 2, the overall coupling coordination among the three systems exhibits a fluctuating upward trend. According to the data in Table 4, the average coupling coordination among the three systems in the Yangtze River Economic Belt increased from 0.296 to 0.417 during the period 2006–2020, transitioning from the moderate disorder stage to the verge of disorder stage. This indicates that although the overall trend of coupling coordination is increasing, the degree of coordination is still not high, suggesting that there is still significant potential for system optimization. From the perspective of temporal evolution, the development of coupling coordination can be divided into the following five stages.
The first stage, from 2006 to 2012, witnessed a steady increase in the coupling coordination among the three systems, indicating a relatively harmonious development between the logistics industry and ecological environmental protection in the Yangtze River Economic Belt during the study period. The interconnections among subsystems gradually strengthened, enabling synergistic effects within the system. Particularly in 2011, as the starting year of the 12th Five-Year Plan, the concept of green and low-carbon development was emphasized, making energy conservation and emission reduction a regional development priority. Guided by this concept, on the one hand, strict energy management is implemented, with clearly defined total control objectives and an implementation mechanism. On the other hand, afforestation projects are promoted, and the development and application of low-carbon technologies are accelerated, thereby significantly reducing carbon emissions intensity, enhancing the operational efficiency of regional logistics, and meeting the requirements of sustainable development. Between 2011 and 2012, the development of low-carbon logistics was robust, achieving a record growth rate, which led to the coupling coordination among the three systems reaching its first peak in 2012.
The second stage, from 2012 to 2013, witnessed a significant decline in the coupling coordination data. Generally, the development level of subsystems is related to the overall level of coupling coordination within the system. During this stage, regional economic development surged, with a noticeable increase in the growth rate, while industrial agglomeration achieved growth after nearly six years of stagnation. In contrast, the development of green logistics was lagging, reaching its lowest point since 2006 in 2013. This indicates that rapid economic expansion resulted in a significant increase in logistics output and the rapid concentration of the logistics industry in the short term, leading to increased energy demand and a sharp rise in carbon dioxide emissions. As a result, the three systems were in a disordered state, and the level of coordinated development was reduced.
The third stage, from 2014 to 2017, witnessed a steady improvement in the coupling coordination among the three systems, thanks to the medium- and long-term development plan proposed for the logistics industry in 2014. The plan explicitly called for the establishment of a well-structured, environmentally friendly modern logistics service system. It emphasized both the optimization of transportation structures and the application of environmentally friendly technologies to promote green logistics. Furthermore, it stressed the development of advanced logistics organization models such as multimodal transportation and shared delivery to further illustrate the benefits of logistics agglomeration development. This played a crucial role in enhancing the overall operational efficiency of logistics, strengthening the close connection between low-carbon logistics, industrial agglomeration, and regional economy. It harnessed synergies between these systems, thereby promoting the sustainable development of the regional economy and society.
The fourth stage, from 2017 to 2018, witnessed a moderate disorder among the systems. This was influenced by the international situation at the time. According to the International Energy Agency’s Global Energy and CO2 Status Report, from 2014 to 2016, despite continued global economic expansion, global CO2 emissions did not increase. However, in 2017 and 2018, the situation changed, as energy production efficiency could no longer meet the demands of sustained economic growth, and the development of low-carbon energy was insufficient to meet the growing energy needs. As a result, there was a significant increase in carbon dioxide emissions. By 2018, global CO2 emissions from energy consumption reached the highest historical level, exceeding the average growth rate since 2010 by 70%. Moreover, 85% of the carbon emissions increment came from China, India, and the United States, leading to lower coupling coordination among the three systems in 2018.
The fifth stage, from 2018 to 2020, witnessed a substantial increase in the coupling coordination among the three systems, which was closely related to the convening of the Yangtze River Economic Belt Development Symposium in 2018. During the symposium, Chinese leaders emphasized the need for “promoting well-coordinated environmental conservation and avoiding excessive development” in the Yangtze River Economic Belt, and emphasized the importance of “five relationships”, including ecological environmental protection and economic development. This represents a strategic guide specifically addressing the sustainable development of the Yangtze River Economic Belt, as the ecological environment in this region has been deteriorating. The importance of ecological conservation in the Yangtze River basin has reached unprecedented levels. Government departments, businesses of logistics industry, and individual citizens have all reevaluated the relationship between economic development and environmental protection. This is a key factor in achieving a significant leap in the coordination of the three systems after 2018.

4.2. Spatial Analysis of Coupling Coordination

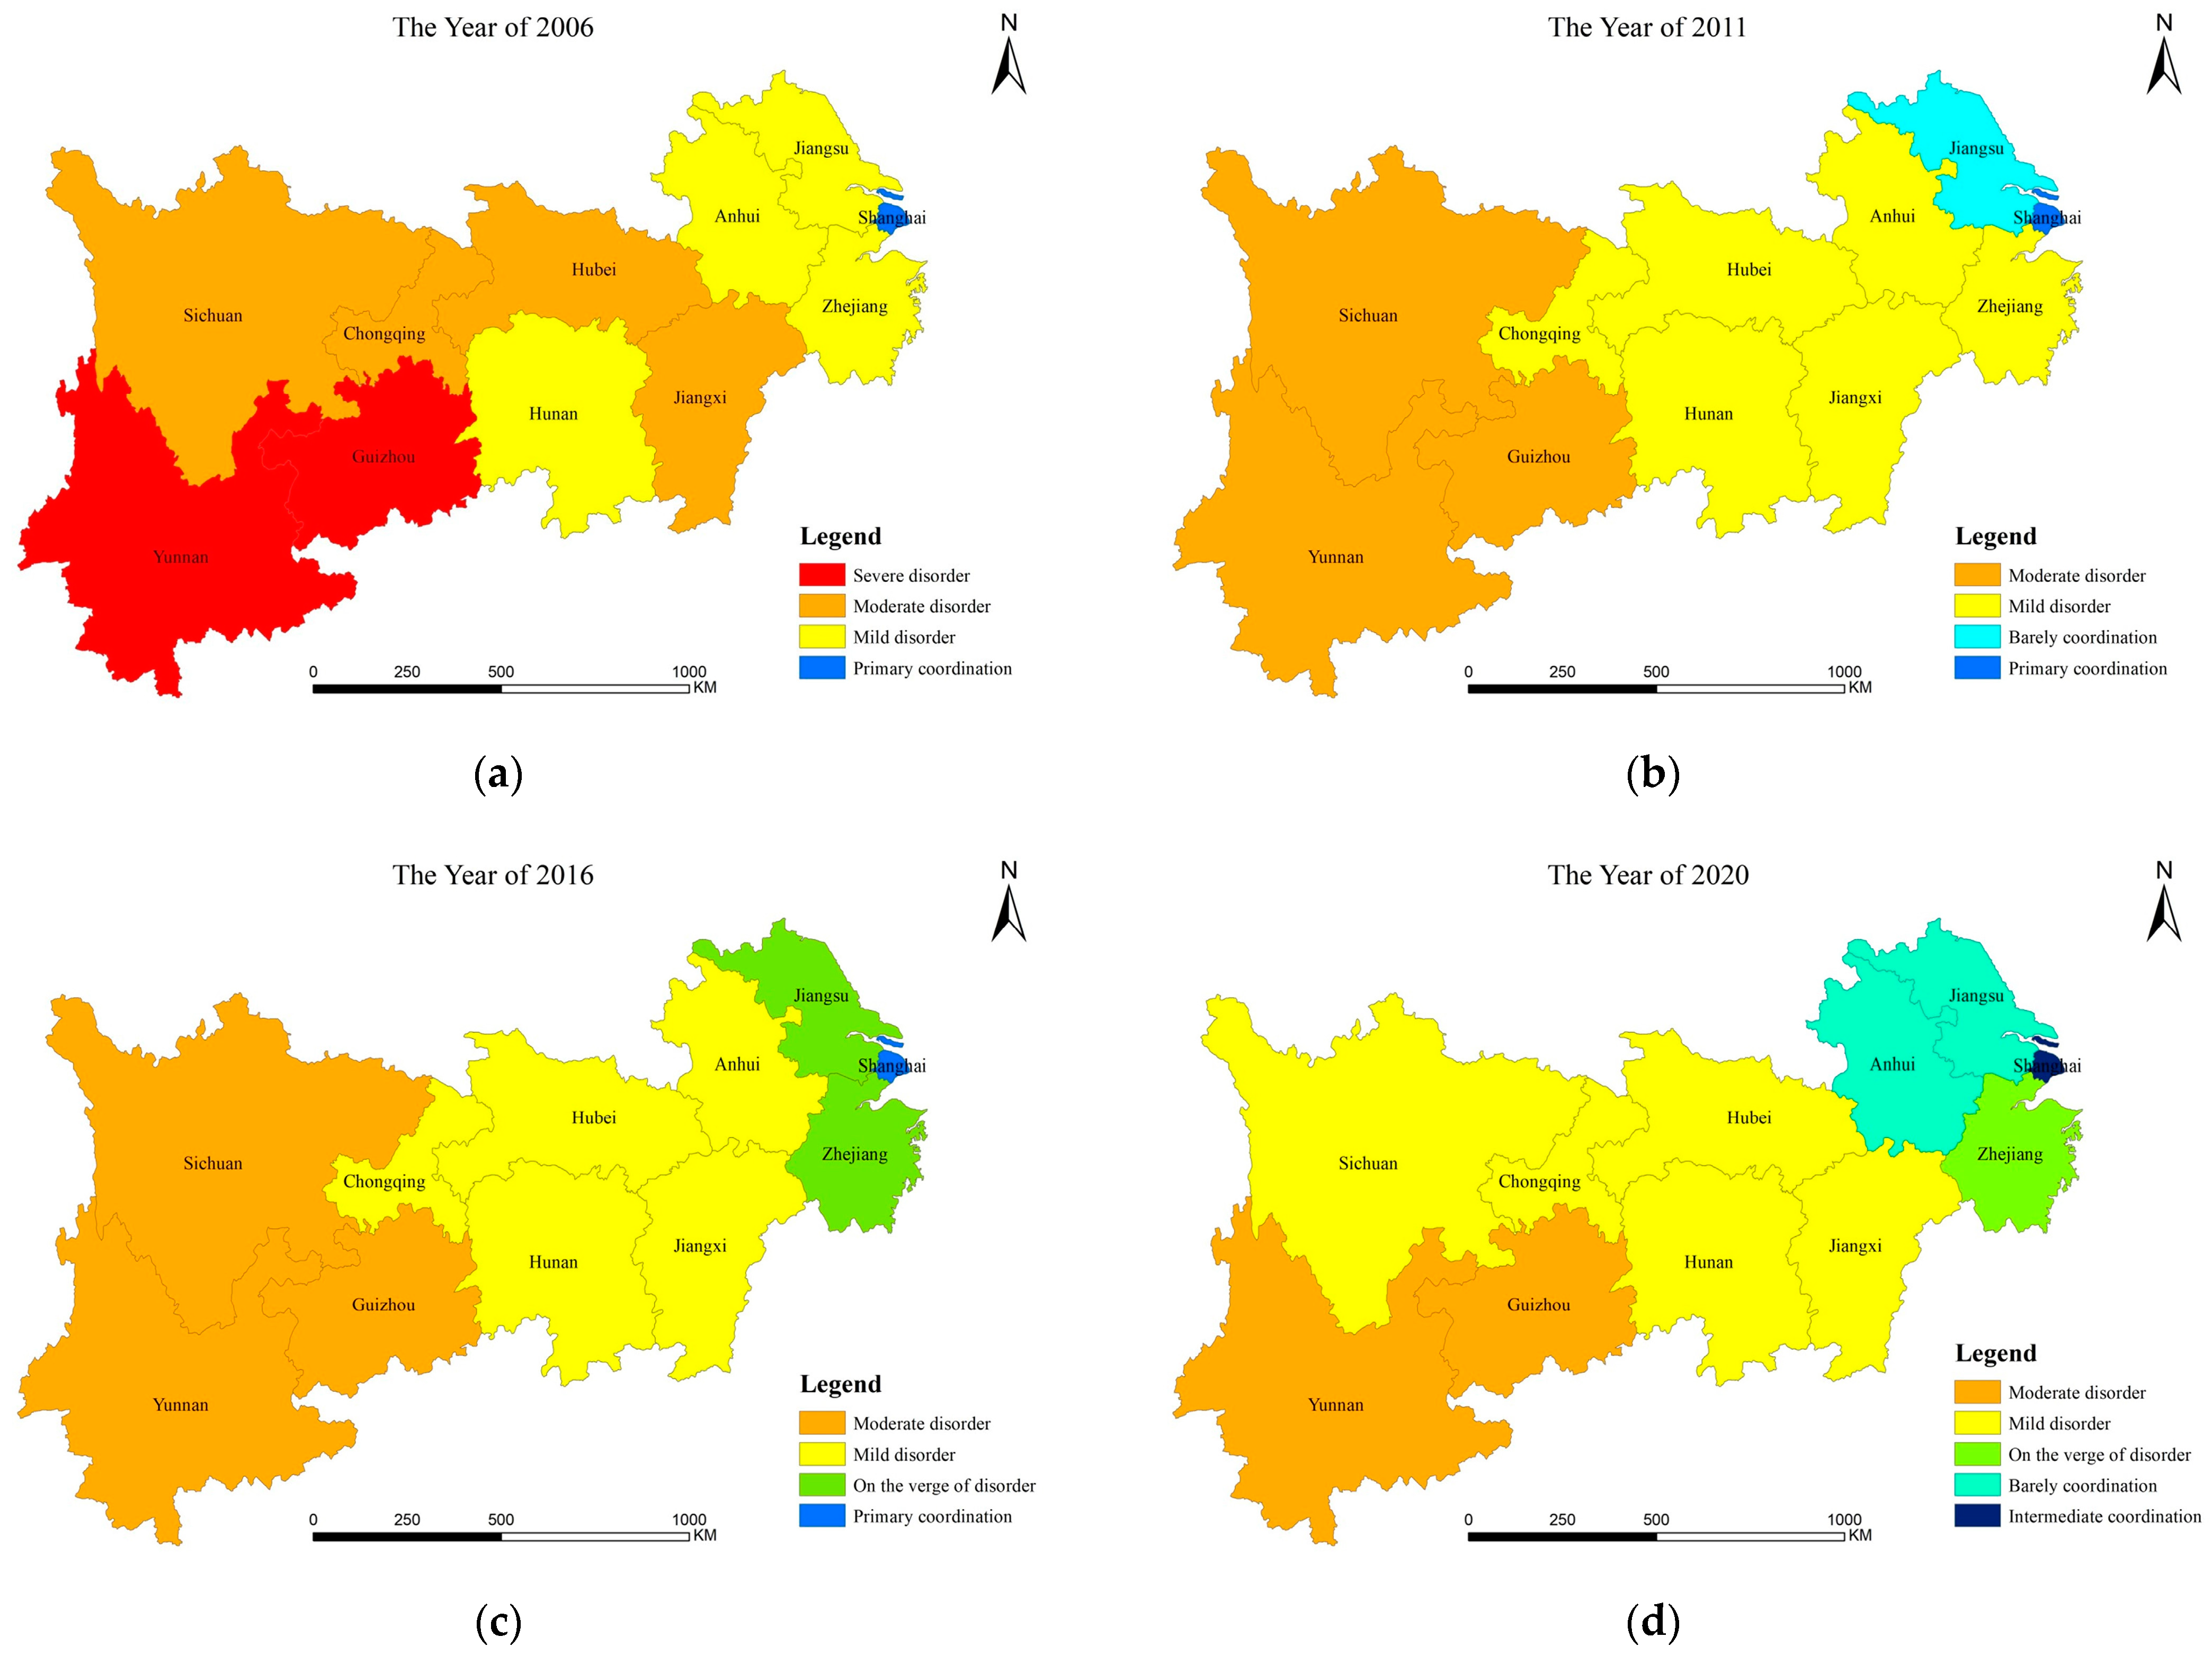
In order to explore the spatial differentiation characteristics of the coupling coordination among the “low-carbon logistics–industrial agglomeration–regional economy” system in the Yangtze River Economic Belt, this study utilizes the calculation results and classification standards to create spatial distribution maps of coupling coordination for the years 2006, 2011, 2016, and 2020 (Figure 3). By doing so, an analysis of the spatial distribution patterns of coupling coordination among the three major systems can be conducted.
In terms of the distribution of coupling coordination levels, the proportions of moderate and mild disorder combined in 2006, 2011, 2016, and 2020 were 72.7%, 81.8%, 72.7%, and 63.6%, respectively. In addition, in 2006, there were two provinces with a severe disorder in coupling coordination. By 2020, only Shanghai, Anhui, and Jiangsu had achieved a coordinated level, while the rest of the provinces and cities remained in a dislocated state. This indicates that the coupling coordination of the three major systems in most provinces and cities in the Yangtze River Economic Belt is at a mild or moderate disorder level. The state of industrial agglomeration has not reached the desired level, and the development of the logistics industry has not completely moved away from an extensive development model. The pressure of carbon emissions remains high, and the coordination of development among systems needs further improvement.
In terms of the spatial distribution pattern of coupling coordination, there are significant regional differences in the development of the low-carbon logistics–industrial agglomeration–regional economy coupling coordination in the Yangtze River Economic Belt. Except for Anhui, during the period of 2006–2020, the coupling coordination values of the downstream provinces and cities in the Yangtze River Economic Belt (Shanghai, Jiangsu, Zhejiang) were higher than the average value for the same period. However, the coupling coordination values of the middle and upper reaches of provinces and cities of the Yangtze River were generally lower than the average value for the same period in most years, indicating a noticeable gap compared to the downstream region. This pattern is similar to the spatial characteristics of regional economic development, indicating a certain correlation between the development status of subsystems and the coupling coordination of the composite system. Taking Shanghai as an example, it has relied on its favorable economic development and locational advantages, with prominent technological advancements, to drive the rational development of industrial layout and orderly low-carbon governance. It has transitioned from initial primary coordination to intermediate coordination, leading to upgraded development of coupling coordination in neighboring provinces such as Jiangsu and Zhejiang through economic radiation and technology spillover. Additionally, the standard deviation of the coupling coordination index among the 11 provinces and cities in the Yangtze River Economic Belt was 0.129 in 2006 and increased to 0.136 in 2020, indicating a slight widening of interprovincial differences in coupling coordination.

4.3. Spatial Autocorrelation Analysis of Coupling Coordination

4.3.1. Global Spatial Autocorrelation Analysis

Using the GeoDA 1.16 software, the global Moran’s I values of coupling coordination for the low-carbon logistics–industrial agglomeration–regional economy in the 11 provinces and cities of the Yangtze River Economic Belt were calculated. The results are presented in 
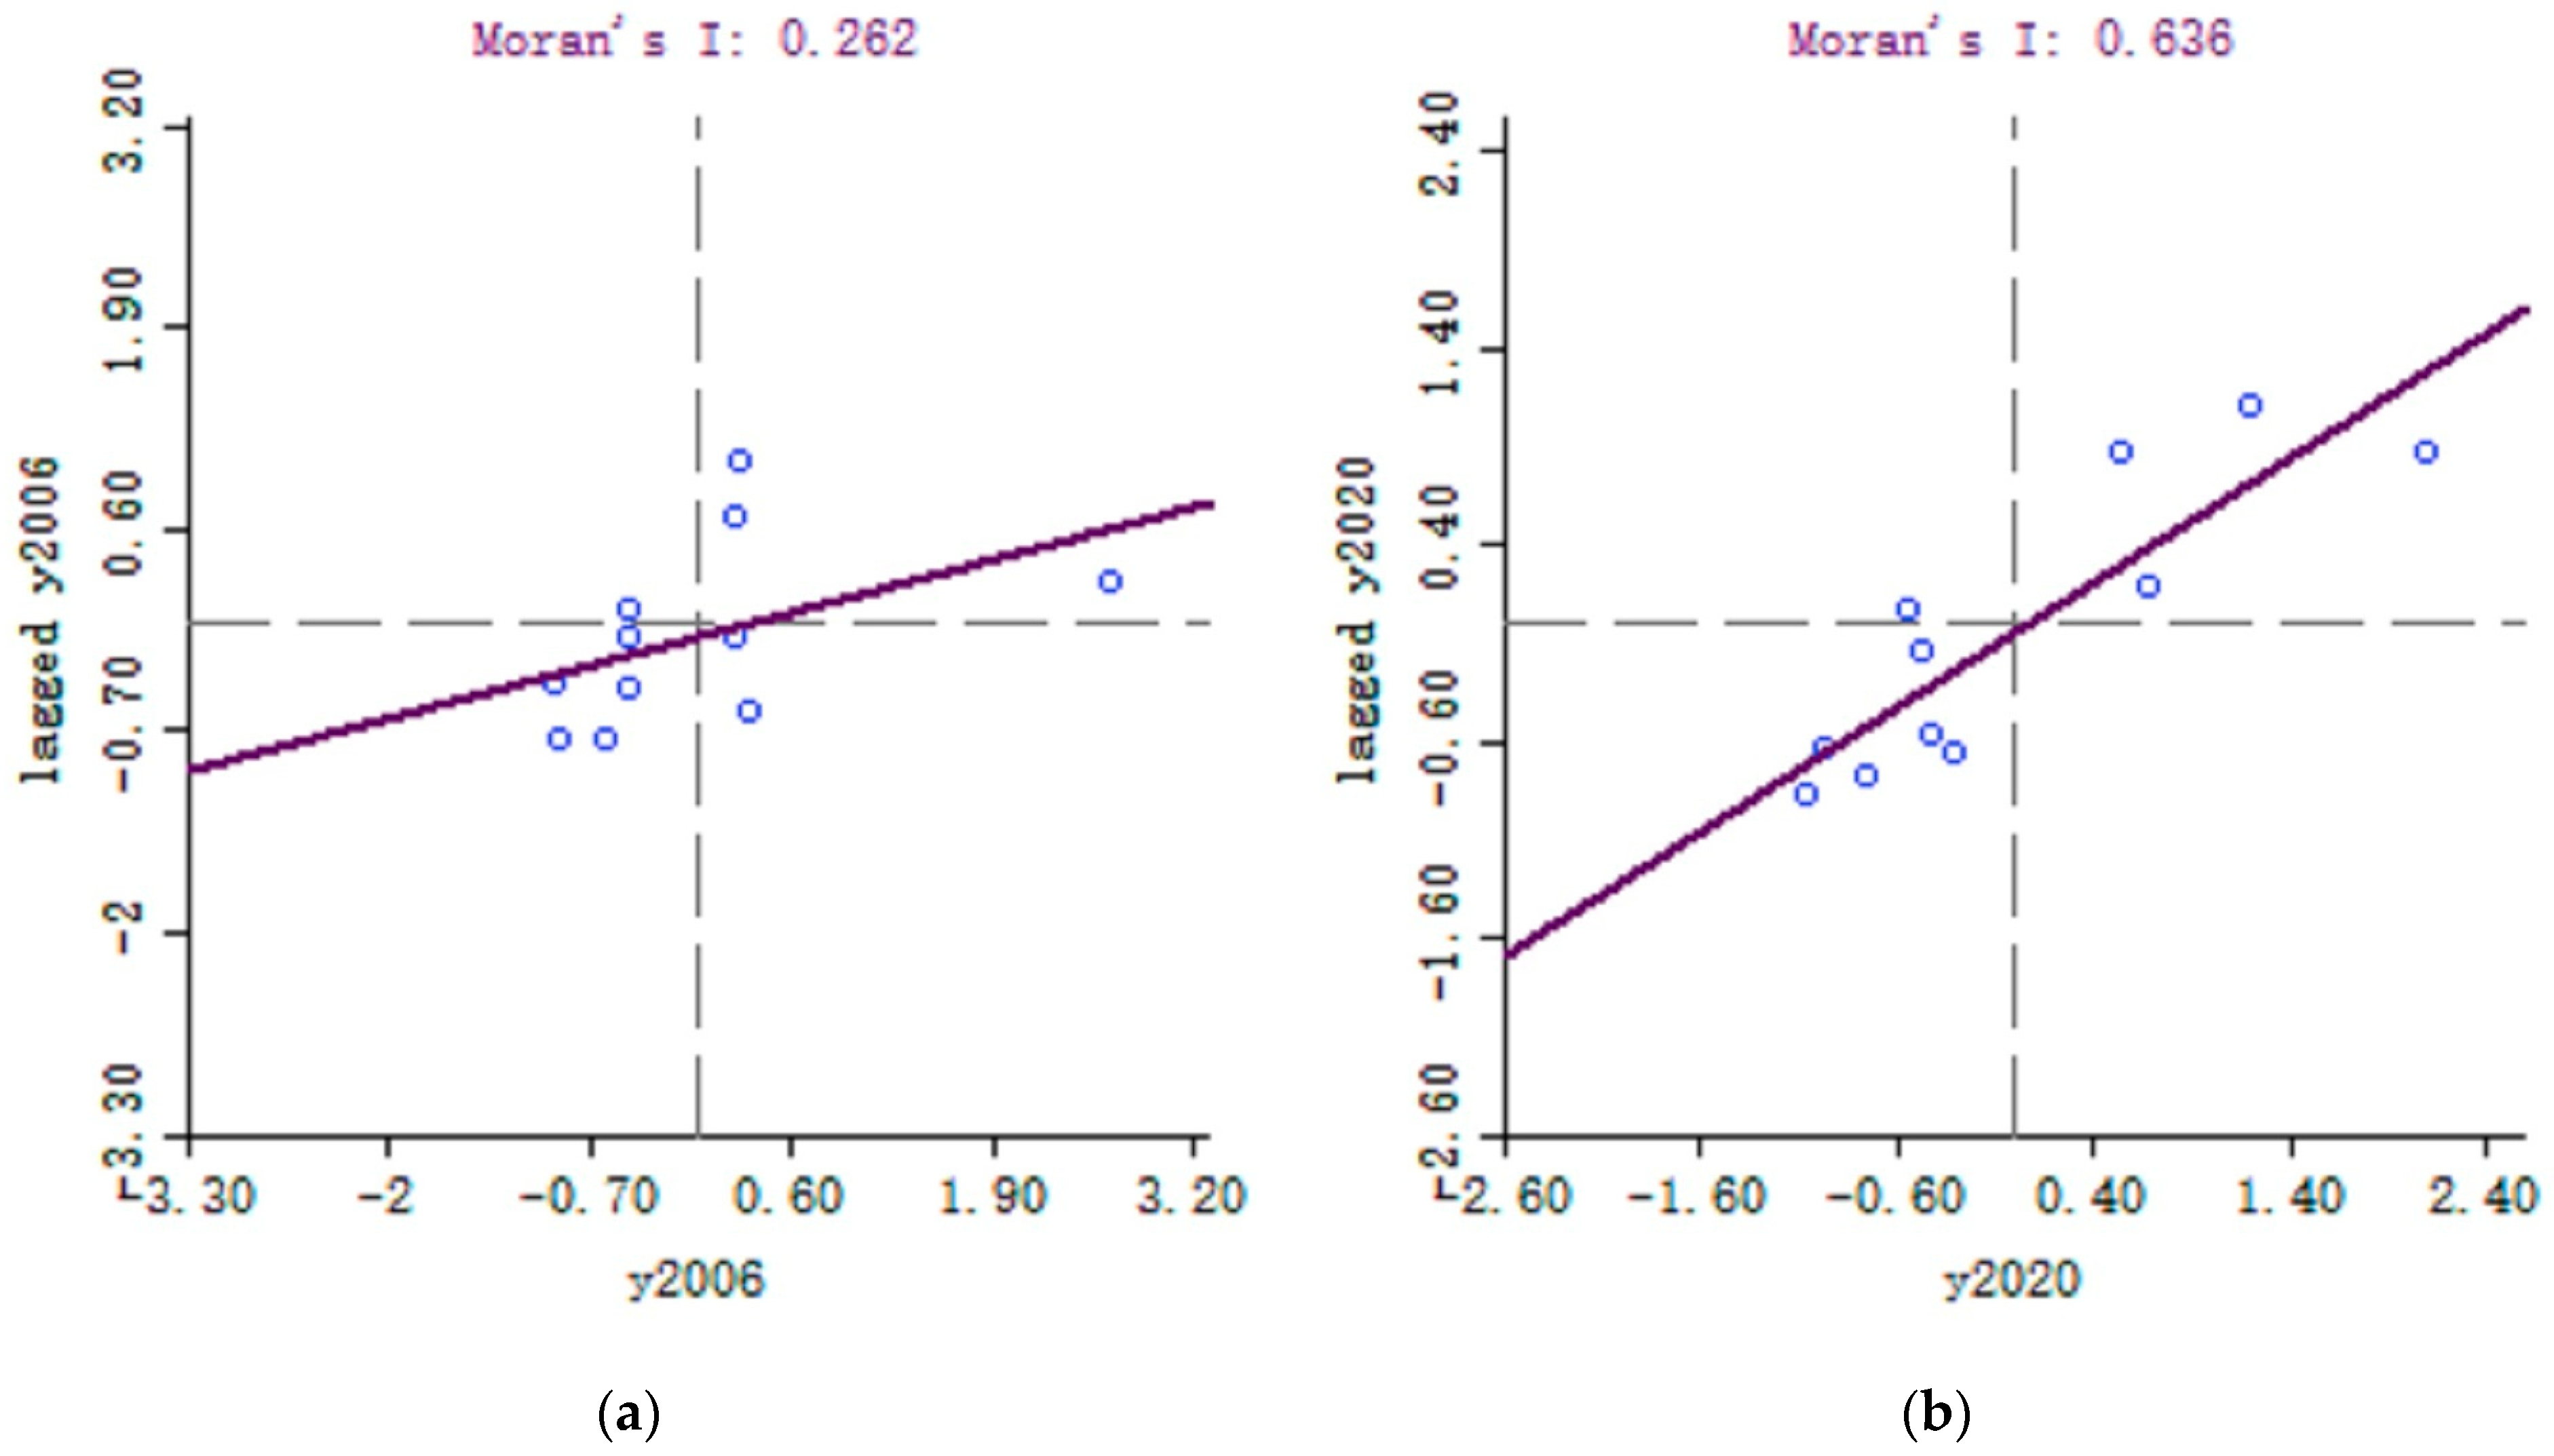
Table 5. The results show that the global Moran’s I values for the period 2006–2020 are all positive, with Z-values greater than 2 and p-values less than 0.05, indicating significance through the significance test. This indicates that there is a positive correlation among the coupling coordination of low-carbon logistics, industrial agglomeration, and regional economy within the Yangtze River Economic Belt during the study period, demonstrating significant spatial agglomeration effects. Moreover, the global Moran’s I value increased from 0.262 in 2006 to 0.636 in 2020, indicating an enhanced spatial agglomeration characteristic during the study period.

4.3.2. Local Spatial Autocorrelation Analysis

The global Moran’s I only indicates the presence of significant spatial agglomeration within the Yangtze River Economic Belt. To clarify the agglomeration types of each province and city, it is necessary to examine the specific spatial relationship characteristics among them using the local Moran’s I. Therefore, this study employs the local Moran’s 
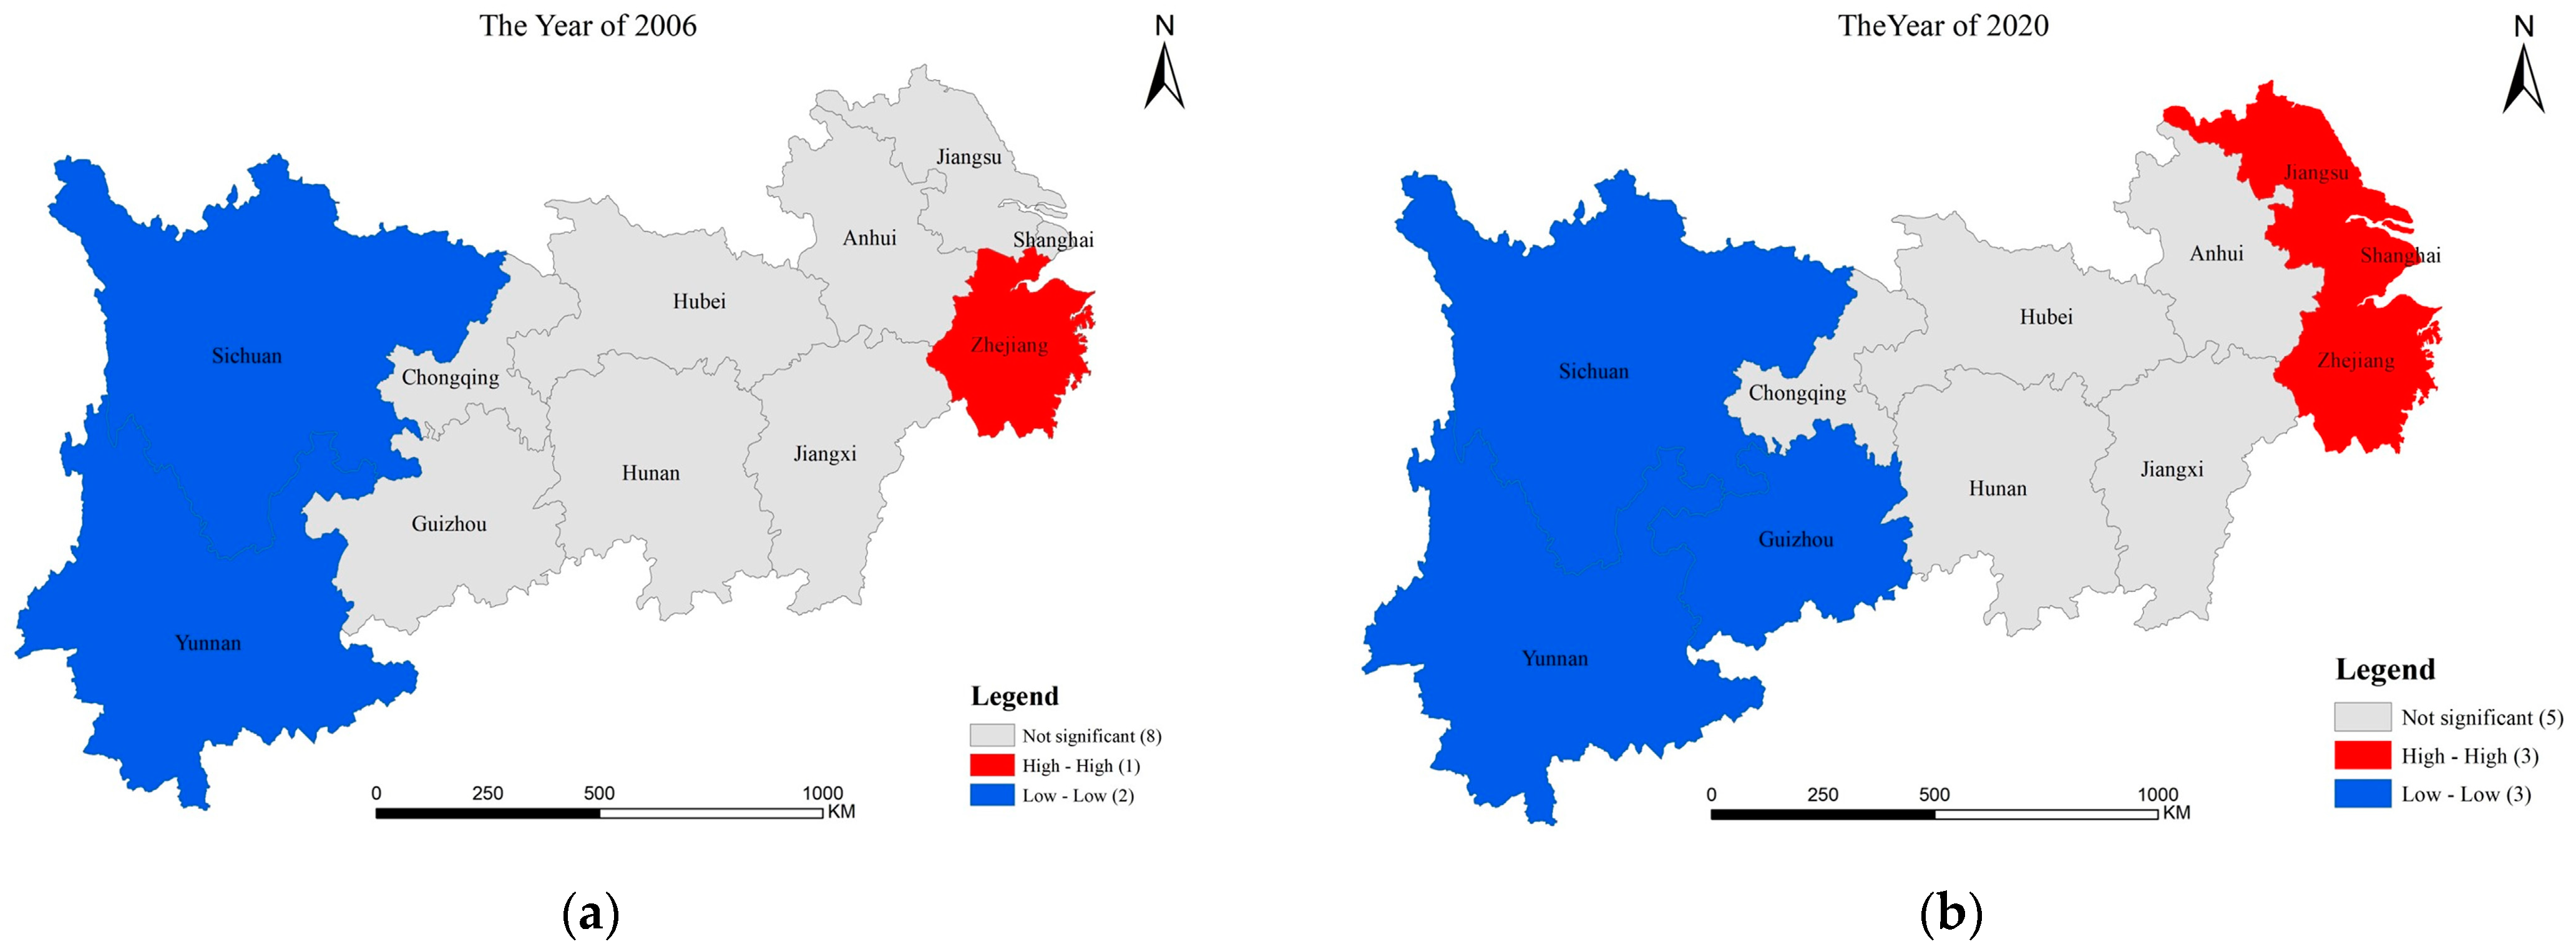
I to draw Moran scatterplots and LISA cluster maps for coupling coordination in 2006 and 2020. In the Moran scatterplot, the four quadrants represent four spatial agglomeration types: High–High (H–H), Low–High (L–H), Low–Low (L–L), and High–Low (H–L). H–H indicates high values for both the focal unit and its neighboring observations, L–H indicates low values for the focal unit but high values for neighboring areas, L–L indicates low values for both the focal unit and its neighboring observations, and H–L indicates high values for the focal unit but low values for neighboring areas. As shown in Figure 4, most provinces and cities are located in the first and third quadrants, indicating a positive spatial correlation in the coupling coordination level among the three systems within the 11 provinces and cities of the Yangtze River Economic Belt. Both high-value agglomeration areas and low-value agglomeration areas exhibit strong spatial association. During the study period, the “H–H” agglomeration shifted from Zhejiang to Zhejiang, Shanghai, and Jiangsu (Figure 5). These regions, located downstream of the Yangtze River, are at the center of the Yangtze River Economic Belt and even China’s economic development. Their advantageous coastal and along-river transportation, as well as increasing economic connections, have fostered a high degree of regional integration. The “L–L” agglomeration shifted from Sichuan and Yunnan to Sichuan, Yunnan, and Guizhou. These regions are concentrated upstream of the Yangtze River and have lower levels of economic development compared to the downstream regions. The closed transportation conditions hinder the low-carbon and positive development of the logistics industry, and the development of surrounding areas is also weak, resulting in the formation of low-value agglomeration areas. Compared to the positive spatial radiation effect generated by high-value agglomeration, attention should be paid to the “low lock” phenomenon caused by the low-value agglomeration in the upstream of the Yangtze River, which hinders the coupling coordination development among the three systems. Based on the discussions above regarding high-value and low-value agglomeration areas, it can be observed that the spatial correlation pattern based on local spatial autocorrelation is generally consistent with the spatial distribution characteristics of coupling coordination levels. In addition, the number of regions with non-significant local Moran’s I has reduced from 8 to 5, indicating an enhancement of the spatial correlation pattern in the Yangtze River Economic Belt.

4.4. Analysis of Standard Deviation Ellipses for Coupling Coordination

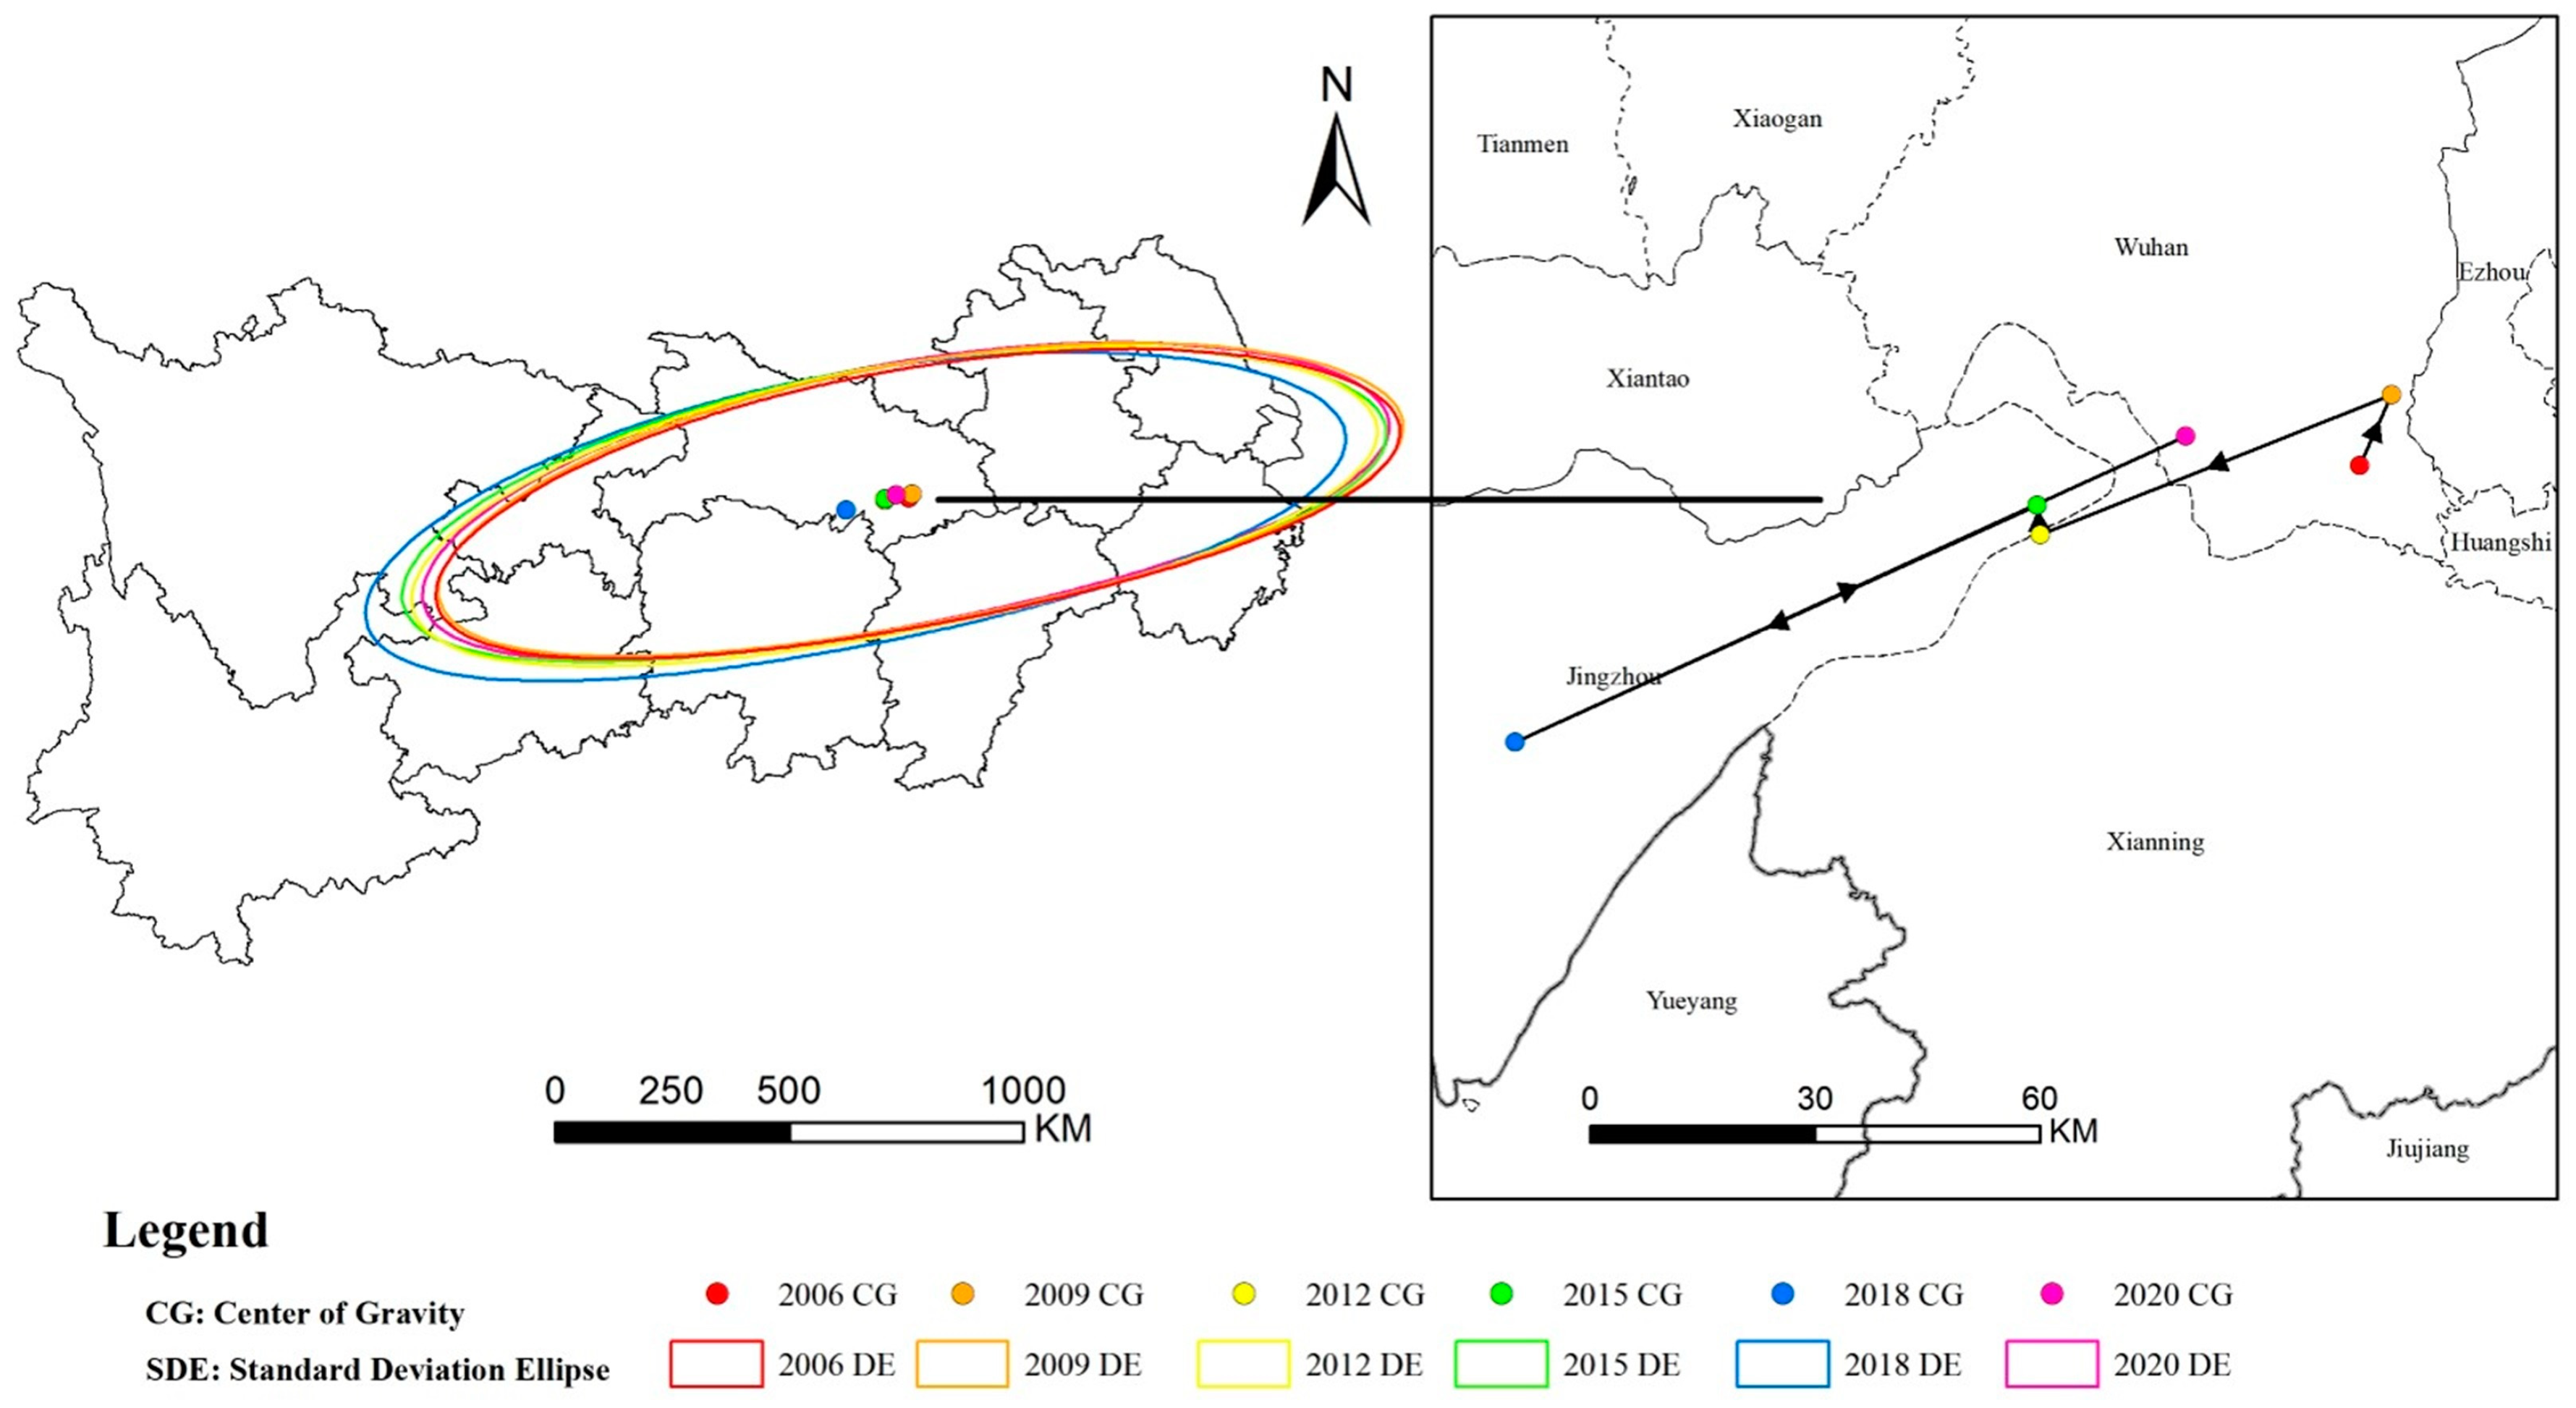
To accurately reveal the spatial evolution trend of coupling coordination in the Yangtze River Economic Belt in terms of low-carbon logistics, industrial agglomeration, and regional economy, the study utilized ArcGIS 10.8 software to analyze the changes in the center of gravity and standard deviation ellipses of coupling coordination from 2006 to 2020, as shown in Figure 6.
The figure reveals that the center of gravity of the coupling coordination in the Yangtze River Economic Belt during 2006–2020 is predominantly located in the southeast of Hubei Province, migrating among Wuhan, Xianning, and Jingzhou. This indicates that the spatial distribution of coupling coordination among the three systems remained relatively stable over the study period, exhibiting an “east strong, west weak” spatial pattern. In terms of specific time periods, the center of gravity coordinates of the ellipse initially shifted in the northeast direction by 10.34 km from (114.43 E, 30.09 N) in 2006. Subsequently, it continued to migrate in the southwest direction by 50.44 km from (114.48 E, 30.17 N) in 2009. From 2012 to 2015, the coordinates shifted by a smaller distance of 3.84 km in the northwest direction from (113.97 E, 30.05 N). Between 2015 and 2018, the coupling coordination coordinates further migrated by 76.27 km in the southwest direction from (113.96 E, 30.08 N). The eastern region of the Yangtze River Economic Belt, including Shanghai, Hangzhou, and Jiangsu, benefits from favorable location conditions and strong economic capabilities. As a result, it exhibits higher levels of logistics industry agglomeration and green development, leading to stronger coordination with the regional economy. Consequently, after a certain period of development, the level of coupling coordination has reached a high point, and the impetus for further synergistic growth may gradually diminish. In contrast, the western provinces and cities have relatively weak economic foundations and industrial structures in the early stages of development, and they have a lack of awareness regarding ecological protection. After the initial phase of extensive development, the western provinces and cities have made efforts in building a green and low-carbon production and lifestyle, establishing ecological barriers, and achieving sustainable development. As a result, the coupling coordination situation among the three systems has been continuously optimized, leading to a more significant enhancement effect and a great development potential. Between 2018 and 2020, the coordinates shifted from (113.22, 29.86) to (114.19, 30.15), with a migration distance of 98.15 km. This is related to the development of regional integration in the Yangtze River Delta region, which includes Shanghai, Jiangsu, Zhejiang, and Anhui. In 2018, Chinese leaders announced the elevation of the regional integration of the Yangtze River Delta as a national strategy during the China International Import Expo. This development is of great significance in promoting the connectivity of major transportation corridors and fostering the formation of a coordinated and collaborative logistics system along the coastal and river areas. It contributes to the enhancement of regional economic agglomeration and competitiveness, thereby achieving sustainable development of the regional economy and society.
From the parameters of the standard deviation ellipses, the coupling coordination in the Yangtze River Economic Belt exhibits an overall “northeast–southwest” spatial pattern. Between 2006 and 2018, the long axis of the ellipses notably increased from 901.35 km to 921.00 km. Similarly, the short axis also showed a gradual increase from 274.27 km in 2006 to 289.88 km in 2018. This indicates that the spatial clustering of the coupling coordination among low-carbon logistics, industrial clustering, and regional economy weakened in the “northeast–southwest” direction and exhibited a dispersed trend during this time period. The development trend gradually shifted from the eastern part to the western part of the Yangtze River Economic Belt. Between 2018 and 2020, both the long and short axes of the ellipses showed a significant reduction. The long axis decreased from 921.00 km to 904.43 km, and the short axis decreased from 289.88 km to 279.50 km. This suggests that during this period, there was a clustering trend in the coordinated development among the three systems of the Yangtze River Economic Belt, with contraction observed in both the east–west and north–south directions. Overall, from 2006 to 2020, the coupling coordination among low-carbon logistics, industrial clustering, and regional economy in the Yangtze River Economic Belt has shifted towards the middle and upper reaches, indicating significant improvement in the degree of coupling coordination in the central and upstream regions. Compared to the downstream provinces and cities, these regions have experienced increased momentum in achieving coordinated development.

5. Discussion

We note that there are limitations in the existing research on low-carbon logistics, industrial agglomeration, and regional economy in the following areas. From a research perspective, the evaluation of low-carbon logistics often adopts fuzzy comprehensive evaluation and fuzzy matter element analysis methods. These evaluation methods require high completeness of the indicator system and accuracy in determining indicator weights, making the evaluation results prone to inaccuracies due to issues such as linear overlap among indicators or subjectivity in weight allocation. In terms of research content, most existing studies are limited to analyzing the one-way or two-way relationships between low-carbon logistics, industrial agglomeration, and the regional economy, with few systematic studies on the coupling coordination among the three. Considering the real situation, regional integration and industrial agglomeration have become characteristics of economic development, and rational industrial agglomeration will become a new growth point for the regional economy. However, this process inevitably impacts the environment, making the management of the relationships among the three an important issue for achieving sustainable development. From a research methods perspective, although some studies have explored the coupling coordination relationship between logistics industry agglomeration or low-carbon development and the regional economy, they only consider the research objects as independent entities, with limited research on the spatial correlation among the research objects at the spatial level. This neglects the significant role of spatial spillover in regional coordinated development. In terms of regional research, most scholars focus on specific provinces or the national level, with few studies investigating the relationship between specific regional logistics industries and economic development.
In response to the limitations of existing research, this study introduces the following innovations: (1) It will evaluate the development of low-carbon logistics from an efficiency perspective by considering the production relationship ratio that achieves the maximum economic output and minimum carbon dioxide emissions under unchanged input factors for the research object. This evaluation method aligns with the characteristics of low-carbon logistics, and is of great significance for achieving sustainable economic growth in resource-scarce China [52]. Additionally, this study employs the super-efficiency SBM model to measure the efficiency of low-carbon logistics, which differs from traditional DEA models that do not consider the existence of slack variables, resulting in a more comprehensive and accurate evaluation. (2) It breaks away from unidirectional and linear thinking by considering low-carbon logistics, industrial agglomeration, and the regional economy as a whole. This study inherits and expands upon regional balance theory and sustainable development theory, providing a valuable analytical framework for improving the overall coordination of regional development. (3) It utilizes spatial econometric methods to analyze the spatial correlation characteristics of the coupling coordination among low-carbon logistics, industrial agglomeration, and the regional economy, enriching the research in a multidimensional manner and providing new insights for regional development planning and design. (4) Distinguished from previous studies conducted at the national or provincial levels, this research focuses on the Yangtze River Economic Belt, which is characterized by vibrant economic development, significant agglomeration features, and a strong emphasis on green development. By capturing the regional and contemporary hotspots, the research becomes more representative, thus providing valuable insights for the sustainable development of regional economies worldwide.
This study provides an extended and supplementary analysis of the synergistic relationships between the low-carbon logistics, industrial agglomeration, and regional economy systems, complementing existing related research. It further utilizes GeoDA and ArcGIS software to analyze the spatial correlation features and spatiotemporal evolution trends of coupling coordination. Building upon this analysis, the study objectively examines the underlying reasons for development disparities among different regions. This analysis serves as a basis for policy recommendations aimed at constructing a modern logistics system, expediting the rational agglomeration of the logistics industry, and promoting high-quality regional economic development. Ultimately, it fosters the coordinated and orderly development of the three systems. However, this research has certain limitations. Firstly, it is confined to the provincial administrative regions within the Yangtze River Economic Belt. Future research could narrow down its focus to city-level or county-level areas to provide more accurate and targeted policy recommendations for specific regions. Secondly, the study primarily explores the coupling coordination relationships among the three systems, their spatial correlation features, spatiotemporal evolution trends, and does not delve deeply into specific influencing factors and their mechanisms due to space constraints. Future research may systematically identify relevant influencing factors and further explore their impact on the collaborative development status among the three systems.

6. Conclusions and Policy Recommendations

6.1. Conclusions

This study focuses on the 11 provinces and cities in the Yangtze River Economic Belt from 2006 to 2020. It establishes an evaluation index system for the low-carbon logistics–industry agglomeration–regional economy and analyzes the coupling coordination level and spatiotemporal distribution characteristics among the three systems. Furthermore, it utilizes spatial autocorrelation analysis and a standard deviation ellipse model to examine the agglomeration characteristics and spatiotemporal evolution trends of the coupling coordination degree of the low-carbon logistics–industry agglomeration–regional economy in the Yangtze River Economic Belt. The main conclusions are as follows:
(1) By analyzing the spatiotemporal variations of the coupling coordination degree of the low-carbon logistics–industry agglomeration–regional economy in the Yangtze River Economic Belt, it is observed that over the study period, there is a fluctuating upward trend in the coupling coordination degree among the three systems, transitioning from the moderate disorder stage to the verge of disorder stage. However, the degree of coupling coordination remains low, indicating the presence of significant potential for synergistic development among the systems. Spatially, there are significant regional differences in the coupling coordination of the 11 provinces and cities in the Yangtze River Economic Belt, exhibiting a step-like distribution pattern of “higher in the east and lower in the west.” This distribution pattern aligns with the economic development levels of the provinces and cities in the Yangtze River Economic Belt. Additionally, there has been a slight expansion of interprovincial differences in the coupling coordination degree within the Yangtze River Economic Belt during the observed period.
(2) By analyzing the spatial agglomeration characteristics of the coupling coordination degree, it was found that the global Moran’s I is positive, indicating a significant spatial positive correlation in the coupling coordination among the three systems in the Yangtze River Economic Belt, and this spatial correlation shows a fluctuating upward trend. When examining the local Moran’s I, the spatial agglomeration characteristics of the provinces and cities in the Yangtze River Economic Belt mainly exhibit “H–H” and “L–L” states. The “H–H” agglomeration mainly occurs in Zhejiang, Shanghai, and Jiangsu, where there are evident spatial spillover effects in terms of closely connected economy, continuously optimized industrial agglomeration levels, and the low-carbon development of regional logistics. The “L–L” agglomeration in Sichuan, Guizhou, and Yunnan is attributed to their geographical disadvantages, low economic levels, and poor transportation conditions, resulting in a relative lack of development resources. Areas where the spatial effect is insignificant mainly include provinces and cities such as Hubei, Chongqing, and Hunan, indicating that these provinces exhibit a random distribution pattern in terms of spatial effects and have not formed significant spatial agglomeration effects.
(3) Through the analysis of the standard deviation ellipse and center of gravity migration, it is determined that the overall center of gravity of the coupling coordination degree of the 11 provinces and cities in the Yangtze River Economic Belt during the research period is located in the southeast of Hubei Province and migrates among Wuhan, Xianning, and Jingzhou. This indicates a relatively stable spatial distribution of the coupling coordination degree among the three systems. The spatial evolution pattern demonstrates a distinct “northeast–southwest” directional distribution, and the trajectory of center of gravity migration roughly follows the path of “northeast–southwest–northeast”. With 2018 as the dividing line, the agglomeration of the coupling coordination degree among the three systems in the Yangtze River Economic Belt presents a trend of initial weakening followed by a subsequent increase in the “northeast–southwest” direction. Furthermore, there has been an improvement in the coupling coordination level of the low-carbon logistics–industry agglomeration–regional economy in the upstream and middle reaches of the Yangtze River Economic Belt during the research period, indicating an enhancement in the driving force for coordinated development.

6.2. Policy Recommendations

Based on the current status of the low-carbon logistics–industry agglomeration–regional economy in the Yangtze River Economic Belt and the research findings mentioned above, the following policy recommendations are proposed:
(1) Uphold the green and low-carbon development of the logistics industry and steadily promote the sustainable high-level synergy among the three systems. Taking the downstream regions with strong scientific and technological innovation capabilities and high demand for logistics infrastructure as regional demonstration centers, efforts should be made to reduce carbon emissions resulting from energy consumption by applying new energy sources at the source, while improving energy efficiency and resilience in the logistics industry through low-carbon logistics technological innovations. Based on this foundation, efforts should be made towards fully leveraging the downstream regions’ unique advantages and leading role, further expanding the application scope of low-carbon logistics technology, and harnessing cluster effects, in order to drive neighboring areas and even the middle and upper reaches of the Yangtze River region’s provinces and cities to actively adopt low-carbon logistics development models. Moreover, under the government’s impetus, a targeted assistance mechanism for promoting low-carbon technology should be established, thereby creating a larger low-carbon economic entity, and effectively achieving the transformation of the Yangtze River Economic Belt’s logistics industry towards low-carbon development and high-quality economic advancement. Additionally, significant attention should be given to the important role of logistics enterprises in the development of the logistics industry. Strengthening support for innovation in logistics enterprises and enhancing their capabilities in digital logistics development would promote the widespread adoption of emerging technologies such as smart warehousing, cargo tracking, and shared transportation in the logistics industry, thereby reducing carbon emissions and effectively driving the coordinated and interconnected development of the logistics industry and regional economy.
(2) Strengthen transportation infrastructure construction to facilitate interconnectivity between regions. Provinces and cities should seize the significant development opportunities presented by the Yangtze River Economic Belt, Yangtze River Delta Regional Integration Development, and the accelerated progress of the national supply-side reform. Efforts should be made to accelerate the improvement of comprehensive transportation networks and establish well-structured, unimpeded, and economically efficient cross-regional corridors. In this process, provincial and municipal governments should enhance communication and coordination, coordinate overall transportation planning, allocate transportation resources rationally, and elevate the level of scale and coordination in the development of the logistics industry in the Yangtze River Economic Belt. Particularly in the upstream and middle reaches, expanding the coverage of transportation infrastructure would facilitate the concentrated development and agglomeration of logistics enterprises, further enhancing the scale and external benefits of the logistics industry agglomeration. The application of new transportation network technologies such as the Internet of Things (IoT) and information monitoring is equally important. These technologies, based on the increasing density of transportation networks, can further promote the smoothness of regional transportation networks. By improving the transportation conditions, driving cities with international competitiveness such as Shanghai, Wuhan, and the Chengdu-Chongqing region to play a “polarizing” role, and building logistics industry corridors from these poles, further aggregating high-quality resources from across the country and even globally, aligns with the discourse in the mid- to long-term development plans for the logistics industry. This transforms the Yangtze River Economic Belt into an inland economic belt actively participating in international competition and cooperation.
(3) Address regional development imbalances and promote positive spatial connections between provinces. The Yangtze River Economic Belt should rely on the natural golden waterway of the Yangtze River to promote the construction of an integrated market along the Yangtze River, implement a large-scale logistics strategy, and leverage the synergistic effects of various production factors, such as technology, finance, talents, and data, to avoid the phenomenon of “agglomerations without cohesion” in industrial agglomeration. Governments of the upstream, middle, and downstream regions should strengthen communication and collaboration in order to clear regional regulations and market barriers that hinder the agglomeration of the logistics industry and the spillover of low-carbon technologies. This would remove the “administrative barriers” caused by local protectionism and the “poverty trap” in the upstream regions. Specifically, the downstream regions can accelerate the integration of their logistics industry with the upstream and middle reaches, play a driving and demonstration role, and guide the transfer of cost-advantaged logistics industries from the east to the west. The central and upstream regions should rely on concentrated areas of industrial transfer to foster new economic growth points centered around industrial upgrading and low-carbon development. This will attract capital, technology, and talent, effectively promoting the flow and integration of logistics resources and factors within the region.
(4) Tailor strategies to local conditions and implement differentiated development strategies. Considering the apparent differences among the upstream, middle, and downstream regions of the Yangtze River, each province and city should fully leverage its own advantages, overcome shortcomings, and promote differentiated development. The downstream regions, relying on favorable location conditions and economic advantages, should actively cultivate high-tech industries such as artificial intelligence and clean energy to provide robust technical support for low-carbon logistics. Efforts should be made to accelerate technological innovation and the transformation of low-carbon logistics innovation achievements. The middle reaches, serving as the economic hinterland of the downstream regions, should capitalize on their spatial advantages in economic radiation, promote collaboration between the two regions’ logistics industries, and accelerate industrial agglomeration and the development of low-carbon capabilities in the logistics industry. The upstream regions can employ clean energy for daily production in logistics enterprises, taking advantage of local strengths. Additionally, they can make use of national assistance policies and the driving force of the downstream regions to continuously improve the backward material capital, human capital, and technological level within the region, creating favorable internal and external conditions for the agglomeration of the logistics industry and green and low-carbon development.

Author Contributions

Conceptualization, Y.H. and M.L.; methodology, Y.H. and M.L.; data collection and analysis, Y.H.; writing—original draft, Y.H.; writing—review and editing, M.L; visualization, Y.H.; supervision, M.L.; project administration, M.L.; funding acquisition, Y.H. and M.L. All authors have read and agreed to the published version of the manuscript.

Funding

This research was funded by the Institute of Distribution Research of Northeastern University of Finance and Economics (grant number IDR2021YB004) and the National innovation and entrepreneurship training program for college students (grant number 202310497033).

Institutional Review Board Statement

Not applicable.

Informed Consent Statement

Not applicable.

Data Availability Statement

Not applicable.

Conflicts of Interest

The authors declare no conflict of interest.

References

  1. Nicholls, Z.R.J.; Gieseke, R.; Lewis, J.; Nauels, A.; Meinshausen, M. Implications of Non-Linearities between Cumulative CO2 Emissions and CO2-Induced Warming for Assessing the Remaining Carbon Budget. Environ. Res. Lett. 2020, 15, 074017. [Google Scholar] [CrossRef]
  2. Pan, W.; Gulzar, M.A.; Hassan, W. Synthetic Evaluation of China’s Regional Low-Carbon Economy Challenges by Driver-Pressure-State-Impact-Response Model. Int. J. Environ. Res. Public Health 2020, 17, 5463. [Google Scholar] [CrossRef] [PubMed]
  3. Kim, S.-T.; Han, C.-H. Measuring Environmental Logistics Practices. Asian J. Shipp. Logist. 2011, 27, 237–258. [Google Scholar] [CrossRef]
  4. Zhang, L.G. Research Progress on Energy Consumption and Carbon Emissions in the Logistics Industry. J. Tech. Econ. Manag. 2016, 1, 119–123. [Google Scholar] [CrossRef]
  5. Ibrahim, A.; Fernando, Y.; Tseng, M.-L.; Lim, M.K. Low-Carbon Warehousing Practices and Challenges: Insights from Emerging Country. Int. J. Logist. Res. Appl. 2022, 1–20. [Google Scholar] [CrossRef]
  6. Jiang, H.; Sun, T.; Zhuang, B.; Wu, J. Determinants of Low-Carbon Logistics Capability Based on Dynamic fsQCA: Evidence from China’s Provincial Panel Data. Sustainability 2023, 15, 11372. [Google Scholar] [CrossRef]
  7. Liang, Z.; Chiu, Y.; Guo, Q.; Liang, Z. Low-Carbon Logistics Efficiency: Analysis on the Statistical Data of the Logistics Industry of 13 Cities in Jiangsu Province, China. Res. Transp. Bus. Manag. 2022, 43, 100740. [Google Scholar] [CrossRef]
  8. Polat, M.; Kara, K.; Yalcin, G.C. Clustering Countries on Logistics Performance and Carbon Dioxide (CO2) Emission Efficiency: An Empirical Analysis. Bus. Econ. Res. J. 2022, 13, 221–238. [Google Scholar] [CrossRef]
  9. Nguyen, C.D.T. The Impact of Logistics and Infrastructure on Economic Growth: Empirical Evidence from Vietnam. J. Asian Financ. Econ. Bus. 2021, 8, 21–28. [Google Scholar] [CrossRef]
  10. Mu, D.; Hanif, S.; Alam, K.M.; Hanif, O. A Correlative Study of Modern Logistics Industry in Developing Economy and Carbon Emission Using ARDL: A Case of Pakistan. Mathematics 2022, 10, 629. [Google Scholar] [CrossRef]
  11. Naderi, R.; Nikabadi, M.S.; Tabriz, A.A.; Pishvaee, M.S. Supply Chain Sustainability Improvement Using Exergy Analysis. Comput. Ind. Eng. 2021, 154, 107142. [Google Scholar] [CrossRef]
  12. Fei, Y.; He, L.Q. Research on the Development Path of Green Logistics Promoted by Circular Economy under the Background of Low Carbon. Logist. Eng. Manag. 2022, 44, 11–13. [Google Scholar] [CrossRef]
  13. Su, J.; Shen, T.; Ma, W.-C.; Zhang, J.-X. Study on the Effect of Rural Low Carbon Logistics Industry Development on Rural Economic Growth. IEEE Access 2023, 11, 37108–37122. [Google Scholar] [CrossRef]
  14. Liu, M.F.; Sun, J.J. Analysis of the Agglomeration Degree of the Logistics Industry and its Correlation with Regional Economy. Railw. Transp. Econ. 2008, 30, 8–11. [Google Scholar] [CrossRef]
  15. Chen, L.H.; Wang, H.J.; Su, X. Impact of Synergistic Agglomeration of Logistics and Manufacturing Industries on Regional Economic Resilience: Evidence from the Provincial Panel Data in China. J. SE Univ. (Philos. Soc. Sci.) 2023, 25, 38–48. [Google Scholar] [CrossRef]
  16. Wang, H.; Su, X.; Liu, J.M. The Spatial Spillover Effect of Logistics and Manufacturing Co-Agglomeration on Regional Economic Resilience: Evidence from China’s Provincial Panel Data. Sustainability 2023, 15, 8208. [Google Scholar] [CrossRef]
  17. Sabbadin, E.; De Noni, I.; Belussi, F. Cross-Border Acquisitions and Technological Spillover: Evidence from European Regional Clusters. Compet. Rev. Int. Bus. J. 2022, 32, 821–839. [Google Scholar] [CrossRef]
  18. Nefs, M.; van Haaren, J.; van Oort, F. The Limited Regional Employment Benefits of XXL-Logistics Centres in the Netherlands. J. Transp. Geogr. 2023, 109, 103603. [Google Scholar] [CrossRef]
  19. Gorbunova, M.; Novichikhin, A. Improvement of the System of Transport-Transfer Hubs on the Example of St. Petersburg Agglomeration. E3S Web Conf. 2023, 383, 01006. [Google Scholar] [CrossRef]
  20. Liu, J.; Hu, Q.; Wang, J.; Li, X. Impacts of Logistics Agglomeration on Carbon Emissions in China: A Spatial Econometric Analysis. Environ. Sci. Pollut. Res. 2023, 30, 87087–87101. [Google Scholar] [CrossRef]
  21. Lin, S.; Wang, J. Driving Factors of Carbon Emissions in China’s Logistics Industry. Pol. J. Environ. Stud. 2022, 31, 163–177. [Google Scholar] [CrossRef]
  22. Melo, P.C.; Graham, D.J. Transport-Induced Agglomeration Effects: Evidence for US Metropolitan Areas. Reg. Sci. Policy Pract. 2018, 10, 37–47. [Google Scholar] [CrossRef]
  23. Zheng, H.; Fang, X.M.; Su, M.Y. Industrial Agglomeration, Environmental Regulation, and Efficiency of Industrial Green Development: Empirical Evidence from the Chengdu-Chongqing Dual-City Economic Circle. Stat. Decis. 2023, 39, 74–79. [Google Scholar] [CrossRef]
  24. Panhans, M.; Lavric, L.; Hanley, N. The Effects of Electricity Costs on Firm Re-Location Decisions: Insights for the Pollution Havens Hypothesis? Environ. Resour. Econ. 2017, 68, 893–914. [Google Scholar] [CrossRef]
  25. Zhang, Y.N.; Liu, Z.Q.; Ouyang, H.X.; Song, L.L. Integrated Study of Regional Logistics Industry Efficiency under a Low-Carbon Environment: An Empirical Analysis Based on 19 Provinces in the Yangtze River Conservation Area. Mod. Manag. 2020, 40, 33–40. [Google Scholar] [CrossRef]
  26. Guo, H.B.; Deng, Z.T.; Zou, Z.H. Study on the characteristics of the evolution of the logistics industry cluster in the Yangtze River Economic Belt and their countermeasures. Prices Mon. 2019, 60–66. [Google Scholar] [CrossRef]
  27. Fan, L.; Liu, H.; Shao, Z.; Li, C. Panel Data Analysis of Energy Conservation and Emission Reduction on High-Quality Development of Logistics Industry in Yangtze River Delta of China. Environ. Sci. Pollut. Res. 2022, 29, 78361–78380. [Google Scholar] [CrossRef]
  28. Sun, Z.X.; Liu, Y. Spatial-temporal Coupling Characteristics and Driving Mechanism of Industrial Structure Upgrading and Low-carbon Efficiency in the Logistics Industry. Mod. Manag. 2022, 42, 18–26. [Google Scholar] [CrossRef]
  29. Chen, B.; Liu, F.; Gao, Y.; Ye, C. Spatial and Temporal Evolution of Green Logistics Efficiency in China and Analysis of Its Motivation. Environ. Dev. Sustain. 2022, 1–32. [Google Scholar] [CrossRef]
  30. Zheng, W.; Xu, X.; Wang, H. Regional Logistics Efficiency and Performance in China along the Belt and Road Initiative: The Analysis of Integrated DEA and Hierarchical Regression with Carbon Constraint. J. Clean. Prod. 2020, 276, 123649. [Google Scholar] [CrossRef]
  31. Cao, B.R.; Deng, L.J. Influencing Factors of Logistics Industry Growth Efficiency in Yangtze River Economic Belt. Econ. Geogr. 2019, 39, 148–157. [Google Scholar] [CrossRef]
  32. Li, J.; Wang, Q.M. Research on the Development Quality Measurement and Balance of China’s Four Major Logistics Sectors: A Perspective Based on Logistics Industry Efficiency. J. Stat. Inf. 2019, 34, 76–84. [Google Scholar]
  33. Rashidi, K.; Cullinane, K. Evaluating the Sustainability of National Logistics Performance Using Data Envelopment Analysis. Transp. Policy 2019, 74, 35–46. [Google Scholar] [CrossRef]
  34. Chen, L.; Jia, G. Environmental Efficiency Analysis of China’s Regional Industry: A Data Envelopment Analysis (DEA) Based Approach. J. Clean. Prod. 2017, 142, 846–853. [Google Scholar] [CrossRef]
  35. Qin, W.; Qi, X. Evaluation of Green Logistics Efficiency in Northwest China. Sustainability 2022, 14, 6848. [Google Scholar] [CrossRef]
  36. Guan, C.; Hu, Q. Does High-Speed Railway Impact Urban Logistics Industry Agglomeration? Empirical Evidence from China’s Prefecture-Level Cities. Socioecon. Plann. Sci. 2023, 87, 101557. [Google Scholar] [CrossRef]
  37. Rosenthal, S.S.; Strange, W.C. Chapter 49—Evidence on the nature and sources of agglomeration economies. In Handbook of Regional and Urban Economics; Elsevier: Amsterdam, The Netherlands, 2004; Volume 4, pp. 2119–2171. ISBN 9780444509673. [Google Scholar]
  38. O’Donoghue, D.; Gleave, B. A Note on Methods for Measuring Industrial Agglomeration. Reg. Stud. 2004, 38, 419–427. [Google Scholar] [CrossRef]
  39. Du, Q.; Wang, X.; Li, Y.; Zou, P.X.W.; Han, X.; Meng, M. An Analysis of Coupling Coordination Relationship between Regional Economy and Transportation: Empirical Evidence from China. Environ. Sci. Pollut. Res. 2022, 29, 34360–34378. [Google Scholar] [CrossRef]
  40. Xie, H.; Li, Z.; Xu, Y. Study on the Coupling and Coordination Relationship between Gross Ecosystem Product (GEP) and Regional Economic System: A Case Study of Jiangxi Province. Land 2022, 11, 1540. [Google Scholar] [CrossRef]
  41. Ma, H.Q.; Lian, Q.W.; Han, Z.L.; Gong, Z.G.; Li, Z. Spatio-Temporal Evolution of Coupling and Coordinated Development of Basic Public Services-Urbanization-Regional Economy. Econ. Geogr. 2020, 40, 19–28. [Google Scholar] [CrossRef]
  42. Tone, K. A Slacks-Based Measure of Efficiency in Data Envelopment Analysis. Eur. J. Oper. Res. 2001, 130, 498–509. [Google Scholar] [CrossRef]
  43. Tone, K. A Slacks-Based Measure of Super-Efficiency in Data Envelopment Analysis. Eur. J. Oper. Res. 2002, 143, 32–41. [Google Scholar] [CrossRef]
  44. Tone, K. Dealing with Undesirable Outputs in DEA: A Slacks-Based Measure (SBM) Approach. Nippon. Opereshonzu Risachi Gakkai Shunki Kenkyu Happyokai Abus. 2004, 2004, 44–45. [Google Scholar]
  45. Yan, Y.; Chen, Y.; Han, M.; Zhen, H. Research on Energy Efficiency Evaluation of Provinces along the Belt and Road under Carbon Emission Constraints: Based on Super-Efficient SBM and Malmquist Index Model. Sustainability 2022, 14, 8453. [Google Scholar] [CrossRef]
  46. Liu, H.R. Study on the Measurement and Influencing Factors of Green Economic Efficiency in Beijing-Tianjin-Hebei Region: An Analysis Based on Ultra-Efficient SBM and Tobit Models. Ecol. Econ. 2023, 39, 67–73. [Google Scholar]
  47. Wang, L. Research on Logistics Carbon Emissions under the Coupling and Coordination Scenario of Logistics Industry and Financial Industry. PLoS ONE 2021, 16, e0261556. [Google Scholar] [CrossRef]
  48. Zhang, W.; Zhang, X.; Zhang, M.; Li, W. How to Coordinate Economic, Logistics and Ecological Environment? Evidences from 30 Provinces and Cities in China. Sustainability 2020, 12, 1058. [Google Scholar] [CrossRef]
  49. Chen, S.H.; Lei, L.; Xu, H. Spatio-Temporal Evolution of Coupling Coordination between Industrial Agglomeration, Carbon Emission and Green Agriculture: An Empirical Study Based on Panel Data of the Yangtze River Economic Belt. Ecol. Econ. 2022, 38, 122–129. [Google Scholar]
  50. Lu, Y.Q.; Zhang, Y. Research on Coupling Coordination Development of Traffic Condition-Regional Economy-Ecological Environment in Hanjiang River Ecological Economy Belt. Resour. Environ. Yangtze Basin 2022, 31, 2404–2415. [Google Scholar]
  51. Wang, Z.; Liang, L.; Wang, X. Spatiotemporal Evolution of PM2.5 Concentrations in Urban Agglomerations of China. J. Geogr. Sci. 2021, 31, 878–898. [Google Scholar] [CrossRef]
  52. Awan, U.; Kraslawski, A.; Huiskonen, J. The Impact of Relational Governance on Performance Improvement in Export Manufacturing Firms. J. Ind. Eng. Manag. 2018, 11, 349–370. [Google Scholar] [CrossRef]
Figure 1. Map of the Yangtze River Economic Belt.
Sustainability 15 15739 g001
Figure 2. Coupling coordination and comprehensive evaluation index.
Sustainability 15 15739 g002
Figure 3. Spatial distribution trend of the coupling coordination of the three systems in the Yangtze River Economic Belt from 2006 to 2020. (a) Spatial distribution trend of the coupling coordination of the three systems in the Yangtze River Economic Belt in 2006; (b) Spatial distribution trend of the coupling coordination of the three systems in the Yangtze River Economic Belt in 2011; (c) Spatial distribution trend of the coupling coordination of the three systems in the Yangtze River Economic Belt in 2016; (d) Spatial distribution trend of the coupling coordination of the three systems in the Yangtze River Economic Belt in 2020.
Sustainability 15 15739 g003
Figure 4. Local Moran’s I scatterplots of the coupling coordination in 2006 and 2020. (a) Local Moran’s I scatterplots of the coupling coordination in 2006; (b) Local Moran’s I scatterplots of the coupling coordination in 2020.
Sustainability 15 15739 g004
Figure 5. LISA agglomeration maps for the Yangtze River Economic Belt in 2006 and 2020. (a) LISA agglomeration maps for the Yangtze River Economic Belt in 2006; (b) LISA agglomeration maps for the Yangtze River Economic Belt in 2020.
Sustainability 15 15739 g005
Figure 6. Standard deviation ellipses and center of gravity migration of coupling coordination.
Sustainability 15 15739 g006
Table 1. Low carbon logistics evaluation indicator system.
Indicator CategoryIndicator NameIndicator Description
InputLabor inputLogistics industry employment (10,000 persons)
Capital inputLogistics industry fixed asset investment (CNY 100 million)
Infrastructure inputTransportation route mileage (10,000 km)
Energy consumptionEnergy consumption (10,000 tons of standard coal)
OutputEconomic outputLogistics industry value added (CNY 100 million)
Scale outputFreight turnover (100 billion tons/km)
Undesired outputCarbon dioxide emissions (10,000 tons)
Table 2. Evaluation indicator system of regional economy.
Primary IndicatorSecondary IndicatorTertiary IndicatorIndicator AttributeIndicator Weight
Regional economy Economic scaleGDP (CNY 100 million)Positive0.0551
Retail sales of social consumer goods (CNY 100 million)Positive0.0569
Local financial revenue (CNY 100 million)Positive0.0576
Fixed asset investment (CNY 100 million)Positive0.0873
Economic efficiencyPer capita GDP (CNY)Positive0.0390
Per capita retail sales of social consumer goods (CNY)Positive0.0510
Per capita local financial revenue (CNY)Positive0.0732
Per capita fixed asset investment (CNY)Positive0.0598
Economic structureProportion of secondary industry output to GDP (%)Positive0.2822
Proportion of tertiary industry output to GDP (%)Positive0.2262
Urban-rural resident disposable income ratio (%)Negative0.0116
Table 3. Classification criteria for the level of coupling coordination degree.
Coupling
Coordination
Degree
Coordination LevelCoupling
Coordination
Degree
Coordination Level
0.000~0.099Extreme disorder0.500~0.599Barely coordination
0.100~0.199Severe disorder0.600~0.699Primary coordination
0.200~0.299Moderate disorder0.700~0.799Intermediate coordination
0.300~0.399Mild disorder0.800~0.899Good coordination
0.400~0.499On the verge of disorder0.900~1.000High-quality coordination
0.100~0.199Severe disorder0.600~0.699Primary coordination
Table 4. Coupling coordination degree of Yangtze River Economic Belt from 2006 to 2020.
200620072008200920102011201220132014201520162017201820192020
Shanghai0.6570.6710.6640.7270.6680.6890.6940.6420.6650.680.6890.7070.4080.7190.715
Jiangsu0.3340.3470.3580.4650.4230.5550.5360.4470.4560.4510.4540.470.3590.4720.589
Zhejiang0.3290.3410.3470.3580.3820.3990.420.4090.4210.4270.4340.4390.3290.4720.495
Anhui0.3290.3420.3620.3950.3760.3740.3990.3490.3570.350.3580.3670.2750.3740.513
Jiangxi0.2360.2510.3070.3250.3170.3290.3710.2940.3020.3050.3120.3250.2820.3210.341
Hubei0.2350.240.2610.2680.290.3050.3260.310.3230.3290.3340.3410.2960.3450.351
Hunan0.3390.3010.3920.290.3380.3170.3550.3020.3090.3110.3270.3430.3090.3120.355
Chongqing0.2360.2480.1790.2810.3010.3160.3550.3310.3530.3560.3620.3710.290.3580.374
Sichuan0.2170.2290.2460.2550.2750.2990.3090.3050.2920.2990.2890.2940.2610.2990.309
Guizhou0.1720.1880.2150.2230.2340.2550.3450.2320.2380.2410.2470.4690.2420.2630.28
Yunnan0.1760.1840.1920.1990.2070.2040.2240.3190.2320.2380.2430.2530.2370.2540.265
Table 5. Global Moran’s I of coupling coordination from 2006 to 2020.
YearMoran’s I p-ValueZ-ValueYearMoran’s Ip-ValueZ-Value
20060.2620.0102.61720140.4770.0013.677
20070.3030.0013.08120150.4510.0013.637
20080.2580.0232.29320160.4530.0013.638
20090.4210.0013.44520170.2280.0322.159
20100.4080.0013.39020180.5270.0013.392
20110.5320.0013.69520190.4960.0013.829
20120.4610.0013.38020200.6360.0013.874
Disclaimer/Publisher’s Note: The statements, opinions and data contained in all publications are solely those of the individual author(s) and contributor(s) and not of MDPI and/or the editor(s). MDPI and/or the editor(s) disclaim responsibility for any injury to people or property resulting from any ideas, methods, instructions or products referred to in the content.

