Article

The Spatial Correlation Network of China’s High-Quality Development and Its Driving Factors

1
School of Economics, Shandong University of Finance and Economics, Jinan 250014, China
2
School of Statistics and Mathematics, Inner Mongolia University of Finance and Economics, Hohhot 010051, China
*
Author to whom correspondence should be addressed.
Sustainability 2023, 15(22), 15738; https://doi.org/10.3390/su152215738
Submission received: 23 August 2023 / Revised: 2 November 2023 / Accepted: 6 November 2023 / Published: 8 November 2023
(This article belongs to the Section Economic and Business Aspects of Sustainability)

Abstract

:
The spatial correlation of high-quality development has emerged as a crucial approach to tackling economic polarization. This study assesses the level of high-quality development in China from 2006 to 2020, utilizing the new development concept. Social network analysis is employed to explore the spatial correlation mechanism of high-quality development. The quadratic assignment procedure (QAP) is used to analyze the driving factors that impact spatial correlation systems from both internal and external perspectives. The research indicates that China’s level of high-quality development has consistently improved between 2006 and 2020. The spatial correlation network has increasingly become more connected, while the eastern provinces, specifically Shanghai and Beijing, have a significant influence in the spatial correlation of high-quality development. However, the central and western provinces, such as Xinjiang and Inner Mongolia, occupy peripheral positions in this network. Furthermore, clear spatial correlation and spillover effects are apparent among the dimensions. From an internal standpoint, innovation, greenness, openness, and sharing are the key factors that contribute to establishing a high-quality development network. In addition, external elements such as financial development, social consumption, and convenient transportation are interconnected in space, which promote the creation of a high-quality development network. Local protectionism and population concentration impede the establishment of a high-quality development network.

1. Introduction

Currently, the Chinese economy has shifted from a phase of high-speed growth to one that prioritizes high-quality development. This stage necessitates coordinated and integrated development across all sectors, as well as introducing new requirements for the spatial structure of economic development. The objective is to establish a high-quality spatial linkage system that takes advantage of complementary strengths and coordination. In other words, China’s economic development is transitioning from a previous “point” development approach to a “plane” development mode concentrated on coordinated regional development. The interconnections between elements promote the growth of other components, as well as coordinated and integrated system development. Guiding the coordinated regional development of the country with a focus on high-quality development holds significant significance [1,2]. This paper aims to answer the following questions in the given context: What is the current state of high-quality development in China? What are the structural features of spatial correlation networks in high-quality development? What are the driving mechanisms behind spatial correlation in the high-quality development system? Investigating these queries holds great practical significance in promoting China’s high-quality development.
Currently, high-quality development has become a topic of great interest in academic circles. Economically speaking, it is a complex system that requires accurate measurement, which is of utmost importance [3]. According to Martinez and Mlachila, high-quality development entails meeting social expectations in a manner that is strong, stable, and sustainable [4]. Additionally, Mlachila et al. proposed that the objective of high-quality development is to achieve socially friendly and sustainable growth, while ensuring significant progress [5]. Nevertheless, there has been a lack of consensus on how to measure high-quality development. Some scholars have created an indicator system based on the connotation of analyzing the quality of growth of developing countries [5]. Others, meanwhile, have established a high-quality development index system which incorporates five aspects: innovation, coordination, greenness, openness, and sharing [3,6,7]. Moreover, certain academics have contended that enhancing development efficacy is connected to high-quality development, and have utilized total factor productivity for empirical investigation [8,9].
A significant amount of research in economic development revolves around spatial correlation patterns. Some scholars have analyzed spatial correlation features, such as the construction of a spatial correlation network based on GDP by Hu et al., to verify the laws of economic development [10]. Others have investigated the laws of spatial correlation in technological innovation. Tian and Wang identified a clear spatial correlation network for innovation spillover [11]. As time has progressed, the spatial effects of innovation spillover have expanded, but significant differences in correlation between regions have remained [12]. Concerning green development, Peng et al. discovered a noteworthy spatial correlation in ecological energy efficiency [13]. Dong and Li noted the robustness of the hierarchical structure of spatial correlation network density for carbon emissions within Chinese urban agglomerations. In particular, the Yangtze River Delta and Pearl River Delta occupy central positions in the spatial correlation network [14]. Scholars have also researched the high-quality development of the marine economy, highlighting the low coordination and high aggregation characteristics of the spatial correlation network [15].
Researchers have conducted an empirical examination of the external forces causing spatial correlation networks. Yu et al. discovered that disparities in industrial composition, foreign trade accessibility, healthcare quality, and labor market aspects have a noteworthy impact on the spatial correlation network of economic growth using the QAP regression method [16]. Zhuang et al. found that the development of a spatial correlation network for green innovation efficiency (GIE) is influenced by several key factors, including spatial correlations, infrastructure, urbanization, and economic development levels. However, the implementation of environmental regulations has an inhibiting effect on the formation of this network [17]. Feng et al. underscored that determining the spatial correlation of green development in the Guangdong–Hong Kong–Macao Greater Bay Area is contingent upon specific factors such as economic expansion, urbanization, environmental and resource levels, and proximity to industrial centers [18]. Some scholars have also investigated the factors affecting urban correlation networks and discovered that administrative hierarchy and proximity between economic systems have a favorable effect on such networks. While disparities in technological input, economic development, and industrial structure hinder the establishment of urban correlation networks [19,20].
Previous research has made noteworthy contributions to the theoretical and empirical analysis of high-quality development and its spatial correlation networks. However, there remain areas that require further exploration. The existing literature primarily concentrates on the definition and measurement of high-quality development. However, research on its spatial correlation networks is limited. Secondly, there is extensive analysis concerning spatial correlation networks regarding economic growth, green development, and other topics. However, these investigations tend to focus on external factors such as urbanization and industrial structure when examining the impact on spatial correlation networks, frequently disregarding the effects of internal factors within the system.
This paper primarily contributes in the following ways: First, we delineate the formation mechanisms underpinning the spatial correlations associated with high-quality development. By integrating spatial network analyses into our examination, we provide a comprehensive assessment of the structural features inherent in the spatial correlation network of China’s high-quality development. Additionally, we delve deep into spatial clustering attributes across various regions, thereby enriching the extant body of literature on high-quality development. Second, drawing upon the five key dimensions of high-quality development, we conduct an exhaustive exploration into how spatial correlations of intrinsic factors—namely innovation, coordination, environmental sustainability, openness, and sharing—influence the nexus of high-quality development. Concurrently, we scrutinize how spatial correlations of extrinsic factors, which encompass financial evolution, societal consumption patterns, transportation accessibility, regional protectionism, and population concentration, exert their impacts on the high-quality development network. Through examining these intrinsic and extrinsic lenses, our study sheds crucial light on the drivers shaping the spatial correlation network of high-quality development, thereby enhancing our holistic grasp of its formation mechanisms.
The remaining sections of this paper are structured as follows. Section 2 is an introduction to the methods and data sources. Section 3 establishes an index system and measures China’s high-quality development level. Section 4 describes the spatial correlation network of high-quality development. Section 5 analyzes the driving factors of the spatial correlation network. Section 6 presents the conclusion and suggestions.

2. Study Methods and Data Sources

2.1. Entropy Weight Method

The study utilizes the entropy weight method to assess China’s high-quality development levels from 2006 to 2020. The entropy weight approach presents various benefits in comparison to other measurement methods, such as objectivity and rationality. It enhances the accuracy and practical significance of the measurement results by avoiding subjective bias [21,22].
The calculation steps are as follows:
Step 1. The range method was employed to standardize the initial data, removing the dimensional connections between indicators and improving their comparability.
z i j = x i j min x i j max x i j min x i j , x i j   i s   p o s i t i v e   i n d d i c a t o r max x i j x i j max x i j min x i j , x i j   i s   n e g t i v e   i n d d i c a t o r
where, i represents the province, j represents the indicator, xij denotes the raw value of each second-level index in the index system, and zij represents its normalized value.
Step 2. Calculating information entropy.
E j = 1 ln   n i = 1 n M i j ln M i j ,   M i j = z i j / i = 1 n z i j
where, n represents the total number of provinces surveyed.
Step 3. Calculating the weight of indicators.
W j = 1 E j / j = 1 m 1 E j
Step 4. Calculating the final result based on the weight.

2.2. Modified Gravity Model

The spatial correlation network for high-quality development comprises a set of inter-regional connections that primarily depict inter-provincial spatial correlation. Existing studies typically apply the gravitational model in determining spatial correlation [19,23]. Therefore, considering economic, geographical, and target indicators [24,25], this paper employs a modified gravitational model to establish the spatial correlation relationship of high-quality development.
The specific model is:
G i j = k i j H Q D i P i H Q D j P j D i j 2 ,   k i j = H Q D i H Q D i + H Q D j
where, Gij denotes the attraction of province i to province j. HQDi and HQDj correspond to the high-quality development index of province I and province j, respectively. Pi and Pj represent the year-end permanent population of province i and province j, respectively. Dij = dij/(gi − gj) denotes the economic and geographical separation between province i and province j, where dij measures the spherical distance between them, and gi and gj denote the per capita GDP level of provinces i and j, respectively Additionally, kij indicates the provinces’ contribution to the quality development link between provinces i and j.
This paper calculates the gravity matrix of high-quality development among provinces using Equation (4). The threshold value is established as the mean value of the row in the gravity matrix. A value of 1 is assigned to gravity values surpassing the threshold, indicating strong spatial correlation between provinces. Alternatively, if the gravity value falls below the set threshold value, it is assigned a score of 0, indicating a feeble spatial correlation between the two provinces. By implementing this approach, a spatial correlation network is created to promote the advancement of high-quality development.

2.3. Social Network Analysis

The emergence of globalization implies that the achievement of high-quality development entails not solely a change in the development approach, but also the establishment of a consistent spatial correlation system [26,27]. A social network constitutes individuals and their interconnections. Social network analysis (SNA) can be employed to study the structure of relationships among regions and illustrate the connections among individuals in spatial networks [28,29,30]. This study utilizes the SNA method to investigate the structural characteristics of the spatial correlation network for high-quality development, with a focus on two aspects:
(1)
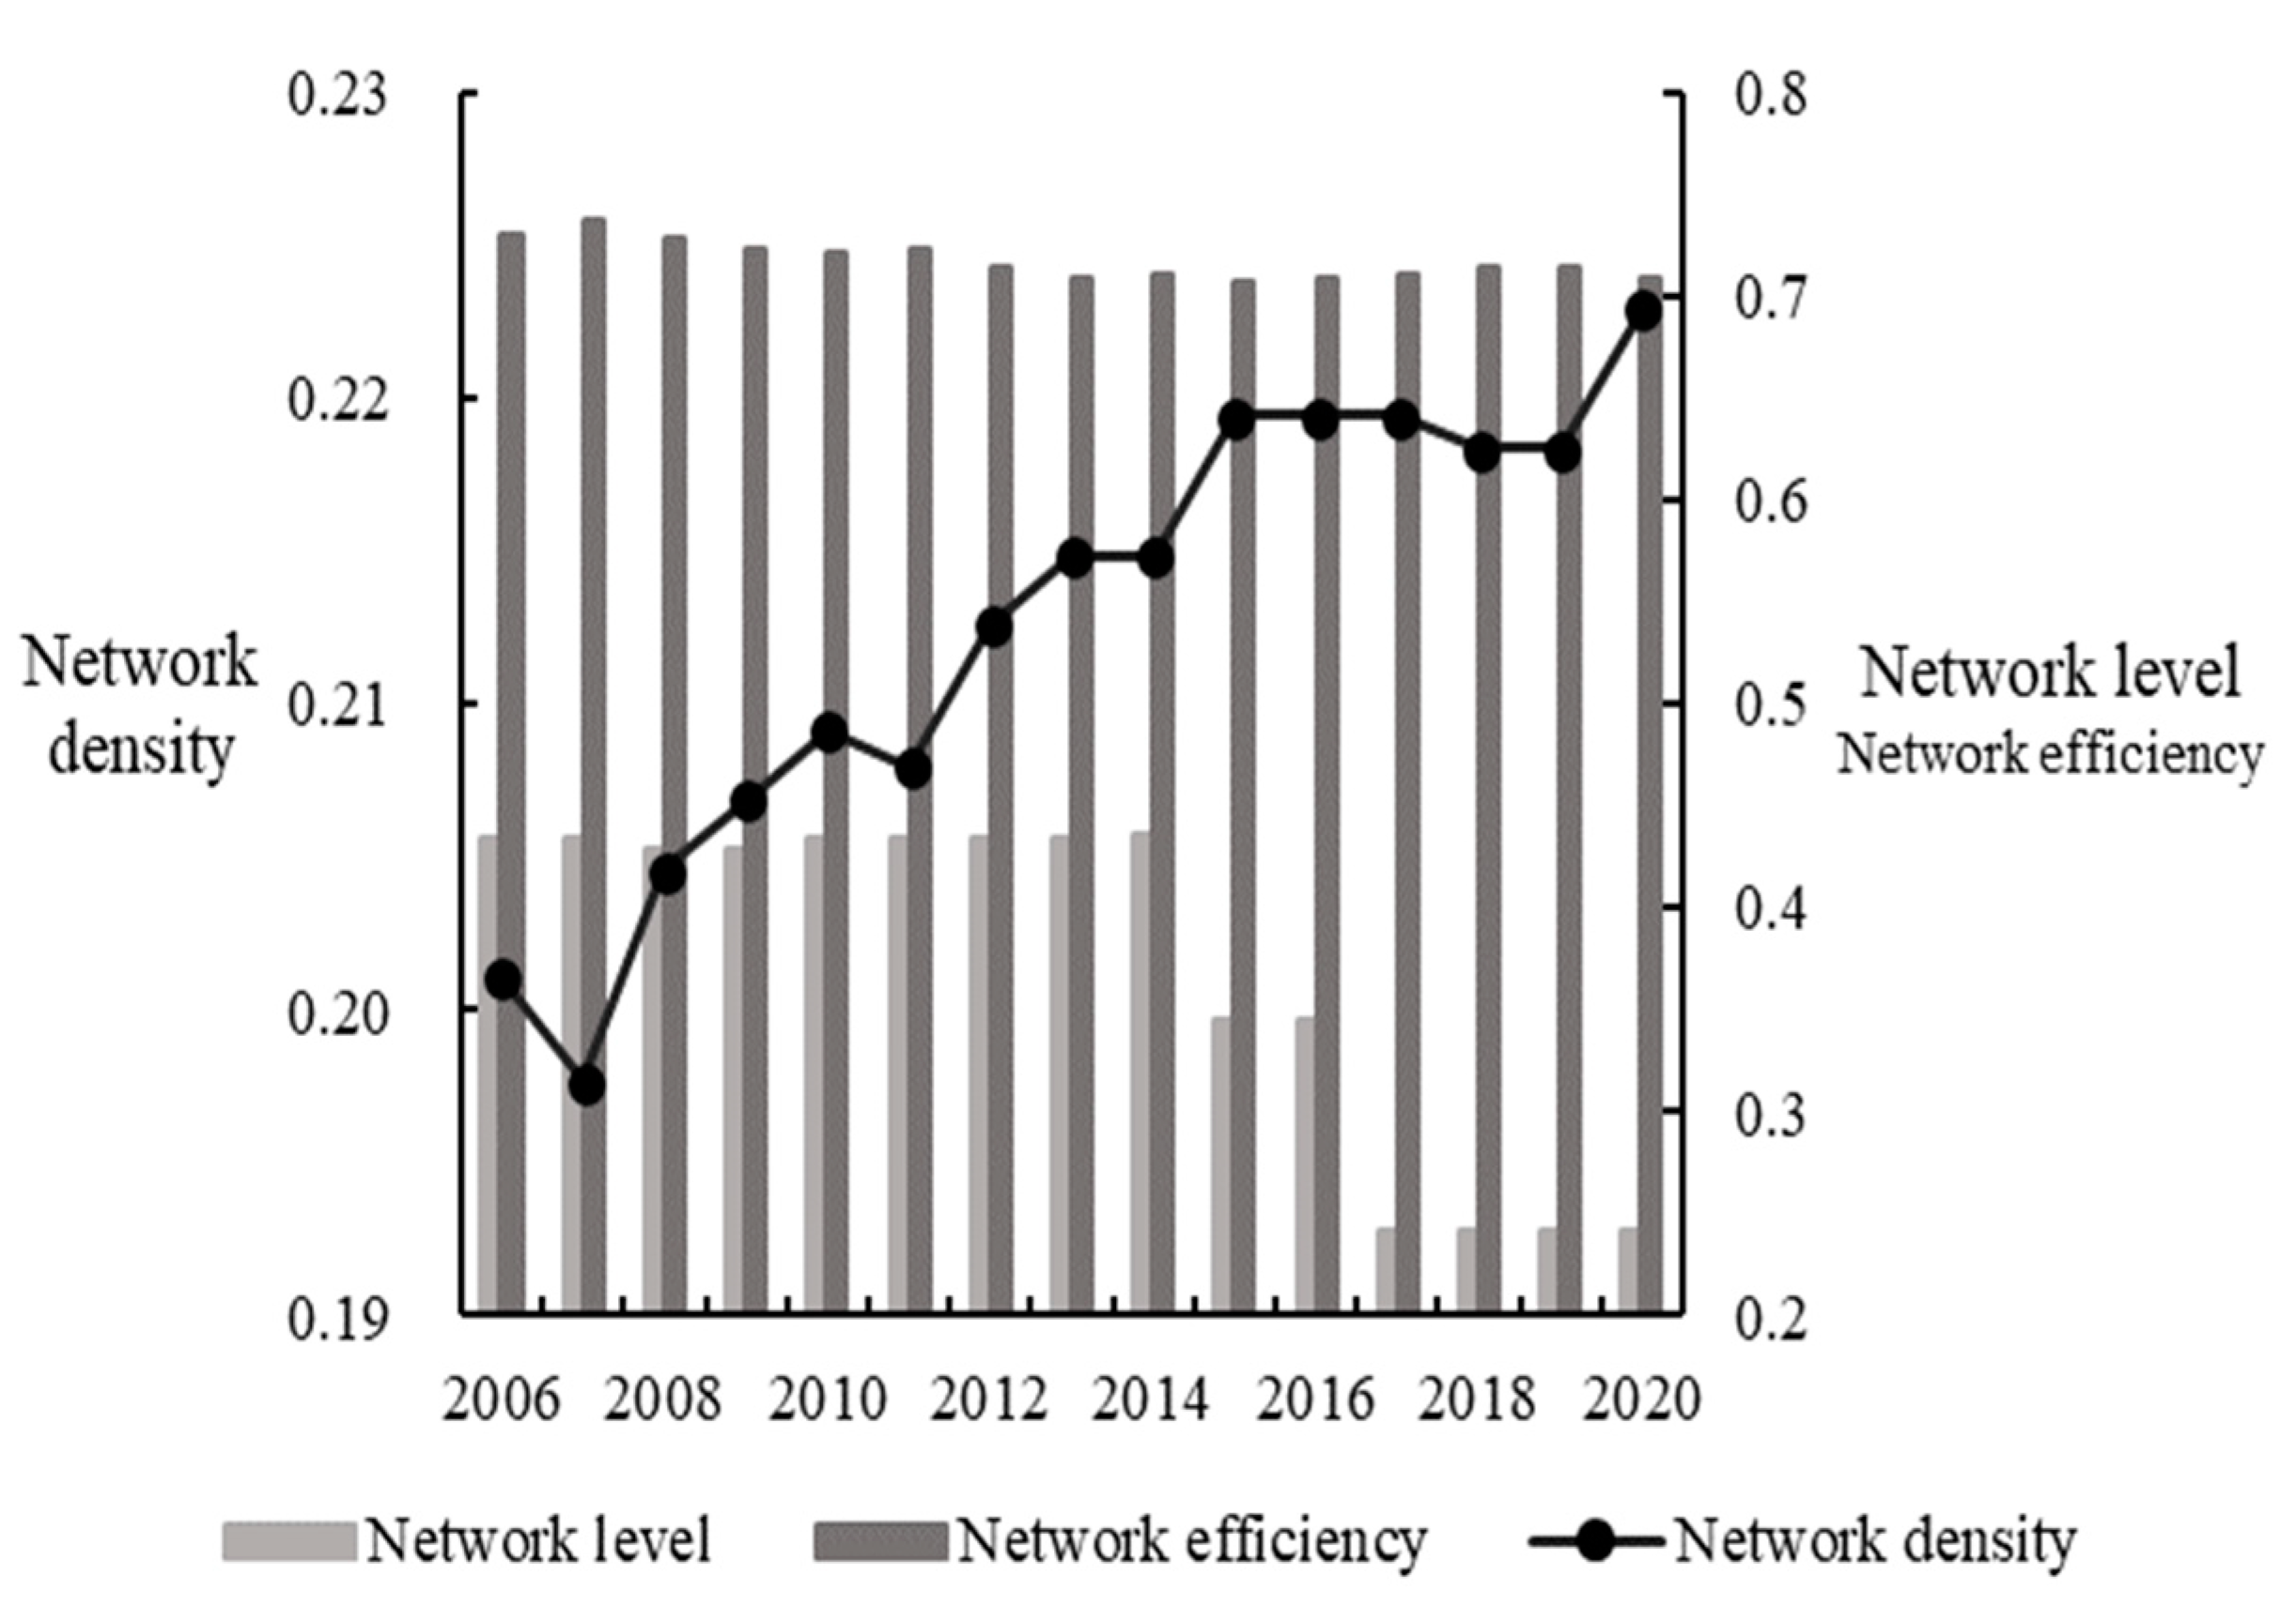
Overall Network Structure Characteristics: The overall network structure can be evaluated using network density, network hierarchy, and network efficiency [31,32]. Network density measures the density of the spatial correlation networks of high-quality development. The higher the density, the greater the degree of correlation, implying stronger spatial correlation. Network hierarchy reflects the hierarchical structure of the spatial correlation network of high-quality development, with a higher hierarchy indicating greater interprovincial asymmetric accessibility. Network efficiency, on the other hand, characterizes the efficiency of connections between provinces in the spatial correlation network of high-quality development. A low network efficiency indicates a more stable network.
The specific models are as follows:
Network density:
N D = L / N N 1
where, L is the actual association tree in a high-quality development spatial correlation network, and N is the number of nodes in the network. In this paper, N = 30.
Network hierarchy:
N H = 1 U / max U
where, U represents the logarithm of the symmetric reachable point number in the spatial correlation network of high-quality development, and max(U) is the maximum logarithm of symmetrically reachable points.
Network efficiency:
N E = 1 K / max K
where, K represents the number of redundant connections in the spatial correlation network of high-quality development, and max(K) is the maximum value of redundant connections.
(2)
Individual Network Structure Characteristics: Degree centrality, betweenness centrality, and closeness centrality are utilized to capture the characteristics of the individual network structure [33,34]. Degree centrality measures the extent to which a province occupies a central position in the spatial correlation network of high-quality development. A higher degree of centrality indicates a more central role for the province within the network. Betweenness centrality captures the importance of the province as a “bridge” within the spatial correlation network of high-quality development. A higher betweenness centrality indicates a more significant role in facilitating connections between other provinces. Closeness centrality reflects the extent to which a province’s correlation relationships are not dependent on other provinces in the spatial correlation network of high-quality development. A higher closeness centrality value indicates that the province occupies a central actor position within the network.
The specific models are as follows:
Degree centrality:
D C i = n i / N 1
where, ni represents the number of regions directly connected to area i in the spatial correlation network of high-quality development.
Betweenness centrality:
B C i = 2 j N k N b j k i N 2 3 N + 2 ,   b j k i = g j k i / g j k
where, gik represents the number of connections between region j and region k, and gik(i) represents the number of connections between region j and k through region i. Therefore, bik(i) represents the possibility that region i is located at the connection between region j and region k.
Closeness centrality:
C C i = j = 1 N d i j
where, dig represents the sum of all connections from region i to region j.

2.4. Spatial Agglomeration Analysis

The block model is a key technique for spatial cluster analysis in social network analysis, which provides a new perspective from which to analyze the role of each location (plate) within the spatial correlation system. In this study, the plates in the spatial correlation network of high-quality development are classified into four categories: First, the net spillover plate refers to members that offer far greater spillover effects to other plate members than to their own internal members and receive fewer external relations. Such members receive more external relations from other plate members than they spill over to other plates, with more intra-plate relations. The broker plate, on the other hand, sends and receives external relations and has fewer internal relations, and plays a bridging role in spatial spillovers. The fourth category is the bidirectional overflow plate, which has more spillovers to the plate and to other plate members but receives fewer spillover effects from other plates.

2.5. QAP Regression Analysis

The multidimensional proximity between provinces plays a crucial role in facilitating the flow of factors and forming a multidimensional cross-regional network, which ultimately influences the interactions of high-quality development. In order to investigate the driving factors behind the spatial correlation of high-quality development, this study employs the quadratic assignment problem (QAP) regression analysis method. This approach allows for the exploration and analysis of the driving factors of the spatial correlation of high-quality development from both internal and external perspectives. Compared to other methods, the QAP regression method treats matrices as an explanatory variable, effectively addressing the problems of “multi-collinearity” between variables and providing more robust conclusions [32,35,36].
The QAP regression model is shown as follows:
Y = f x 1 , x 2 , x 3 , x 4 , x 5
where, Y is the spatial correlation network matrix of high-quality development, and xi is the spatial association network matrix of the driving factors.

2.6. Data Sources

This study uses a network of 30 provinces in China (excluding Tibet and Hong Kong, Macao, and Taiwan) as network nodes. The study period ranges from 2006 to 2020. The index data and related variables utilized in this study are mainly obtained from sources such as “China Statistical Yearbook”, the “China Science and Technology Statistical Yearbook”, the “China Labour Statistics Yearbook” and provincial statistical yearbooks. spherical distance calculations between provinces are calculated using ArcGIS 10.2.

3. Measurement of the Level of High-Quality Development

3.1. Construction of the Index System
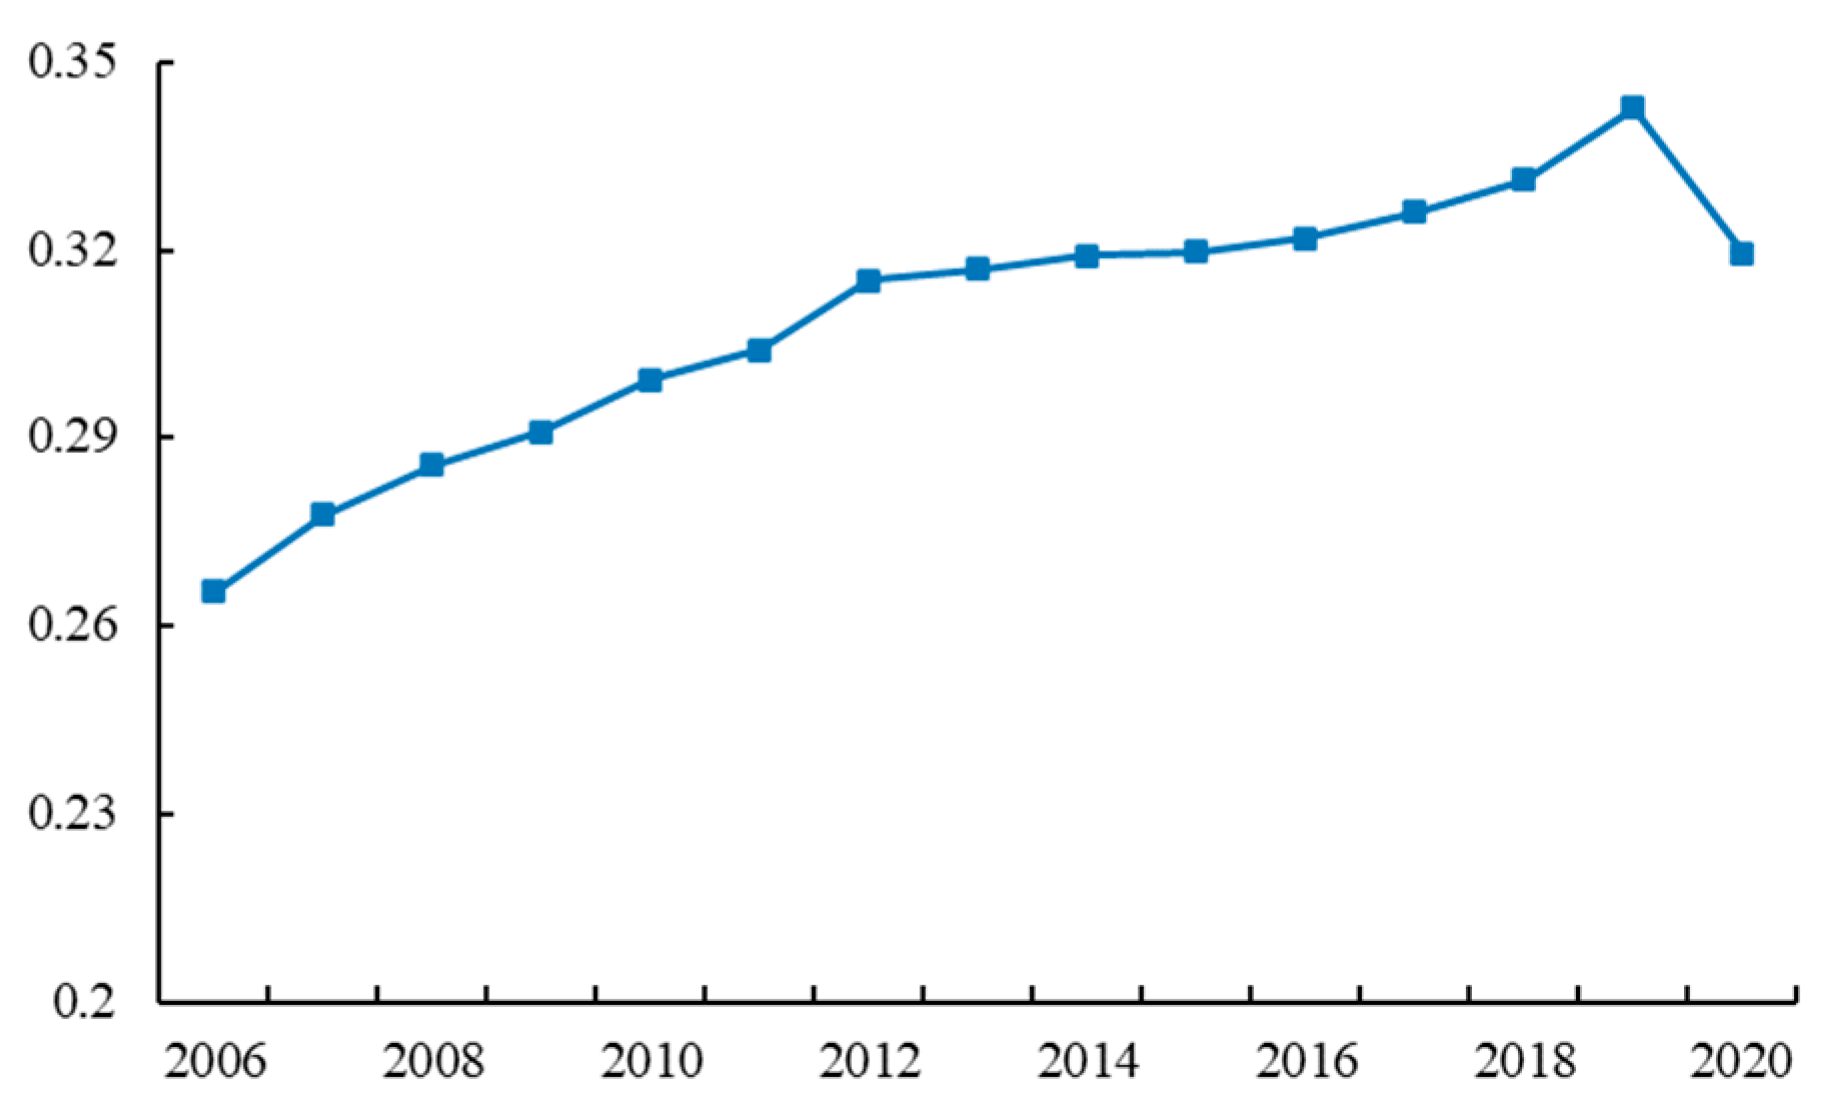
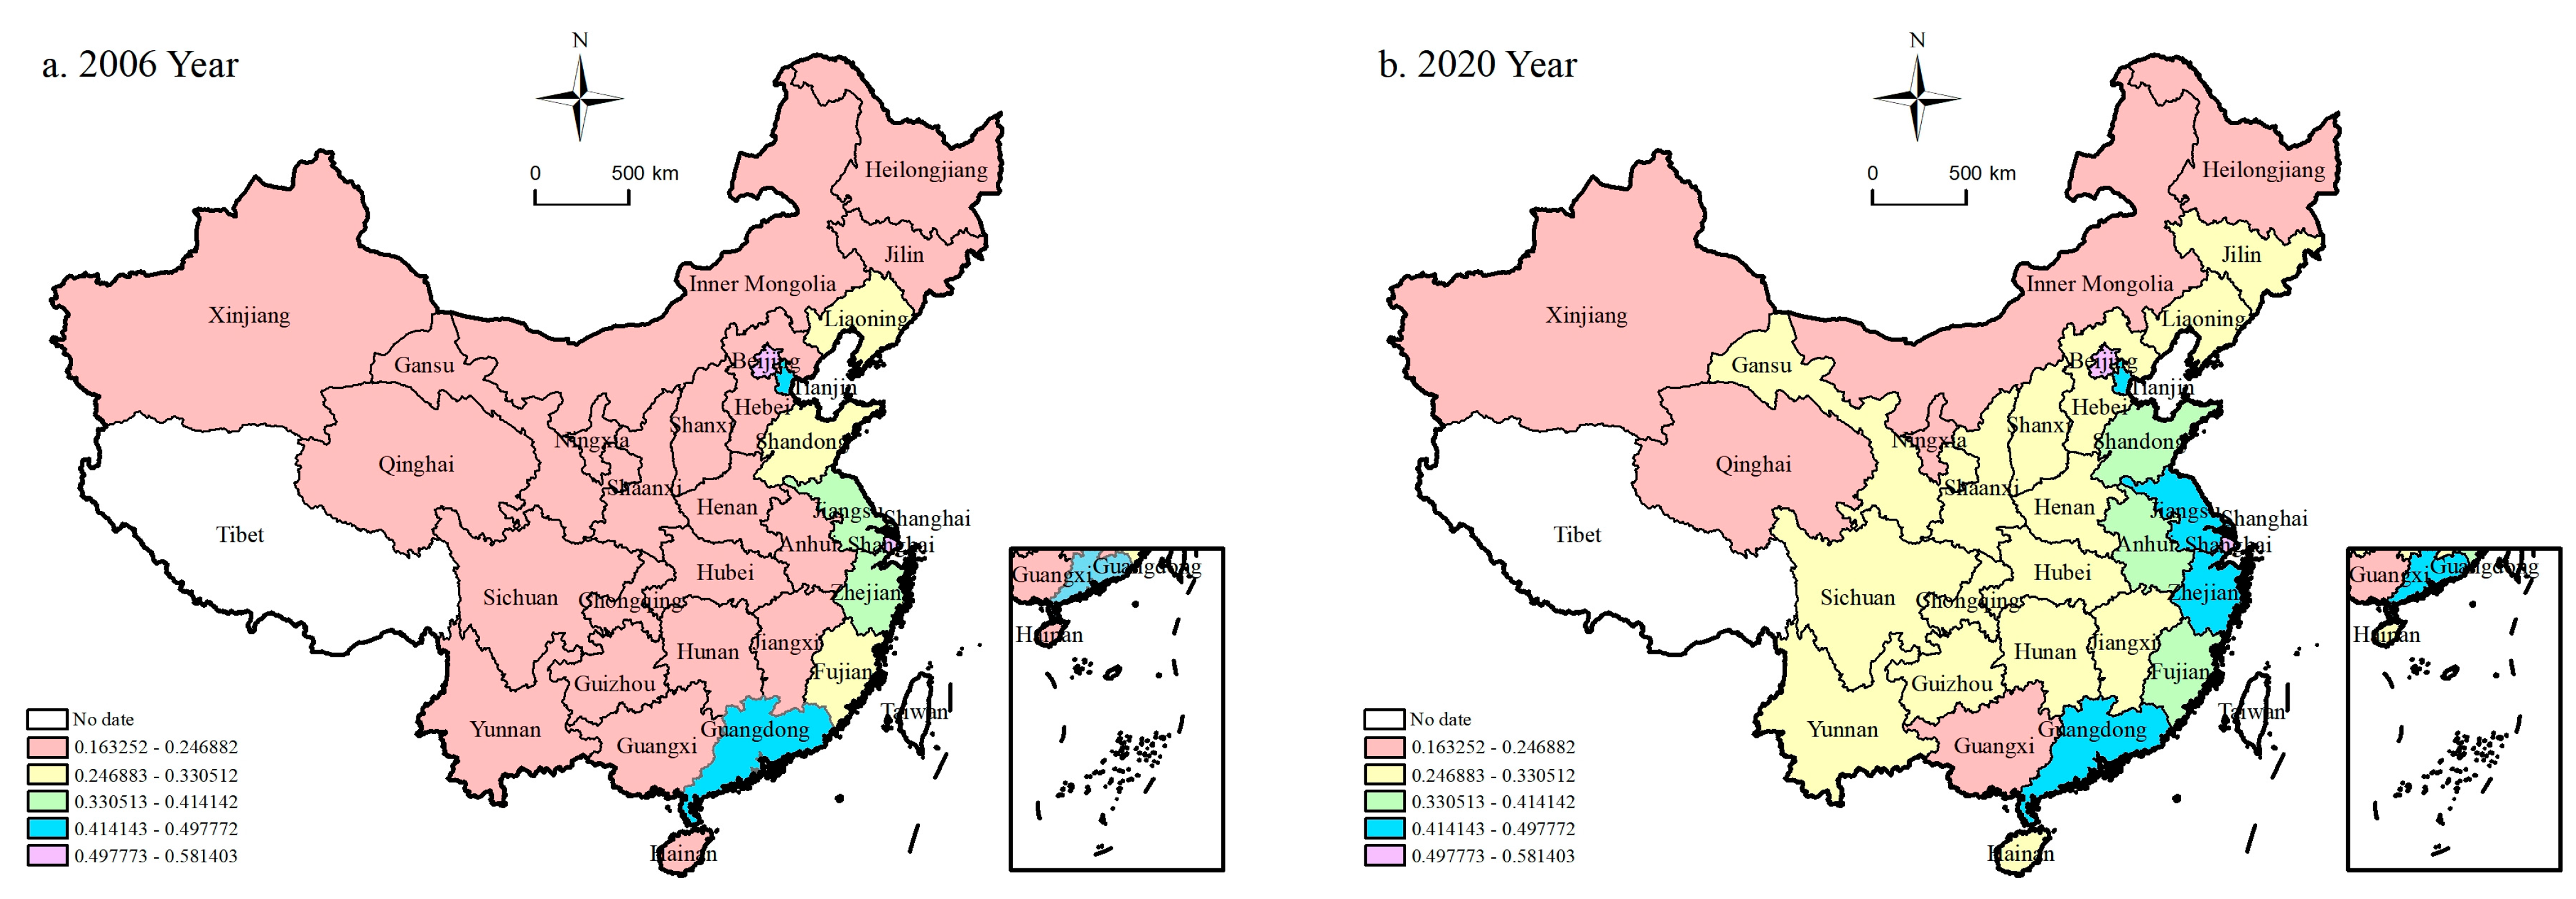
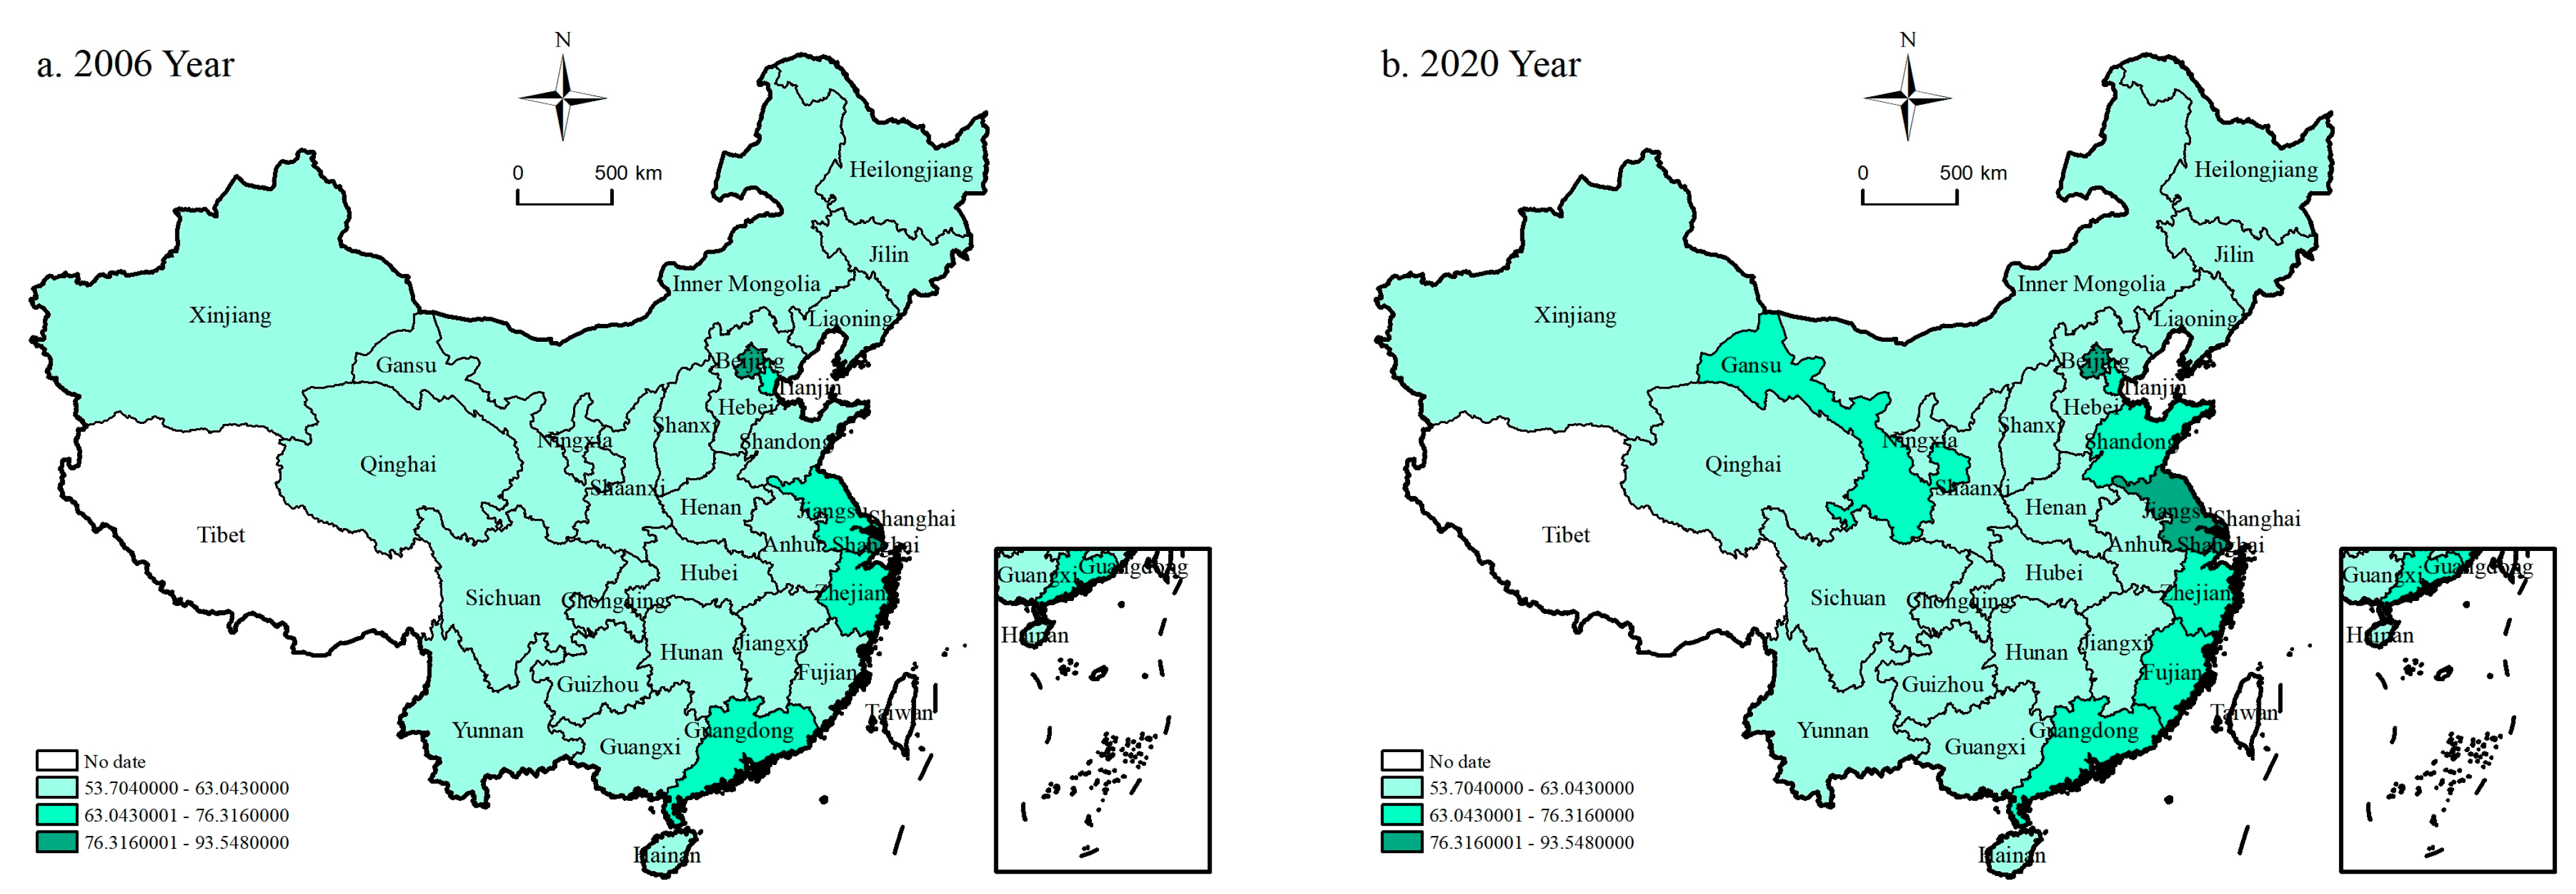
High-quality development is a multifaceted system which priorities innovation as the primary driving force. It promotes green development, enhances openness, and continuously improves the quality of people’s lives while achieving coordinated growth. Integrating multiple types of indicators into a unified system for evaluation and analysis is necessary for a comprehensive high-quality development indicator system. To attain this objectivity, it is necessary to adopt principles such as objectivity, clarity, and logical progression. In this study, a system for evaluating high-quality development is established, which is based on the five dimensions: innovation, coordination, greenness, openness, and sharing. The entropy weight method is utilized to enhance the system, which accurately indicates the all-round standard of high-quality development in China [37,38,39], as shown in Table 1.
① Innovation. The conventional development model, which relied on investment and demographic dividends, falls short of China’s demands for high-quality development. Innovation has taken over as the leading propellant. This study evaluates innovation through three aspects: innovation input, innovation output, and the innovation environment. Firstly, technical investment enhances technical competitiveness and advances the adoption of an innovation-driven development model. Therefore, “R&D personnel intensity” and “R&D funding intensity” are chosen to represent the level of innovation input. Secondly, invention patent numbers and transaction amounts within the technology market show how innovative elements apply to high-quality development. Thus, this paper presents an objective assessment of the level of innovation output in terms of “invention patents” and “technology market transaction volume”. Lastly, A favorable innovation setting is essential for realizing the utmost potential of innovative features. Therefore, the regional innovation environment is examined in light of the perspectives of “technological funding” and “high-tech industry” [40].
② Coordination. Coordination serves as both a means and a goal of development, encompassing the unity of balanced and unbalanced development. To achieve high-quality development, it is essential to coordinate the development of the industrial structure, regional structure, and economic structure. Firstly, the optimization of the industrial structure is evaluated by “industrial structure rationalization” and “industrial structure upgrading”. Secondly, coordination necessitates overall equilibrium and the attainment of balanced regional development. “Urban-rural coordination” and “inter-provincial coordination” have been selected to measure the coordination of the regional structure. Lastly, high-quality development aims to prevent significant economic fluctuations and keep unemployment rates within an acceptable range. Thus, to gauge the coherence of the economic structure, the indicators of “stable employment” and “economic fluctuations” have been selected [41].
③ Greenness. High-quality development necessitates achieving green development alongside economic growth. This report evaluates the extent of green development based on two aspects: resource utilization and environmental governance. Resource utilization is calculated by tracking “electricity consumption”, “water consumption” and “energy consumption”, which denote the levels of energy and resource consumption during economic development. Conversely, the existing state of environmental governance is evidenced by measures such as “domestic waste disposal”, “sewage treatment”, and “waste utilization”. This illustrates not only an increase in efficiency regarding resource utilization but also highlights the necessity of improving people’s quality of life.
④ Openness. Achieving high-quality development necessitates not only enhancing external openness but also hastening the exchange of factors, goods, and services between different regions. This article assesses the level of openness based on two aspects: internal and external. Internal openness predominantly covers trade, labor, capital, technology, information, and other related aspects. The degree of internal openness can be gauged by factors such as “labor mobility”, “division of labor in a region”, “passenger density” and “freight density”. External openness can be assessed through two dimensions: the environment and effectiveness of openness. Indicators such as “foreign trade dependence”, “foreign investment dependence” and “international tourism” can be used to measure these dimensions [42].
⑤ Sharing. High-quality development is indicative of a high standard of living for citizens. This article gauges inclusivity by measuring social welfare and quality of life. Six indicators that measure residents’ quality of life, including “living standards”, “transportation”, “healthcare”, “green spaces”, “education”, and “cultural engagement.” These provide insight into the people’s level of satisfaction and success pertaining to economic development. Additionally, the establishment of a social security system serves as a means of income redistribution and hence leads to inclusive development as a direct result. To illustrate, the social security system is represented by “basic endowment insurance”, “unemployment insurance”, and “basic medical insurance” [43].

3.2. Level Measure

Figure 1 presents the mean values for high-quality development across China during the period spanning from 2006 to 2020. The survey period indicated that China’s high-quality development upheld a constant upward progression with a negligible dip observed exclusively in 2020. The yearly average growth rate was 1.33%. In 2020, due to the impact of the COVID-19 pandemic and the control measures correlated to it, the Chinese economy had to face significant difficulties regarding coordinated regional growth and international accessibility. The per capita consumer expenditure of consumers displayed a minor decrease from CNY 27,504 in 2019 to CNY 27,439 in 2020, indicating a slight setback in the aspect of high-quality development.
To further examine the regional distribution of high-quality development, this study utilized ArcGIS 10.8 software to create regional maps of high-quality development in China for the years 2006 and 2020. The results are depicted in Figure 2.
The data presented in Figure 2 indicate that there was an overarching increase in China’s provincial levels of high-quality development during the period under survey, in line with the previously reported findings. More specifically, China’s high-quality development displayed a gradual decline from east to west, with eastern coastal provinces exhibiting higher levels than provinces located inland to the west. Provinces including Beijing, Tianjin, Shanghai, Zhejiang, and Guangdong demonstrate comparatively higher levels of high-quality progression, whereas those in the west, such as Xinjiang, Qinghai, and Ningxia, exhibit comparably lower levels.
In contrast, the west of the country displayed the highest growth rate for high-quality development, which was lower in the east. As a result, the regional gap between areas of high-quality development in China decreased. The central and western regions, such as Guizhou, Gansu, Yunnan, Jiangxi, and Ningxia, experienced swift high-quality development growth at an average annual rate exceeding 2.5%. In contrast, the cities of Beijing, Shanghai, and Tianjin, in the eastern region exhibited a slower pace of high-quality development, registering an average annual growth rate of less than 0.1%.
Since the introduction of China’s reform and opening up policy, the country has pursued an unbalanced regional development strategy, initially focusing on a development pattern that gradually decreases from east to west. To address this imbalance, major strategies such as “Western Development” and “Rise of Central China” were implemented, resulting in accelerated economic growth in the central and western regions and a simultaneous reduction in the regional gap. However, despite these efforts, a significant gap still exists between the central and western regions and the east in terms of innovation, greenness, and openness. This contributes to a diminished level of high-quality development.
Figure 3 illustrates the national averages for each dimension of high-quality development from 2006 to 2020. It is evident from the comparison of sub-dimensions that all dimensions, barring the openness index, have experienced a fluctuating but upward trend. Of these, the innovation dimension displayed the greatest average annual growth rate at 3.74%, while the openness dimension exhibited the lowest annual growth rate. The COVID-19 pandemic has caused a significant decline in factor flows, leading to changes in import and export trends. This has consequently hindered the progression of high-quality opening up.

4. Spatial Correlation Network

4.1. Formation Mechanism of Spatial Correlation for High-Quality Development

Since the implementation of the reform and opening-up policy, market mechanisms have increasingly influenced the economic structure of China’s regions. Factors such as production and products now experience free movement across different regions and various industries due to market forces, surpassing regional transactions. Interactions among provinces have become a significant factor in driving economic development. With the implementation of the regional coordinated development strategy for the regions and the formulation of plans for urban agglomerations, the association and interaction between different provinces and cities in China have progressively strengthened. The regional spatial linkage of economies displays complex network structures that are marked by threads and multiple centers [10,16]. Currently, promoting high-quality development necessitates a shift in development patterns and adherence to new development concepts. Specifically, this means moving away from expansion based on “quantity” towards improvements in terms of “quality”, as well as achieving coordinated regional development. To achieve this, it is necessary to pursue complementary advantages and rationalize the division of labor among regions, strengthen spatial linkages between regions from multiple perspectives, and improve spatial governance. Ultimately, this will lead to the establishment of a high-quality spatial development cycle that is well-coordinated and interconnected, thereby promoting the emergence of a novel progression pattern.
Therefore, concerning the spatial relationships of high-quality development, the spatial relationships of five dimensions provide a crucial explanation of their spatial relevance. When it comes to innovation, the acquisition of innovative factors involves both intra-regional and inter-regional flows between regional innovation systems. To maximize their own interests. High-skilled workers choose to develop their careers in areas with better development opportunities and research environments. This, in turn, enhances the flow of knowledge and innovation. Simultaneously, the unrestricted flow of innovative elements between regions can enhance resource allocation efficiency and increase total factor productivity. This, in turn, can achieve spatial relationships of high-quality development from an innovation perspective [40]. When it comes to coordination, with the implementation of policies like “Western Development” and “Central Rise”, certain industries have commenced migrating and spreading from the eastern regions to the central and western regions of China. The extended development of industrial chains not only promotes the upgrade of the industrial structure in the central and western regions, but also accelerates the establishment of an industrial synergy and agglomeration mechanism. This, in turn, promotes the spatial transmission of high-quality development. In terms of green development, the joint prevention and control mechanism for pollution has expedited efforts for the joint prevention and control of haze pollution in the Beijing–Tianjin–Hebei region and its environs, as well as in the Yangtze River Delta region and the Pearl River Delta region. These mechanisms have been established to mitigate pollution by coordinating cross-regionally, with as attention paid to fixed asset investment and reductions in industrial emissions. From the green view perspective of promoting environmentally friendly development, these efforts have bolstered the spatial relationships that are essential for attaining high standards of development. In terms of openness, the development of urban agglomerations has continuously strengthened regional connections and led to the gradual formation of a spatial economic structure characterized by industrial and value chains. This has enabled high-quality capital, talent, and technology to flow freely between regions, thereby fostering the development of a domestic economic circulation. Additionally, the “Belt and Road” initiative, which depends on multimodal transportation, has not only promoted the opening up of inland regions, it has also promoted the coordinated development of coastal and inland areas in terms of trade and transport [44]. These dynamics have augmented the spatial relationships required for achieving high-quality development. In terms of sharing, the construction of transportation infrastructure, including highways and high-speed railways, has shattered market segmentation between regions. The development of diverse transport flows has propelled the formation of inter-regional network patterns, expanding both the scope and frequency of interprovincial connections. This has enhanced the spatial connections required to attain high-quality development across provinces [45], and additionally enhanced the spillover repercussions of regional economic growth.
This study utilizes a modified gravity model to analyze the spatial correlation in high-quality development and constructs an inter-provincial spatial correlation network of high-quality development. Figure 4 portrays the spatial correlation network of China’s high-quality development in 2006 and 2020. It is evident that there is at least one correlation between any two provinces, indicating a universal spatial relationship in high-quality development. The spatial correlation network multiplies intricately with numerous interconnections.

4.2. Overall Network Structure Characteristics

Figure 5 illustrates the overall characteristics of the spatial correlation network of high-quality development. Firstly, the network density fluctuates, rising from 0.201 in 2006 to 0.223 in 2020, demonstrating that the links between provinces for high-quality development have strengthened and the relationships have become closer. Secondly, the gradient trend of the network hierarchy shows a gradual decline, as demonstrated by it maintaining a level of approximately 0.43 from 2006 to 2014, reducing to 0.34 from 2015 to 2016, and further decreasing to 0.24 after 2016. This indicates a gradual breakdown of the hierarchical spatial network structure and the emergence of a new situation of integration and interaction. Thirdly, the fluctuation in network efficiency has decreased by 3.02%, and the number of spatial correlations increased from 175 in 2006 to 194 in 2020. This indicates an increase in the spatial spillover channel of high-quality development among provinces and a further strengthening of the stability of the spatial correlation network.

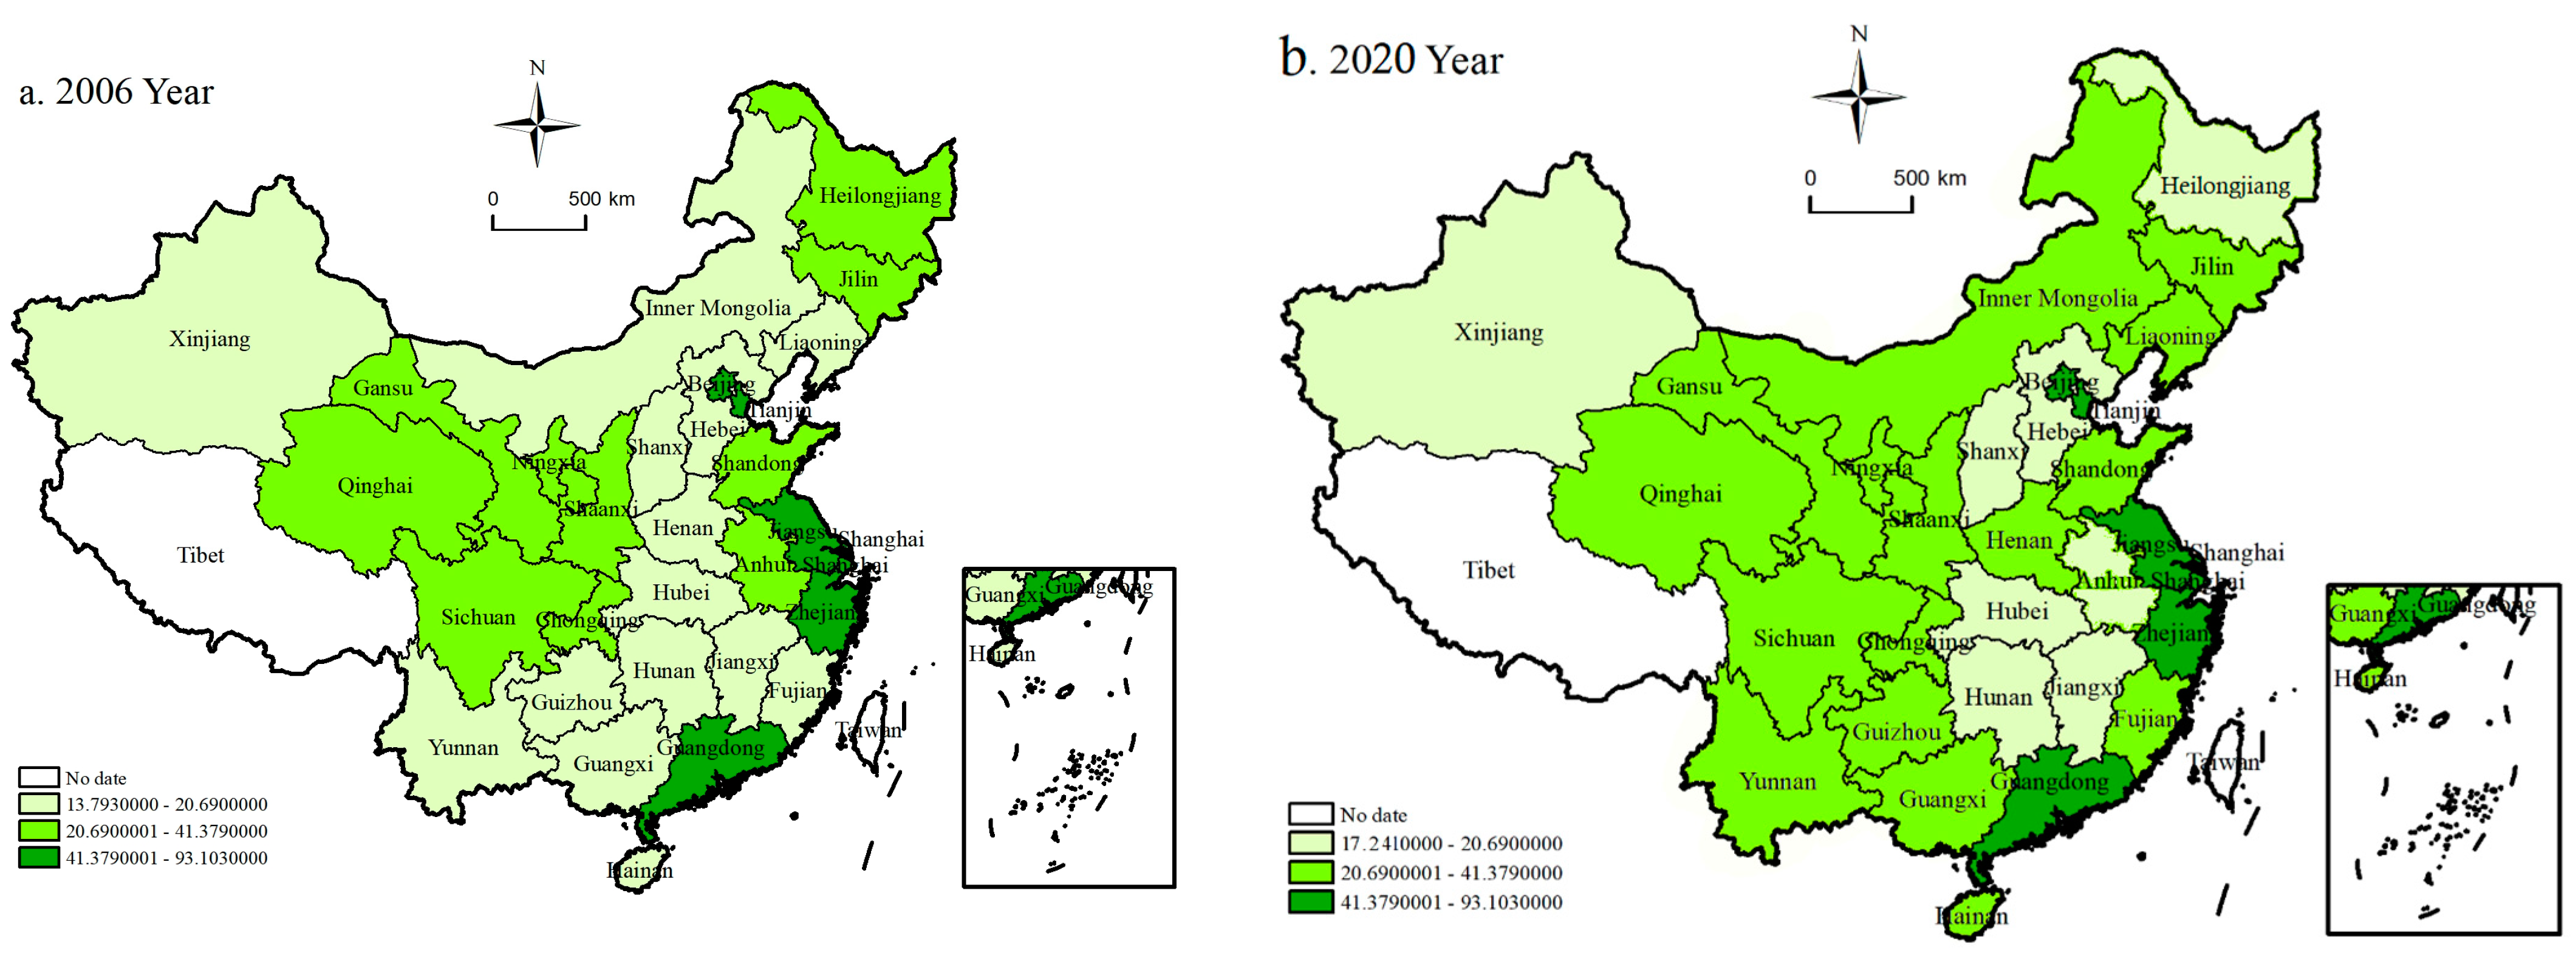
4.3. Individual Network Structure Characteristics

  • Degree Centrality
Figure 6 illustrates the spatial distribution of degree centrality in 2006 and 2020. The degree centrality of the spatial correlation network shows a high distribution trend in the east and a low distribution trend in the west. The eastern region holds significant way within the spatial correlation network of high-quality development. Conversely, the central and western regions possess limited connections with other provinces, thereby assuming a subordinate role in the spatial correlation network of high-quality development. During the investigation period, there was a significant increase in the degree centrality of the central and western regions due to the growth of links with other provinces. Consequently, their position within the spatial correlation network for high-quality development substantially improved.
2.
Betweenness Centrality
Figure 7 illustrates the spatial distribution of betweenness centrality for the years 2006 and 2020. The distribution of intermediary centrality showed insignificant changes in 2020 compared to 2006. This implies that the economically thriving eastern region still dominates as the “bridge” region in the correlation networks for high-quality development. Conversely, provinces situated in the border regions tend to receive lower rankings. Shanghai holds the top spot with a mean value of 19.559. As a hub for international economics, finance, trade, shipping, and technological innovation, Shanghai serves as a notable market intermediary that connects the circulation of both domestic and international economies.
3.
Closeness Centrality
Figure 8 illustrates the spatial distribution of closeness centrality in 2006 and 2020. It can be inferred that the eastern coastal area possesses greater leverage in the spatial correlation networks for promoting high-quality development. Contrarily, Xinjiang, Liaoning, and Inner Mongolia exhibit significantly lower closeness. This indicates that these regions have limited direct connections with other provinces, leading to a decreased spatial spillover effect of development achievements. These regions are viewed as peripheral players in the spatial association network of high-quality development.

4.4. Spatial Agglomeration Characteristics

In this study, we utilized the CONCOR method to perform block model analysis of high-quality development in 30 provinces and municipalities, using 2020 as our example. The provinces and cities were categorized into four sections or categories, as outlined in Table 2, based on a concentration standard of 0.2 and a maximum segmentation depth of 2. The specific distribution is as follows: Section I, referred to as the main beneficiary sector, is comprised of five provinces and cities. Beijing, Tianjin, Jiangsu, Zhejiang, and Shanghai are included in Section I. Section II, known as the broker sector, comprises three provinces and cities: Guangdong, Chongqing, and Fujian. Section III, referred to as the bidirectional overflow sectors, encompasses eight provinces, specifically Inner Mongolia, Hebei, Heilongjiang, Shaanxi, Liaoning, Shandong, Henan, and Jilin. Section IV, known as the net overflow sector, comprises 14 provinces including Jiangxi, Hubei, Hunan, Guangxi, Hainan, Anhui, Sichuan, Guizhou, Yunnan, Shanxi, Gansu, Qinghai, Ningxia, and Xinjiang.
The main beneficiary sector (Section I) demonstrates substantial spillover effects on the bidirectional overflow sector (Section III) and is influenced by spillovers from the other remaining three sections. Therefore, it follows those provinces and cities with more advanced levels of development will have a higher likelihood of engaging with others and obtaining resource output. There is a strong spillover effect between the broker sector (Section II) and the net overflow sector (Section IV), which may be attributed to their geographical proximity, facilitating collaboration, idea exchange, talent exchange, and easier technological innovation sharing. Moreover, there are notable differences in network density across various sections, indicating that there is ample room for enhancing correlation relationships among and between sections.

5. Analysis of Driving Factors

From a systemic perspective, the spatial correlation of high-quality development is significantly influenced not only by the evolution of internal factors in regional linkages, but also by the evolution of external factors in these linkages. This phenomenon results from the interconnectedness and interaction among various factors. Therefore, this study constructs binary relation matrices to analyze high-quality development and its driving factors. The research investigates the causal links between high-quality development and spatial correlation, considering both endogenous and exogenous perspectives.

5.1. Specification of Variables

This paper investigates five internal factors that affect high-quality development: innovation, coordination, greenness, openness, and sharing. These factors are analyzed through an index system of high-quality development. ① Innovation. There is a clear spatial correlation in innovation spillovers, which in turn accelerates the establishment of regional cooperation networks for innovation, contributing to the attainment of spatial correlation in high-quality development [12]. ② Coordination. As regional strategies are advanced, the creation of synergetic industrial agglomeration mechanisms is hastened, thereby fostering the spatial propagation of high-quality development. ③ Greenness. Joint pollution prevention and control efforts can create a trans-regional mechanism for cooperation in reducing industrial emissions, thus strengthening the spatial correlation in high-quality development [46]. ④ Openness. The “Belt and Road” strategy utilizes multimodal transportation to open up inland areas and drive coordinated development of both coastal and inland regions. This, in turn, reinforces high-quality development’s spatial connectivity. ⑤ Share. On the one hand, the construction of infrastructure such as public transport reduces market segmentation between regions, extending the range and frequency of inter-provincial connections. On the other hand, the ongoing progress of social security also promotes inter-regional talent exchange, ultimately augmenting the spillover effect of regional economic growth [47].
The study investigates five external factors: local protection, financial development, social consumption, convenient transportation, and population agglomeration. The proxy variable settings for each of these factors are detailed in Table 3. ① Local Protectionism (Protection). Local protectionist mechanisms can lead to market segmentation, higher production costs, and impede economic development exchange between regions [48]. Therefore, such mechanisms are not conducive to the formation of a high-quality spatial correlation network for development. ② Financial Development (Finance). Interregional financial development links can aid the unrestricted movement of production factors and enhance the effectiveness of resource allocation. Furthermore, they assist in optimizing and upgrading industrial infrastructure, which can leverage the spillover effect of regional economic growth [49]. ③ Social Consumption (Consumption). Consumer demand is essential for driving economic growth and enhancing economic stability [50]. The expansion of social consumption demand leads to increased effective demand, which, in turn, promotes supply-side structural reform and strengthens the spatial correlation of high-quality development to a certain extent. ④ Convenient Transportation (Traffic). Whilst transportation infrastructure can have a sizeable multiplier effect that promotes high-quality regional development, it can also reduce transportation costs of production factors. This strengthens the market proximity between regions and expands the spatial linkage of high-quality development. ⑤ Population Agglomeration (Agglomeration). Population is a fundamental driving force of economic growth. Population agglomeration facilitates a greater division of labor and enhances labor efficiency [51]. Furthermore, the spatial migration caused by population agglomeration enhances the spatial spillover of production factors, knowledge, and technology, thereby fostering a spatial link between regions that leads to high-quality development.

5.2. QAP Correlation Analysis

To investigate the correlation between driving factors and high-quality development (HQD), this study employed QAP correlation analysis integrating both internal and external factors. The findings are illustrated in Table 4 and Table 5.

5.2.1. Internal Driving Factors

Table 6 presents the results of QAP correlation analysis focusing on intrinsic drivers linked to high-quality development spaces. The correlation coefficients between the binary relationship matrix of Innovation, Coordination, Greenness, Openness, Sharing and the binary relationship matrix of HQD are all greater than 0.95, meeting the significance level test of 1%. Within the sample period, a strong correlation was discovered between the spatial correlation of high-quality development and that of Innovation, Coordination, Greenness, Openness and Sharing.

5.2.2. External Driving Factors

Table 7 illustrates the outcomes of QAP correlation analysis on external driving factors in relation to the high-quality development space. All correlations between the binary relationship matrix of Protection, Finance, Consumption, Traffic, Agglomeration and the binary relationship matrix of HQD exceed 0.90 and meet the significance level threshold of 1%. During the sample period, a positive spatial correlation was found between high-quality development and various factors such as local protection, financial development, social consumption, convenient transportation, and population agglomeration.

5.3. QAP Regression Analysis

The aforementioned research suggests a correlation between internal and external driving factors and the spatial distribution of high-quality development. Thus, this study employs QAP regression analysis to examine the driving factors that affect the spatial correlation of high-quality development. The regression results are illustrated in Table 6 and Table 7.

5.3.1. Internal Driving Factors

Table 6 shows that, with the exception of Coordination, all four dimensions, namely Innovation, Greenness, Openness, and Sharing, exhibit positive standardized regression coefficients that are statistically significant at the 1% level. This suggests that the spatial correlation of these dimensions plays a significant role in promoting spatial linkages for high-quality development. Among them, the Sharing dimension has the highest contribution, as evidenced by its maximum standardized regression coefficient of 0.625. This indicates that the spatial correlation of people’s sharing of livelihoods has the most significant impact on high-quality development. The second most influential dimensions are Openness and Innovation, with standardized regression coefficients of 0.154 and 0.142, respectively. On the other hand, the Greenness dimension has the least influence on the spatial correlation of high-quality development, as evidenced by its relatively low standardized regression coefficient of 0.061.
There are two aspects to the dimension of Sharing. First, comprehensive support for the construction of transport infrastructure plays a key role in enhancing transport accessibility and facilitating the efficient flow of resources between regions, thereby strengthening the spatial correlation of high-quality development [51]. Second, the joint construction and sharing of public services, such as health care, is crucial for breaking down geographical boundaries and reducing “social distance” between regions. This collaborative approach helps to establish a spatial network for high-quality development. It is therefore important to enhance the interconnection between regions in terms of public services. This will promote the formation of a regional economic layout characterized by complementary advantages and high-quality development.

5.3.2. External Driving Factors

Based on Table 7, the standardized regression coefficients for Finance, Consumption and Traffic are all positive and pass the 1% significance level test. This suggests that the spatial correlation of financial development, social consumption and convenient transportation among regions is the main driving force behind a high-quality spatial correlation network. Among the three variables, Finance has the largest regression coefficient, indicating that interregional financial connectivity has the greatest impact on the spatial correlation network for high-quality development. Interregional capital flows can improve the efficiency of industrial structure. Additionally, financial linkage has a strong spillover effect, which helps to reduce regional disparities and facilitates regionally coordinated development.
In contrast, the regression coefficients of Protection and Agglomeration are negative and pass the significance test at 1%. This suggests that excessive local protection behavior and a high level of population agglomeration are not conducive to improving the spatial correlation of high-quality development. Specifically, the regression coefficient for Protection is −0.254, indicating that local protectionism has the greatest inhibitory effect on the spatial correlation of high-quality development. Local protectionism tends to lead to market segmentation, which hinders the smooth flow of products and factors between regions and ultimately weakens the spatial correlation of high-quality development [48].

6. Conclusions and Policy Recommendations

Based on the new development concept, this research constructs an evaluation system of high-quality development indicators to measure the level of China’s high-quality development from 2006 to 2020. It comprehensively examines the spatial correlation network and its characteristics of high-quality development through social network analysis. It also explores the driving factors of this network from both internal and external perspectives with the help of QAP. The following conclusions are drawn:
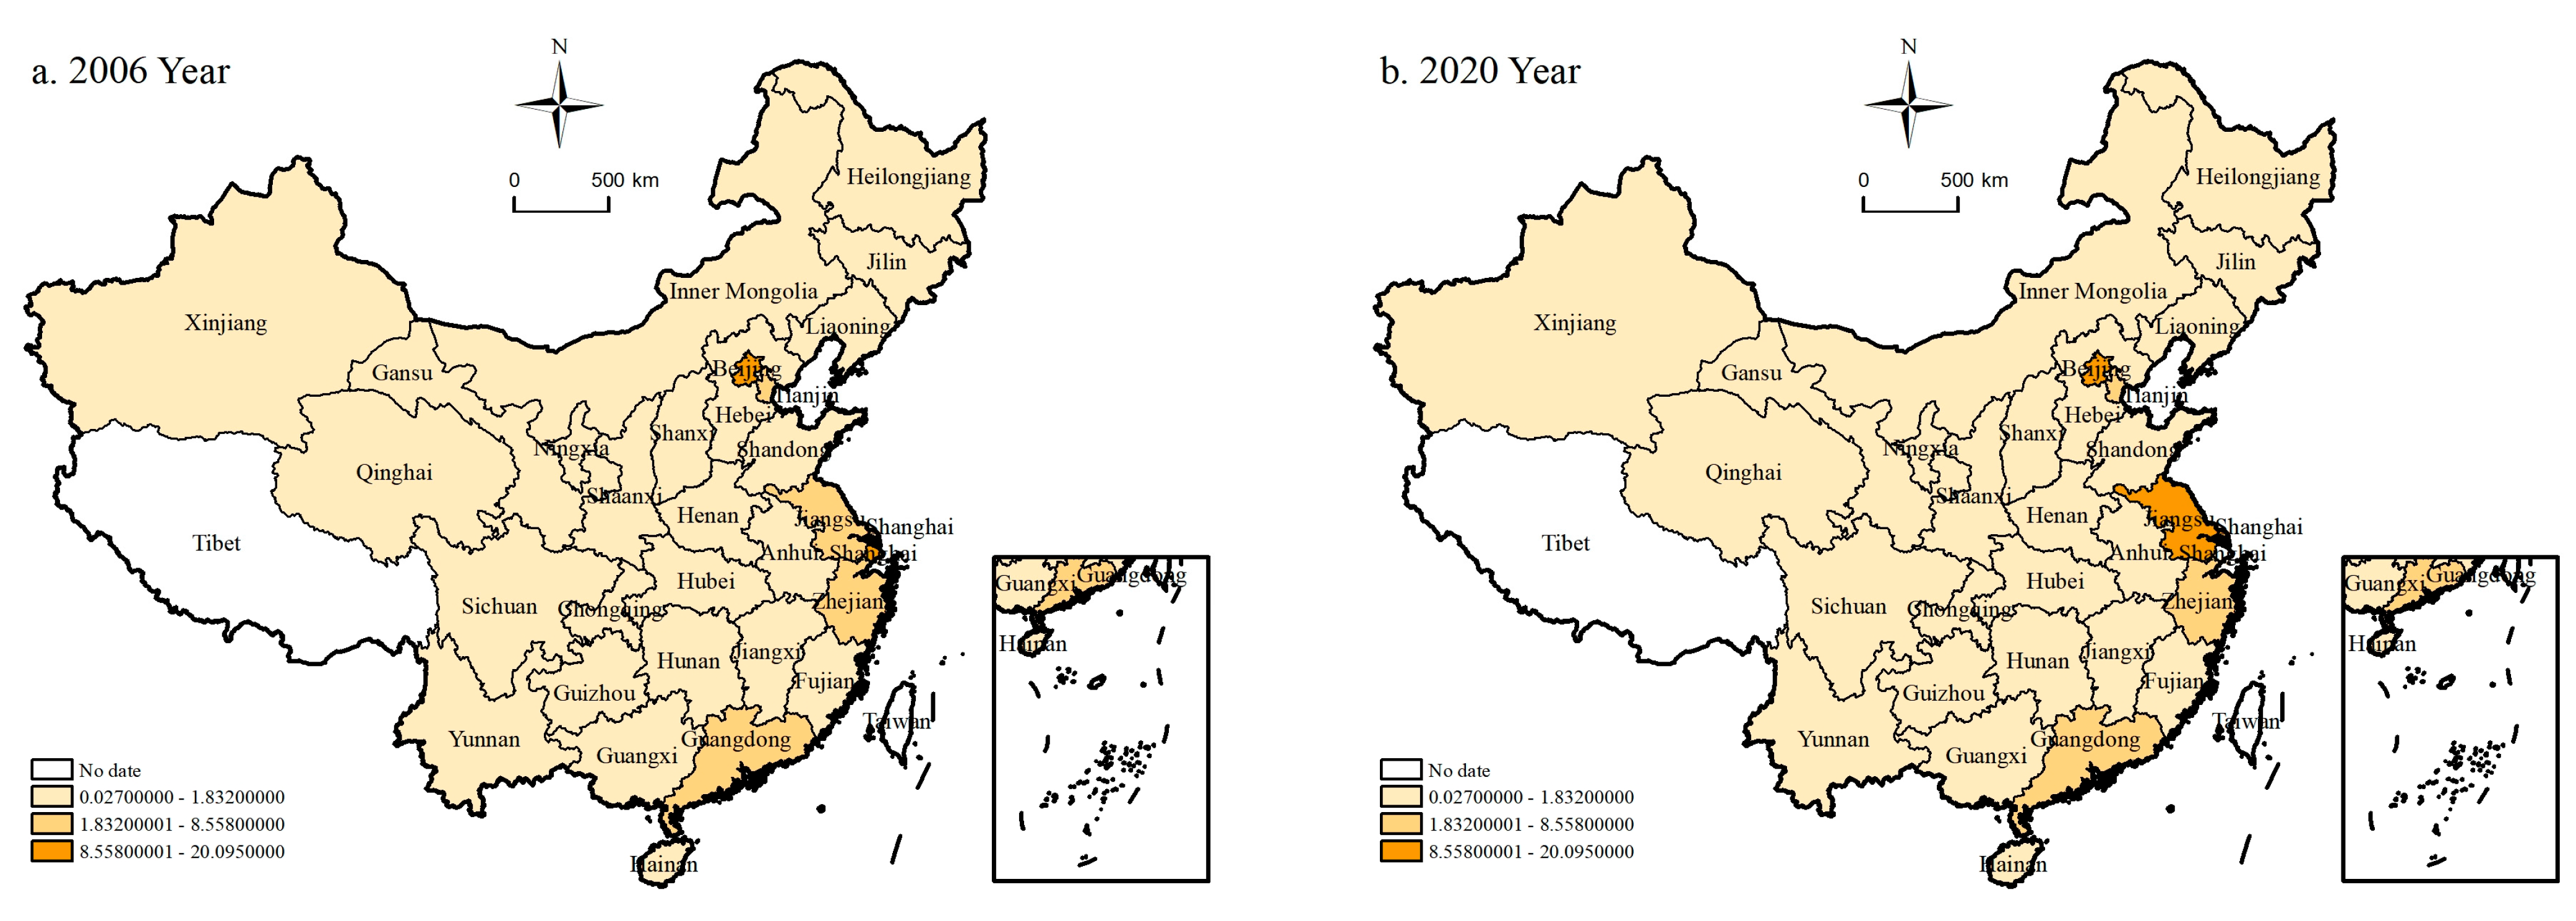
During the study period, China’s overall high-quality development level maintained a steady growth trend, and the spatial correlation network became more dense. In terms of overall network characteristics, there was an increasing fluctuation in network density, while network hierarchy and network efficiency showed a decreasing trend. Interprovincial high-quality development also gradually strengthened.
Looking at individual networks, there were significant differences in the centrality of each province. Shanghai, Beijing, and Jiangsu exhibited high centrality and exerted a strong influence in the spatial correlation network for high-quality development, thus, they can be considered central actors in the network. Alternatively, Inner Mongolia, Liaoning, and Xinjiang possess fewer direct connections with other provinces, rendering it difficult for them to exert control and dominate over other provinces. Consequently, these provinces hold the status of marginal actors within the spatial correlation network.
Through block model analysis, it was found that there were notable spatial correlations and spillover effects among the spatially related plates of high-quality development. Section I, recognized as the main beneficiary sector, is concentrated mainly in the eastern and northern coastal regions. Section II, known as the broker sector, is primarily situated in the southern coastal areas. Section III, referred to as the bidirectional overflow sector, is mainly concentrated in the middle Yellow River and northeast areas. Finally, Section IV, known as the net overflow sector, is mainly concentrated in the middle Yangtze River, northwest, and southwest areas.
After conducting the QAP method analysis, it is evident that the spatial correlation of high-quality development is significantly correlated with both internal and external drivers during the sample study period. In terms of internal drivers, the spatial correlation of “innovation”, “greenness”, “openness” and “sharing” were identified as the primary driving forces behind the spatial correlation of high-quality development, with “sharing” having the most significant influence. Regarding external factors, it was discovered that advancements in financial development, social consumption, and convenient transport significantly bolster the spatial correlation of high-quality development. Conversely, local protectionism and the effects of population agglomeration do not contribute to the improving of spatial correlation for high-quality development.
Based on the above analysis, the following conclusions can be drawn:
Firstly, it is essential to improve the spatial connectivity of high-quality development and to elevate the level of high-quality development across the board. Active measures should be taken to explore effective approaches that facilitate the spatial correlation of high-quality development. This involves investigating methods to promote a system of spatial correlation in high-quality development via scientific and technological innovation, eco-friendly development, and the fair distribution of benefits among the population. It is also important to boost regional connections and gradually dismantle hierarchical barriers within the network. Priority should be given to the continuous improvement of infrastructure, including comprehensive transport networks and information systems. These measures will promote improved collaboration amongst regions and facilitate high-quality development with spatial correlations.
Secondly, it is imperative to adopt a distinguishable development approach to gradually decrease regional inequalities. This can be achieved by utilizing the provinces’ diverse roles in the spatial correlation network of high-quality development. By endorsing rational labor division and mutual promotion, a new state of high-quality development can be realized. Provinces with high betweenness centrality should fully utilize the role of “bridge” in overflow relationships to facilitate the flow of different elements among various regions, thus improving regional interconnection and market accessibility. For provinces with high closeness centrality, they should leverage their proximity to other provinces in the spatial correlation. An inter-provincial mechanism should be established, promoting basic public services, employment, and social security, in order to form a regional economic structure characterized by complementary advantages and high-quality development. Provinces located in both “two-way spillover plates” and “net spillover plates” should take proactive steps to improve infrastructure by enhancing infrastructure and strengthening spillover relationships between plates. This will ultimately provide a late-comer advantage for high-quality development.
Thirdly, it is important to improve financial cooperation mechanisms and decrease local protectionist behaviors. We must strive to streamline the movement of financial resources across regions, which can be accomplished by maximizing the agglomeration and radiation effects of major cities in financial development. Strengthening the capacity for financial cooperation, establishing a comprehensive financial service network, and enhancing the spatial spillover effects of financial development are essential actions to take in this regard. It is also necessary to move away from excessive government intervention in economic activities. Eliminating local protectionism and dismantling market segmentation to encourage the free movement of production factors across regions are measures that will assist in creating a unified national market.
This paper may have some limitations. First, it should be acknowledged that the definition and scope of high-quality development is continually evolving with the ongoing development of the economy. Thus, the high-quality development system might benefit from additional research studies to further enrich it. Second, future research could be broadened to explore the high-quality development of other spatial correlation networks, including those of countries located along the “Belt and Road” and OECD countries. These efforts can contribute to the comprehensive and thorough development of economic globalization.

Author Contributions

Conceptualization, M.C., Q.L. and J.L.; methodology, B.Z.; software, B.Z.; validation, Q.L. and L.X.; formal analysis, M.C.; investigation, Q.L. and L.X.; resources, Y.G.; data curation, B.Z.; writing—original draft preparation, M.C. and Q.L.; writing—review and editing, B.Z., L.X. and J.L.; visualization, Z.L.; supervision, M.C.; project administration, Q.L.; funding acquisition, Z.L. and Y.G. All authors have read and agreed to the published version of the manuscript.

Funding

This research was funded by National Social Science Foundation (grant number 22BJY191).

Institutional Review Board Statement

Not applicable.

Informed Consent Statement

Not applicable.

Data Availability Statement

All data covered in this paper are available from the corresponding author upon request.

Acknowledgments

The authors would like to thank the editors and reviewers for their insightful comments and efforts toward improving this manuscript.

Conflicts of Interest

The authors declare no conflict of interest.

References

  1. Qu, Y.B.; Wang, S.L.; Tian, Y.Y.; Jiang, G.H.; Zhou, T.; Meng, L. Territorial spatial planning for regional high-quality development: An analytical framework for the identification, mediation and transmission of potential land utilization conflicts in the Yellow River Delta. Land Use Policy 2023, 125, 106462. [Google Scholar] [CrossRef]
  2. Chen, Y.; Yang, R.; Wong, C.W.Y.; Miao, X. Environmental performance of china’s economic system: Integrative perspective of efficiency and productivity. Technol. Econ. Dev. Econ. 2022, 28, 743–774. [Google Scholar] [CrossRef]
  3. Chen, L.; Huo, C. The Measurement and Influencing Factors of High-Quality Economic Development in China. Sustainability 2022, 14, 9293. [Google Scholar] [CrossRef]
  4. Martinez, M.; Mlachila, M. The Quality of the Recent High-Growth Episode in Sub-Saharan Africa. IMF Work. Pap. 2013, 13. [Google Scholar] [CrossRef]
  5. Mlachila, M.; Tapsoba, R.; Tapsoba, S.J.A. A quality of growth index for developing countries: A proposal. Soc. Indic. Res. 2017, 134, 675–710. [Google Scholar] [CrossRef]
  6. Huang, X.; Cai, B.; Li, Y. Evaluation Index System and Measurement of High-quality Development in China. Rev. Cercet. Interv. Soc. 2020, 68, 163–178. [Google Scholar] [CrossRef]
  7. Li, N.; Song, Y.; Xia, W.; Fu, S.-N. Regional Transportation Integration and High-Quality Economic Development, Coupling Coordination Analysis, in the Yangtze River Delta, China. Systems 2023, 11, 279. [Google Scholar] [CrossRef]
  8. Li, X.; Tan, Y.; Tian, K. The Impact of Environmental Regulation, Industrial Structure, and Interaction on the High-Quality Development Efficiency of the Yellow River Basin in China from the Perspective of the Threshold Effect. Int. J. Environ. Res. Public Health 2022, 19, 14670. [Google Scholar] [CrossRef]
  9. Hua, X.; Lv, H.; Jin, X. Research on High-Quality Development Efficiency and Total Factor Productivity of Regional Economies in China. Sustainability 2021, 13, 8287. [Google Scholar] [CrossRef]
  10. Hu, S.; Yang, H.; Cai, B.; Yang, C. Research on spatial economic structure for different economic sectors from a perspective of a complex network. Phys. A-Stat. Mech. Its Appl. 2013, 392, 3682–3697. [Google Scholar] [CrossRef]
  11. Li, D.; Wei, Y.D.; Wang, T. Spatial and temporal evolution of urban innovation network in China. Habitat Int. 2015, 49, 484–496. [Google Scholar] [CrossRef]
  12. Tian, X.; Wang, J. Research on Spatial Correlation in Regional Innovation Spillover in China Based on Patents. Sustainability 2018, 10, 3090. [Google Scholar] [CrossRef]
  13. Peng, B.; Wang, Y.; Wei, G. Energy eco-efficiency: Is there any spatial correlation between different regions? Energy Policy 2020, 140, 111404. [Google Scholar] [CrossRef]
  14. Dong, J.; Li, C. Structure characteristics and influencing factors of China’s carbon emission spatial correlation network: A study based on the dimension of urban agglomerations. Sci. Total Environ. 2022, 853, 158613. [Google Scholar] [CrossRef] [PubMed]
  15. Sun, Z.; Guan, H.; Zhao, A. Research on the Synergistic Effect of the Composite System for High-Quality Development of the Marine Economy in China. Systems 2023, 11, 282. [Google Scholar] [CrossRef]
  16. Yu, G.; He, D.; Lin, W.; Wu, Q.; Xiao, J.; Lei, X.; Xie, Z.; Wu, R. China’s Spatial Economic Network and Its Influencing Factors. Complexity 2020, 2020, 6352021. [Google Scholar] [CrossRef]
  17. Zhuang, H.; Lin, H.; Zhong, K. Spatial spillover effects and driving factors of regional green innovation efficiency in china from a network perspective. Front. Environ. Sci. 2022, 10, 997084. [Google Scholar] [CrossRef]
  18. Feng, Z.; Chen, Z.; Cai, H.; Yang, Z. Evolution and influencing factors of the green development spatial association network in the Guangdong-Hong Kong-Macao greater bay area. Technol. Econ. Dev. Econ. 2022, 28, 716–742. [Google Scholar] [CrossRef]
  19. Zhang, Y.; Wang, T.; Supriyadi, A.; Zhang, K.; Tang, Z. Evolution and Optimization of Urban Network Spatial Structure: A Case Study of Financial Enterprise Network in Yangtze River Delta, China. ISPRS Int. J. Geo-Inf. 2020, 9, 611. [Google Scholar] [CrossRef]
  20. Sun, T.; Ding, S.; Xu, X. An iterative stacked weighted auto-encoder. Soft Comput. 2021, 25, 4833–4843. [Google Scholar] [CrossRef]
  21. Yang, L.; Wang, J.; Yang, Y. Spatial evolution and growth mechanism of urban networks in western China: A multi-scale perspective. J. Geogr. Sci. 2022, 32, 517–536. [Google Scholar] [CrossRef]
  22. Fan, J.; Xiao, Z. Analysis of spatial association network of China’s green innovation. J. Clean. Prod. 2021, 299, 126815. [Google Scholar] [CrossRef]
  23. Kuik, O.; Branger, F.; Quirion, P. Competitive advantage in the renewable energy industry: Evidence from a gravity model. Renew. Energy 2019, 131, 472–481. [Google Scholar] [CrossRef]
  24. Liu, G.; Yang, Z.; Fath, B.D.; Shi, L.; Ulgiati, S. Time and space model of urban pollution migration: Economy-energy-environment nexus network. Appl. Energy 2017, 186, 96–114. [Google Scholar] [CrossRef]
  25. Wang, J.; Gao, X.; Jia, R.; Zhao, L. Evaluation Index System Construction of High-Quality Development of Chinese Real Enterprises Based on Factor Analysis and AHP. Discret. Dyn. Nat. Soc. 2022, 2022, 8733002. [Google Scholar] [CrossRef]
  26. Li, Y.; Li, Y.; Pan, A.; Pan, X.; Veglianti, E. The Network Structure Characteristics and Determinants of the Belt & Road Industrial Robot Trade. Emerg. Mark. Financ. Trade 2022, 58, 1491–1501. [Google Scholar] [CrossRef]
  27. Aplin, L.M.; Farine, D.R.; Morand-Ferron, J.; Cockburn, A.; Thornton, A.; Sheldon, B.C. Experimentally induced innovations lead to persistent culture via conformity in wild birds. Nature 2015, 518, 538–541. [Google Scholar] [CrossRef]
  28. Lv, K.; Feng, X.; Kelly, S.; Zhu, L.; Deng, M. A study on embodied carbon transfer at the provincial level of China from a social network perspective. J. Clean. Prod. 2019, 225, 1089–1104. [Google Scholar] [CrossRef]
  29. Sun, Q.; Tang, F.; Tang, Y. An economic tie network-structure analysis of urban agglomeration in the middle reaches of Changjiang River based on SNA. J. Geogr. Sci. 2015, 25, 739–755. [Google Scholar] [CrossRef]
  30. Lusher, D.; Johan, K.; Garry, R. Exponential Random Graph Models for Social Networks: Theory, Methods, and Applications; Cambridge University Press: London, UK, 2012. [Google Scholar]
  31. Krackhardt, D. Graph Theoretical Dimensions of Informal Organizations. Computational Organizational Theory; Lawrence Erlbaum Associates Inc.: Hillsdale, NJ, USA, 1994; pp. 89–111. [Google Scholar]
  32. Freeman, L.C.; Borgatti, S.P.; White, D.R. Centrality in valued graphs: A measure of betweenness based on network flow. Soc. Netw. 1991, 13, 141–154. [Google Scholar] [CrossRef]
  33. Costenbader, E.; Valente, T.W. The stability of centrality measures when networks are sampled. Soc. Netw. 2003, 25, 283–307. [Google Scholar] [CrossRef]
  34. Everett, M. Social network analysis. Textbook at Essex Summer School in SSDA; University of Essex: Essex, UK, 2002. [Google Scholar]
  35. Doreian, P.; Conti, N. Social context, spatial structure and social network structure. Soc. Netw. 2012, 34, 32–46. [Google Scholar] [CrossRef]
  36. Zhang, B.; Wang, Y. The Effect of Green Finance on Energy Sustainable Development: A Case Study in China. Emerg. Mark. Finance Trade 2019, 57, 3435–3454. [Google Scholar] [CrossRef]
  37. Lin, P.-P.; Li, D.-F.; Jiang, B.-Q.; Yu, G.-F.; Wei, A.-P. Evaluating the comprehensive impacts of tourism in hainan by intergrating input-output model with mcdm methods. Technol. Econ. Dev. Econ. 2020, 26, 989–1029. [Google Scholar] [CrossRef]
  38. Zhang, F.; Tan, H.; Zhao, P.; Gao, L.; Ma, D.; Xiao, Y. What was the spatiotemporal evolution characteristics of high-quality development in China? A case study of the Yangtze River economic belt based on the ICGOS-SBM model. Ecol. Indic. 2022, 145, 109593. [Google Scholar] [CrossRef]
  39. Yu, G.; Wan, Y.; Jiang, C. Complex network analysis on provincial innovation development in China. Appl. Math. Comput. 2023, 455, 128103. [Google Scholar] [CrossRef]
  40. Mai, Q.; Bai, M.; Li, L. Study on the Dynamic Evolution and Regional Differences of the Level of High-Quality Economic and Social Development in China. Sustainability 2023, 15, 382. [Google Scholar] [CrossRef]
  41. Zhao, W.; Xu, C. Measuring the Dual Openness of Provincial Economies in China. China Soft Sci. 2005, 8, 81–90. [Google Scholar]
  42. Wang, D.; Hou, Y.; Li, X.; Huang, Y.; Wang, Y. Spatio-temporal Analysis of China’s Livelihood Development: Evidence from a Functional Index Model. Model. Appl. Spat. Anal. 2022, 15, 1493–1523. [Google Scholar] [CrossRef]
  43. Zhu, H.; Chen, S.; Irfan, M.; Hu, M.; Hu, J. Exploring the role of the belt and road initiative in promoting sustainable and inclusive development. Sustain. Dev. 2023, 1–12. [Google Scholar] [CrossRef]
  44. Wang, X.; Dong, F.; Pan, Y.; Liu, Y. Transport infrastructure, high-quality development and industrial pollution: Fresh evidence from China. Int. J. Environ. Res. Public Health 2022, 19, 9494. [Google Scholar] [CrossRef] [PubMed]
  45. Su, Y.; Yu, Y.-Q. Spatial association effect of regional pollution control. J. Clean. Prod. 2019, 213, 540–552. [Google Scholar] [CrossRef]
  46. Guo, Y.; Cao, L.; Song, Y.; Wang, Y.; Li, Y. Understanding the formation of City-HSR network: A case study of Yangtze River Delta, China. Transp. Policy 2022, 116, 315–326. [Google Scholar] [CrossRef]
  47. Young, A. The razor’s edge: Distortions and incremental reform in the People’s Republic of China. Q. J. Econ. 2000, 115, 1091–1135. [Google Scholar] [CrossRef]
  48. Huang, J.; Jin, H.; Ding, X.; Zhang, A. A Study on the Spatial Correlation Effects of Digital Economy Development in China from a Non-Linear Perspective. Systems 2023, 11, 63. [Google Scholar] [CrossRef]
  49. Kim, Y.K.; Setterfield, M.; Mei, Y. A theory of aggregate consumption. Eur. J. Econ. Econ. Policies Interv. 2014, 11, 31–49. [Google Scholar] [CrossRef]
  50. Ehrlich, I.; Lui, F. The problem of population and growth: A review of the literature from Malthus to contemporary models of endogenous population and endogenous growth. J. Econ. Dyn. Control. 1997, 21, 205–242. [Google Scholar] [CrossRef]
  51. Liu, T.-Y.; Su, C.-W. Is transportation improving urbanization in China? Socio-Econ. Plan. Sci. 2021, 77, 101034. [Google Scholar] [CrossRef]
Figure 1. High-quality development level in 2006–2020.
Sustainability 15 15738 g001
Figure 2. Spatial map of China’s High-quality development: (a) 2006, (b) 2020.
Sustainability 15 15738 g002
Figure 3. Dimension of high-quality development level in 2006–2020.
Sustainability 15 15738 g003
Figure 4. Spatial correlation network of high-quality development: (1) 2006, (2) 2020.
Sustainability 15 15738 g004
Figure 5. Overall network structure characteristics of spatial correlation in 2006–2020.
Sustainability 15 15738 g005
Figure 6. Spatial map of degree centrality: (a) 2006; (b) 2020.
Sustainability 15 15738 g006
Figure 7. Spatial map of betweenness centrality: (a)—2006 year; (b)—2020 year.
Sustainability 15 15738 g007
Figure 8. Spatial map of closeness centrality: (a) 2006; (b) 2020.
Sustainability 15 15738 g008
Table 1. High-quality development evaluation system.
DimensionFirst Level Second Level Indicators
InnovationInnovation
input
R&D personnel input level (+) R&D personnel FTE per year-end resident population
R&D funding intensity (+) R&D expenditure as a percentage of GDP
Innovation
output
Invention patents (+) Granted invention patents per year-end resident population
Technology market transaction volume (+) Technology market turnover as a percentage of GDP
Innovation
environment
Technological funding (+) S and T expenditure as a percentage of
local general public budget expenditure
High-tech industry (+) The proportion of high-tech industry enterprises in a region to the overall number of such enterprises nationwide
CoordinationIndustrial
structure
Industrial structure
rationalization (+)
Index of industrial structure rationalization
Industrial structure upgrading (+) Index of industrial structure upgrading
Regional
structure
Urban-rural coordination (+) Rate of urbanization
Inter-provincial coordination (+) Per capita GDP of a region as a percentage of the national
per capita GDP
Economic
structure
Stable employment (−) Registered urban unemployment rate
Economic fluctuations (−) Economic volatility
GreennessUtilization of
resources
Electricity consumption (−) Electricity consumption as a percentage of GDP
Water consumption (−) Total water consumption as a percentage of GDP
Energy consumption (−) Total energy consumption as a percentage of GDP
Environmental governanceDomestic waste disposal (+) Rate of harmless treatment of domestic waste
Sewage treatment (+) Rate of sewage treatment
Waste utilization (+) Overall utilization rate of general industrial solid waste
OpennessInternal
Openness
Labor mobility (+) Interregional labor mobility 1
Division of labor in a region (+) Interregional division of labor 2
Passenger density (+) Passenger turnover per unit length of transportation routes
Freight density (+) Freight turnover per unit length of transportation routes
External Openness Foreign trade dependence (+) Total import and export volume as a percentage of GDP
Foreign investment
dependence (+)
Total foreign investment as a percentage of GDP
International tourism (+) Per capita international tourism revenue
SharingQuality of life Living standards (+) GDP per capita
Transportation (+) Number of public transport vehicles per 10,000 people
Healthcare (+) Number of doctors per 10,000 people
Green spaces (+) Green park space per capita
Education (+) Number of compulsory education teachers per 10,000 people
Cultural engagement (+) Public library collections per capita
Social SecurityBasic endowment insurance (+) Coverage rate of basic endowment insurance
Unemployment insurance (+) Coverage rate of unemployment insurance
Basic medical insurance (+) Coverage rate of basic medical insurance
1 Interregional labor mobility: ((end-of-year resident population—end-of-previous-year resident population)/end-of-previous-year resident population)—population natural growth rate of the current year. 2 Interregional division of labor: (regional value added of secondary and tertiary industries/national value added of secondary and tertiary industries)/(regional GDP/national GDP).
Table 2. Spillover effects of the related spatial sectors of high-quality development.
SectionNumberIn-DegreeOut-Degree
Intra-PlateOff-PlateIntra-PlateOff-Plate
Section I56100621
Section II3021025
Section III811181134
Section IV14228287
Data source: compiled by the authors.
Table 3. External factor proxy variable settings.
VariableMeasurement Method
ProtectionThe reciprocal of (the Hoover localization coefficient multiplied by the Krugman index)
FinanceRatio of financial institution deposits and loans to regional GDP
ConsumptionTotal retail sales of consumer goods
TrafficRoad mileage per unit of land area
AgglomerationResident population per unit of land area
Table 4. QAP correlation analysis—internal driving factors.
HQDInnovationCoordinationGreennessOpennessSharing
HQD1.000 ***0.995 ***0.999 ***0.995 ***0.999 ***0.999 ***
Innovation0.995 ***1.000 ***0.993 ***0.997 ***0.992 ***0.993 ***
Coordination0.999 ***0.993 ***1.000 ***0.993 ***1.000 ***0.999 ***
Greenness0.995 ***0.997 ***0.993 ***1.000 ***0.993 ***0.994 ***
Openness0.999 ***0.992 ***1.000 ***0.993 ***1.000 ***0.999 ***
Sharing0.999 ***0.993 ***0.999 ***0.994 ***0.999 ***1.000 ***
The asterisks *** indicate the significance of passing the 1 % tests, respectively, respectively.
Table 5. QAP correlation analysis—external driving factors.
HQDProtectionFinanceConsumptionTrafficAgglomeration
HQD1.000 ***0.966 ***0.955 ***0.955 ***0.912 ***0.949 ***
Protection0.966 ***1.000 ***0.978 ***0.989 ***0.949 ***0.967 ***
Finance0.955 ***0.978 ***1.000 ***0.980 ***0.951 ***0.975 ***
Consumption0.955 ***0.989 ***0.980 ***1.000 ***0.943 ***0.972 ***
Traffic0.912 ***0.949 ***0.951 ***0.943 ***1.000 ***0.932 ***
Agglomeration0.949 ***0.967 ***0.975 ***0.972 ***0.932 ***1.000 ***
The asterisks *** indicate the significance of passing the 1 % tests, respectively, respectively.
Table 6. QAP regression results—internal driving factors.
VariableUn-Stdized CoefficientStdized CoefficientSignificance
Innovation0.1410.1420.000
Coordination0.0190.0190.185
Green0.0600.0610.003
Openness0.1550.1540.004
Sharing0.6260.6250.000
Intercept term −0.0010.000-
Table 7. QAP regression results—external driving factors.
VariableUn-Stdized Coefficient Stdized CoefficientSignificance
Protection−0.254−0.2660.000
Finance0.8760.8870.000
Consumption0.1880.1960.001
Traffic0.2630.2740.000
Agglomeration−0.116−0.1230.001
Intercept term 0.0780.000-
Disclaimer/Publisher’s Note: The statements, opinions and data contained in all publications are solely those of the individual author(s) and contributor(s) and not of MDPI and/or the editor(s). MDPI and/or the editor(s) disclaim responsibility for any injury to people or property resulting from any ideas, methods, instructions or products referred to in the content.

