Article

Spatiotemporal Changes and the Prediction of Drought Characteristics in a Major Grain-Producing Area of China

1
School of Surveying and Land Information Engineering, Henan Polytechnic University, Jiaozuo 454000, China
2
Nature Reserve and Wildlife Conservation Center, Jiaozuo 454000, China
3
Key Laboratory of Land Surface Pattern and Simulation, Institute of Geographic Sciences and Natural Resources Research, Chinese Academy of Sciences, 11A Datun Rd., Beijing 100101, China
4
Academy of Plateau Science and Sustainability, Qinghai Normal University, Xining 810008, China
*
Author to whom correspondence should be addressed.
Sustainability 2023, 15(22), 15737; https://doi.org/10.3390/su152215737
Submission received: 9 October 2023 / Revised: 3 November 2023 / Accepted: 6 November 2023 / Published: 8 November 2023

Abstract

:
Understanding variations in drought characteristics is of great importance for water resource planning and agriculture risk management. Despite increasing interest in exploring spatiotemporal drought patterns, long-term drought event characteristics and their future changes are unclear in major grain-producing areas in China. In this study, we applied Run theory, Sen’s slope, the modified Mann–Kendall method, wavelet analysis, and three machine learning models to systematically examine drought variation patterns, their future trends, and agricultural exposure in Henan Province, China, from 1961 to 2019. The results indicated that the SPEI-12 showed a significant increase at a rate of 0.0017/month during 1961–1999, but this has gradually changed to a drying trend since the 21st century. Drought event characteristics shifted markedly during these two periods, with drought duration and severity gradually shifting from east to west. The BO-LSTM model performed better than the LSTM and BP models, indicating that the drought frequency, higher drought duration, and drought peak would greatly increase 1.28–3.40-fold and cropland exposure is predicted to increase 1.61-fold in the near future compared to the first two decades of the 21st century. This finding not only helps developing meteorological drought predicting models, but also provides the scientific groundwork for drought disaster prevention and mitigation in Henan Province.

1. Introduction

Droughts are the most frequent and longest lasting natural disasters worldwide, and they have serious impacts on agriculture, water resources, ecology, and society [1], causing global economic losses of USD 1.75 × 10¹² from 1900 to 2019 [2]. In recent decades, the frequency and severity of droughts have been increasing on both global and regional scales, particularly in Europe [3], Africa [4], Asia [5], and southern Europe [6]. Under the climate change scenario, drought frequency is projected to increase by more than 10% in China [7] and 5–10-fold over most of continental Africa [8], with the incidence of extreme drought increasing to 5% in Australia [9] and drought magnitude projected to increase by 3.2–32.9% in the USA [10] before 2050. By the end of the 21st century, approximately 47% and 49% of land worldwide is projected to experience increases in drought frequency and severity [11], particularly in central Europe [12] and East Africa [13]. Therefore, it is crucial to gain a better understanding of the regional spatiotemporal drought characteristics for developing more reliable strategies to adapt to drought disasters.
Meteorological drought is related to the deficiency of precipitation over an extended period of time, from which other types of droughts originate. It is often an early indicator of more impactful dry events, and has always been a hot topic of research interest [14,15]. Based on meteorological variables, several drought indices have been widely used to monitor drought severity, such as the standardized precipitation index (SPI) [16], Palmer Drought Severity Index (PDSI) [17], and Standardized Precipitation Evapotranspiration Index (SPEI) [18]. The SPI can be applied at any spatial and temporal scale, but it considers only precipitation variability and does not reflect changes in drought in the context of global climate warming [19]. The PDSI is considered a landmark in the development of drought indices [20], but has several deficiencies, including the strong influence of the calibration period, limited spatial comparability, and subjectivity in relating drought conditions to index values [21]. To address these limitations, the SPEI was proposed [21], which combines the temperature sensitivity of the PDSI and the advantages of the SPI for multiscale and spatial comparisons. The SPEI has been reported to be more suitable for analyzing drought characteristics globally [22], in Europe [23], China [24], and other regions [25,26]. Despite the extensive usage of the SPEI, there is still controversy regarding which equation should be used to estimate potential evapotranspiration (PET) [27]. PET may be calculated using several methods, of which the Thornthwaite [28] and Penman–Monteith [29] methods are the most widely used. As the Thornthwaite method is based solely on temperature, it tends to underestimate PET in arid and semiarid regions [30]. The Penman–Monteith method is widely accepted as one of the most accurate means of calculating PET due to its improved physical calculation process, and could provide better estimates of global drought trends [19].
Drought events often exhibit distinct spatiotemporal heterogeneity at different spatiotemporal scales [30]. It is particularly important to accurately determine the temporal and spatial dynamic characteristics of drought to make precise predictions. The drought prediction methods developed to date can be categorized as physical models [31] and statistical models [32]. Statistical models utilize the computational capacity of machine learning algorithms and mathematical equations; they can explain future trends in climate parameters with less model complexity, relative simplicity of experimentation and evaluation, and lower computational cost and data requirements than physical models. Neural network models are one of the most commonly used methods due to their flexibility and strong capability to model complex patterns hidden in data [33,34]. Among various neural network models, the back-propagation (BP) neural network is a widely used type of neural network model which not only self-studies and self-optimizes using existing information, but can also solve large-scale complex nonlinear problems. However, the BP algorithm is an optimization method of local search. When training multilayer neural networks, it may fall into a local extremum, thus causing the training to fail [35]. Long short-term memory (LSTM) is an excellent variant of the recurrent neural network (RNN) model, which not only possesses characteristics of the RNN model but effectively avoids undesirable situations such as gradient explosion and disappearance, effectively utilizing historical information and achieving the long-term prediction functions of time series [36]. However, the performance of LSTM models relies highly on the selection of hyperparameters, such as the size of the hidden layer, the learning rate, and regularization parameters. These selections often require experience and repetitive experimentation, leading to model predictions that are time-consuming and overly dependent on prior knowledge [36,37]. Efficient hyperparameter optimization algorithms are critical to improve network performance [38,39].
The major grain-producing areas producing 76% of China’s total grain production are the mainstay of maintaining China’s food security [40]. The development of agriculture in these regions has always been one of the most important heart issues in the process of modernization of Chinese society. Henan Province, the core area for national major grain-producing areas and the leading province in grain production in China, produced 65.42 million tons of grain, accounting for 9.58% of the total grain production in China [41]. However, drought is one of the most severe agricultural meteorological disasters, resulting in approximately 9573.52 to 6010.06 million ha areas of accumulated drought damage and inundation from 1951 to 2009, respectively [42]. Therefore, systematically understanding drought variation characteristics and cropland exposure is of great scientific and practical value. Based on the SPEI, the primary objectives of this study are (1) to identify the long-term drought trends, periodicity and drought event characterized using Sen’s slope, Morlet wavelet analysis, and Run theory; (2) to compare the BP, LSTM, and BO-LSTM models to identify the best predicting model and predict the spatiotemporal patterns of drought for the next decade; and (3) to quantify the change process and conversion pattern of cropland exposure to drought during different study periods. This work will provide a scientific basis for regional water resource management and drought disaster prevention and mitigation.

2. Dataset and Methods
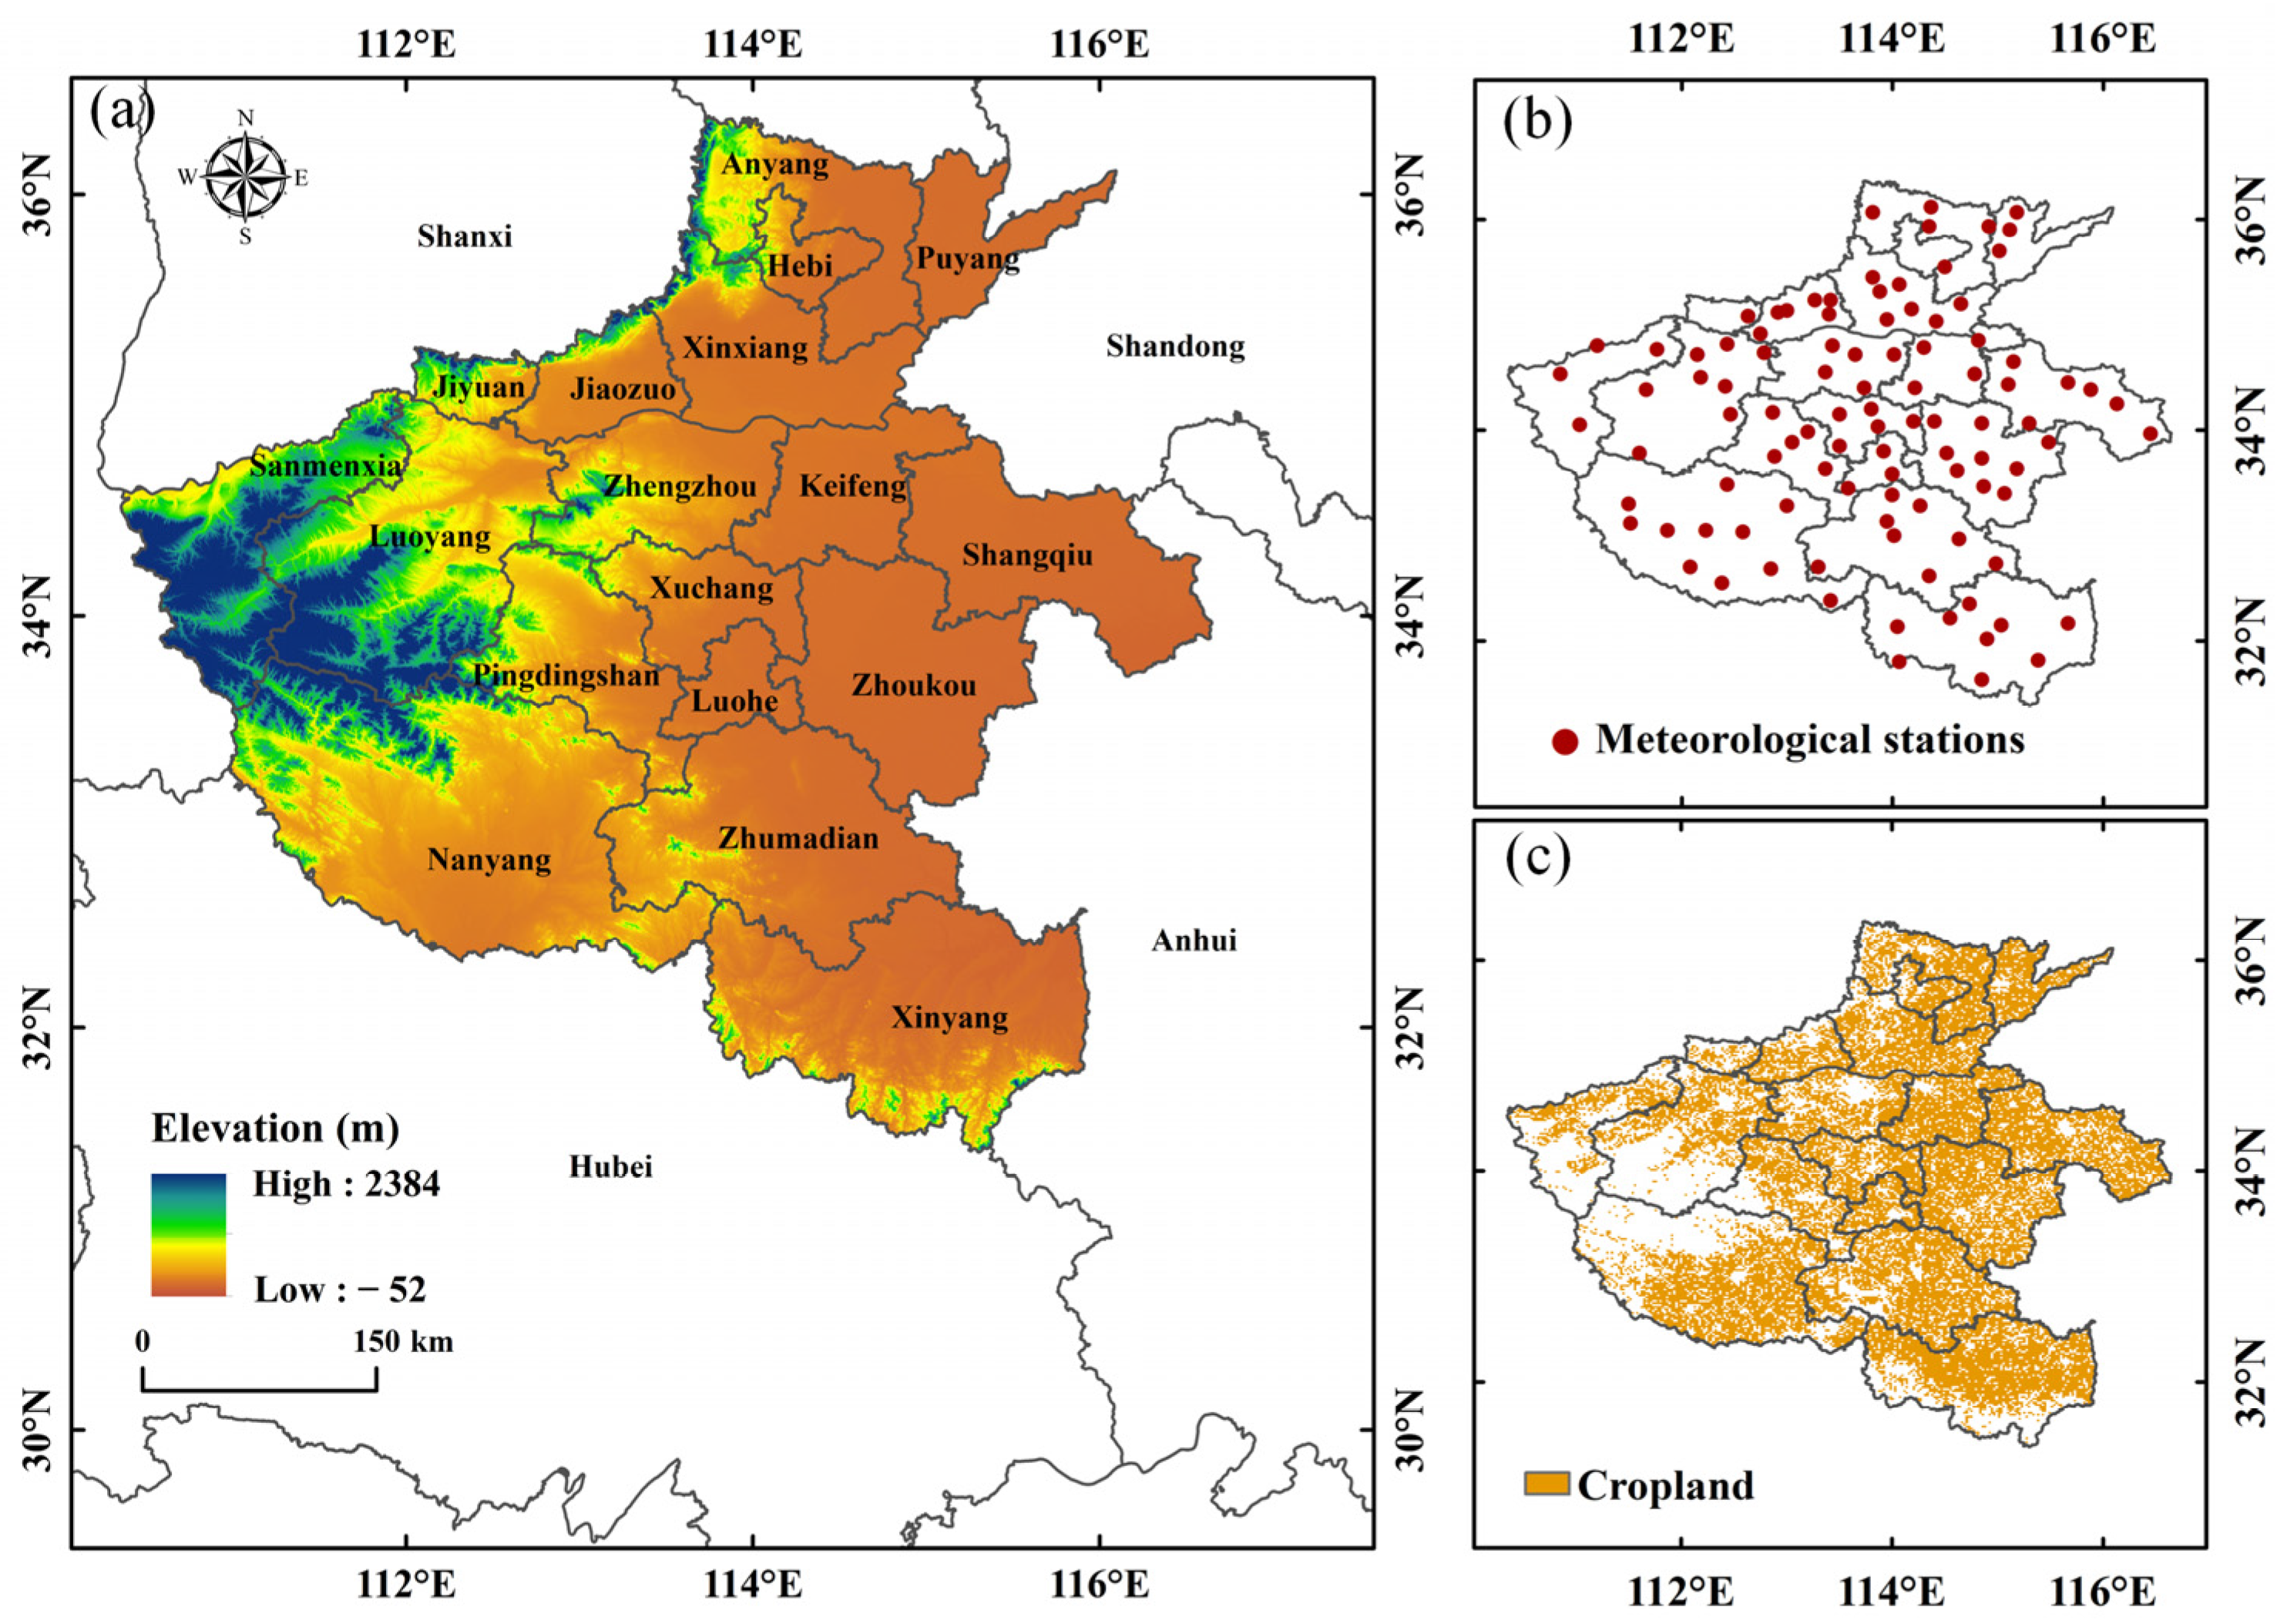
2.1. Study Area

Henan Province is situated in central–eastern China, and covers an area of 167,000 km2, accounting for 1.73% of the total area of China. The province is flat in the east and mountainous in the west and extreme south, with plains, mountains, and hills accounting for 56%, 26%, and 18% of the total area, respectively (Figure 1). The area has a continental monsoon climate that extends from a subtropical zone in the south to a temperate zone in the north, with four distinct seasons. The average temperature ranges from 12 °C to 16 °C [43], with an annual average rainfall of 533–1380 mm [44], nearly 70% of which occurs in the wet season from June to September. Due to its superior natural environment and rich climate resources, Henan Province has always been considered as one of the main production bases in China [45].

2.2. Data Sources

The meteorological data used to calculate the SPEI in this study were obtained from the Resource and Environment Science and Data Center, Institute of Geographic Sciences and Resources, Chinese Academy of Sciences (https://www.resdc.cn/, accessed on 3 March 2022). This dataset covers the period of 1961–2019 and includes total monthly precipitation, minimum and maximum temperatures, wind speed, and sunshine hours, as well as geographic information including altitude, latitude, and longitude. The data were preprocessed for strict quality control as follows. First, meteorological stations with long-term missing or unrecorded values were removed. The mean substitution method was applied, and rare missing data were interpolated based on mean values of the neighboring months or years for the corresponding period (missing data for the long term). Consequently, a total of 100 meteorological stations from 1961 to 2019 in Henan Province were included in the analysis. Secondly, as global warming was reported to have begun to weaken and even cease since 2000 [46,47], to clarify whether Henan Province experienced a warming hiatus that was synchronized with drought variation and to understand the possible characteristics after the hiatus, the study period was divided into two periods: 1961–1999 and 2000–2019. To determine the decadal drought features, decadal values were computed by averaging the periods 1961–1969, 1970–1979, 1980–1989, 1990–1999, 2000–2009, and 2010–2019.

2.3. Drought Trends and Periodicity

Due to its multiple advantages, we adopted the SPEI (based on the Penman-Monteith model) as a drought index to determine the spatiotemporal variation in drought in Henan Province. SPEI calculations were performed using the SPEI package (https://cran.r-project.org/web/packages/SPEI/, accessed on 18 April 2022) in R (R Core Team, Vienna, Austria). Generally, SPEI values for different time scales reflect anomalous water states at different times, and the 12-month SPEI (SPEI-12) is useful for hydrological drought analysis [48]. Therefore, SPEI-12 was selected to depict long-term drought characteristics in this study and dry/wet conditions were classified as in [49].
In this study, Sen’s slope and the modified Mann–Kendall (MMK) method were applied to analyze the spatiotemporal trends of the SPEI. The MMK test is a non-parametric test that avoids time series autocorrelation and is therefore more reliable for the detection of secular trends in climate data. The Sen’s slope method is a non-parametric approach that does not require the data to conform to a particular distribution, and may be useful to estimate the magnitude of trends in terms of relative change [50]. Morlet wavelet analysis was used to calculate drought periodicity [51]. To visualize the spatial patterns of drought conditions and trends across the study region, drought event characteristics were spatially interpolated using inverse distance weighting (IDW) in ArcGIS v10.4. This method is relatively fast, easy to compute, straightforward to interpret, and shows better interpolation accuracy [52]. The Mann–Kendall statistical test, Morlet wavelet, and MMK were conducted in Matlab R2014 (The Mathworks, Natick, MA, USA), with a significance level of 10%.

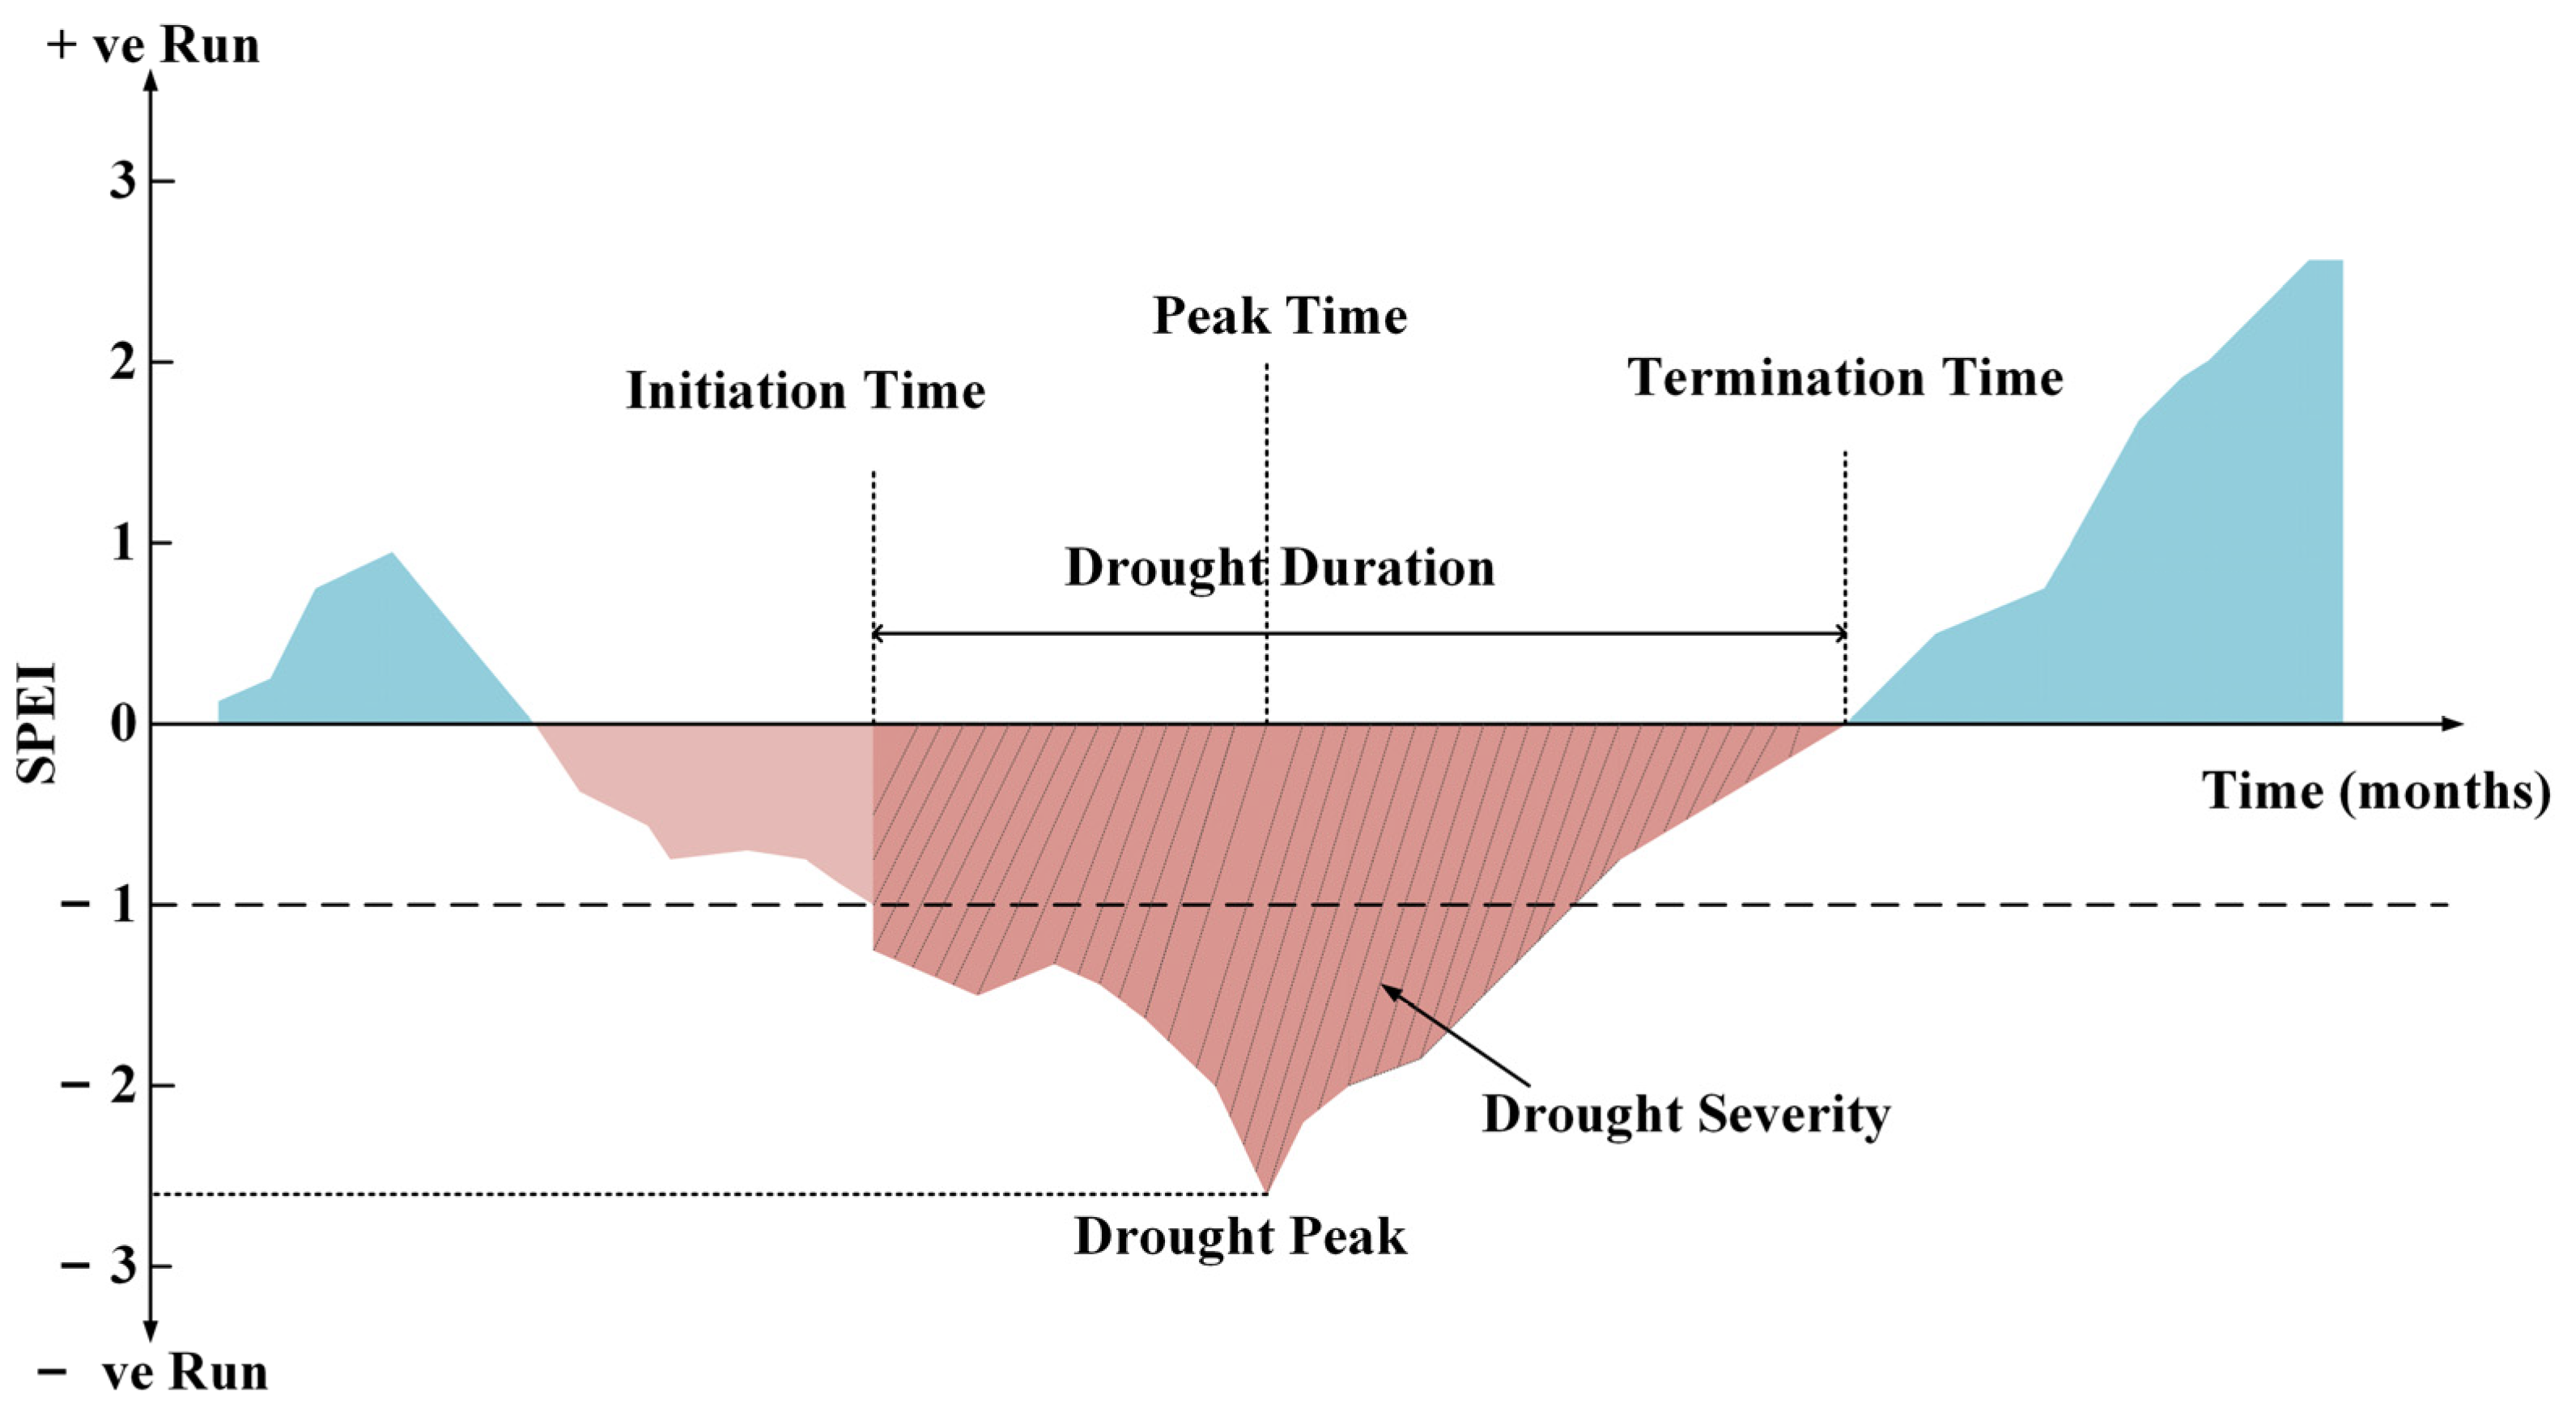
2.4. Drought Event Identification

To further investigate drought structure characteristics, drought event indices were identified according to Run theory [53]. As described previously, drought events were defined as periods from a month with SPEI < −1 to a month with SPEI > 0 [49] (Figure 2). Drought events were characterized in terms of drought frequency (DF; ratio of drought events number to study years), drought duration (DD; sum of consecutive months), drought severity (DS; sum of absolute SPEI), drought intensity (DI; ratio of DS to DD), and drought peak (DP; absolute minimum SPEI during the drought event). Then, the most severe drought events were identified according to DS at the regional scale to investigate extreme drought characteristics.
To quantify drought dynamic characteristics, we also calculated and compared the mean drought duration (MDD), mean drought severity (MDS), mean drought intensity (MDI), and maximum drought peak (DPmax) during different periods, as follows:
M D D = i = 1 N D D n
M D S = i = 1 N D S n
M D I = i = 1 N D S i = 1 N D D
D P m a x = m a x | D P i |   i = 1 , 2 N
where i is one drought event; N is the total number of drought events; and DD, DS, DI, and DP are those for one drought event.

2.5. Prediction Model

The Bayesian Optimization (BO) algorithm is a probability distribution optimization algorithm that is used for the automatic tuning of machine learning hyperparameters. It is mainly oriented toward solving complex black box problems with multimodality, nonconvexity, high dimensionality, and high evaluation costs [54]. To deal with the difficulty of hyperparameter selection in the LSTM model, we applied the BO–LSTM modeling method in this study. First, the data were split into 70% training and 30% testing sets and normalized using the mapminmax function. Next, an objective function was created for optimization and the BO parameter ranges were set as follows: NumOfUnits = (10, 50), InitialLearnRate = (1 × 10⁻³, 1), and L2Regularization = (1 × 10⁻¹⁰, 1 × 10⁻²). Then, the bayesopt function was used to find the best parameter combination by minimizing the loss function. The network structure of the LSTM model was constructed and the parameters set. The Adam optimization algorithm was used for model training with the following settings: MaxEpochs = 1200, InitialLearnRate = (1 × 10⁻³, 1), LearnRateSchedule: piecewise, and LearnRateDropFactor: 0.2. The model was trained using the trainNetwork function, and predictions were made based on the training and testing sets. The normalization of the predicted results was reversed and the coefficient of determination (R2), root mean square error (RMSE), and mean absolute error (MAE) of the predictions were calculated. Finally, the trained model was used to predict data for the next decade.
The results of the BP, LSTM, and BO-LSTM models were compared to verify their effectiveness according to the RMSE, R2, and MAE, which were calculated as follows:
R 2 = ( o i o ¯ ) ( y i y ¯ ) ( o i o ¯ ) 2 ( y i y ¯ ) 2 2
RMSE = 1 n i = 1 n ( o i y i ) 2
MAE = i = 1 n o i y i N
where n is the number of samples, and y i and o i are the measured and predicted values, respectively. R2 values approaching 1 indicate better simulation, and RMSE and MAE values approaching 0 indicate better simulation.

2.6. Cropland Exposure to Drought

Cropland exposure to drought was calculated by multiplying the DF at a grid point by the cropland area of that grid point [55]. GlobeLand30 (http://www.globallandcover.cn, accessed on 10 September 2023) land cover data for 2000, 2010, and 2020 were used to determine cropland exposure. Continuous cropland areas from 2000 to 2020 were determined using ArcGIS v10.4, and then the spatial resolution was resampled for consistency with the DF map. To evaluate spatial differences in the impact of drought, we compared cropland exposure during the periods 1961–1999, 2000–2019, and 2020–2029.

3. Results

3.1. Drought Dynamic Characteristics

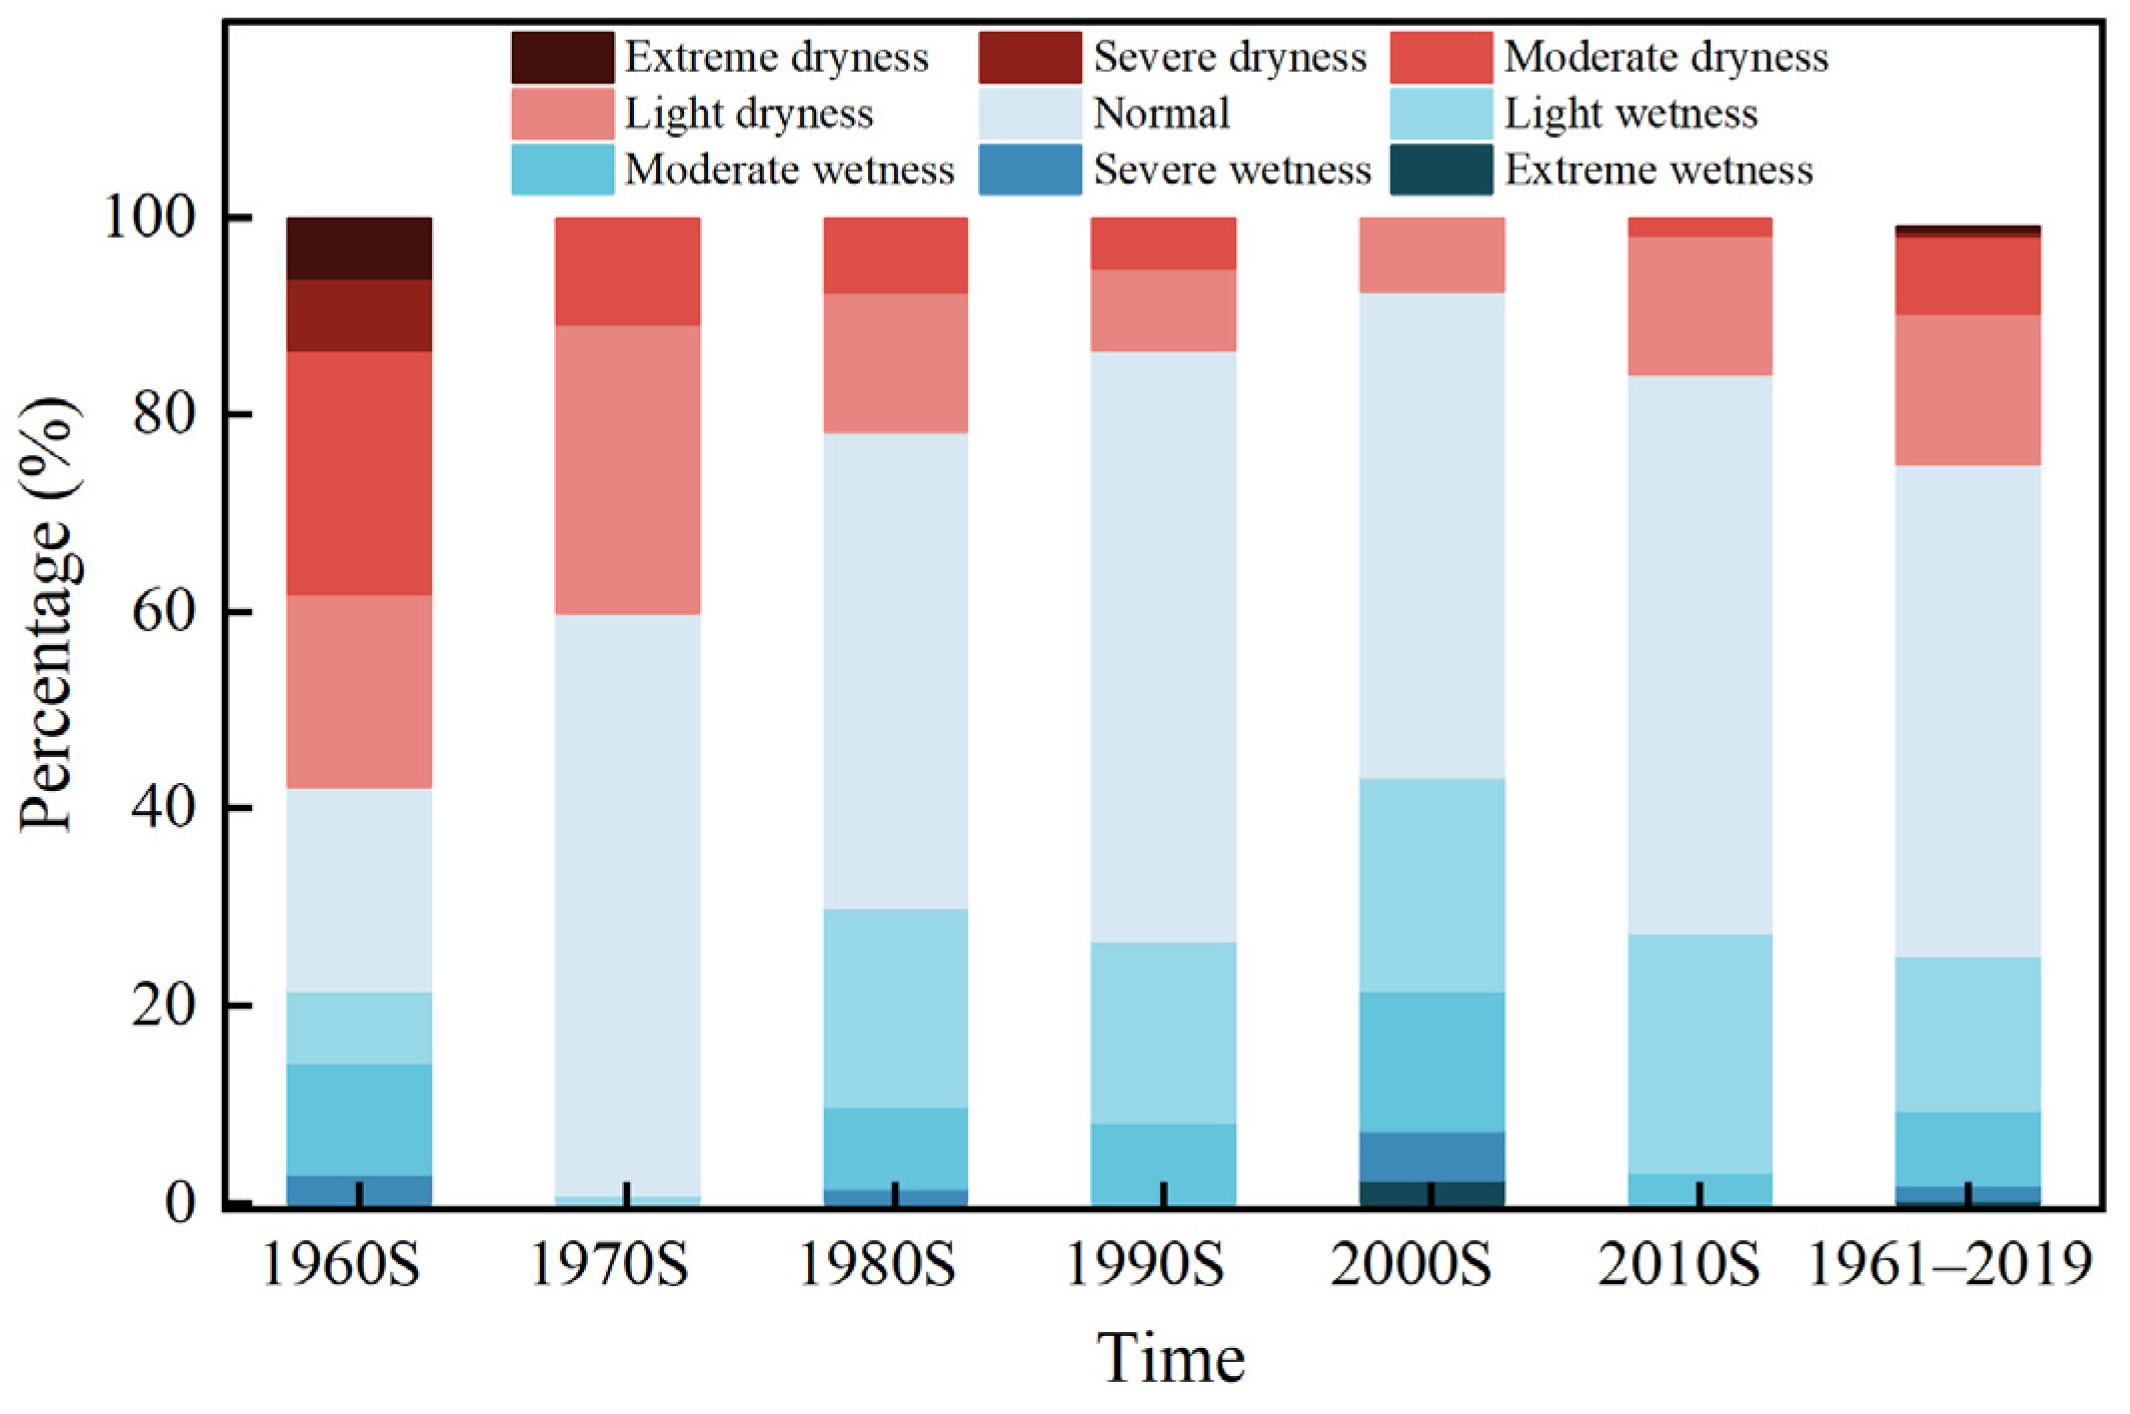
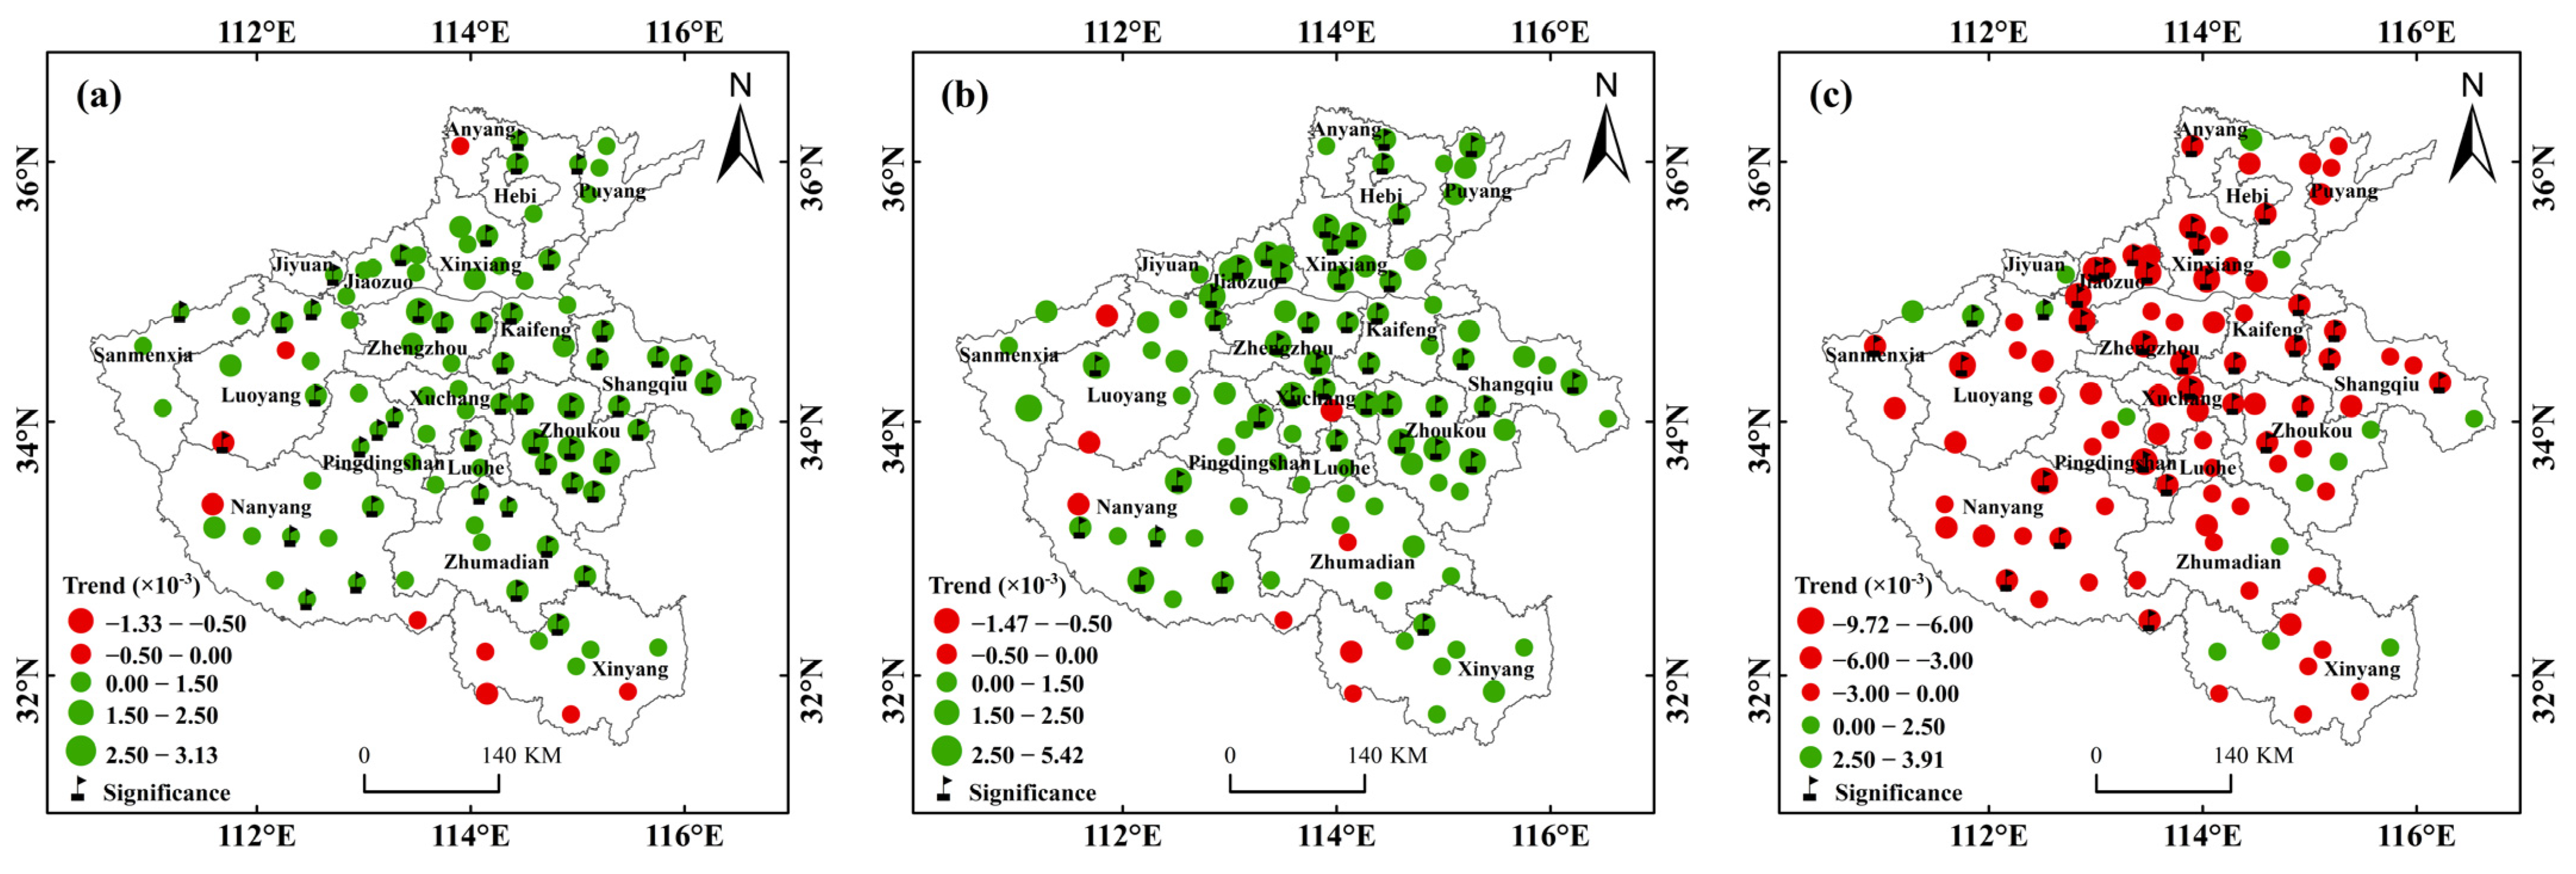
3.1.1. Spatiotemporal Variation of SPEI

The SPEI-12 showed a significantly increasing trend with a rate of 0.0013/month during 1961–2019, and showed a decreasing trend in the 21st century (Figure 3a). In the 1960s and 1970s, conditions were generally dry, with lower SPEI-12, and then changed to wet conditions, with the 2000s being the wettest decade (average SPEI-12 = 0.49). To detect the characteristics of these abrupt dry–wet changes, SPEI-12 variation was examined using the Mann–Kendall test. We detected a clear turning point around 1982, after which the climate became wetter (Figure 3b). In contrast, a drying tendency was detected in 2012 (Figure 3c), suggesting that this issue will require more attention in the near future. Periods of extreme and severe dryness occurred during the 1960s, whereas no such events occurred in other decades. The percentage of dryness decreased from 40.00% in the 1970s to 7.50% in the 2000s, and were dominated by light dryness (Figure 4).
There were clear spatial differences in SPEI-12 variation during different periods (Figure 5). From 1961 to 2019, the increasing trends of SPEI-12 were unambiguously prevailing at 91% of the total stations, with significance at 47% of the total stations mainly in Zhoukou, Shangqiu, Zhengzhou, Zhumadian, and Anyang cities, in contrast to significant decreasing trends in Luoyang City (Figure 5a). The SPEI-12 increased significantly at 40% of all stations during 1961–1999, but these increases were mainly distributed in the cities Jiaozuo, Xinxiang, Zhengzhou, Zhoukou, Xuchang, and Nanyang (Figure 5b). In contrast, SPEI-12 decreased significantly at 31% of all stations, with negative values at 85% of stations, mainly in the cities Jiaozuo and Kaifeng. The SPEI-12 increased by less than 0.0039/month at 15% of all stations from 2000 to 2019 (Figure 5c).

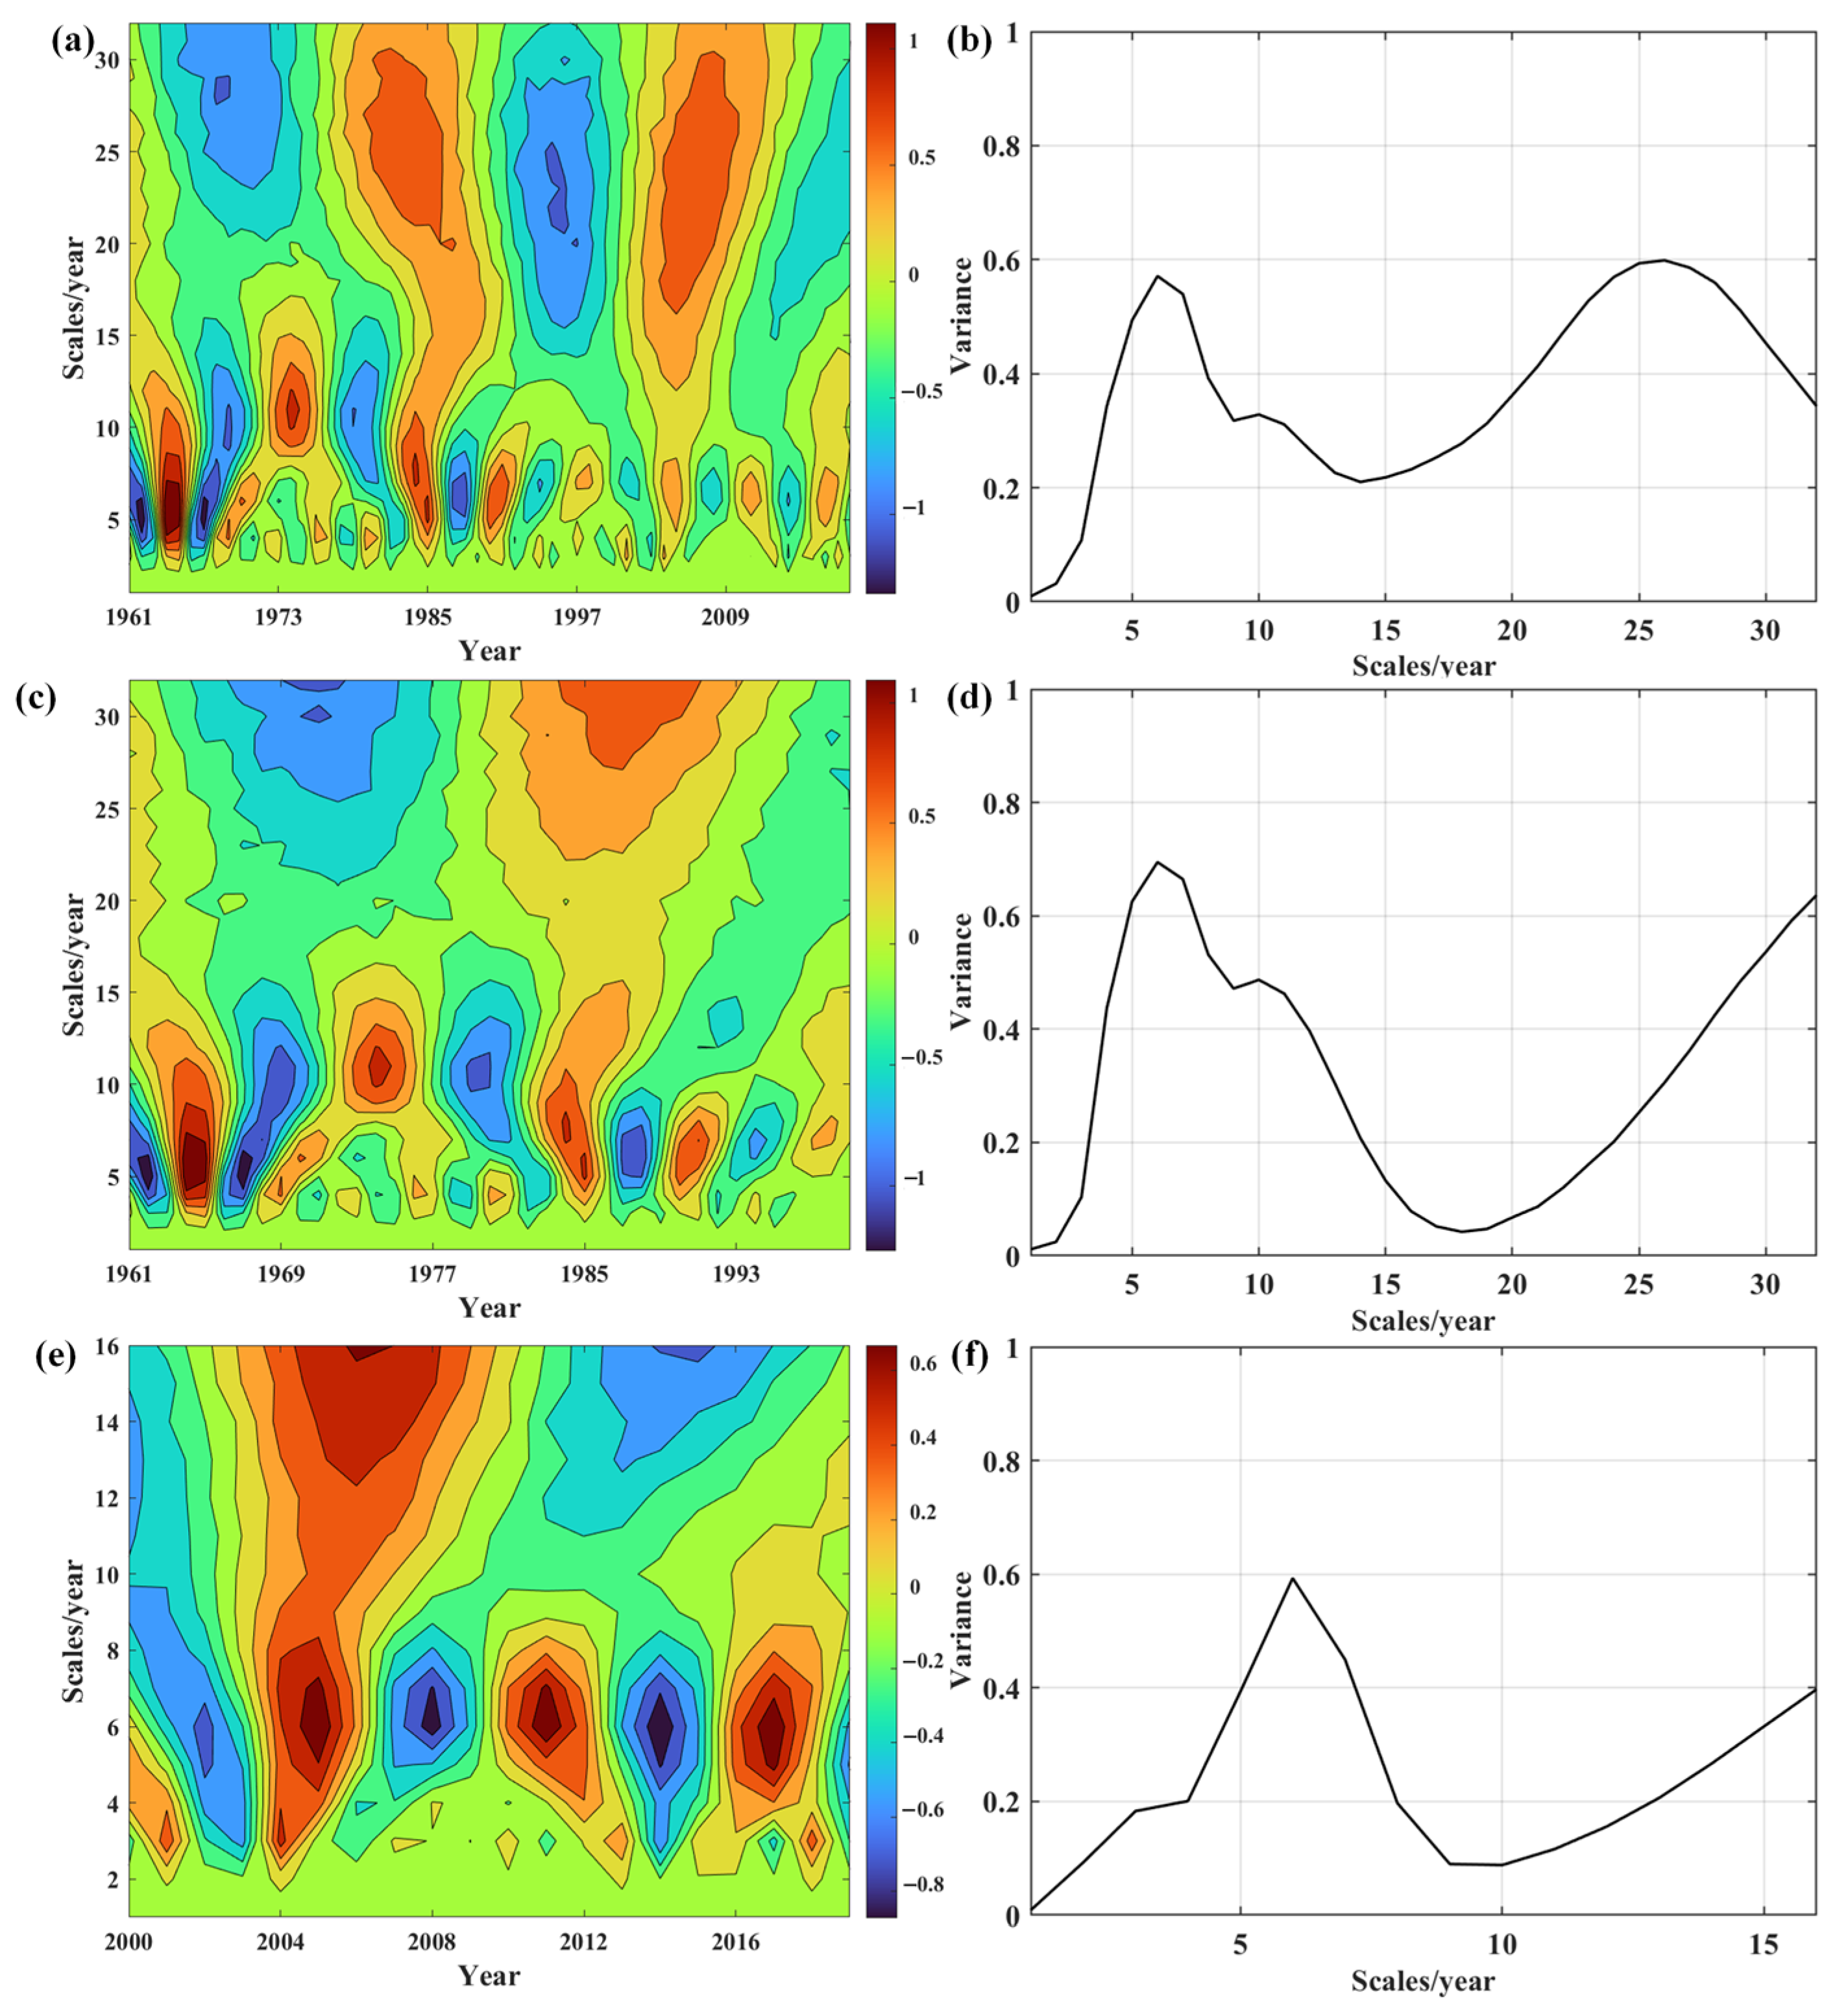
3.1.2. Drought Periodicity

According to the real part of the wavelet coefficient contour map, there were complex multiple time scales consisting of small cycles nested within larger cycles, and the drought evolution showed two clearly different time scales of 2–10 and 20–32 years (Figure 6a). Combined with the wavelet variance plot, there were two distinct peaks in the drought evolution in Henan Province, corresponding to time scales of 6 and 26 years, respectively (Figure 6b). The largest time scale was 26 years, indicating that an approximate 26-year drought cycle had the strongest fluctuations and formed the first major cycle. The 6-year time scale corresponded to the second main drought cycle. During the period 2000–2019, there were three periods of pronounced drought and wetness, which alternated on a time scale of 2–10 years (Figure 6e). However, the contours of the oscillation periods remained open around 2019, suggesting that Henan Province may continue to experience drought after 2019.

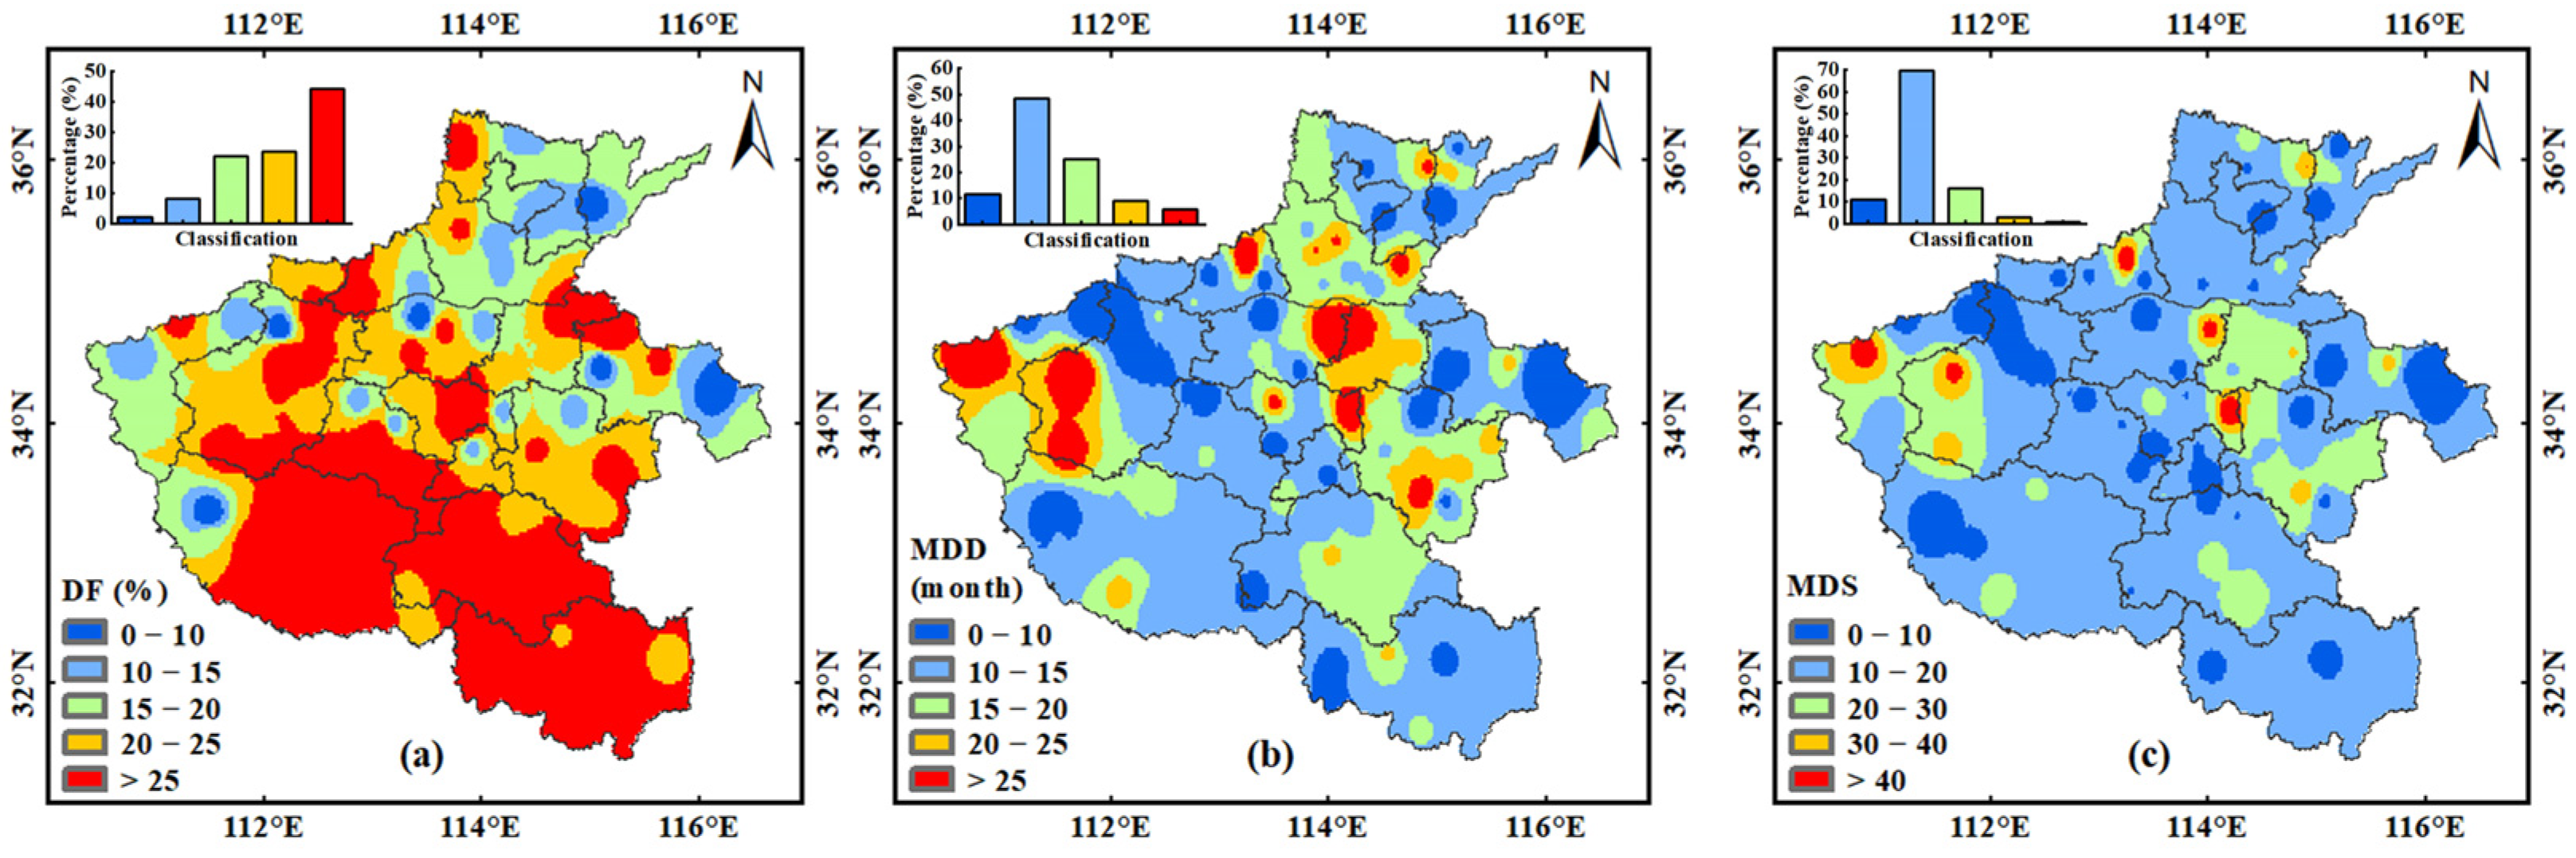
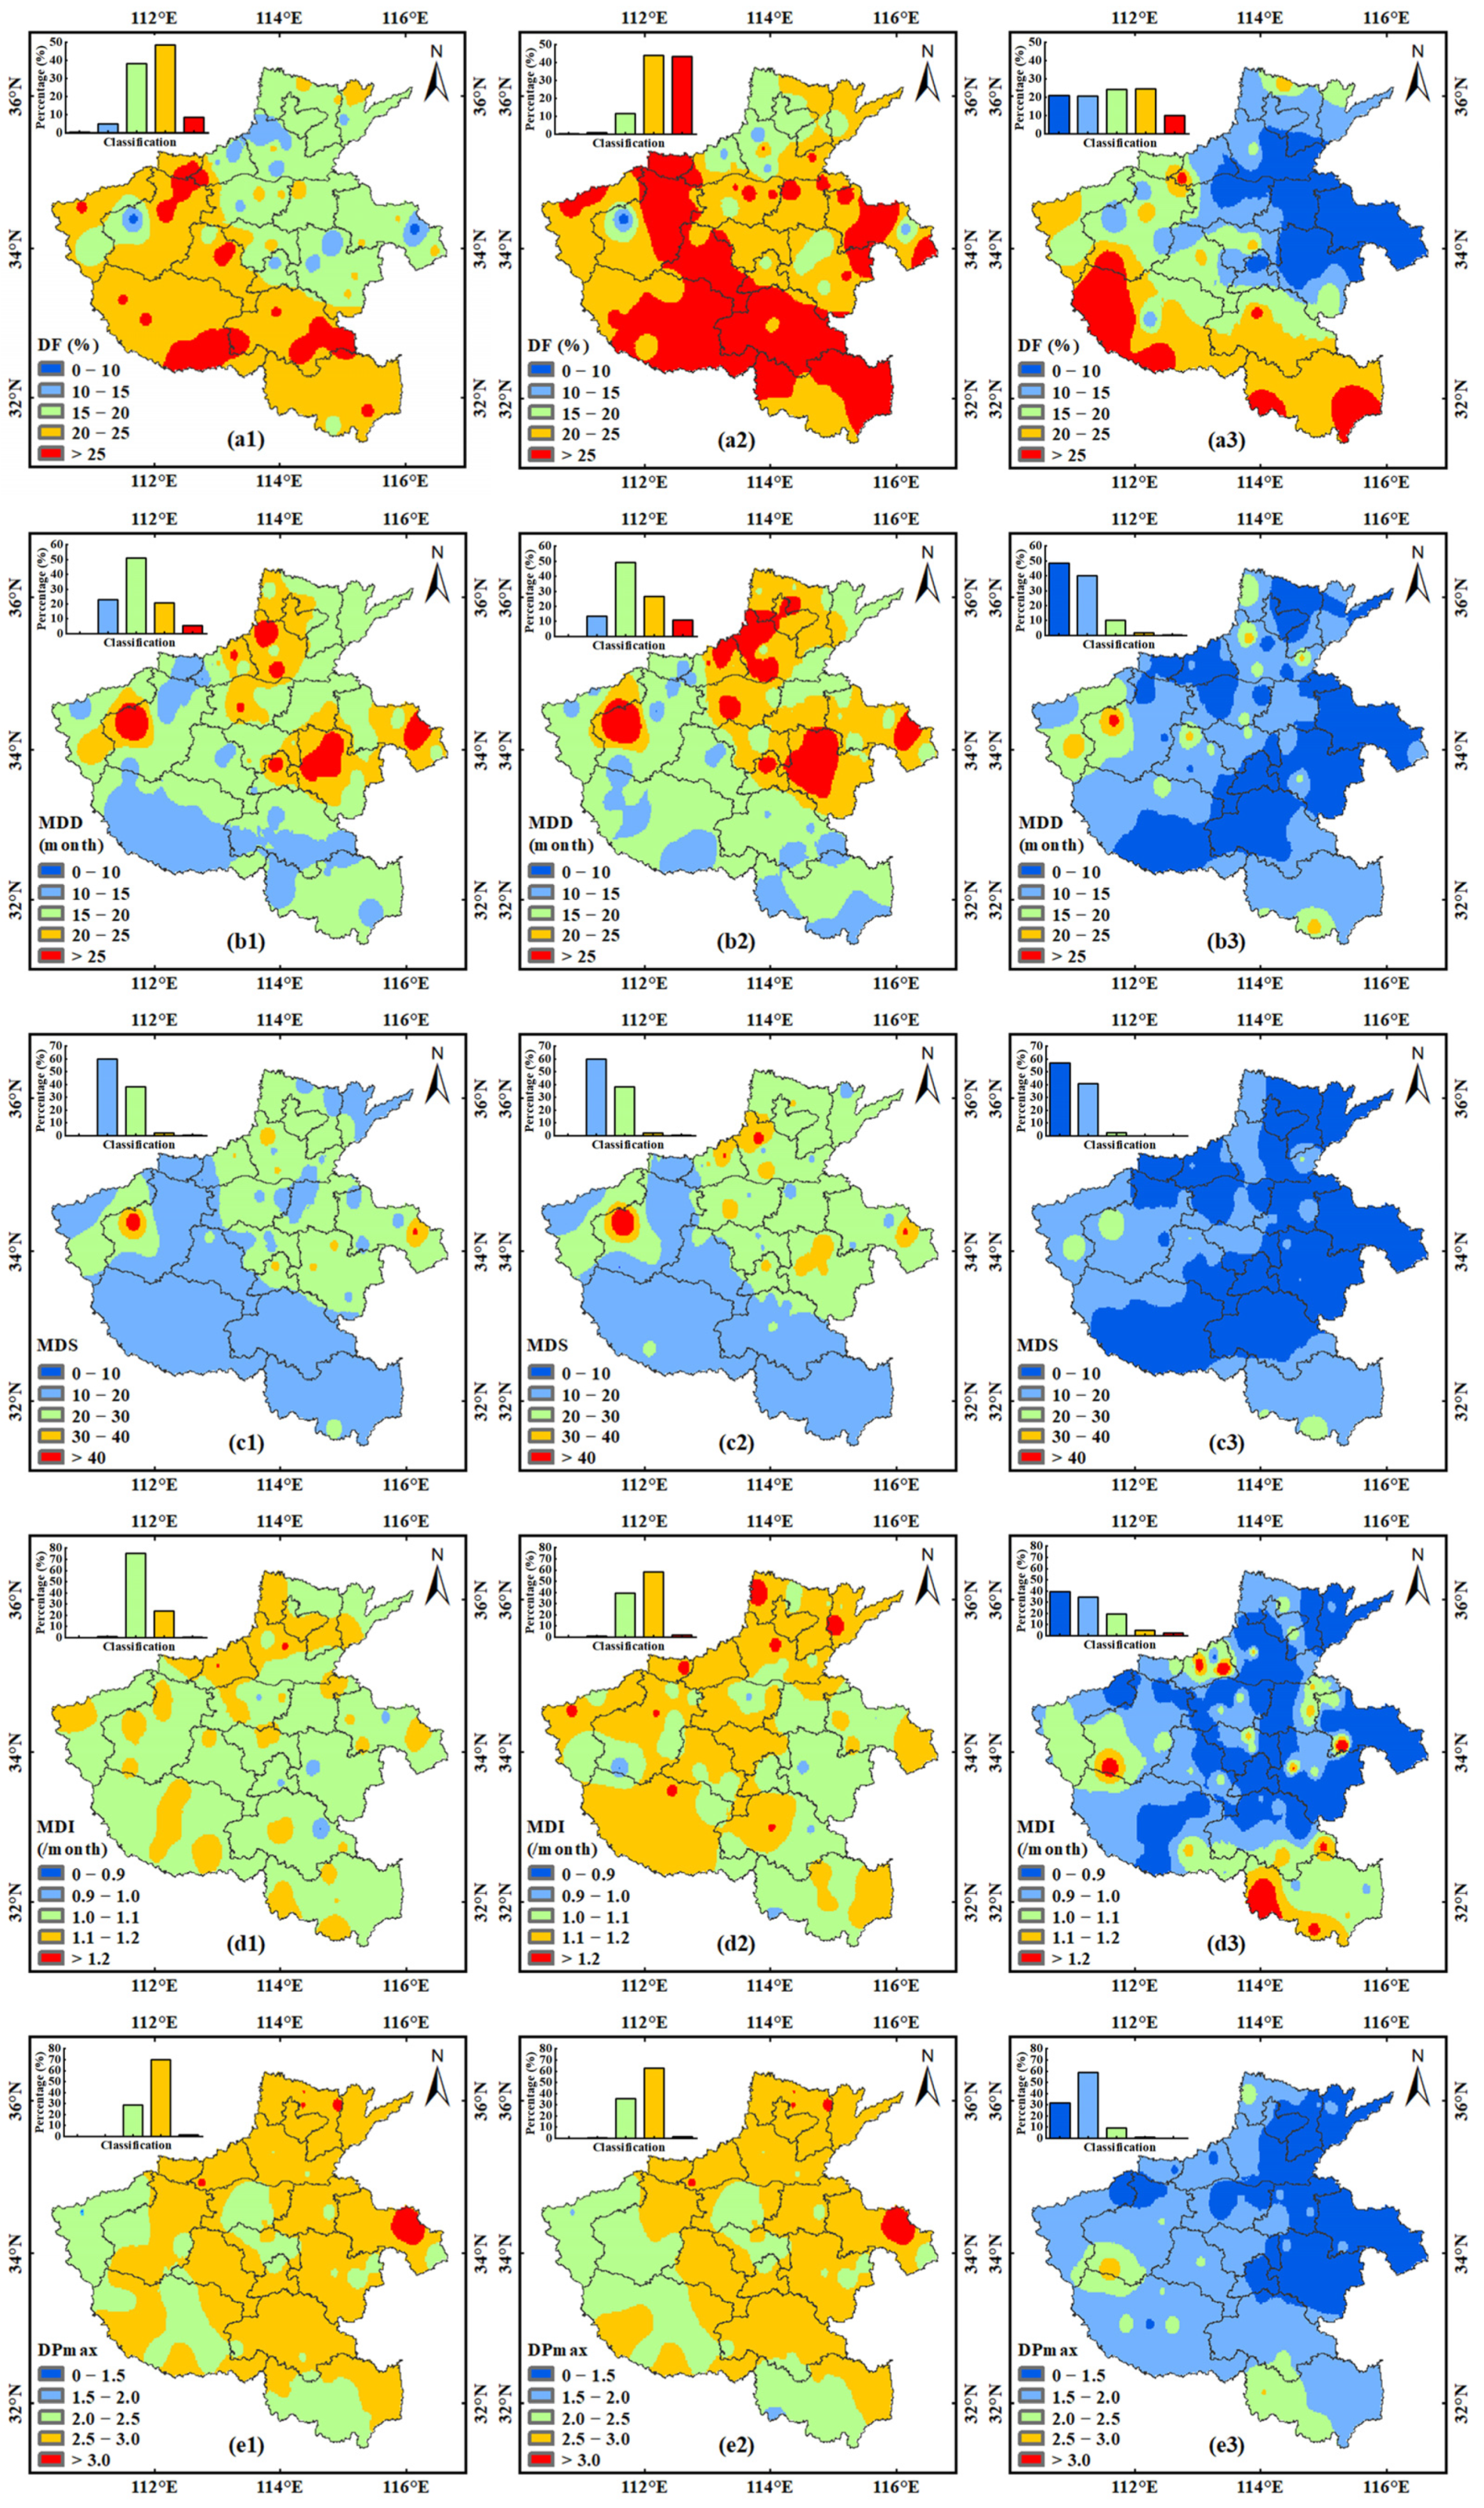
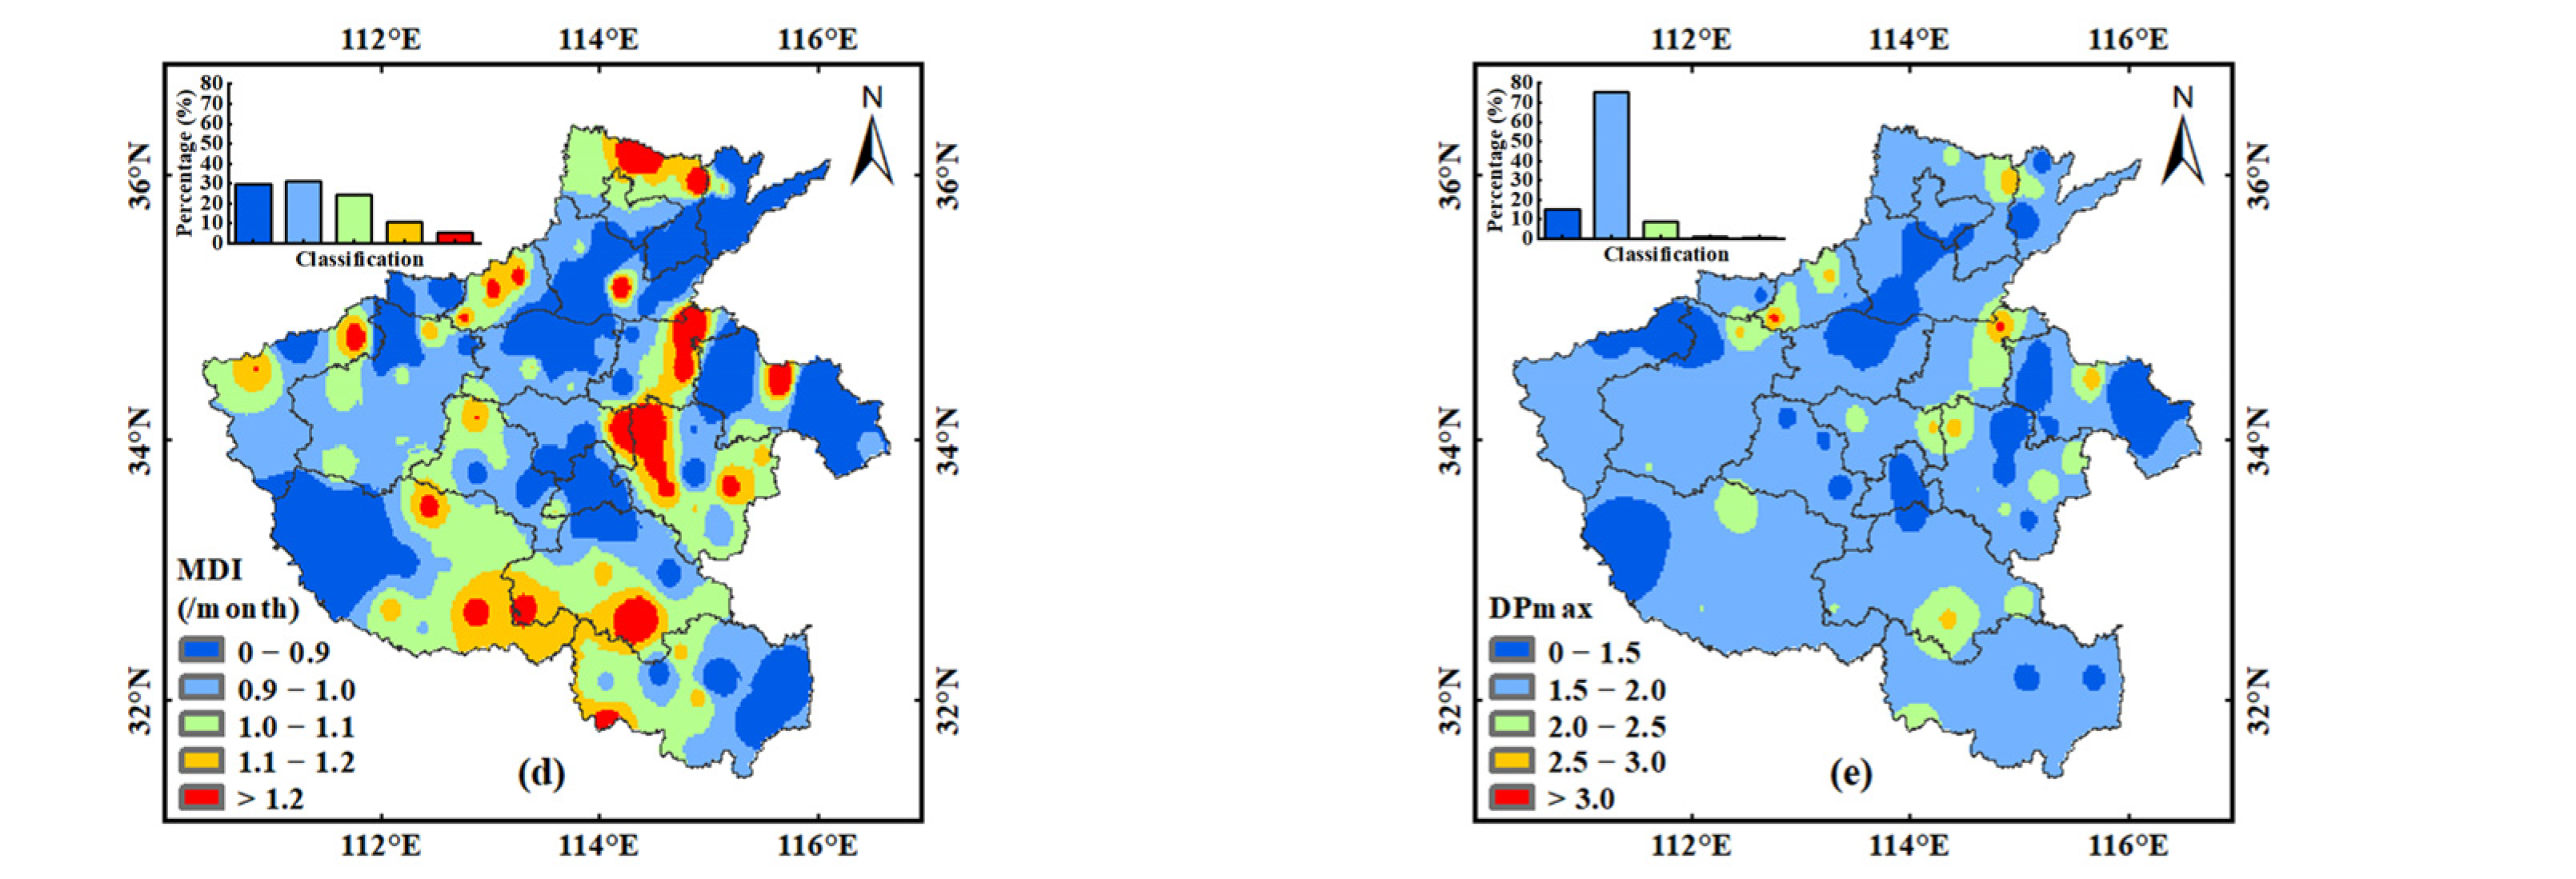
3.1.3. Drought Event Characteristics

The drought event characteristics showed similar spatial distributions across Henan Province in 1961–2019 and 1961–1999 (Figure 7). For example, Jiyuan, Nanyang, Pingdingshan, Zhumadian, Xinyang, northwestern Sanmenxia, and eastern Luoyang cities had higher DF and lower MDD and MDS (except in western Luoyang) during these two periods. In contrast, northern and eastern Henan Province had lower DF but longer MDD and higher MDS (Figure 7(a1–c2)), suggesting that droughts in southwestern Henan Province were short, with low severity and high frequency, whereas those in northwestern Henan Province were long, with high severity and low frequency. MDI and DPmax generally exhibited complex, patchy features in Henan Province (Figure 7(d1–e2)), with high MDI mainly in Jiyuan, Jiaozuo, Hebi, and Xinxiang, and Anyang cities. MDI exceeding 1.1 accounted for 23.61% and 59.69% of the total area, respectively, while high DPmax values were widely distributed in Puyang, Shangqiu, and Anyang cities, reaching a maximum of 3.29.
In comparison, spatial patterns of drought event characteristics in Henan Province showed large changes during 2000–2019 (Figure 7(a3–e3)). Higher DF occurred mainly in cities of Nanyang, Zhumadian, Xinyang, northwestern Sanmenxia, and southern Luoyang and Jiaozuo, with DF > 20 in 34.40% of total areas, whereas relatively high MDD and MDS shifted mainly to Sanmenxia, Luoyang, and Xinyang cites. Notably, the maximum MDD and MDS during 2000–2019 decreased to 50.07% and 46.42%, respectively, compared to those from 1961–1999 (Figure 7(a3–c3)). Higher MDI and DPmax values had similar distribution patterns, with higher values scattered in southeastern and western Henan Province, accounting for 26.16% (MDI > 1.0) and 9.72% (DPmax > 2.0) of total areas.
The 10 most severe drought events were identified based on the station-averaged SPEI-12 in Henan Province, and the corresponding drought event characteristics were calculated (Table 1). The most severe drought event occurred between 1965 and 1967, with a DS of 40.31 and a DP of 2.24 in 1966, and the drought event with the longest DD was recorded during 1968–1971, lasting approximately 35 months. The three most severe drought events occurred within the 1960s, indicating that Henan Province suffered its worst drought during this decade. Notably, only one of the 10 most severe drought events was detected during 2000–2019, with a DD of 4 months and a DI of 0.89.

3.2. Drought Prediction

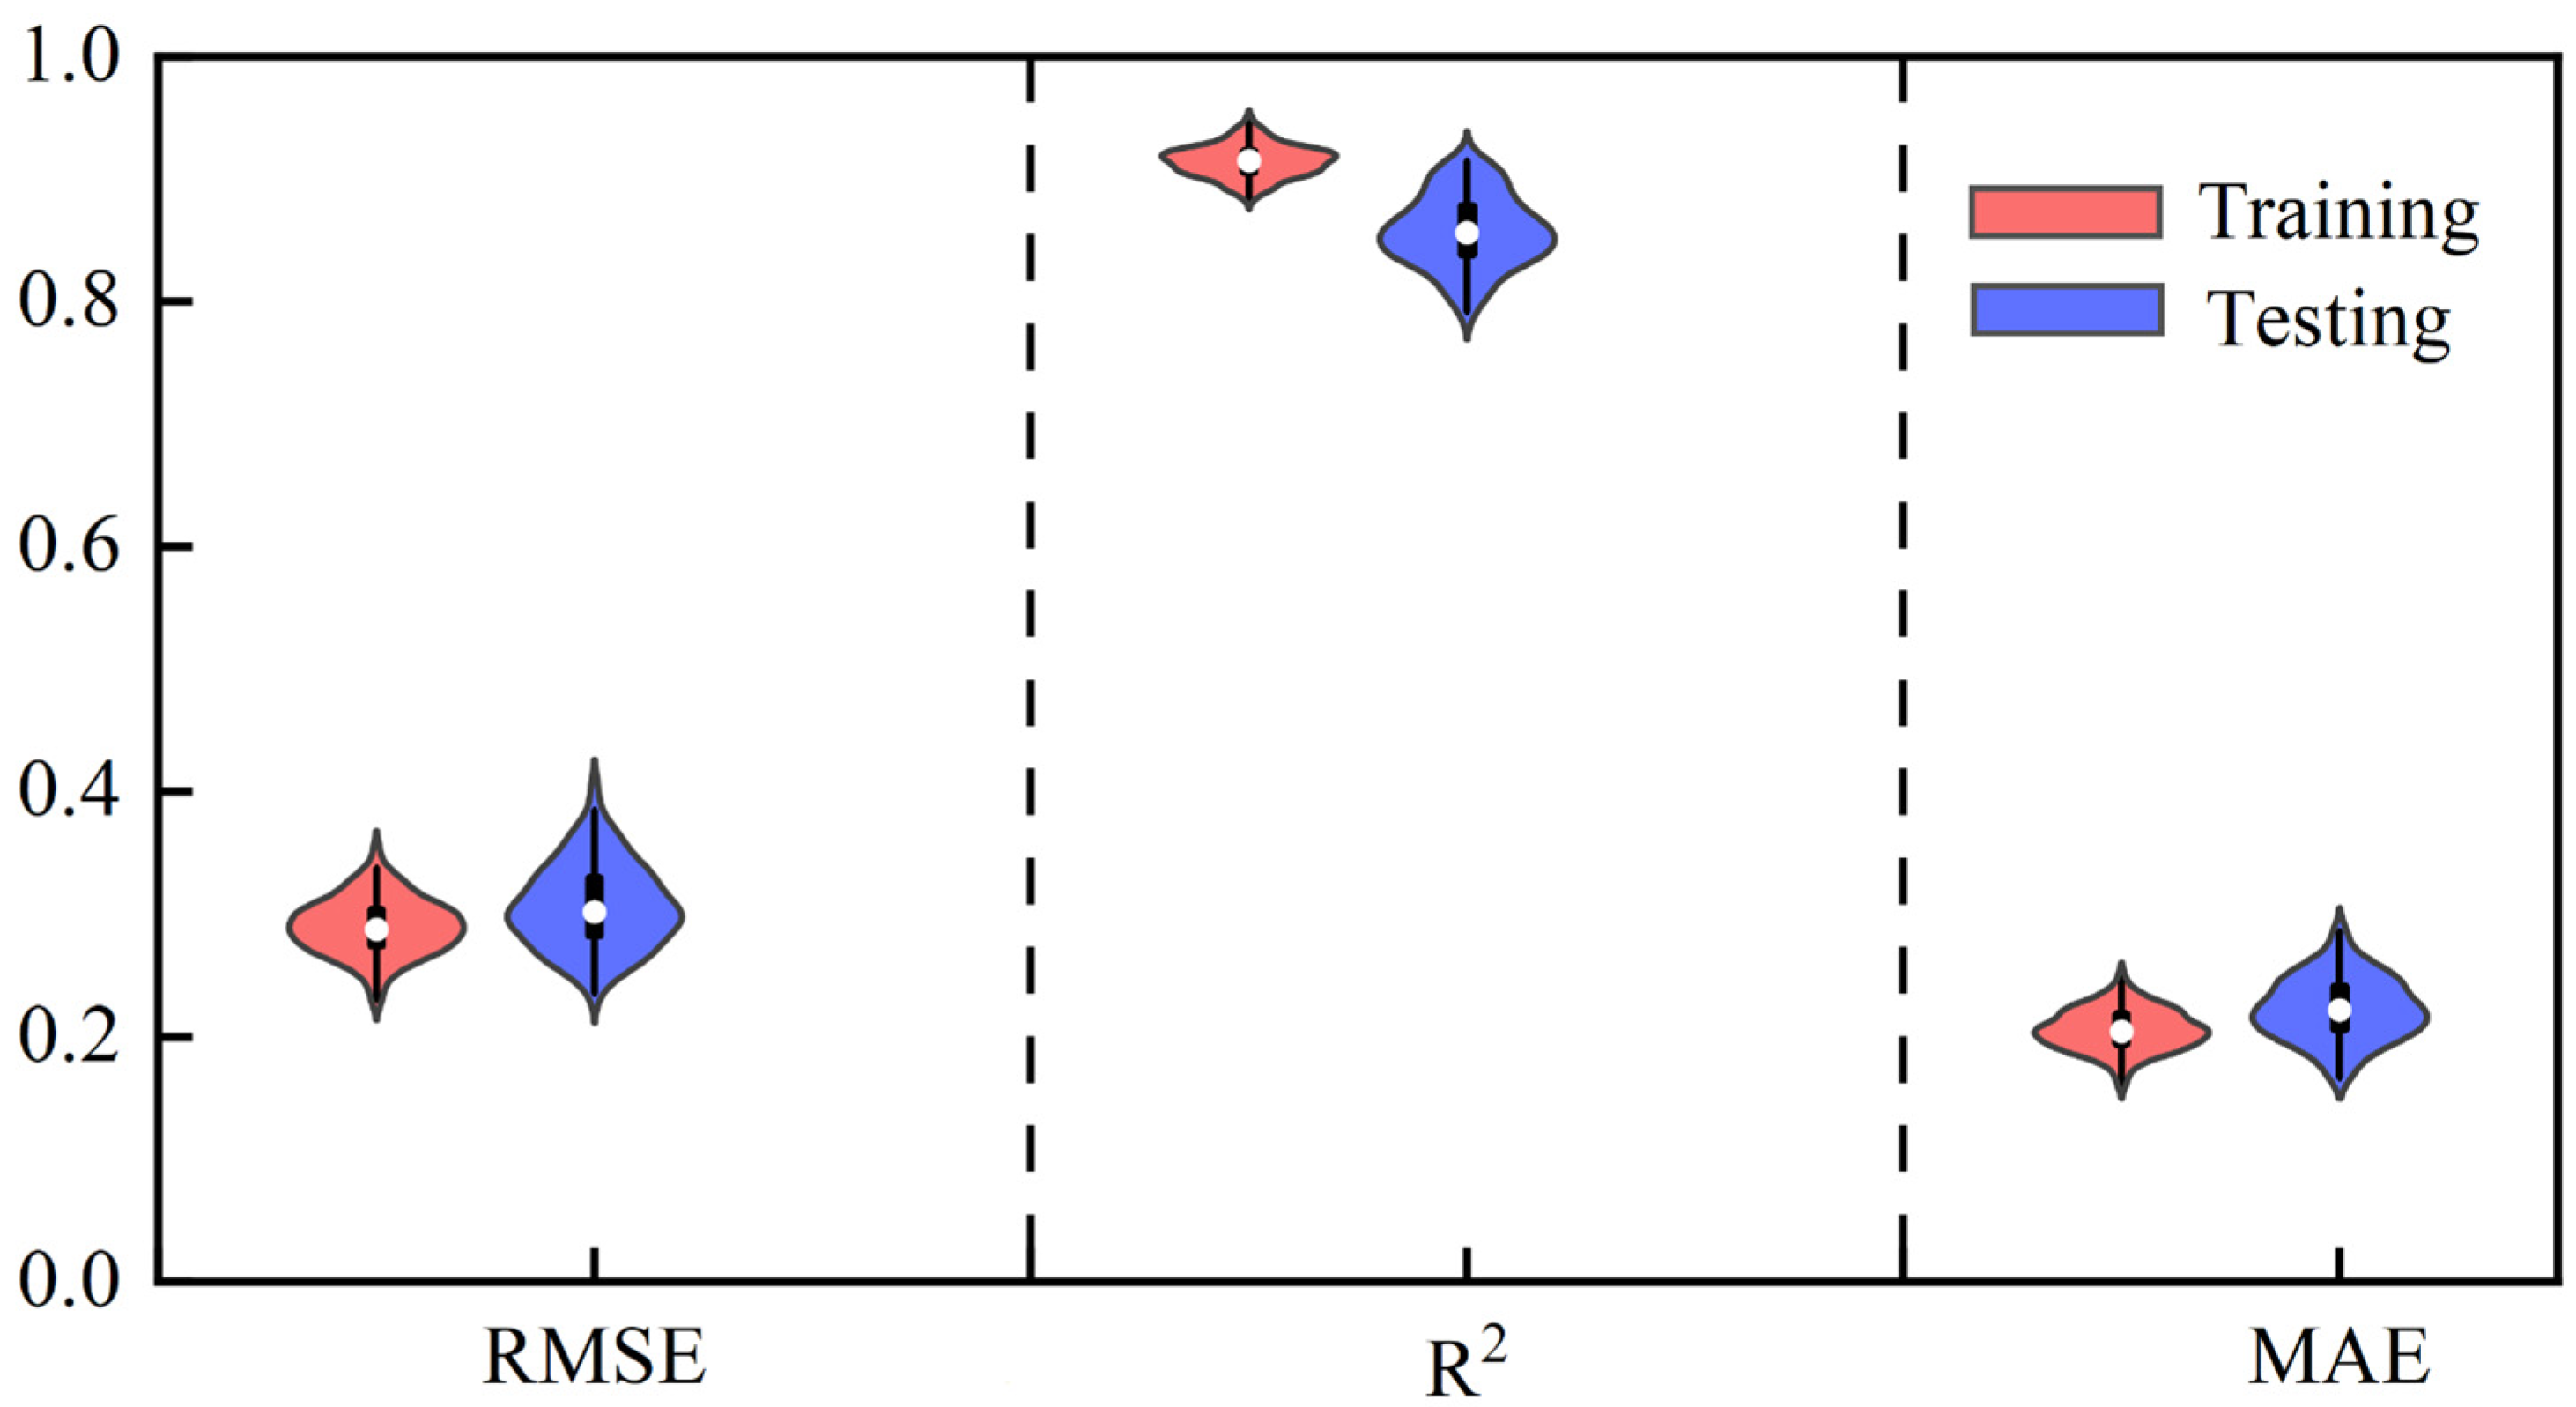
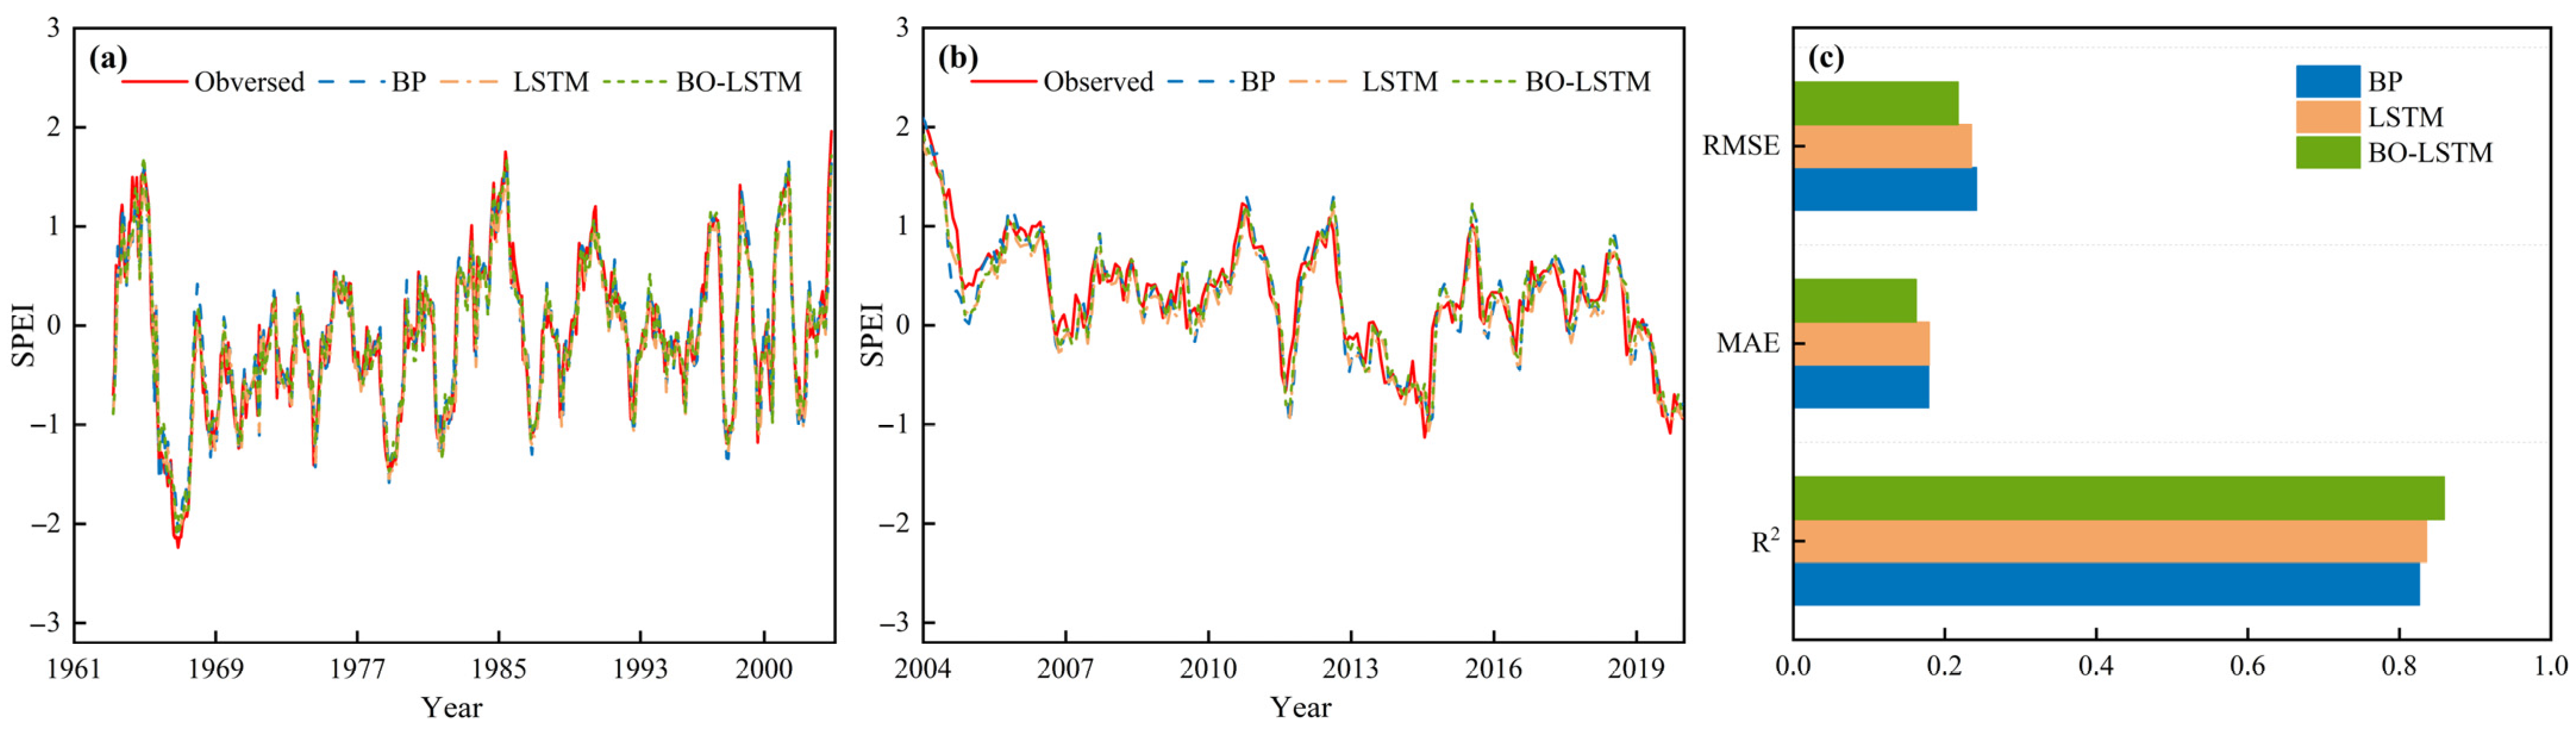
3.2.1. Selection of Preferable Model

All models captured the SPEI-12 variation well (Figure 8), and the accuracy of the BO-LSTM model generally exceeded those of the LSTM and BP models for all three evaluation indices, with the highest R2 value of 0.87 and lowest RMSE and MAE values of 0.22 and 0.16 in the testing phase, respectively, suggesting that the BO-LSTM model has advantages over the BP and LSTM models in drought predicting for Henan Province. We then evaluated the performance of the BO-LSTM model over the 100 stations (Figure 9). The mean R2, RMSE, and MAE values for SPEI-12 were 0.86, 0.31, and 0.22 for the training and testing period, respectively. Therefore, the BO-LSTM model was used to predict dry and wet conditions over the next 10 years.

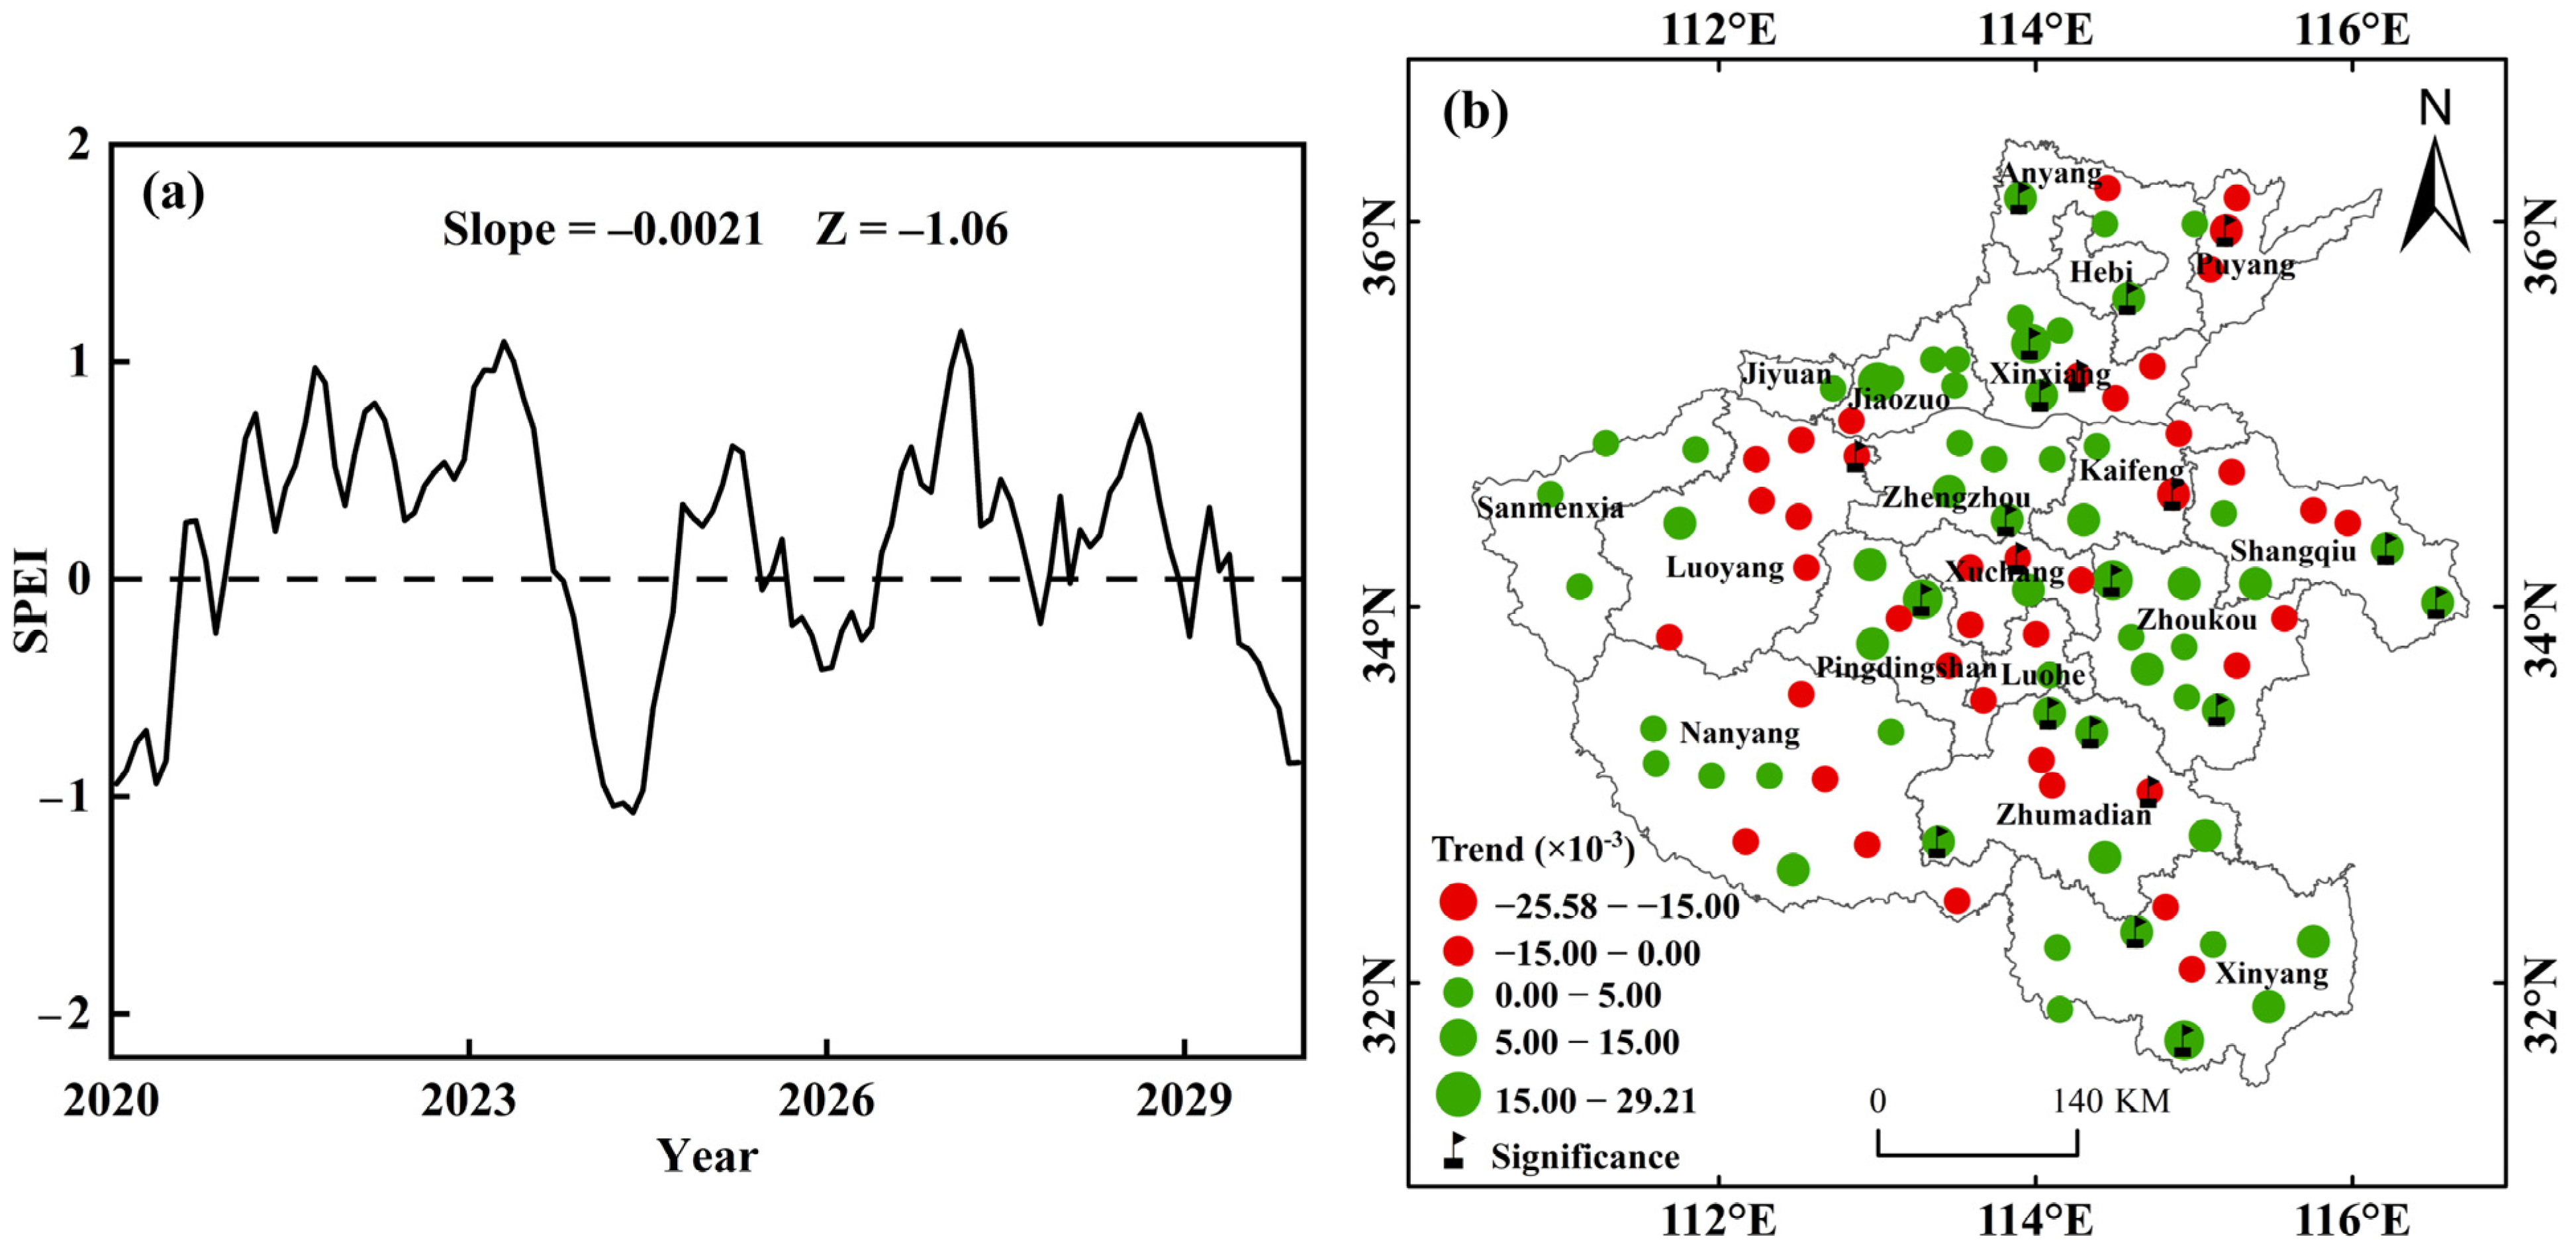
3.2.2. Temporal and Spatial Variation

Based on the BO-LSTM model, the SPEI-12 was predicted to decrease slightly at a rate of −0.0021/month from 2020 to 2029 and there would be a dry condition in the next decade with SPEI-12 < 0 only in approximately 35% of all predicting months (Figure 10a). The minimum SPEI-12 of −1.07 was predicted to occur in May 2024, with the largest occurrence in February 2027. Spatially, from 2020 to 2029, increasing trends of SPEI-12 prevailed at 60% of total stations, with significance at 15% of total stations, mainly distributed in eastern Shangqiu, Zhengzhou, Xinxiang, and Xinyang cities. In contrast, a significant negative trend of SPEI-12 occurred in 6% of stations, scattering in areas such as Puyang, Luoyang, and Kaifeng cities, with the greatest decreasing rate of −0.0256/month in Puyang city (Figure 10b).

3.2.3. Drought Event Characteristics

The mean DF was 24.69%, which was 1.51 times that during 2000–2019 (Figure 11a), with higher DFs of approximately 20–25 and >25 occurring in 67.89% of the study area, mainly in Zhumadian, Xinyang, eastern Nanyang, and Xuchang cities. Larger MDD values were observed across 14.61% of all areas, mainly focused in western Kaifeng, northeastern Jiaozuo, southwestern Luoyang, and Sanmenxia cities (Figure 11b). An MDS of 10–20 accounted for 69.61% of total areas, whereas those >20 accounted for 19.63%, mainly in southwestern Luoyang and Sanmenxia, western Kaifeng, and parts of Jiaozuo and Zhoukou cities (Figure 11c). The MDI exhibited a patchy spatial distribution, with regions near Anyang, Kaifeng, Zhoukou, and southern Henan Province (39.62%) showing a higher MDI (>1.0; Figure 11d). Most regions of Henan Province (75.48%) had a DPmax of 1.5–2.0, with higher DPmax observed mainly in northeastern Kaifeng, Zhoukou, Jiaozuo, and Zhumadian cities (Figure 11e).

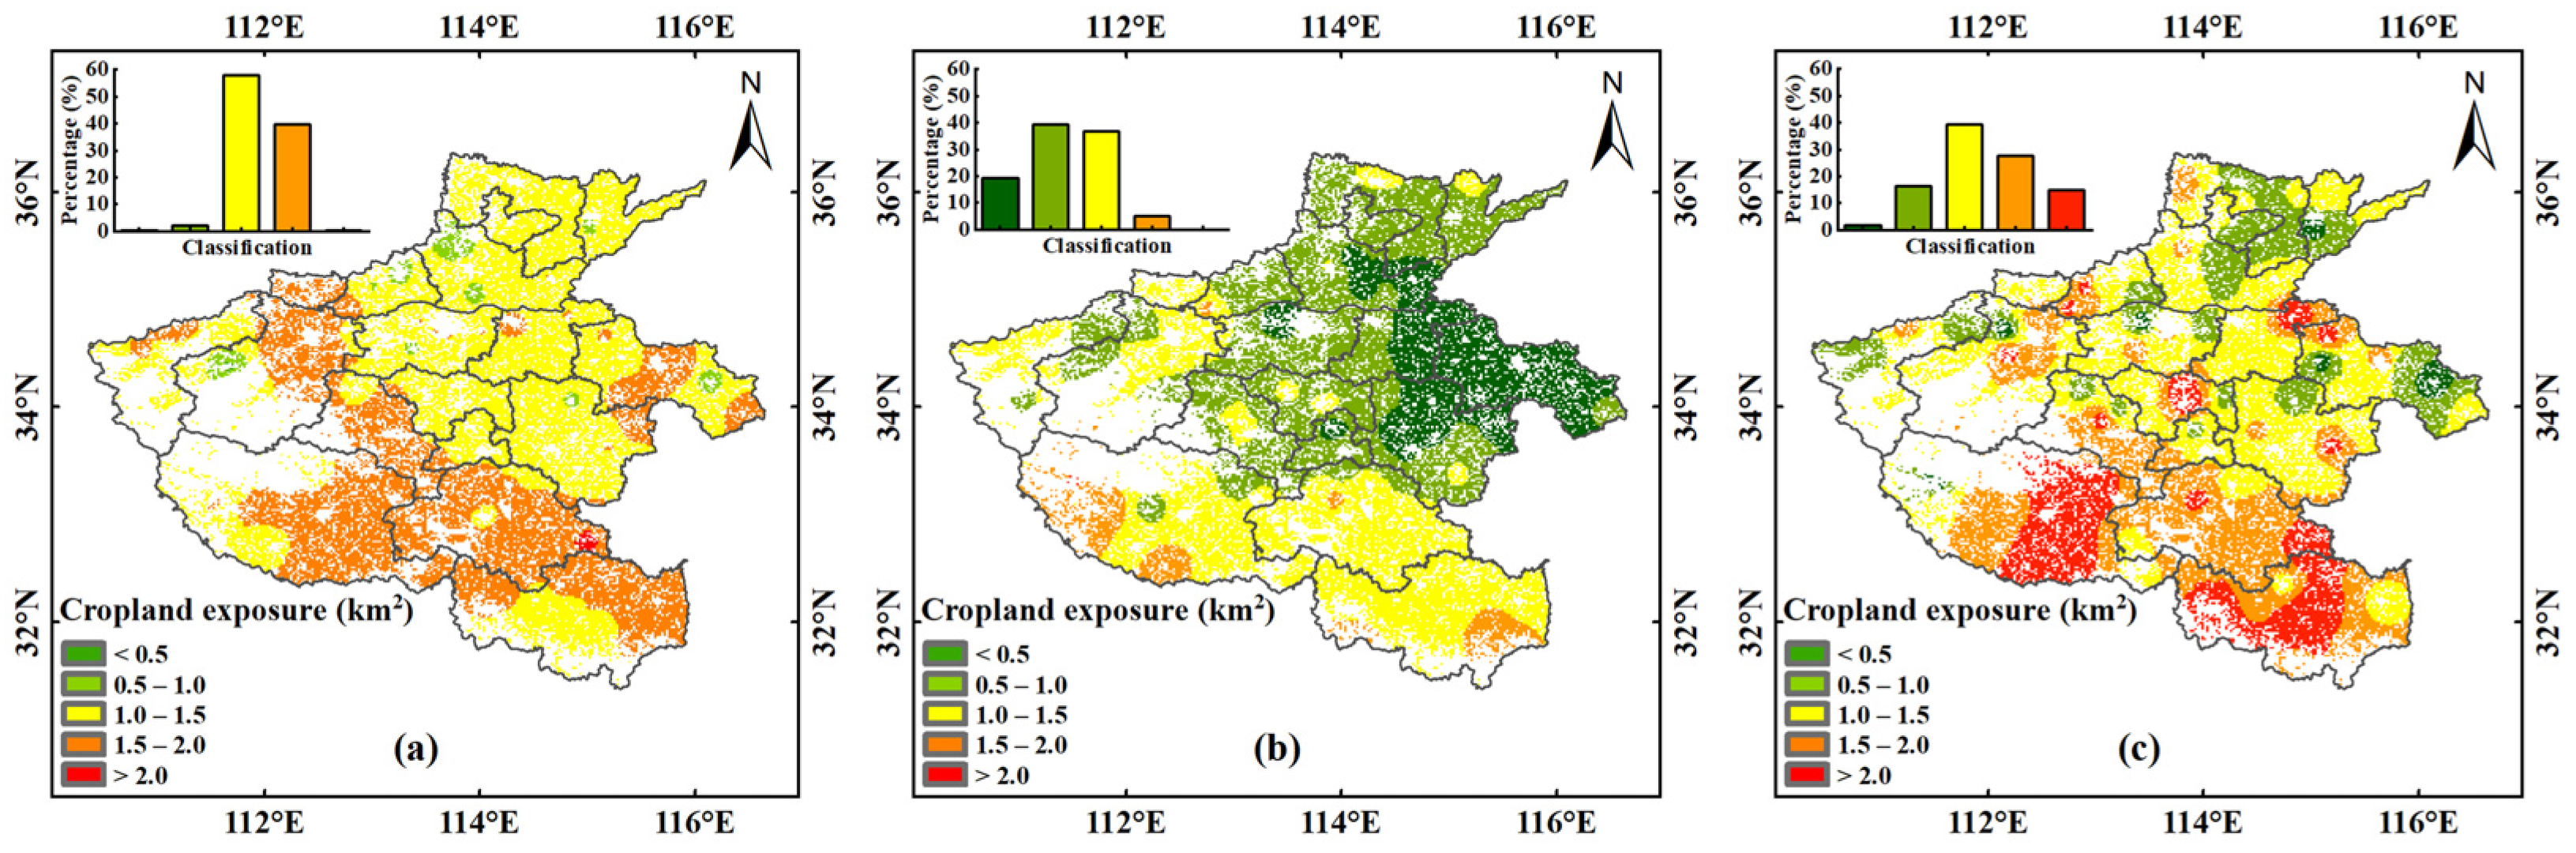
3.3. Cropland Exposure Characteristics

The average cropland exposure to drought of Henan Province during 1961–1999 was 33,302.81 km2, accounting for 24.32% of the total cropland area. Regions with high exposure (>1.5) were mainly distributed over Zhumadian, Nanyang, Xinyang, Pingdingshan, and Jiyuan cities (Figure 12a), accounting for 39.75% of total cropland exposure. In contrast, the cropland area exposed to drought decreased to 20 907.96 km2 (15.27% of the total cropland area) in 2000–2019, and that of high exposure (>1.5) decreased noticeably to 4.88% of total cropland exposure, with sporadic distribution in Xinyang, Nanyang, and Zhumadian cities (Figure 12b). The rate of low cropland exposure (<0.5) was observed in northern and eastern Henan Province, particularly in Shangqiu, eastern Kaifeng, and Zhoukou cities, accounting for 19.11% of total cropland exposure. In 2020–2029, the cropland area exposed to drought rose again to 33 745.12 km2, approximately 1.61-fold higher than that during 2000–2019 (Figure 12c). Cropland exposure > 1.5 accounted for 42.73% of total cropland exposure, mainly in Xinyang, Nanyang, and Zhumadian cities, whereas low cropland exposure (<0.5) showed sporadic distribution in Shangqiu and Anyang cities, accounting for 1.53% of total cropland exposure.
On the city scale, cropland exposure to drought was higher in Nanyang, Xinyang, and Zhumadian cities, with cropland exposure >4000 km2, whereas Zhumadian, Jiyuan, Nanyang, and Pingdingshan cities showed greater exposure during 1961–1999. However, from 2000 to 2019, all cities showed a decrease in cropland exposure, with the greatest decreases in Zhumadian, Zhoukou, Shangqiu, and Kaifeng cities. During 2020–2029, cropland exposure increased across 94.44% of all cities, particularly in Nanyang, Zhoukou, Shangqiu, Zhumadian, Xinyang, and Kaifeng cities. Notably, Sanmenxia city showed a clear decreasing trend during these two periods, with cropland exposure shifting from 1054.74 km2 to 739.77 km2 (Figure 13).

4. Discussion

4.1. Trends and Periodic Features of Drought Changes

The intensification of global warming and human activities and time-varying natural influences have greatly affected the global and regional precipitation and heat balance [47]. In this study, we found that the SPEI-12 showed an overall increasing trend during 1961–2019. Li et al. [56] reported a significant increasing trend of the SPEI-12 in the Huang–Huai–Hai Plain during 1963–2014 using the Penman–Monteith SPEI method, which was consistent with our results. In contrast, Lu et al. [57] showed a decreasing trend in the SPEI-12 with a rate of 0.131/decade during 1970–2020 in Henan Province using the Thornthwaite SPEI method. These discrepancies were likely due to differences in PET calculation [58]. For example, PET calculated using the Thornthwaite and Penman–Monteith methods can produce different results in arid and semiarid regions, showing opposite trends [24]. Another possible explanation is that the number of meteorological stations can lead to differences in the spatial distributions of SPEI values between analyses [59]. According to the Chinese Meteorological Disasters Ceremony, there were four severe droughts in the 1960s, which occurred in 1961, 1962, 1965, and 1966. Similarly, we detected periods of extreme and moderate dryness in the 1960s during the past six decades, with an average SPEI-12 of −0.50. However, likely due to the global warming hiatus in the early 21st century [60], we found that the 2000s was the wettest decade, with an average SPEI-12 of 0.49. After this period, the SPEI-12 exhibited a decreasing trend, at a rate of −0.0023/month, signaling a substantial shift toward warmer and drier conditions. Previous studies have shown that, after 2012, air temperature increased rapidly at a rate of 0.17 °C/decade [61], and that global warming would result in changes to regional precipitation and PET that in turn would exacerbate drought phenomena during the 21st century [7].
Based on Morlet wavelet analysis, we found that drought evolution in Henan Province during 1961–2019 was characterized by multiple time scales, with a major cycle of 26 years. The 6-year time scale was the second main cycle of drought variation. Similarly, Li et al. [62] reported that the SPEI-12 had a scale of 2–7 years in Henan Province during 1961–2015, and Tao et al. [63] reported that the SPEI-12 had a small scale of 5–10 years and a large scale of 15–23 years in the Henan section of the Yellow River during 1970–2020. This phenomenon may be partly attributed to the influence of the El Niño–Southern Oscillation (ENSO); a previous study reported that ENSO events can markedly weaken the intensity of Walker Circulation, causing less precipitation and frequent droughts in the North China Plain [64]. The ENSO events of 1961–1966 and 1997–1998 [65] were closely related to the occurrence of serious droughts in Henan Province. The Pacific Decadal Oscillation (PDO) is another major driver of DF in China, which may be modulated by the Western Pacific Subtropical High and the Mongolian High, resulting in high temperatures and low precipitation levels [66]. Additionally, the sunspot phase logarithm is commonly used to characterize the intensity of solar activity and its impact on hydrological processes occurring in an 11-year cycle [67]. The SPEI-12 and sunspot phase logarithm showed a significant positive phase resonance relation in the Henan section of the Yellow River during 1970–2020 [63]. According to its periodic features, Henan Province was in a dry state around 2019 and remained dry for the subsequent period, which was consistent with predictions based on our BO-LSTM model. However, further studies are needed to better understand this oscillatory behavior of dry/wet changes in Henan Province.

4.2. Drought Regional Differentiation Characteristics and Adaptation Recommendations

Drought is the main weather disaster influencing crop production in Henan Province. The investigation of the spatiotemporal patterns of drought can yield a better understanding of the mechanisms and factors influencing drought occurrence and evolution [68]. Here, we found that drought event characteristics shifted markedly between 1961–1999 and 2000–2019. DF was higher in southern Henan Province from 1961 to 1999, as observed in Nanyang, Zhumadian, and Xinyang cities, which is consistent with previous studies [43,69]; however, these areas showed lower MDD and MDS. In comparison, the maximum MDD and MDS decreased to 50.07% and 46.42% during 2000–2019. Xinyang, Nanyang Zhumadian, northwestern Sanmenxia, and southern parts of Luoyang cities had higher DF during 2000–2019, while the relatively high MDD and MDS had mainly shifted to some regions of Sanmenxia, Luoyang, and Xinyang cities. As is already known, southern Henan Province had relatively abundant rainfall, with annual rainfall of 760.2 mm [70], and the average temperature and extreme weather heat index showed marked variation [71], which may have resulted in higher DF. However, with climate change in recent years, precipitation has declined and temperatures have increased in western Henan Province [72], while annual mean temperatures showed a cooling trend in most other regions [73]. These may lead to changes in drought conditions to a certain extent. To prevent the influence of drought, the use of drought-tolerant crop varieties, appropriate irrigation methods, and efficient water and fertilizer application technologies have been widely implemented [74]. However, based on our BO-LSTM model results, the mean DF was projected to be 1.51 times that during 2000–2019, and regions with higher MDD (>15 months) and DPmax (1.5–2.0) increased by 340.07% and 128.13%, respectively, suggesting that more precise measures should be taken to support the development of low-cost and high-efficiency drought prevention facilities and equipment, as well as their supporting implementation plans.
In this study, based on a dataset from 100 meteorological stations, we systematically identified the spatiotemporal variation characteristics of drought and developed algorithms for regional drought prediction, enabling the adoption of proactive development strategies to prevent drought disasters. However, drought formation is a complex process, and relying solely on a single prediction model can lead to uncertainty. Future research should focus on employing hybrid models or integrating drought indices with relevant hydro-meteorological variables as prediction factors to derive drought indices. Additionally, we limited our objective to dry–wet patterns on a 12-month scale. In fact, meteorological drought conditions always vary greatly; a multi scale analysis to gain a comprehensive understanding of drought variation has yet to be further strengthened.

5. Conclusions

In this study, the temporal and spatial patterns of drought events during a historical period (1961–2019) and future period (2020–2029) were investigated using the SPEI-12 in Henan Province, China. The main conclusions are as follows:
(1)
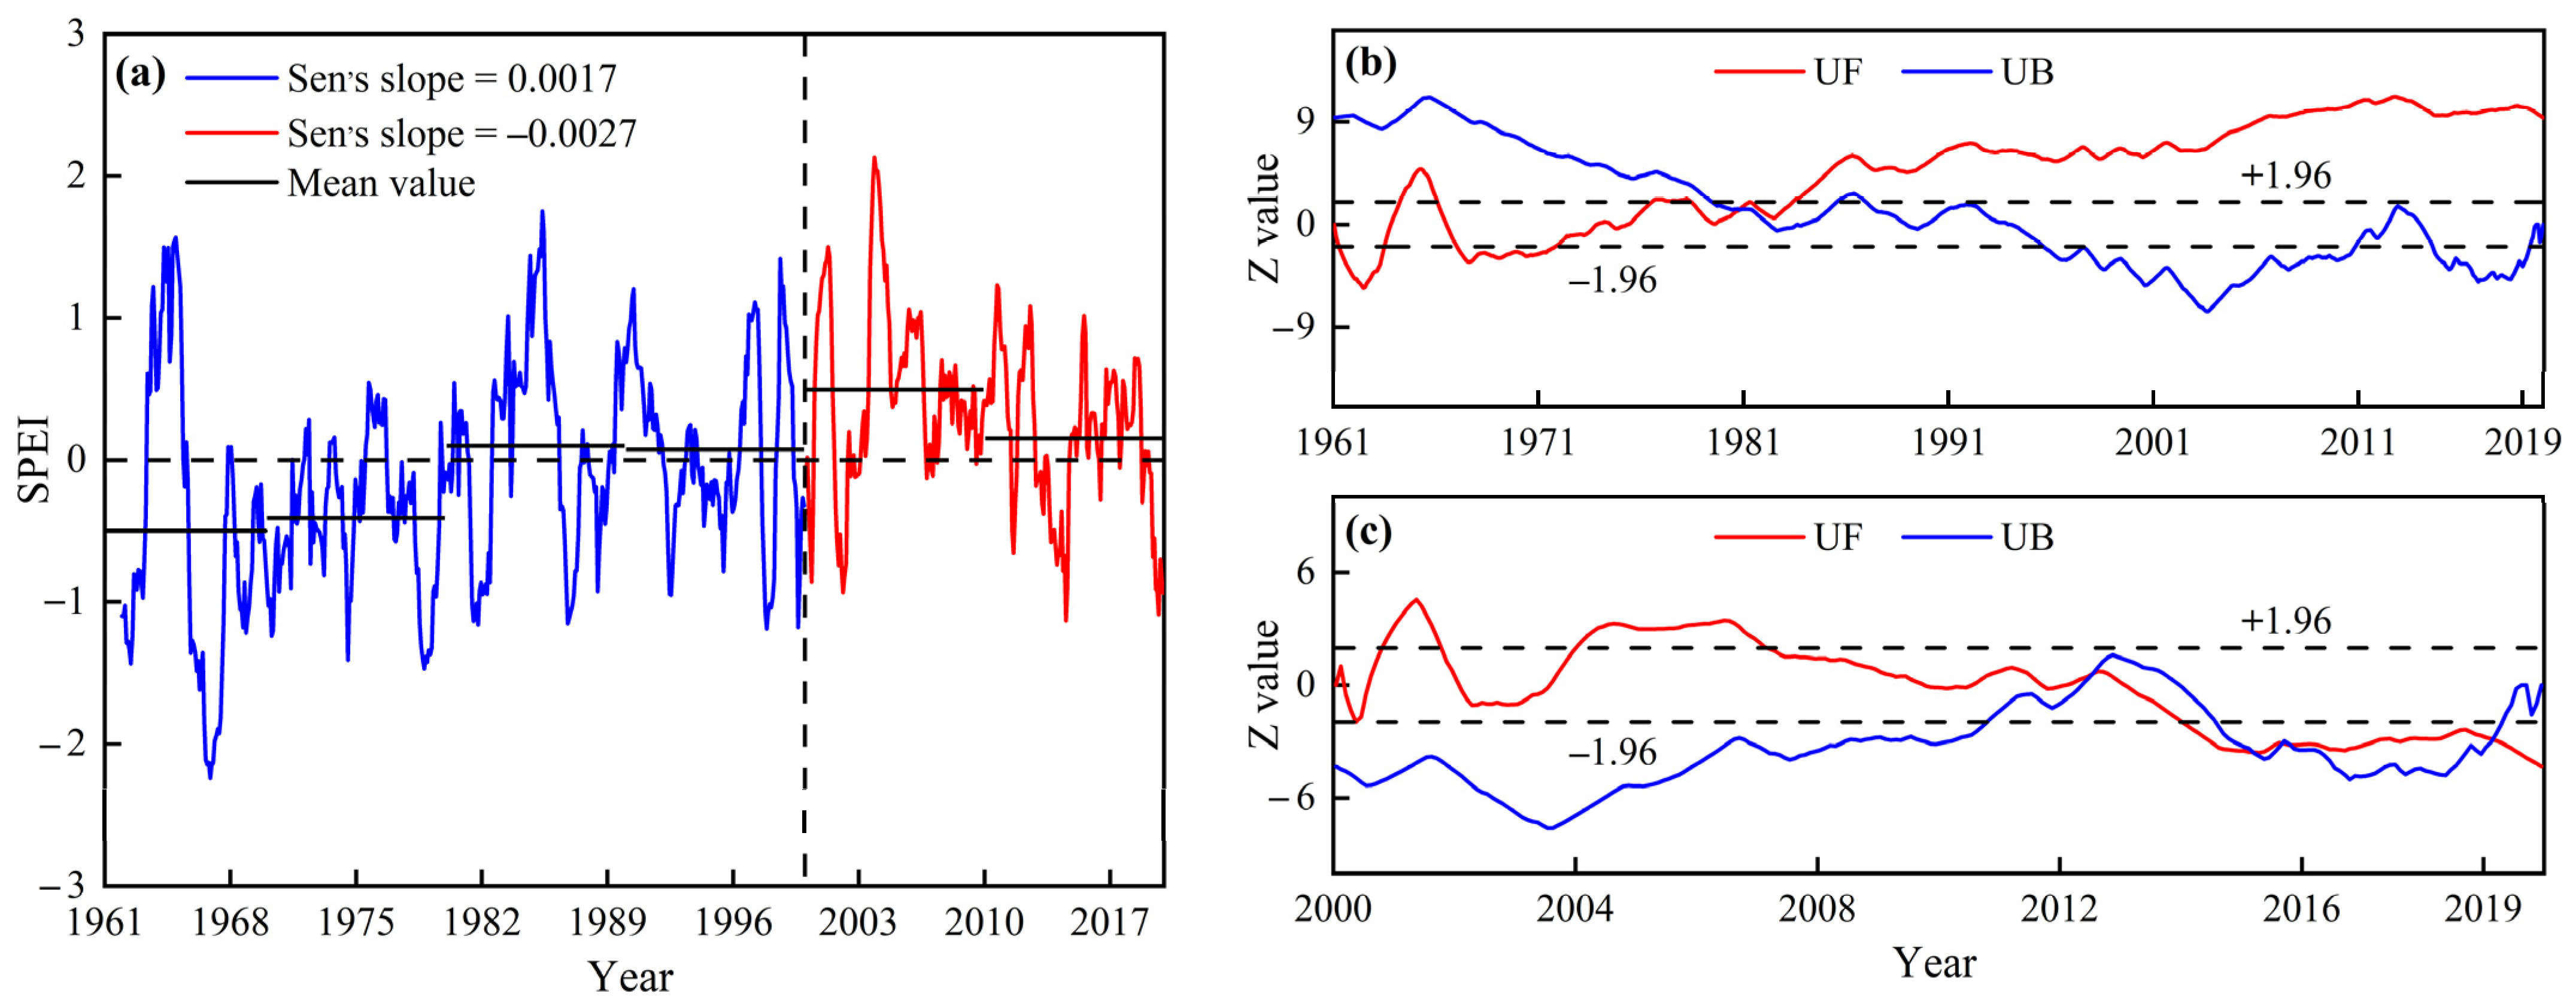
Based on Sen’s slope and MMK approaches, we demonstrated a predominant trend toward increasing wetness in Henan Province over the 59-year study period. However, we observed contradictory trends, i.e., a transition from dry to wet during 1961–1999, followed by a transition from wet to dry during 2000–2019. Wavelet analysis showed periodic variation in drought evolution with cycles of 6 and 26 years.
(2)
The spatial distribution of drought event characteristics indicated that southern Henan Province had a higher drought frequency; these droughts tended to have shorter duration and relatively low severity during 1961–2019. We also found that the drought frequency, higher drought duration and peak would greatly increase to 1.28–3.40-fold compared with that of 2000–2019 using the BO-LSTM model.
(3)
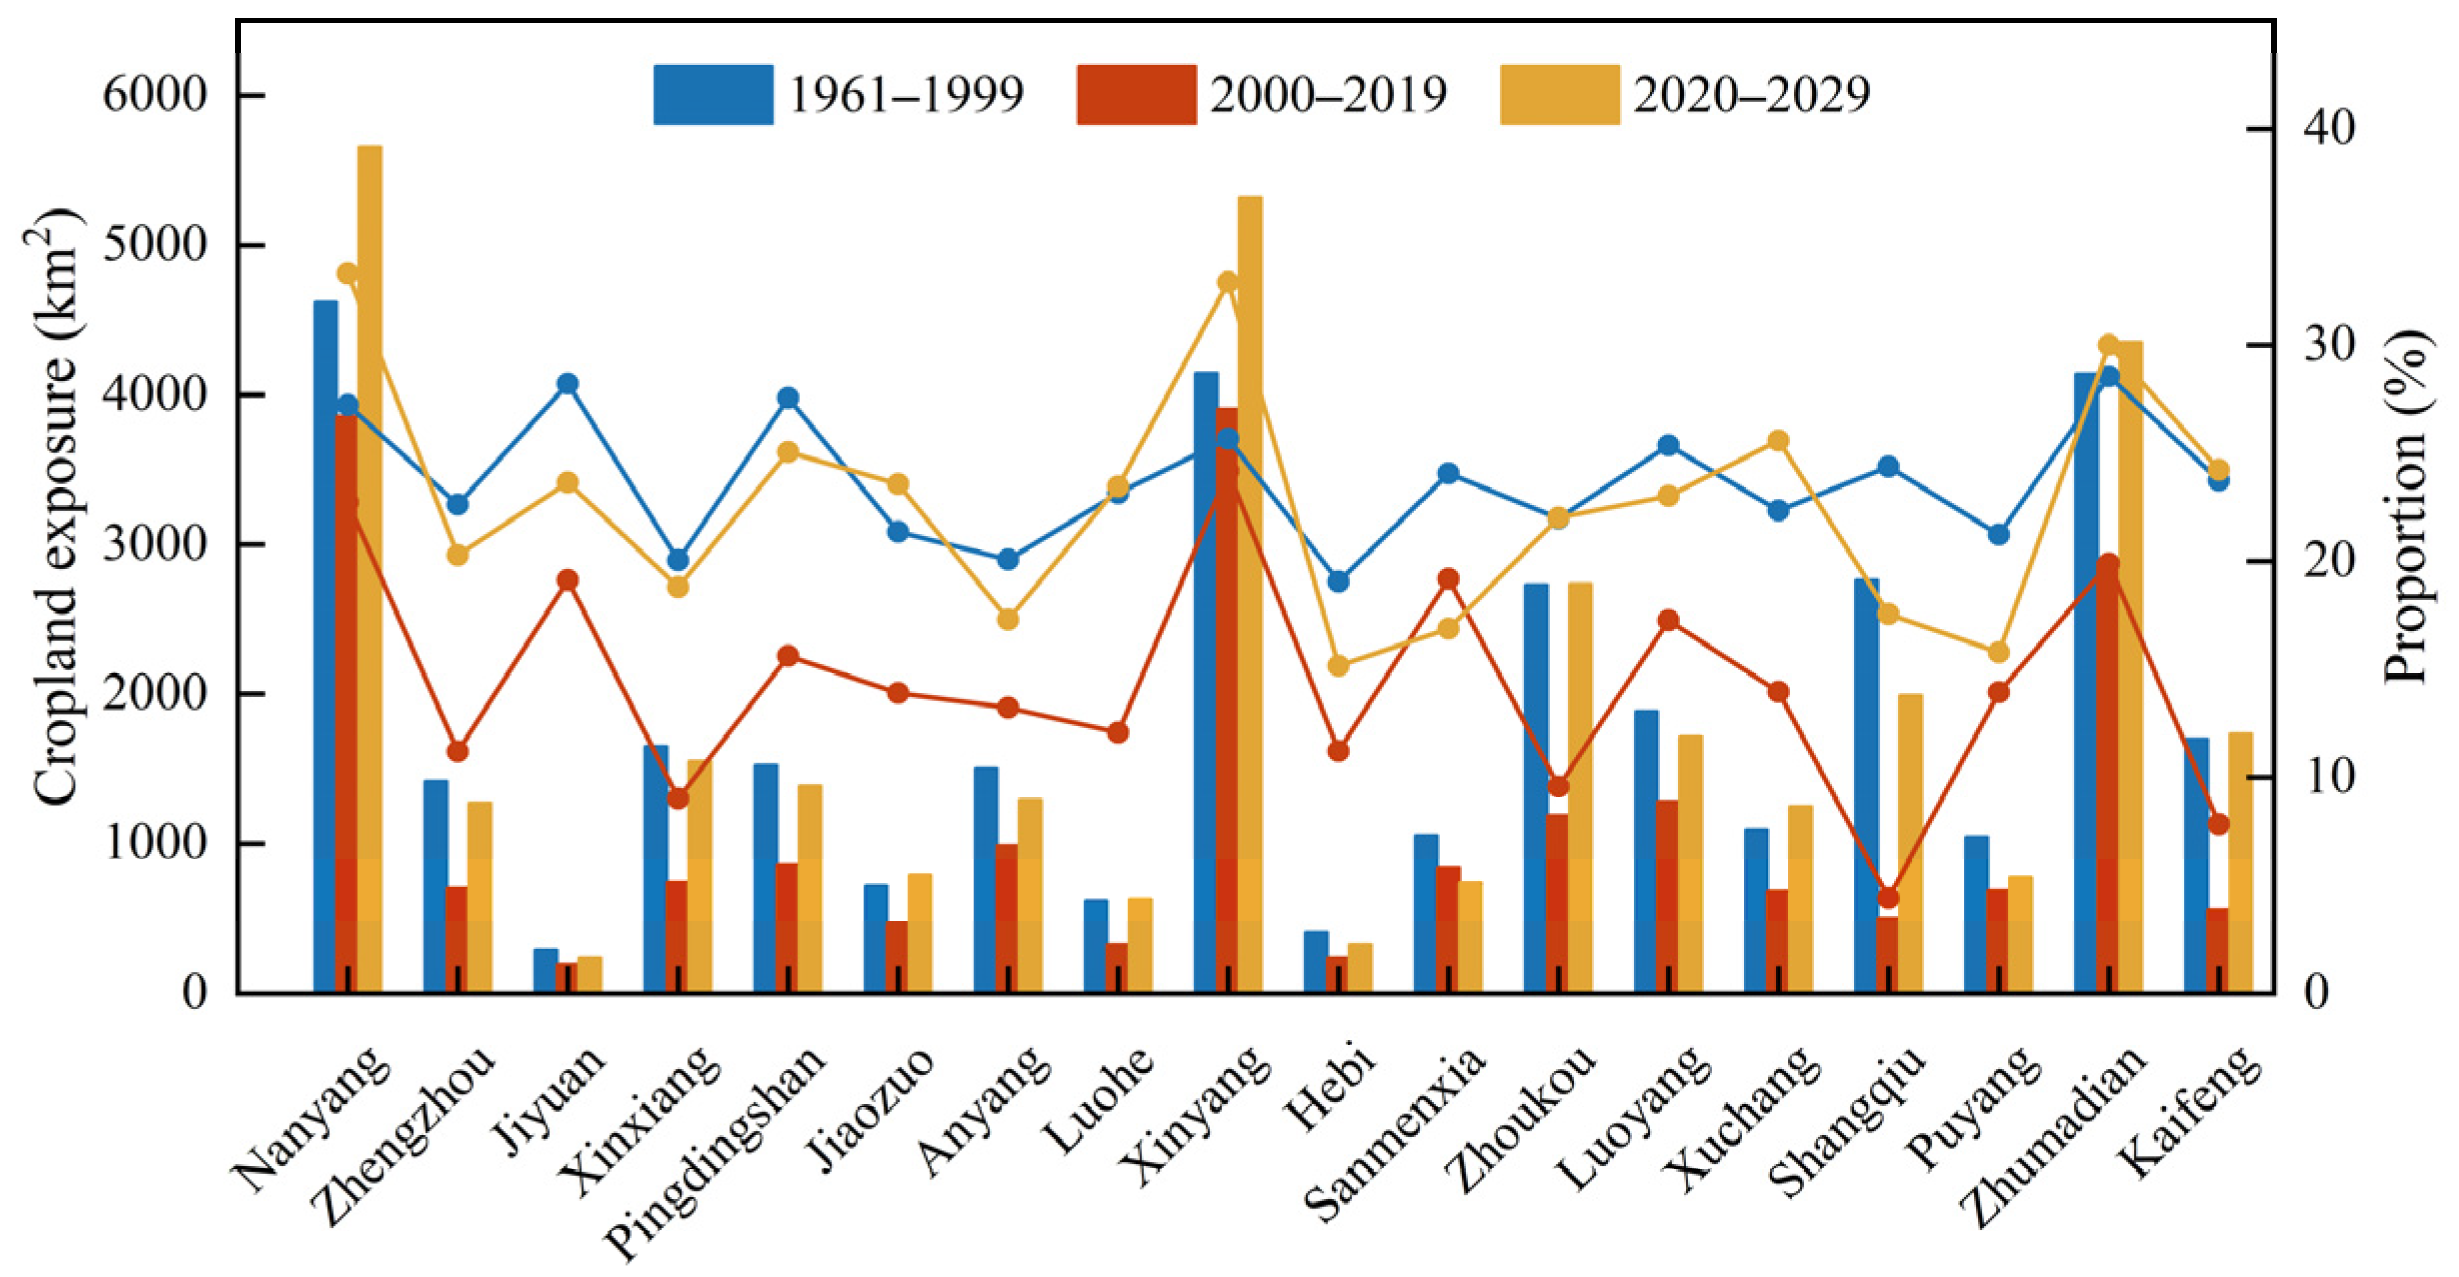
The average cropland exposure to drought of Henan Province during 1961–1999 was 33,302.81 km2, while it decreased to 20,907.96 km2 in the first two decades of the 21st century, and could rise again to 33,745.12 km2 in the near future. On the city scale, 94.44% of cities would face increasing cropland exposure challenges.

Author Contributions

Data curation, Y.L. (Yuanyuan Luo); Investigation, L.G. and J.G.; Resources, Y.L. (Yuanyuan Luo) and L.G.; Software, Y.L. (Yuanyuan Luo) and Y.L. (Yao Li); Supervision, T.W., H.Z., Y.Z. and S.W.; Validation, Y.L. (Yao Li) and J.G.; Writing—original draft, Y.L. (Yuanyuan Luo); Writing—review and editing, L.G., J.G. and S.W. All authors have read and agreed to the published version of the manuscript.

Funding

This research was funded by the Qinghai Kunlun High-end Talents Project, National Natural Science Foundation of China (No. 42271124), the project of science and technology of the Henan province (No. 212102310028), and Young backbone teachers of Henan Polytechnic University, China (No. 2020XQG-02).

Data Availability Statement

Data are contained within the article.

Acknowledgments

The authors would like to thank the researchers who provided the open-source algorithms, which were extremely helpful to the research conducted in this paper.

Conflicts of Interest

The authors declare no conflict of interest.

References

  1. Yao, N.; Li, Y.; Lei, T.; Peng, L. Drought evolution, severity and trends in mainland China over 1961–2013. Sci. Total Environ. 2018, 616, 73–89. [Google Scholar] [CrossRef]
  2. Douris, J.; Kim, G. WMO Atlas of Mortality and Economic Losses from Weather, Climate and Water Extremes (1970–2019) (WMO-No. 1267). In WMO Statement on the State of the Global Climate; WMO: Geneva, Switzerland, 2021; Volume 1267. [Google Scholar]
  3. Ciais, P.; Reichstein, M.; Viovy, N.; Granier, A.; Ogée, J.; Allard, V.; Aubinet, M.; Buchman, N.; Bernhofer, C.; Carrara, A. Europe-wide reduction in primary productivity caused by the heat and drought in 2003. Nature 2005, 437, 529–533. [Google Scholar] [CrossRef] [PubMed]
  4. Masih, I.; Maskey, S.; Mussá, F.E.F.; Trambauer, P. A review of droughts on the African continent: A geospatial and long-term perspective. Hydrol. Earth Syst. Sci. 2014, 18, 3635–3649. [Google Scholar] [CrossRef]
  5. Hua, L.; Ma, Z.; Zhong, L. A Comparative Analysis of Primary and Extreme Characteristics of Dry or Wet Status between Asia and North America. Adv. Atmos. Sci. 2011, 28, 352–362. [Google Scholar] [CrossRef]
  6. Stagge, J.H.; Kingston, D.G.; Tallaksen, L.M.; Hannah, D.M. Observed drought indices show increasing divergence across Europe. Sci. Rep. 2017, 7, 14045. [Google Scholar] [CrossRef] [PubMed]
  7. Zeng, P.; Sun, F.; Liu, Y.; Wang, Y.; Li, G.; Che, Y. Mapping future droughts under global warming across China: A combined multi-timescale meteorological drought index and SOM-Kmeans approach. Weather Clim. Extrem. 2021, 31, 100304. [Google Scholar] [CrossRef]
  8. Naumann, G.; Alfieri, L.; Wyser, K.; Mentaschi, L.; Betts, R.; Carrao, H.; Spinoni, J.; Feyen, L. Global changes in drought conditions under different levels of warming. Geophys. Res. Lett. 2018, 45, 3285–3296. [Google Scholar] [CrossRef]
  9. Araujo, D.S.A.; Marra, F.; Merow, C.; Nikolopoulos, E. Today’s 100 year droughts in Australia may become the norm by the end of the century. Environ. Res. Lett. 2022, 17, 044034. [Google Scholar] [CrossRef]
  10. Jenkins, K.; Warren, R. Quantifying the impact of climate change on drought regimes using the Standardised Precipitation Index. Theor. Appl. Climatol. 2015, 120, 41–54. [Google Scholar] [CrossRef]
  11. Spinoni, J.; Barbosa, P.; Bucchignani, E.; Cassano, J.; Cavazos, T.; Christensen, J.H.; Christensen, O.B.; Coppola, E.; Evans, J.; Geyer, B.; et al. Future Global Meteorological Drought Hot Spots: A Study Based on CORDEX Data. J. Clim. 2020, 33, 3635–3661. [Google Scholar] [CrossRef]
  12. Hari, V.; Rakovec, O.; Markonis, Y.; Hanel, M.; Kumar, R. Increased Future Occurrences of the Exceptional 2018–2019 Central European Drought under Global Warming. Sci. Rep. 2020, 10, 12207. [Google Scholar] [CrossRef]
  13. Haile, G.G.; Tang, Q.; Hosseini-Moghari, S.; Liu, X.; Gebremicael, T.G.; Leng, G.; Kebede, A.; Xu, X.; Yun, X. Projected Impacts of Climate Change on Drought Patterns over East Africa. Earth’s Future 2020, 8, e2020EF001502. [Google Scholar] [CrossRef]
  14. West, H.; Quinn, N.; Horswell, M. Remote sensing for drought monitoring & impact assessment: Progress, past challenges and future opportunities. Remote Sens. Environ. 2019, 232, 111291. [Google Scholar] [CrossRef]
  15. Başağaoğlu, H.; Sharma, C.; Chakraborty, D.; Yoosefdoost, I.; Bertetti, F.P. Heuristic data-inspired scheme to characterize meteorological and groundwater droughts in a semi-arid karstic region under a warming climate. J. Hydrol. Reg. Stud. 2023, 48, 101481. [Google Scholar] [CrossRef]
  16. McKee, T.B.; Doesken, N.J.; Kleist, J. The relationship of drought frequency and duration to time scales. In Proceedings of the Eighth Conference on Applied Climatology, Anaheim, CA, USA, 17–22 January 1993; Volume 17, pp. 179–183. [Google Scholar]
  17. Trenberth, K.E.; Dai, A.; van der Schrier, G.; Jones, P.D.; Barichivich, J.; Briffa, K.R.; Sheffield, J. Global warming and changes in drought. Nat. Clim. Chang. 2014, 4, 17–22. [Google Scholar] [CrossRef]
  18. Beguería, S.; Vicente-Serrano, S.M.; Reig, F.; Latorre, B. Standardized precipitation evapotranspiration index (SPEI) revisited: Parameter fitting, evapotranspiration models, tools, datasets and drought monitoring. Int. J. Climatol. 2014, 34, 3001–3023. [Google Scholar] [CrossRef]
  19. Sheffield, J.; Wood, E.F.; Roderick, M.L. Little change in global drought over the past 60 years. Nature 2012, 491, 435–438. [Google Scholar] [CrossRef] [PubMed]
  20. Hui-Mean, F.; Yusop, Z.; Yusof, F. Drought analysis and water resource availability using standardised precipitation evapotranspiration index. Atmos. Res. 2018, 201, 102–115. [Google Scholar] [CrossRef]
  21. Vicente-Serrano, S.M.; Beguería, S.; López-Moreno, J.I. A multiscalar drought index sensitive to global warming: The standardized precipitation evapotranspiration index. J. Clim. 2010, 23, 1696–1718. [Google Scholar] [CrossRef]
  22. Vicente-Serrano, S.M.; Beguería, S.; Lorenzo-Lacruz, J.; Camarero, J.J.; López-Moreno, J.I.; Azorin-Molina, C.; Revuelto, J.; Morán-Tejeda, E.; Sanchez-Lorenzo, A. Performance of Drought Indices for Ecological, Agricultural, and Hydrological Applications. Earth Interact. 2012, 16, 1–27. [Google Scholar] [CrossRef]
  23. Ionita, M.; Nagavciuc, V. Changes in drought features at the European level over the last 120 years. Nat. Hazards Earth Syst. Sci. 2021, 21, 1685–1701. [Google Scholar] [CrossRef]
  24. Wang, H.; Cao, L.; Li, X.; Feng, R.; Zheng, P. Differences in drought evolution as portrayed for China using various evapotranspiration models and drought indices. Int. J. Climatol. 2022, 42, 9404–9429. [Google Scholar] [CrossRef]
  25. Ullah, I.; Ma, X.; Yin, J.; Asfaw, T.G.; Azam, K.; Syed, S.; Liu, M.; Arshad, M.; Shahzaman, M. Evaluating the meteorological drought characteristics over Pakistan using in situ observations and reanalysis products. Int. J. Climatol. 2021, 41, 4437–4459. [Google Scholar] [CrossRef]
  26. Sharafi, S.; Ghaleni, M.M. Spatial assessment of drought features over different climates and seasons across Iran. Theor. Appl. Climatol. 2021, 147, 941–957. [Google Scholar] [CrossRef]
  27. Shi, L.; Feng, P.; Wang, B.; Liu, D.; Yu, Q. Quantifying future drought change and associated uncertainty in southeastern Australia with multiple potential evapotranspiration models. J. Hydrol. 2020, 590, 125394. [Google Scholar] [CrossRef]
  28. Thornthwaite, C.W. An Approach toward a Rational Classification of Climate. Geogr. Rev. 1948, 38, 55–94. [Google Scholar] [CrossRef]
  29. Allen, R.G.; Pereira, L.S.; Raes, D.; Smith, M. Crop Evapotranspiration-Guidelines for Computing Crop Water Requirements; FAO Irrigation and Drainage Paper 56; FAO: Rome, Italy, 1998; pp. 1–289. [Google Scholar]
  30. Um, M.J.; Kim, Y.; Park, D.; Jung, K.; Wang, Z.; Kim, M.M.; Shin, H. Impacts of potential evapotranspiration on drought phenomena in different regions and climate zones. Sci. Total Environ. 2020, 703, 135590. [Google Scholar] [CrossRef]
  31. Zhou, S.; Wang, Y.; Li, Z.; Chang, J.; Guo, A.; Zhou, K. Characterizing spatio-temporal patterns of multi-scalar drought risk in mainland China. Ecol. Indic. 2021, 131, 108189. [Google Scholar] [CrossRef]
  32. Hao, Z.; Singh, V.P.; Xia, Y. Seasonal Drought Prediction: Advances, Challenges, and Future Prospects. Rev. Geophys. 2018, 56, 108–141. [Google Scholar] [CrossRef]
  33. Deo, R.C.; Şahin, M. Application of the Artificial Neural Network model for prediction of monthly Standardized Precipitation and Evapotranspiration Index using hydrometeorological parameters and climate indices in eastern Australia. Atmosph. Res. 2015, 161, 65–81. [Google Scholar] [CrossRef]
  34. Ortiz-Garcia, E.; Salcedo-Sanz, S.; Casanova-Mateo, C. Accurate precipitation prediction with support vector classifiers: A study including novel predictive variables and observational data. Atmos. Res. 2014, 139, 128–136. [Google Scholar] [CrossRef]
  35. Xiong, B.; Li, R.; Ren, D.; Liu, H.; Xu, T.; Huang, Y. Prediction of flooding in the downstream of the Three Gorges Reservoir based on a back propagation neural network optimized using the AdaBoost algorithm. Nat. Hazards 2021, 107, 1559–1575. [Google Scholar] [CrossRef]
  36. Xiao, C.; Chen, N.; Hu, C.; Wang, K.; Gong, J.; Chen, Z. Short and mid-term sea surface temperature prediction using time-series satellite data and LSTM-AdaBoost combination approach. Remote Sens. Environ. 2019, 233, 111358. [Google Scholar] [CrossRef]
  37. Xu, Y.; Hu, C.; Wu, Q.; Jian, S.; Li, Z.; Chen, Y.; Zhang, G.; Zhang, Z.; Wang, S. Research on particle swarm optimization in LSTM neural networks for rainfall-runoff simulation. J. Hydrol. 2022, 608, 127553. [Google Scholar] [CrossRef]
  38. Wu, J.; Chen, X.Y.; Zhang, H.; Xiong, L.D.; Lei, H.; Deng, S.H. Hyperparameter Optimization for Machine Learning Models Based on Bayesian Optimizationb. J. Electron. Sci. Technol. 2019, 17, 26–40. [Google Scholar] [CrossRef]
  39. Di, Y.; Gao, M.; Feng, F.; Li, Q.; Zhang, H. A New Framework for Winter Wheat Yield Prediction Integrating Deep Learning and Bayesian Optimization. Agronomy 2022, 12, 3194. [Google Scholar] [CrossRef]
  40. Zou, S.; Zhang, L.; Huang, X.; Osei, F.B.; Ou, G. Early Ecological Security Warning of Cultivated Lands Using RF-MLP Integration Model: A Case Study on China’s Main Grain-Producing Areas. Ecol. Indic. 2022, 141, 109059. [Google Scholar] [CrossRef]
  41. Wang, Z.; Zhang, E.; Chen, G. Spatiotemporal Variation and Influencing Factors of Grain Yield in Major Grain-Producing Counties: A Comparative Study of Two Provinces from China. Land 2023, 12, 1810. [Google Scholar] [CrossRef]
  42. Zhu, Y.; Pan, P.; Kuang, X.; Yang, N.; Liu, Y. Changing Characteristics and Causes Analysis of Drought Disaster in Henan Province. Chin. J. Agrometeorol. 2011, 32, 311–316. [Google Scholar] [CrossRef]
  43. Shi, B.; Zhu, X.; Hu, Y.; Yang, Y. Drought characteristics of Henan province in 1961-2013 based on Standardized Precipitation Evapotranspiration Index. J. Geogr. Sci. 2017, 27, 311–325. [Google Scholar] [CrossRef]
  44. Xu, L.; Chen, N.; Yang, C.; Zhang, C.; Yu, H. A parametric multivariate drought index for drought monitoring and assessment under climate change. Agric. For. Meteorol. 2021, 310, 108657. [Google Scholar] [CrossRef]
  45. Zhao, H.Y.; Gao, G.; Yan, X.D.; Zhang, Q. Risk assessment of agricultural drought using the CERES-Wheat model: A case study of Henan Plain, China. Clim. Res. 2011, 50, 247–256. [Google Scholar] [CrossRef]
  46. Easterling, D.R.; Wehner, M.F. Is the climate warming or cooling? Geophys. Res. Lett. 2009, 36, L08706. [Google Scholar] [CrossRef]
  47. Lean, J.L. Observation-based detection and attribution of 21st century climate change. Wiley Interdiscip. Rev. Clim. Chang. 2018, 9, e511. [Google Scholar] [CrossRef]
  48. Asong, Z.E.; Wheater, H.S.; Bonsal, B.; Razavi, S.; Kurkute, S. Historical drought patterns over Canada and their teleconnections with large-scale climate signals. Hydrol. Earth Syst. Sci. 2018, 22, 3105–3124. [Google Scholar] [CrossRef]
  49. Yao, N.; Li, L.; Feng, P.Y.; Feng, H.; Liu, D.L.; Liu, Y.; Jiang, K.T.; Hu, X.T.; Li, Y. Projections of drought characteristics in China based on a standardized precipitation and evapotranspiration index and multiple GCMs. Sci. Total Environ. 2020, 704, 135245. [Google Scholar] [CrossRef] [PubMed]
  50. Khan, N.; Shahid, S.; Ismail, T.B.; Wang, X.J. Spatial distribution of unidirectional trends in temperature and temperature extremes in Pakistan. Theor. Appl. Climatol. 2019, 136, 899–913. [Google Scholar] [CrossRef]
  51. Cao, S.; He, Y.; Zhang, L.; Chen, Y.; Yang, W. Spatiotemporal characteristics of drought and its impact on vegetation in the vegetation region of Northwest China. Ecol. Indic. 2021, 133, 108420. [Google Scholar] [CrossRef]
  52. Ayantobo, O.O.; Li, Y.; Song, S.; Yao, N. Spatial comparability of drought characteristics and related return periods in mainland China over 1961–2013. J. Hydrol. 2017, 550, 549–567. [Google Scholar] [CrossRef]
  53. Yevjevich, V.M. An Objective Approach to Definitions and Investigations of Continental Hydrologic Droughts; Hydrology Papers; Colorado State University: Fort Collins, CO, USA, 1967. [Google Scholar]
  54. Moriconi, R.; Deisenroth, M.P.; Sesh Kumar, K.S. High-dimensional Bayesian optimization using low-dimensional feature spaces. Mach. Learn. 2020, 109, 1925–1943. [Google Scholar] [CrossRef]
  55. Wang, A.; Tao, H.; Ding, G.; Zhang, B.; Huang, J.; Wu, Q. Global cropland exposure to extreme compound drought heatwave events under future climate change. Weather Clim. Extrem. 2023, 40, 100559. [Google Scholar] [CrossRef]
  56. Li, X.; Ju, H.; Liu, Q.; Li, Y.; Qin, X. Analysis of drought characters based on the SPEI-PM index in Huang-Huai-Hai Plain. Acta Ecol. Sin. 2017, 37, 2054–2066. [Google Scholar] [CrossRef]
  57. Lu, J.; Rong, G.; Feng, Y.; Zuo, T. Drought Characteristics and Its Correlation with Circulation Index in Henan Province Based on SPEI Index. Chin. Rural Water Hydropower 2022, 17–24. [Google Scholar] [CrossRef]
  58. Wang, Z.; Li, J.; Lai, C.; Zeng, Z.; Zhong, R.; Chen, X.; Zhou, X.; Wang, M. Does drought in China show a significant decreasing trend from 1961 to 2009? Sci. Total Environ. 2017, 579, 314–324. [Google Scholar] [CrossRef] [PubMed]
  59. Feng, W.; Lu, H.; Yao, T.; Yu, Q. Drought characteristics and its elevation dependence in the Qinghai-Tibet plateau during the last half-century. Sci. Rep. 2020, 10, 14323. [Google Scholar] [CrossRef]
  60. Guan, X.; Huang, J.; Guo, R. Changes in aridity in response to the global warming hiatus. J. Meteorol. Res. 2017, 31, 117–125. [Google Scholar] [CrossRef]
  61. Du, Q.; Zhang, M.; Wang, S.; Che, C.; Ma, R.; Ma, Z. Changes in air temperature over China in response to the recent global warming hiatus. J. Geogr. Sci. 2019, 29, 496–516. [Google Scholar] [CrossRef]
  62. Li, Z.; Zhu, L.; Zhang, Y.; He, P. Spatial and temporal variations of drought in Henan Province over a 55-year period based on standardized precipitation index. Jiangsu Agric. Sci. 2018, 46, 237–242. [Google Scholar] [CrossRef]
  63. Tao, J.; Qiao, W.; Li, H.; Qu, X.; Gan, R. Spatial and temporal evolution characteristics and causes of drought and flood in the Henan section of the Yellow River. Nat. Hazards 2022, 113, 997–1016. [Google Scholar] [CrossRef]
  64. Wang, F.; Wang, Z.; Yang, H.; Di, D.; Zhao, Y.; Liang, Q. Utilizing GRACE-based groundwater drought index for drought characterization and teleconnection factors analysis in the North China Plain. J. Hydrol. 2020, 585, 124849. [Google Scholar] [CrossRef]
  65. Xu, W.; Wang, W.; Ma, J.; Xu, D. ENSO events during 1951–2007 and their characteristic indices. J. Nat. Dis. 2009, 18, 18–24. [Google Scholar] [CrossRef]
  66. Qian, C.; Yu, J.Y.; Chen, G. Decadal summer drought frequency in China: The increasing influence of the Atlantic Multi-decadal Oscillation. Environ. Res. Lett. 2014, 9, 124004. [Google Scholar] [CrossRef]
  67. Dong, L.; Fu, C.; Liu, J.; Zhang, P. Combined effects of solar activity and El Niño on hydrologic patterns in the Yoshino River Basin, Japan. Water Resour. Manag. 2018, 32, 2421–2435. [Google Scholar] [CrossRef]
  68. Zhou, L.; Wu, J.; Mo, X.; Zhou, H.; Diao, C.; Wang, Q.; Chen, Y.; Zhang, F. Quantitative and detailed spatiotemporal patterns of drought in China during 2001–2013. Sci. Total Environ. 2017, 589, 136–145. [Google Scholar] [CrossRef]
  69. Yuan, B.; Wang, S.; Guo, L. Drought Vulnerability Assessment of Winter Wheat Using an Improved Entropy-Comprehensive Fuzzy Evaluation Method: A Case Study of Henan Province in China. Atmosphere 2023, 14, 779. [Google Scholar] [CrossRef]
  70. Shang, D.; Zhang, Z.; Yue, Y.; Hu, C.; Wang, Q. Drought characteristics analysis of Henan Province based on standardized precipitation index in recent 45 years. Agric. Res. Arid Areas 2021, 39, 162–170. [Google Scholar] [CrossRef]
  71. Ma, X.; Zhao, J. Analysis on Characteristics of Extreme Temperature Change and Cycle of Southern Henan from 1958 to 2013. Resour. Sci. 2014, 36, 1825–1833. [Google Scholar]
  72. Zhang, Y.; Xiao, F. Study on Precipitation and Temperature Change in Western Henan Mountain Area. J. Nat. Resour. 2010, 25, 2132–2141. [Google Scholar] [CrossRef]
  73. Xie, Y.; Huang, J.; Liu, Y. From accelerated warming to warming hiatus in China. Int. J. Climatol. 2017, 37, 1758–1773. [Google Scholar] [CrossRef]
  74. Wu, B.; Ma, Z.; Boken, V.K.; Zeng, H.; Shang, J.; Igor, S.; Wang, J.; Yan, N. Regional differences in the performance of drought mitigation measures in 12 major wheat-growing regions of the world. Agric. Water Manag. 2022, 273, 107888. [Google Scholar] [CrossRef]
Figure 1. (a) Geographic location, (b) location of meteorological stations, and (c) spatial distribution of cropland of the study area.
Sustainability 15 15737 g001
Figure 2. Drought event characteristics based on Run theory.
Sustainability 15 15737 g002
Figure 3. (a) Temporal variation of the 12-month SPEI-12 during 1961–2019 and abrupt changes in the SPEI-12 in Henan Province during (b) 1961–2019 and (c) 2000–2019.
Sustainability 15 15737 g003
Figure 4. Percentage of dryness and wetness classes occurring in Henan Province during 1961–2019.
Sustainability 15 15737 g004
Figure 5. Spatial distribution of SPEI-12 trends in Henan Province during (a) 1961–2019, (b) 1961–1999, and (c) 2000–2019.
Sustainability 15 15737 g005
Figure 6. Map of annual average SPEI-12 Morlet wavelet coefficients and wavelet variance during (a,b) 1961–2019, (c,d) 1961–1999, and (e,f) 2000–2019 in Henan Province.
Sustainability 15 15737 g006
Figure 7. Spatial patterns of drought event characteristics including DF, MDD, MDS, MDI, and DPmax in Henan Province during (a1e1) 1961–2019, (a2e2) 1961–1999, and (a3e3) 2000–2019.
Sustainability 15 15737 g007
Figure 8. Observed SPEI-12 values for the three models during the (a) training and (b) testing periods in Henan Province and (c) performance indices in the testing data.
Sustainability 15 15737 g008
Figure 9. Effectiveness of the BO-LSTM model for all stations during 1961–2019 in Henan Province.
Sustainability 15 15737 g009
Figure 10. (a) Temporal variation in SPEI-12 and (b) spatial distribution of the SPEI-12 trend in Henan Province during 2020–2029.
Sustainability 15 15737 g010
Figure 11. Spatial patterns of projected drought event characteristics (a) DF, (b) MDD, (c) MDS, (d) MDI, and (e) DPmax during 2020–2029 in Henan Province.
Sustainability 15 15737 g011aSustainability 15 15737 g011b
Figure 12. Spatial distribution of annual cropland exposure to drought in Henan Province during (a) 1961–1999, (b) 2000–2019, and (c) 2020–2029.
Sustainability 15 15737 g012
Figure 13. Cropland area exposed to drought and its percentage in the original cropland area in 18 regions for 1961–1999, 2000–2019, and 2020–2029.
Sustainability 15 15737 g013
Table 1. The drought event characteristics of the 10 most severe drought events occurred at the provincial level during 1961 to 2019 based on the drought severity from high to low.
RegionEventInitiation TimePeak TimeTermination TimeDD (Months)DSDIDP
HenanD1Oct-1965Nov-1966Oct-19672540.311.612.24
D2Jul-1968Apr-1970May-19713526.420.751.24
D3Dec-1961Jun-1962Apr-19631716.850.991.43
D4Jul-1978Oct-1978Aug-19791416.181.161.47
D5Jun-1981Oct-1981Jul-19821412.650.901.16
D6Oct-1986Oct-1986Jul-1987107.460.751.15
D7Oct-1997Nov-1997May-199887.240.911.19
D8Jul-1974Jul-1974Jun-1975126.240.521.41
D9Sep-2019Sep-2019Dec-201943.570.891.09
D10Aug-1999Aug-1999Jan-200063.090.521.18
Disclaimer/Publisher’s Note: The statements, opinions and data contained in all publications are solely those of the individual author(s) and contributor(s) and not of MDPI and/or the editor(s). MDPI and/or the editor(s) disclaim responsibility for any injury to people or property resulting from any ideas, methods, instructions or products referred to in the content.

