Article

Life Cycle Assessment and Building Information Modeling Integrated Approach: Carbon Footprint of Masonry and Timber-Frame Constructions in Single-Family Houses

1
Faculty of Engineering, Helena Chodkowska University of Technology and Economics, Jagiellońska 82f, 03-301 Warsaw, Poland
2
Independent Researcher, 02-637 Warsaw, Poland
*
Author to whom correspondence should be addressed.
Sustainability 2023, 15(21), 15486; https://doi.org/10.3390/su152115486
Submission received: 11 September 2023 / Revised: 24 October 2023 / Accepted: 24 October 2023 / Published: 31 October 2023
(This article belongs to the Section Green Building)

Abstract

:
The analysis of the carbon footprint of buildings is a key tool for assessing the impact of different buildings on climate change. Several frameworks and methodologies are available to calculate the footprint of buildings, including standards and norms, Life Cycle Assessment (LCA), and dedicated software tools. The use of Building Information Modeling (BIM) programme for these calculations is both scientifically justified and very practical. This scientific publication focuses on the application of a BIM-based research methodology to analyse the carbon footprint of a single-family house. The research process included the following steps: (i) the design of a single-family house with masonry construction using Archicad 26, BIM programme, (ii) simulation of the building energy performance using the EcoDesigner Star plug-in, (iii) LCA using the plug-in for Archicad, (iv) preparation of a second model with timber-frame construction for comparison, and (v) comparative analysis of the single-family house models with masonry construction (building A) and timber-frame (building B). Analysis of the results highlights significant differences in CO2e emissions between buildings and the varying impact of individual elements on the total CO2e emissions of the buildings studied. Building A had significantly higher net emissions, amounting to 43,226.94 kg CO2e, in stark contrast to Building B’s significantly lower 13,522.13 kg CO2e. This discrepancy was also mirrored in the emission intensity, with Building A emitting at a rate of 281.06 kg CO2e/m2 compared to Building B’s 96.72 kg CO2e/m2. These findings are relevant for future work on sustainable building design and construction aiming to minimise negative environmental impacts. The goal of minimising the cumulative carbon footprint of buildings is critical to achieve the Sustainable Development Goals and combating climate change.

1. Introduction

Today, with increasing environmental awareness and the global need to reduce greenhouse gas (GHG) emissions, sustainable buildings are becoming a priority for the construction industry [1]. For this reason, it is possible to calculate the carbon footprint of buildings, which is an important tool for assessing the impact of their design and construction on climate change [2,3].
This scientific publication is focused on the study of the carbon footprint of single-family houses. The carbon footprint includes the emissions of carbon dioxide (CO2), methane (CH4), nitrous oxide (N2O), ozone, and other GHGs emitted during the entire life cycle of a building, from its design and construction phase through operation to the end of its life. The measure of a carbon footprint is one kilogram of carbon dioxide equivalent (CO2e). Different GHGs contribute to global warming in different ways, and the carbon dioxide equivalent allows emissions of different gases to be compared on a common scale. This allows us to compare different building solutions, whole structures, and technologies to choose those with the lowest CO2e emissions. Buildings are estimated to be responsible for up to 40% of global CO2e emissions [4,5]. The aim of this research is to understand the impact of the different stages of a building’s life cycle and the impact of the building’s structural elements on its carbon footprint and to compare masonry and timber-frame construction in terms of their impact on GHG emissions. In the context of building design and construction, the study of a building’s carbon footprint becomes very important as emissions are still at high levels and the construction sector is not on a path to decarbonisation by 2050 [6]. Firstly, reducing GHG emissions is necessary to mitigate climate change and protect the natural environment [7]. As the construction sector is one of the main sources of these emissions, it is particularly important to adopt an environmentally friendly and sustainable approach to the design and construction of residential buildings [8]. Secondly, a carbon footprint study provides an opportunity to compare different design solutions in terms of their impact on GHG emissions [9]. In the case of residential buildings, the comparison between masonry and timber-frame construction is particularly important, as differences in building materials and manufacturing processes can lead to significant differences in the carbon footprint. Finally, there is an economic dimension to analysing the carbon footprint of the design and construction of residential buildings [10,11]. A growing number of investors and developers are recognising that buildings with a low carbon footprint can be a source of long-term financial savings through reduced operating costs and energy consumption [12].
The construction of a sustainable future requires meticulous attention to the materials and practises utilised in the building sector, where both masonry and wood constructions have been widely adopted but are controversial due to their respective impacts on the environment [13,14,15]. This study emerges from a need to comprehend and contrast the carbon footprints of buildings constructed from these materials, located within the context of a holistic Life Cycle Assessment (LCA) integrated with Building Information Modeling (BIM) technology. A detailed exploration of existing studies reveals a diverse landscape of research in the domain of sustainable building materials [16,17,18]. For example, Kylili and Fokaides [19] assert that sustainable development of the built environment will arise from a greater use of alternative, recycled, natural, and unconventional construction and insulation materials, the use of prefabricated building elements, and the integration of LCA with BIM. Meanwhile, numerous contemporary studies highlight the possibilities of using BIM to reduce the overall environmental impact of a building, especially emphasising its practicality in the early design phases [20,21,22]. However, there still exists a gap in merging these domains, particularly in delivering a comprehensive comparative analysis between timber and masonry constructions through a unified LCA approach integrated with BIM. Wood as a building material can play a key role in transitioning to a more sustainable and less emission-intensive economic sector [23]. Responsible forestry, grounded in principles of sustainable development that allow for the perpetual renewal of forest resources, is paramount [24]. Inappropriate timber harvesting practices harm biodiversity and contribute to deforestation [25].

1.1. Building Carbon Footprint Assessment

Several frameworks and methodologies have been developed to calculate the carbon footprint of buildings. The most popular methods include (i) standards, (ii) LCA, and (iii) a dedicated computer software tool.
Assessments are based on ISO 14040 [26] and ISO 14044 [27] standards, which are the key standards for LCA and are commonly used to measure the carbon footprint of buildings and building materials [28]. The LCA method is a comprehensive research method that considers all stages of a building’s life cycle, from raw material sourcing to production, construction, usage, and destruction [29,30]. The basic elements of LCA are (1) the identification and quantitative assessment of the environmental impacts, i.e., the materials and energy consumed and the emissions and waste released into the environment; (2) the assessment of the potential consequences of these impacts; and (3) the evaluation of the options available to reduce the impacts. The LCA method is widely used in the study of the carbon footprint of buildings due to its holistic approach and the consideration of many aspects of the building (Table 1) [31,32,33].
The range of tools available, including OpenLCA, SimaPro + Report Maker, Tally (GaBi), Umberto LCA+, and OneClickLCA Product Carbon & EPD Generator, provides users with different options to choose from based on both project requirements and user preferences. Although this variety ostensibly facilitates a thorough analysis of the carbon footprint of buildings, which is a crucial element given the current sustainability and environmental challenges, it is imperative to dive deeper into the efficacy and limitations of each tool to validate its results and applicability. A nuanced evaluation that acknowledges both the advantages and disadvantages of these tools is essential to ensure accuracy and reliability in their application. Although several market offerings allow analysis to be performed in a professional and competent manner, there is a notable limitation in their functionality for building designers. It is therefore imperative to critically analyse the need for an advanced tool that enables assessment at the design and decision stage, possibly integrating BIM, whilst ensuring the accuracy and validity of its results.

1.2. BIM in Assessing the Carbon Footprint of Buildings

In the present project, the carbon footprint and LCA of buildings in the design process could be examined using BIM technology, which is both scientifically justified [40,41] and very practical [42,43]. BIM offers a comprehensive solution by integrating building information into a central model, creating a ‘digital twin’ of the building that is under design [44,45]. In the area of carbon footprint assessment, BIM programme facilitates the handling of data on building materials used in project designs. These data play a crucial role in the accurate calculation of carbon emissions. It takes into account the manufacture, transport, and installation of building materials [46,47]. By using BIM programme to design building elements with appropriate materials, it is possible to precisely monitor the influence of individual building design components on the entire carbon footprint of the building.
As a result of increased attention in the field, there are now an increased number of tools available on the market for computing a structure’s carbon footprint. The most accurate and efficient tools are those that are developed based on a high-precision 3D model of the structure, established using BIM technology [48,49]. Integration of these tools enables users to import data from the BIM model, including building geometry, material information, and energy consumption. This feature allows for a comprehensive carbon footprint analysis [50,51,52]. Using BIM programme, it becomes possible to consider all pertinent factors that impact GHG emissions throughout the life of a building. In addition, BIM programme also offers energy simulation tools to account for energy consumption in the building [53,54]. Simulations provide data on the GHG emissions related to heating, lighting, cooling, and ventilation, facilitating the evaluation of a building’s carbon footprint with respect to its operation. An essential benefit of BIM programme is its ability to enable teamwork with different design and construction crews on a project. In this way, objective information on materials, energy consumption, and GHG emissions can be collected and updated in real time. Through ongoing data analysis, it is possible to identify the areas that have the greatest impact on carbon footprint, allowing a strategic reduction plan to be developed [55,56].
The use of BIM programme to calculate the carbon footprint of buildings is not only scientifically reliable but also pragmatic. It offers sophisticated tools for data collection, analysis, and visualisation, facilitating a deeper understanding of the impact of individual elements on carbon footprint. This enables informed design and construction decisions to minimise GHG emissions (Table 2).

2. Materials and Methods

This article analyses the carbon footprint of a single-family house using a BIM-based research methodology. The analysis was carried out in the following stages:
  • Stage I. Designing a model for analysis, which is a single-family detached house in masonry construction, using BIM technology (in Archicad 26 software).
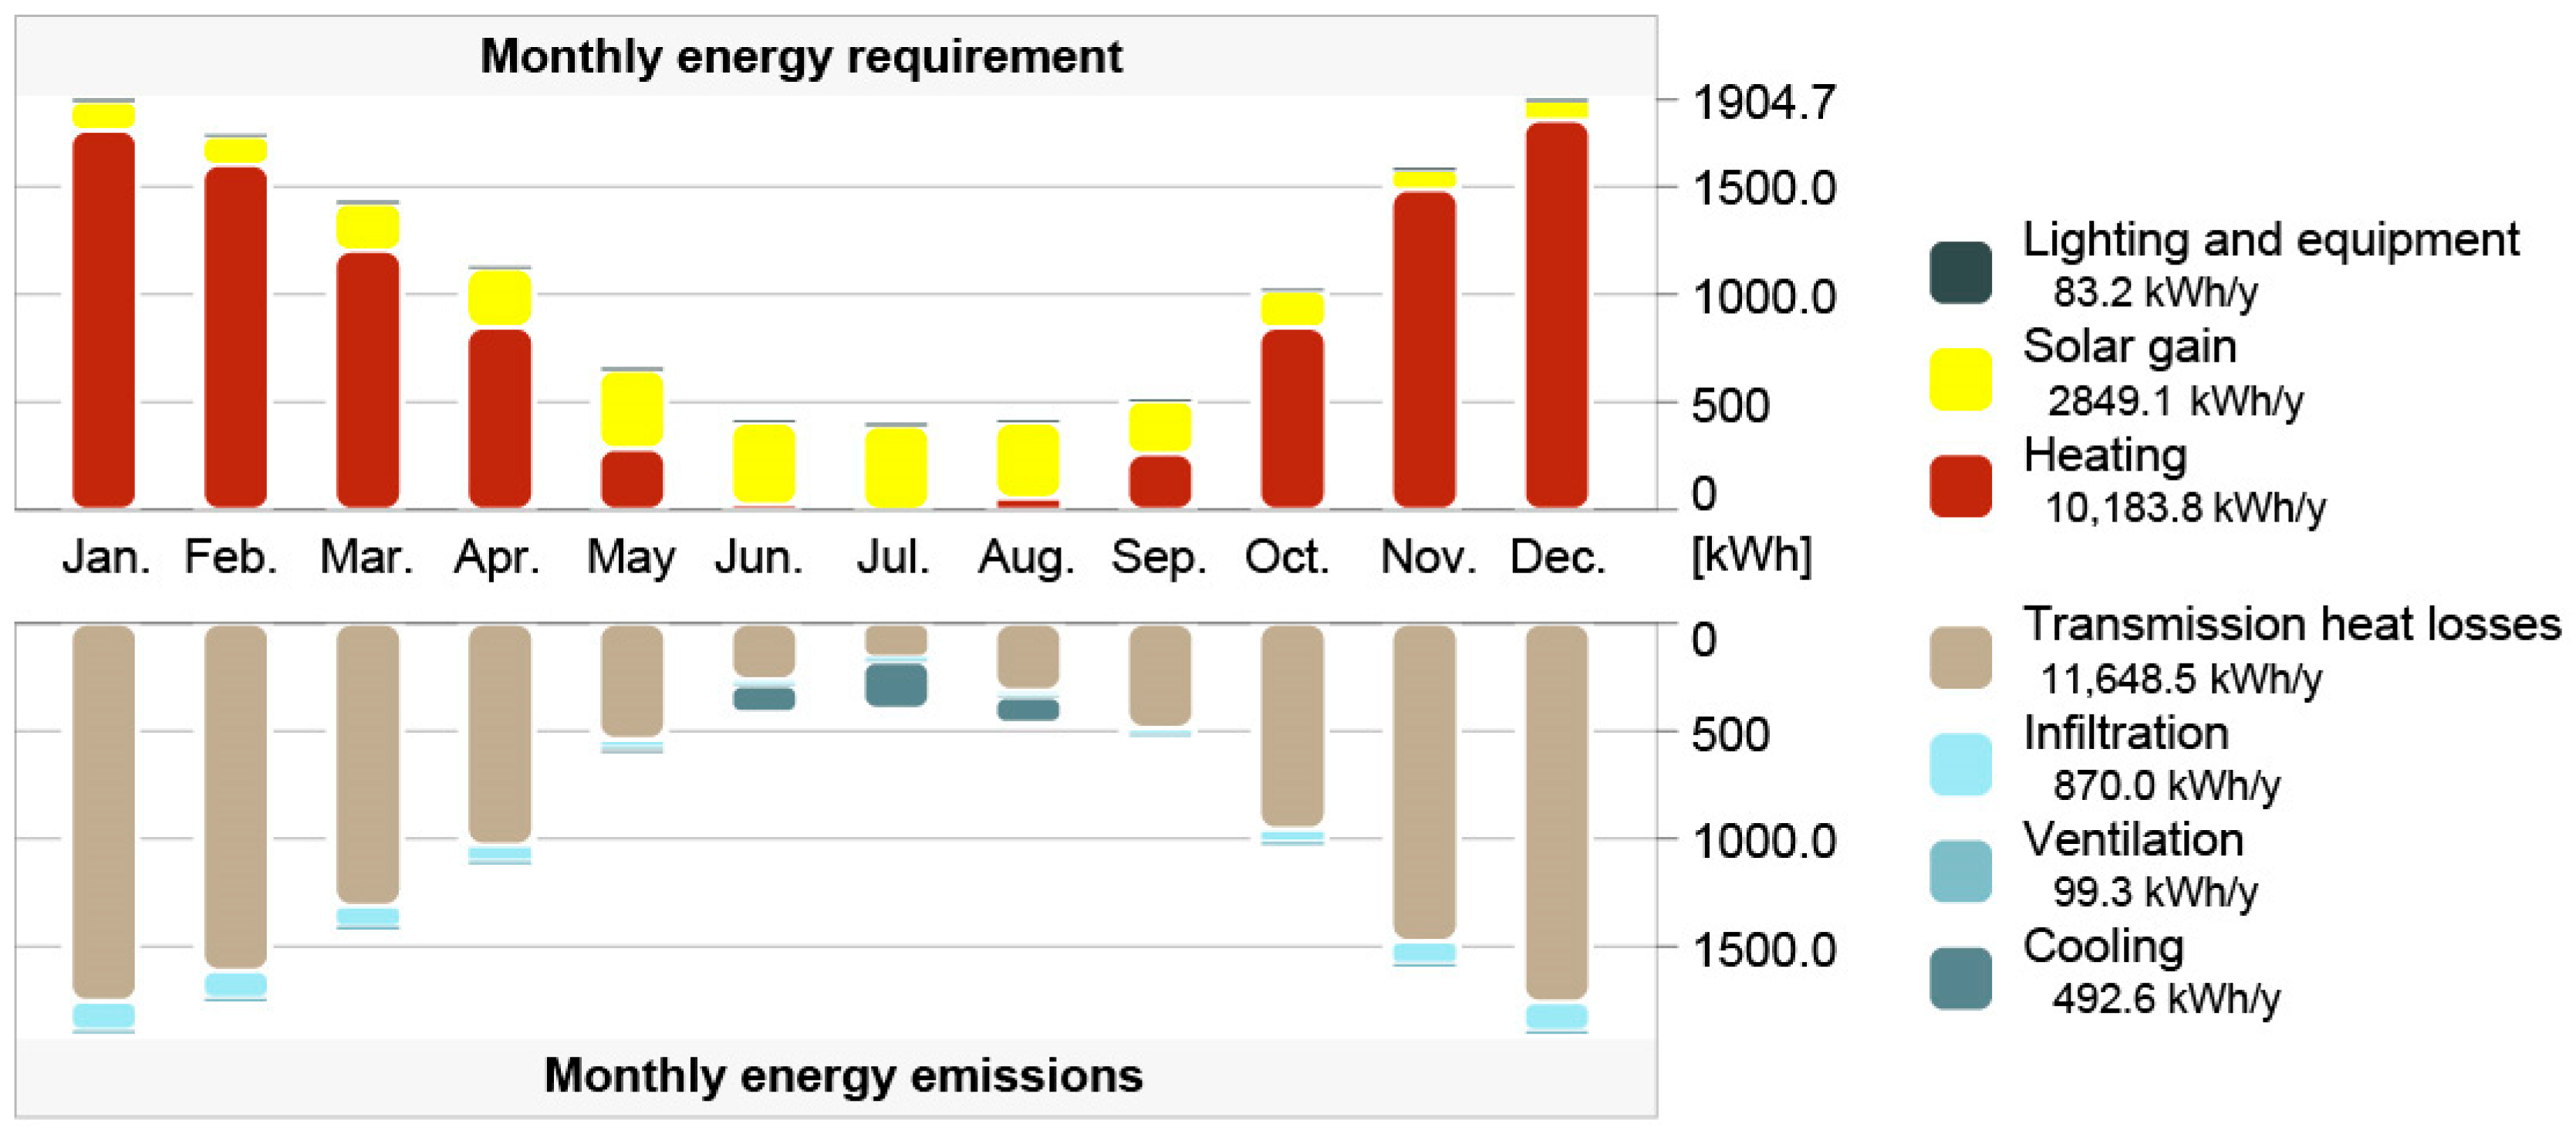
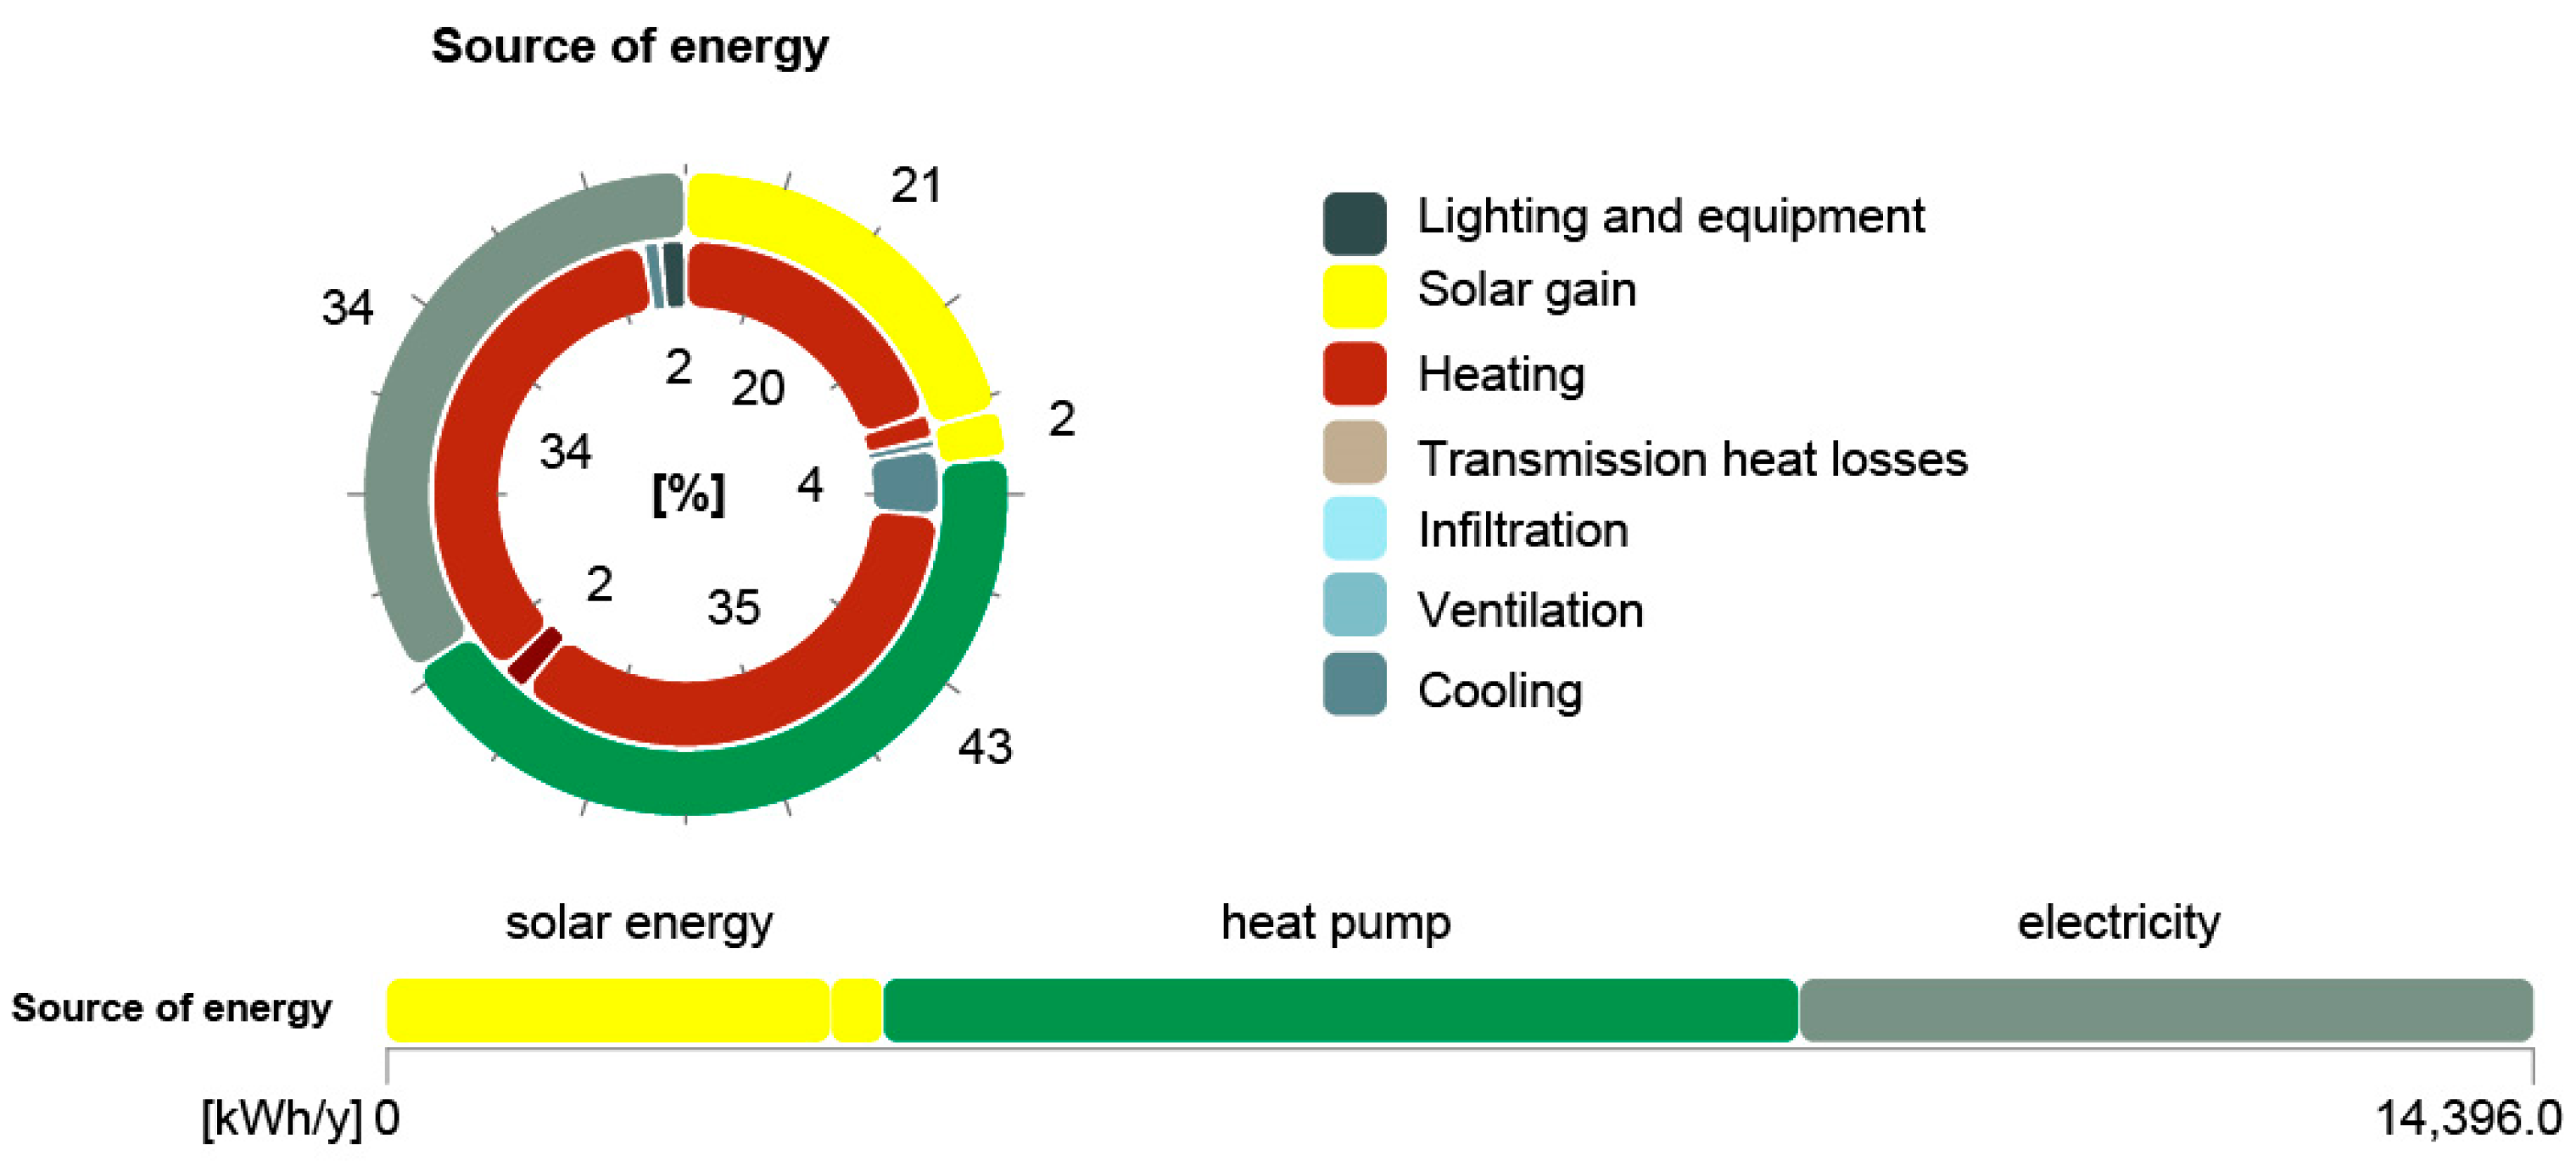
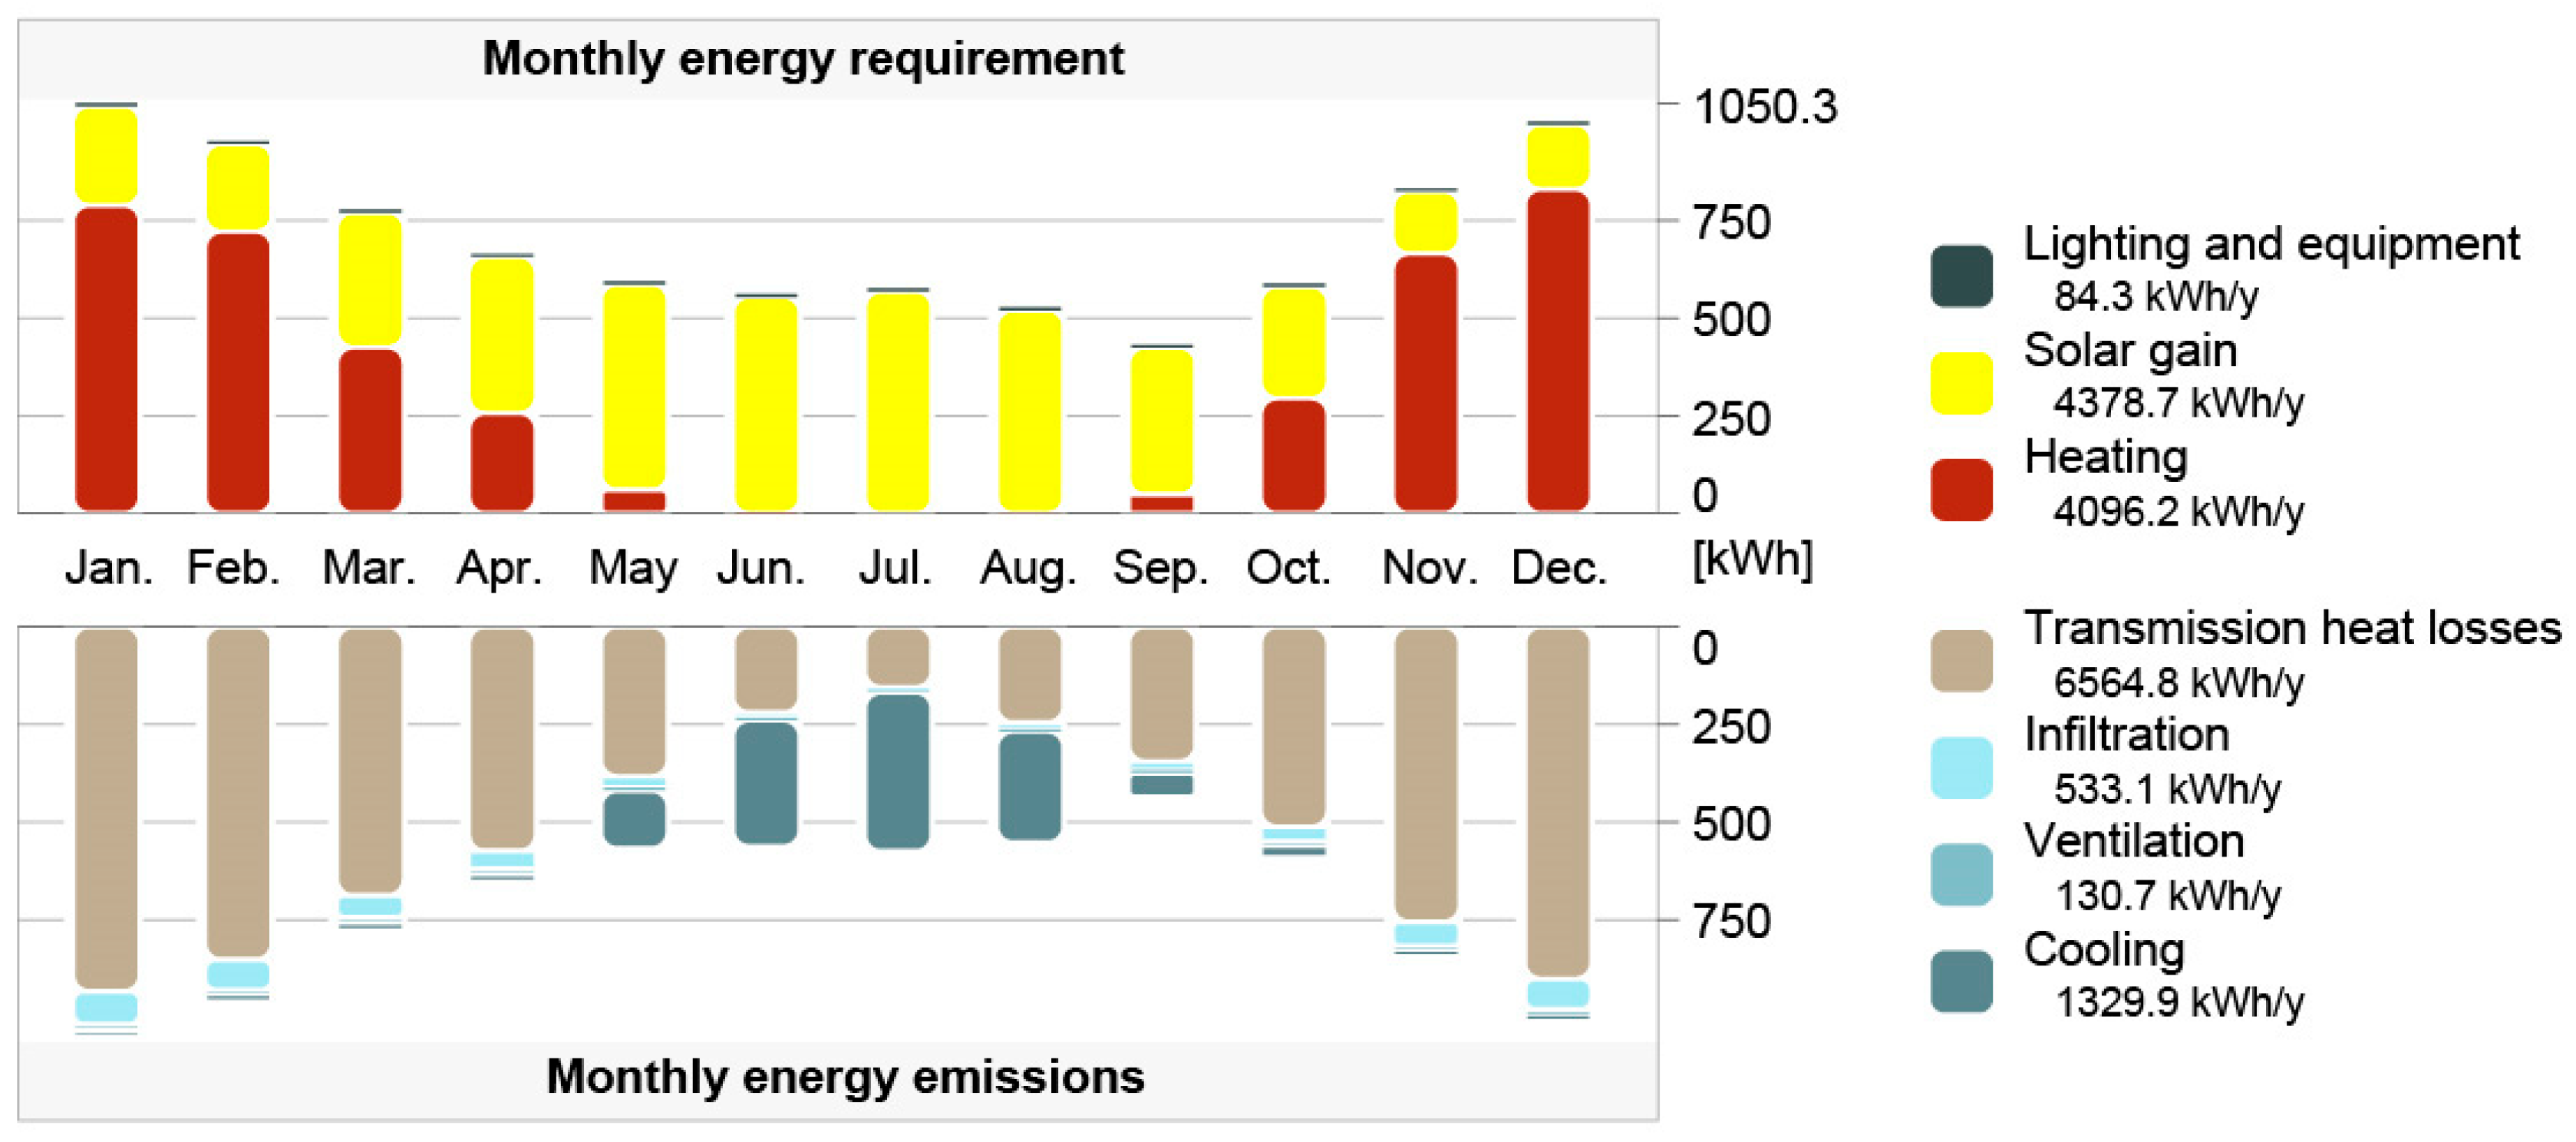
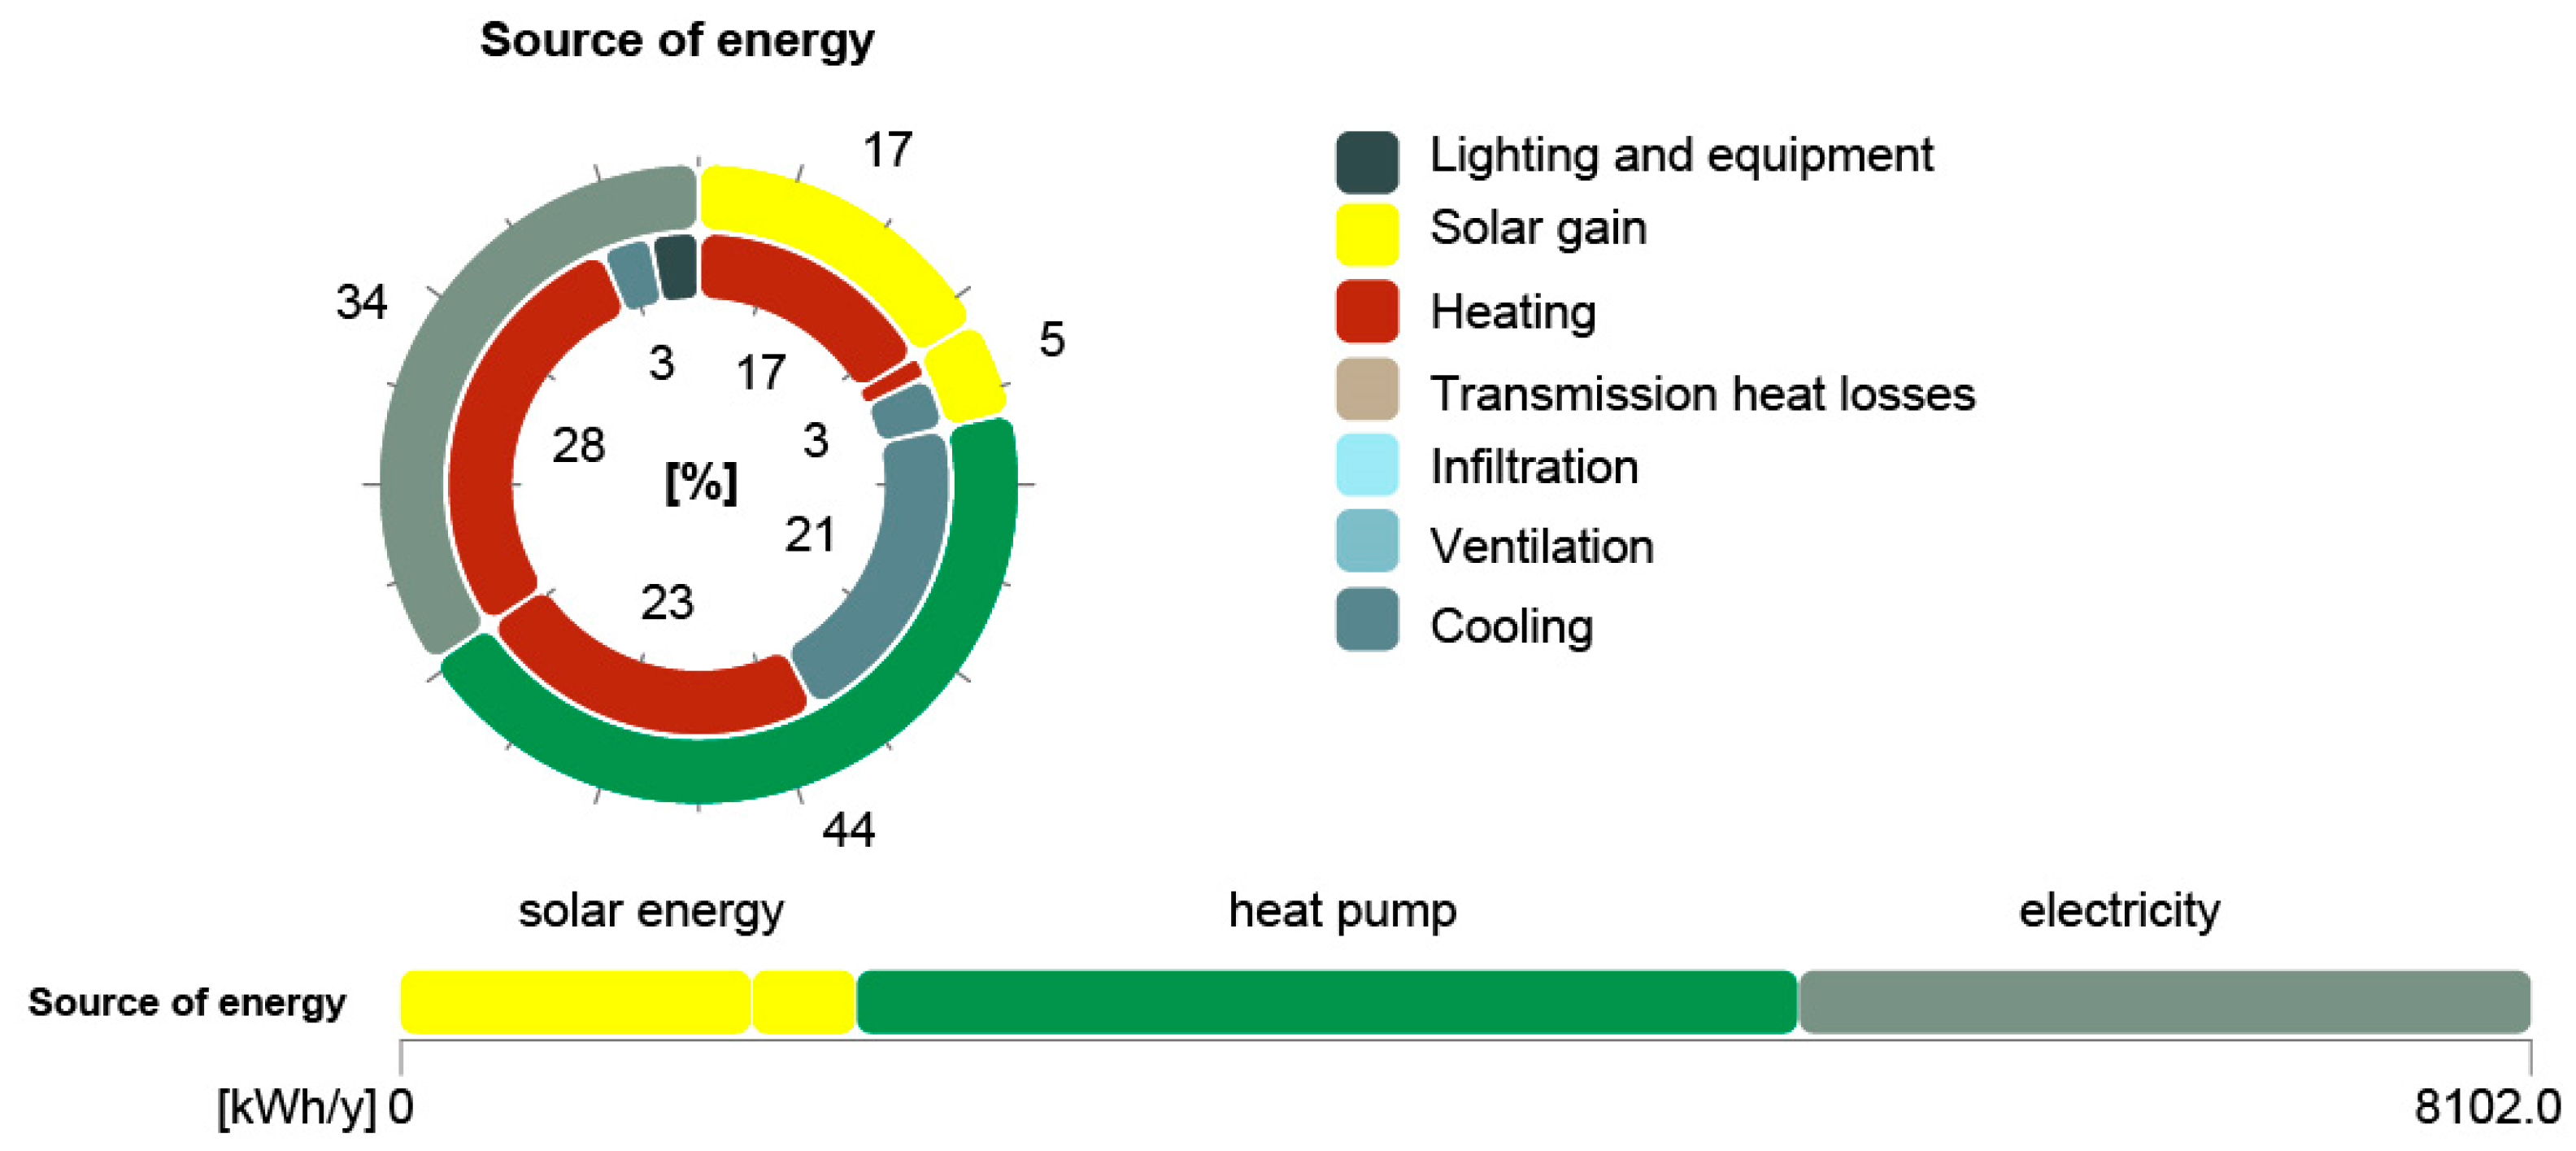
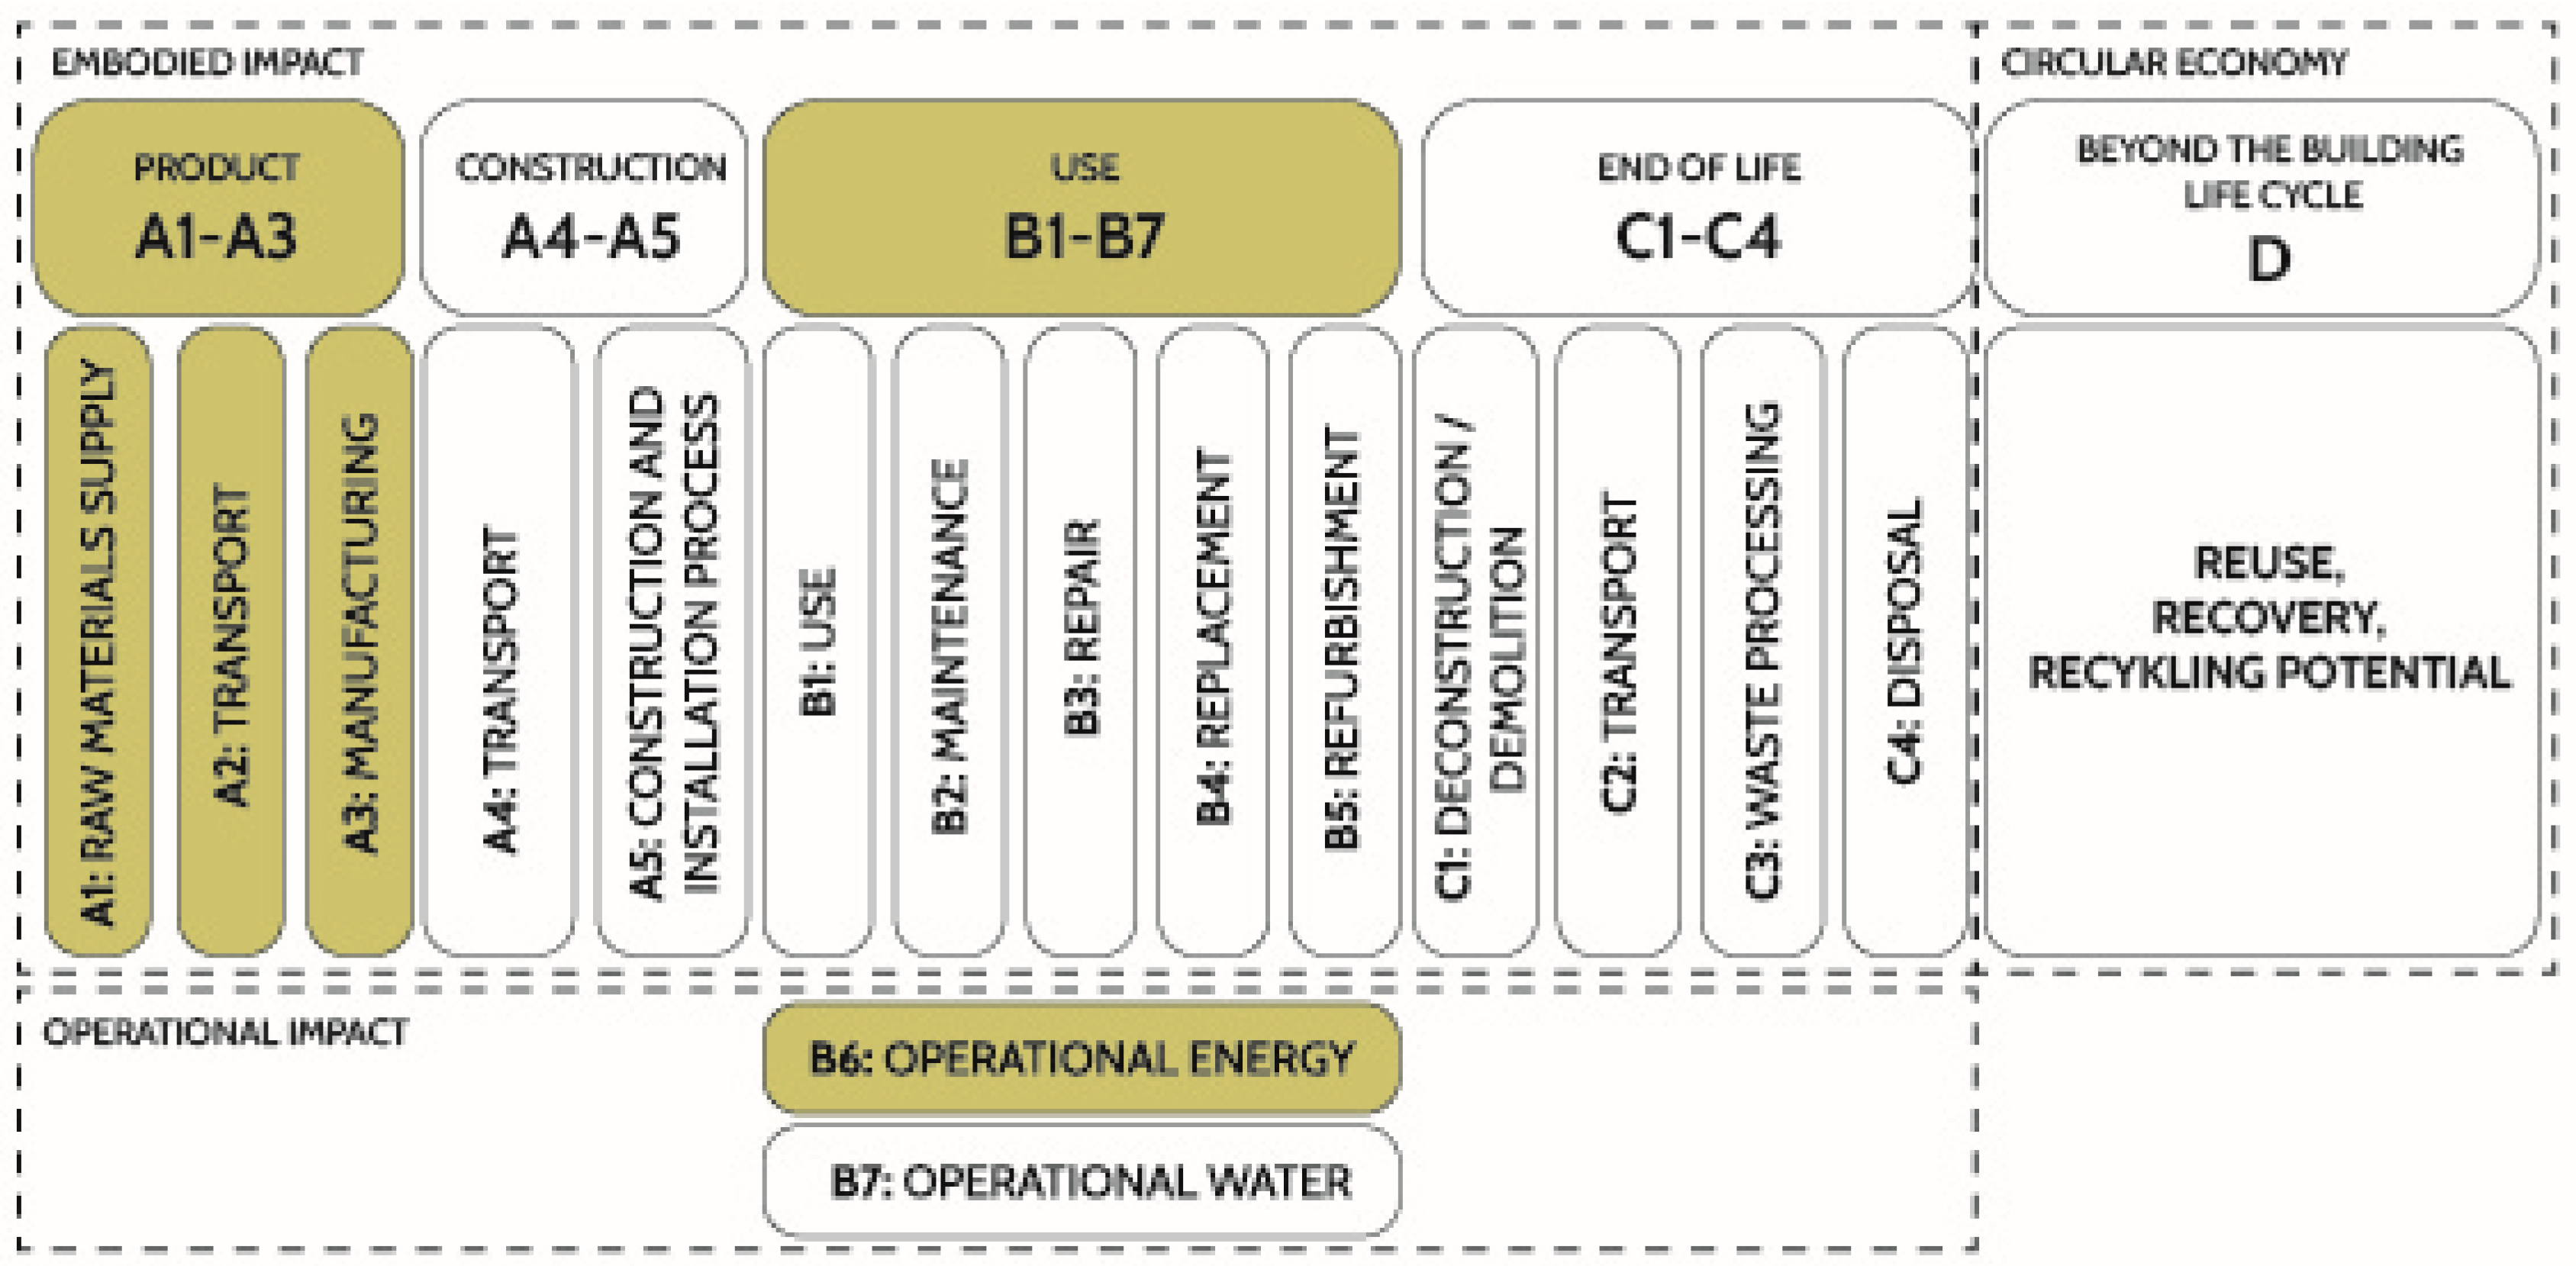
  • Stage II. An energy performance simulation of the building was conducted in Archicad, using the EcoDesigner Star add-on. Through examination of the building’s geometry, materials, heating, lighting, and cooling systems, an energy simulation was performed to estimate the energy consumption over the life of the building. LCA analysis was based on a study period of 50 years, as recommended by EN1990 [57]. This period is important in determining the energy efficiency of a building for the B6 operational energy use point of the LCA analysis. Although buildings typically operate for much longer than 50 years, this period allows a comparison to be made between two buildings. This was confirmed by a study of an office building, where it was found that over a 50-year period, 80% of the life cycle energy was consumed in the case of the building analysed in Vancouver, while 90% was consumed for the same design but in Toronto [58].
  • Stage III. An LCA was conducted using the Archicad add-on DesignLCA [59]. A simplified approach was employed, which considered modules A1–A3, which are responsible for embedded emissions during the product phase, as well as module B6 during operational energy use [60] (Figure 1).
In this step, a detailed material analysis was performed on the building materials used in construction. ÖKOBAUDAT [61], a publicly available database in accordance with EN 15804+A2, was referenced for this purpose [62]. The ÖKOBAUDAT platform, facilitated by the Federal Ministry for Housing, Urban Development and Building, serves as a standardised database designed to streamline ecological evaluations of buildings. This comprehensive platform is intrinsic to the promotion of sustainable building practises as it offers valuable data related to the environmental impacts of various building materials and components. It provides access to a wealth of data, including LCA results and other pertinent environmental information. The following stages were considered:
  • Stage IV. The second model constructed using a timber-frame structure was analysed. The previous stages (I–III) were repeated for this secondary model.
  • Phase V. A comparative analysis of single-family building models in masonry and timber-frame construction was carried out.

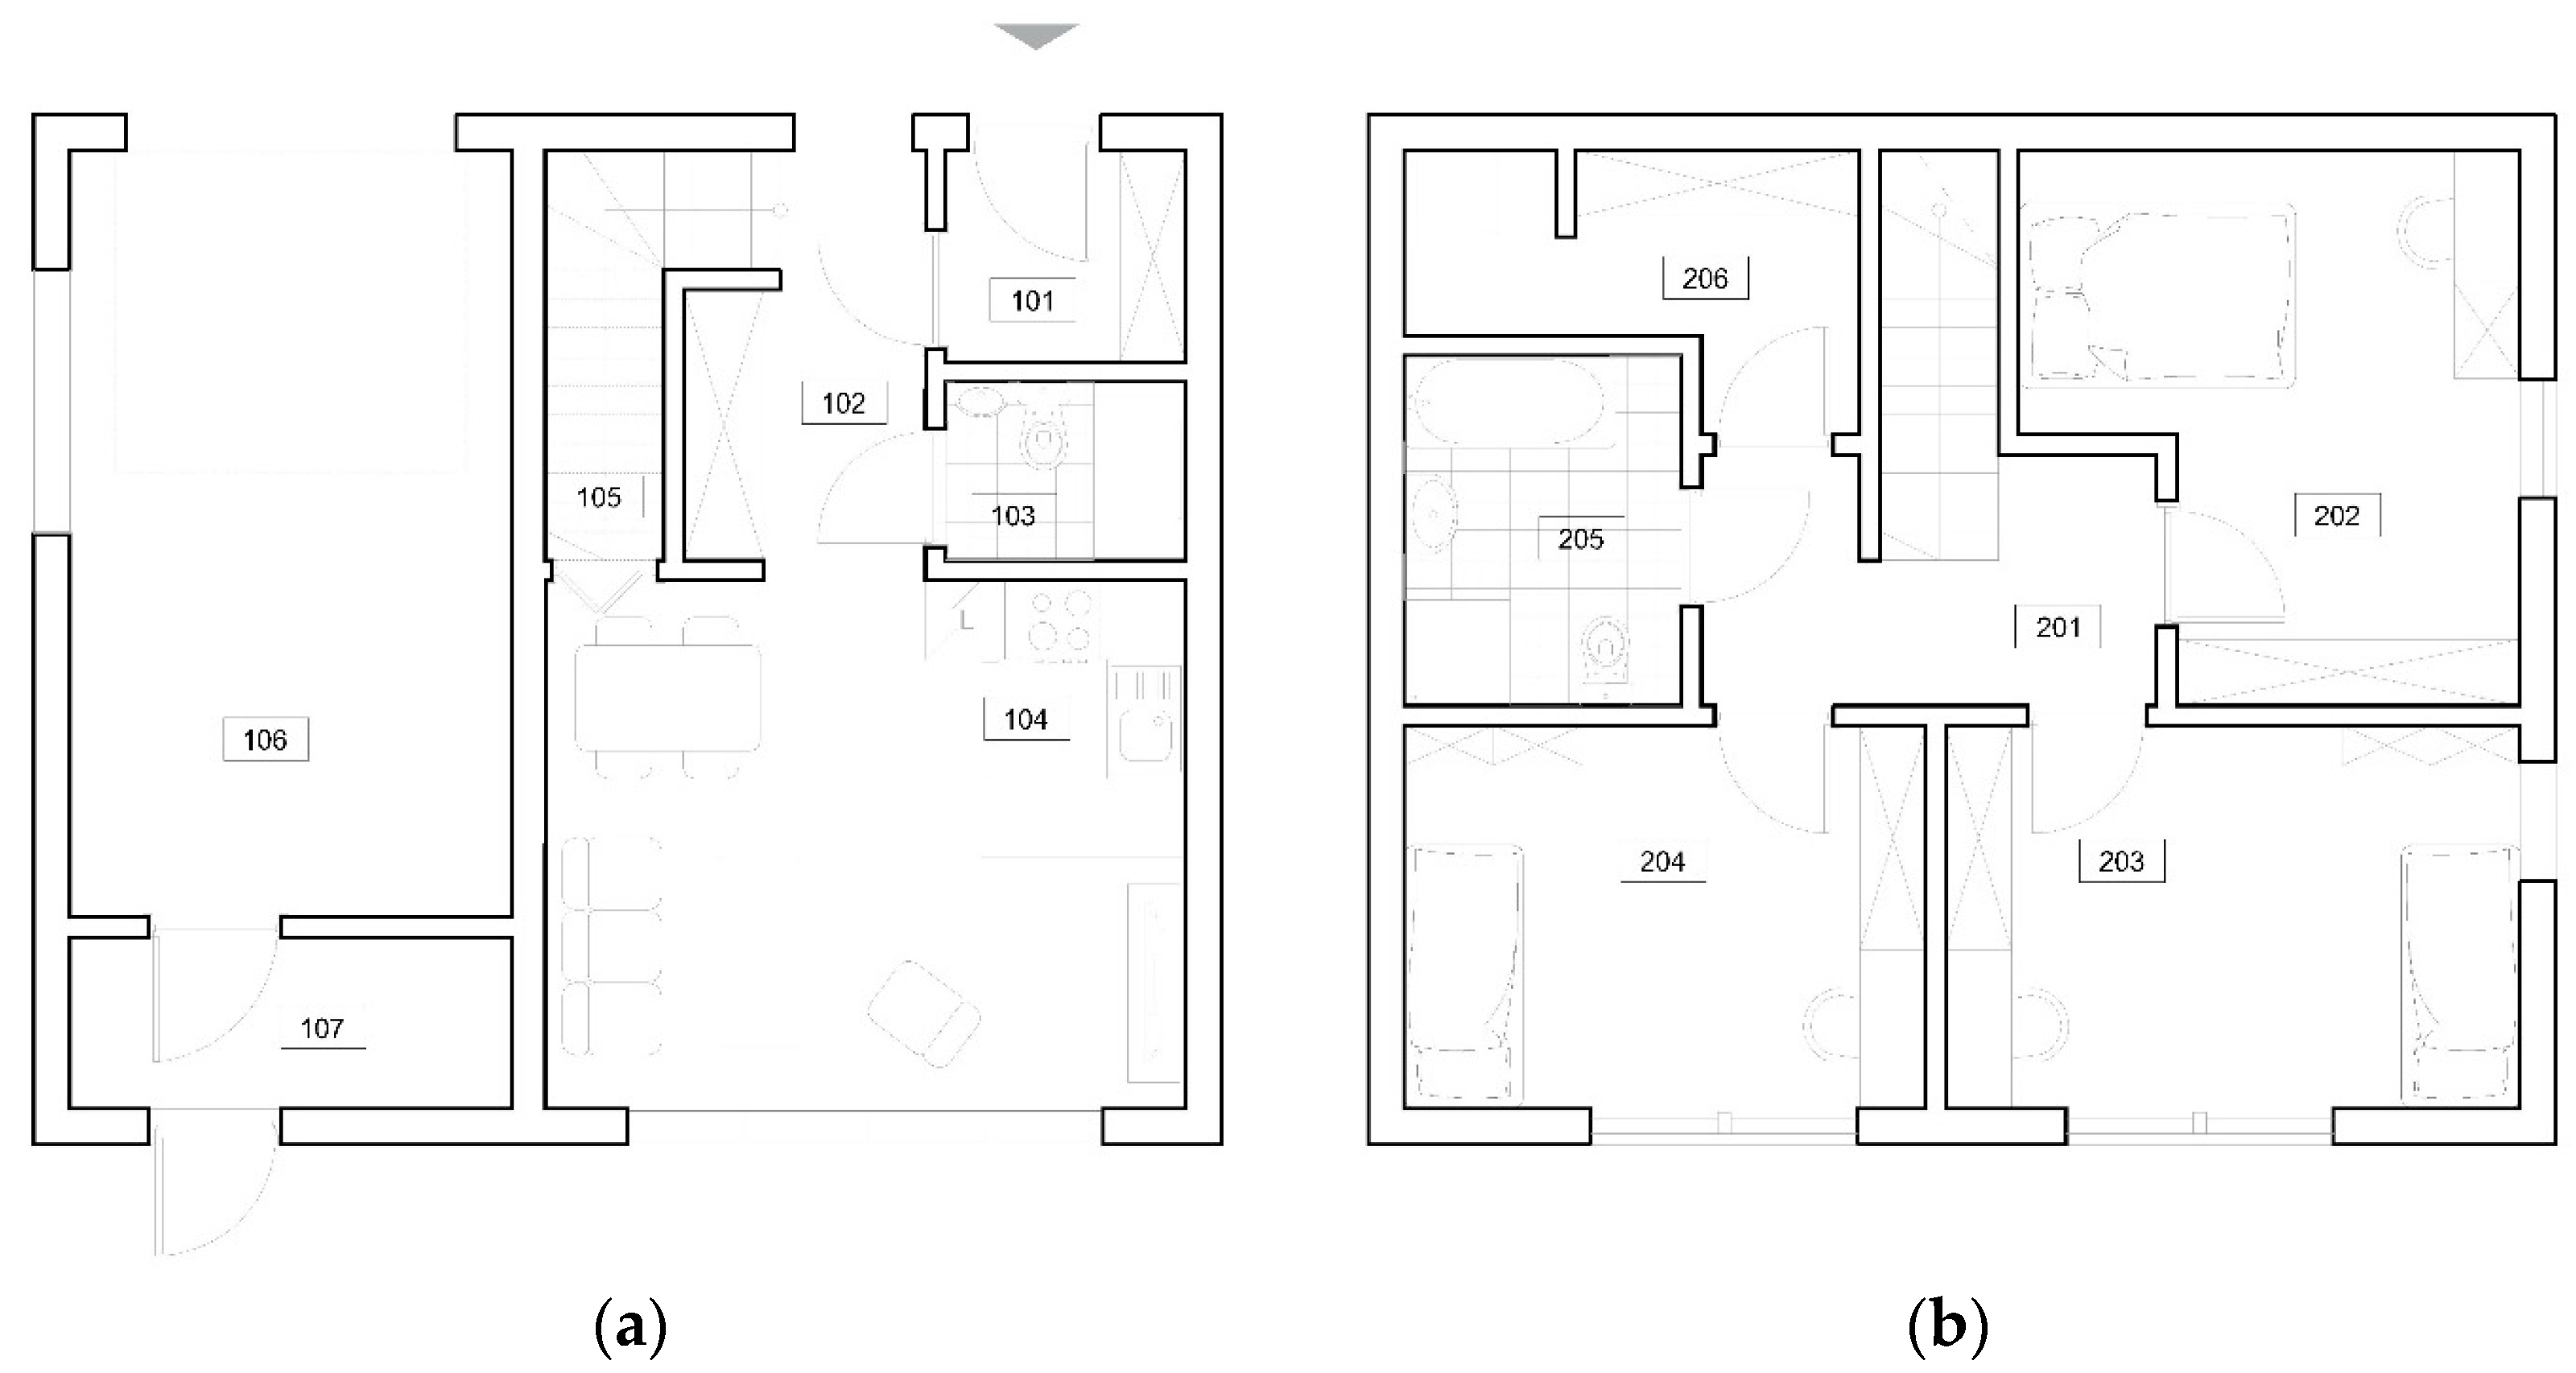
2.1. Design of a Single-Family House Model

The designed building is a single-family detached house without a basement. The functional programme of the ground floor includes a garage, a living room with a kitchenette, a bathroom, a vestibule, and a storage room, while the first floor includes three bedrooms with a bathroom and a laundry room. In addition, a non-utility attic and a part of the garage are considered as space for sanitary installations (Figure 2). The property provides long-term housing for at least four occupants. The rectangular structure features a symmetrical gable roof with a pitch of 40 degrees. The design evokes the archetype of a ‘modern house’ with a gabled roof and a stylish façade in understated hues (Figure 3).
The subsequent phase of the study involved the use of BIM technology in Archicad to determine the energy efficiency of the structure. This application enables meticulous simulation of the energy evaluation of the intended building via the built-in EcoDesigner Star add-on. The energy assessment was carried out in Warsaw (Poland) at a facility located at 16 Leżakowa Street (52°09′32.0″ N 21°05′32.0″ E). Weather data from the Warsaw Okecie measuring station (52°09′46.0″ N 20°57′40.0″ E), located less than 10 km from the site, were used. The building envelope is described in Appendix A.
The installation systems for the analysed building projects were equipped with modern solutions that increase their energy efficiency and reduce the negative impact on the environment. The ventilation with heat recovery is based on the mechanical exchange of air using a temperature controller inside, ensuring a constant flow of air. This contributes to maintaining an optimal temperature in the rooms. For cooling, a wall-mounted air conditioner with a capacity of 3000 W was used, which activates automatically when the temperature exceeds the free cooling threshold set at 15 °C. Heating is provided by an air pump on solar panels, which includes a water heat pump that communicates with a thermal solar collector. A flat collector with an area of 10 m2, inclined at an angle of 45°, was installed. The heat pump settings include heating and hot water, with the source of heat being the outside air and the input heat being 5000 W. The energy efficiency indicator of the system is 4.6, and the temperature of the heated water is 60 °C. Additionally, a local room heater was installed, also based on a water heat pump and a thermal solar collector. The solar collector is a flat collector type with an area of 3 m2, inclined at an angle of 45°, which communicates with the heat pump. The heat pump settings are identical to those of the previous system.

2.1.1. Building A—Masonry Building

The carbon footprint of masonry construction in the context of detached houses is a complex issue due to the diverse range of building materials and processes used. Specific factors contribute to a larger carbon footprint for masonry construction. In the energy simulation of the building A model, the primary energy sources for domestic water heating and home heating were an air-source heat pump and monocrystalline photovoltaic panels. Additional sources of energy for heating and cooling were met through electricity.
The following details an analysis of the monthly energy requirement. During the winter months, January (1903.68 kWh), February (1741.15 kWh), November (1584.92 kWh), and December (1904.70 kWh), there is a noticeable increase in energy demand (54.39% of annual demand). In contrast, during the summer period, which includes the months of June (413.62 kWh), July (399.17 kWh), and August (414.03 kWh), this demand significantly decreases (9.35% of annual demand). The spring and autumn months are characterised by moderate energy consumption, accounting for 36.25% of annual energy demand. Energy demand in the winter months is largely related to the need for heating, which also includes water heating, accounting for 93.38% of energy demand in the winter months. However, during the spring and summer periods, solar energy gains have a significant impact on the energy balance. Lighting and electronic equipment (excluding cooling and ventilation devices) generate a fairly constant, low energy demand regardless of the season (0.63% of annual demand) (Figure 4).
The chart represents energy consumption according to the source: solar energy (3329.00 kWh/y), heat pump (6140.00 kWh/y), and electrical energy (4926.00 kWh/y). Each of these sources is further divided into components of energy consumption such as lighting and equipment, solar gains, heating (including hot water), transmission heat losses, ventilation, and cooling. Of the three main sources of energy, the heat pump is most intensively used, especially for heating and permeation needs. Although solar energy is a renewable source, it is primarily used for heating, suggesting that it is more of a seasonal energy source. It is worth noting that, while cooling is an important component of thermal comfort, it consumes relatively little energy compared to the other categories (Figure 5).
Most importantly, the production of building materials used in masonry, such as cement, concrete, and bricks, is an energy-intensive process that results in significant carbon dioxide emissions. Manufacturing cement releases large amounts of GHGs, so the building materials themselves can contribute to a considerable proportion of total CO2e emissions while building a home. Using heavier materials when building masonry structures can increase the amount of fuel needed to transport the natural raw material to production factories, leading to higher GHG emissions. The carbon footprint of masonry structures is also influenced by the thermal insulation used [63]. Masonry structures often need extra insulation for proper thermal performance. This may lead to the use of more insulation material, which comes with environmental costs related to manufacturing and disposal. However, it is important to mention that the advancement of novel building methods and techniques, such as using lower-emission materials during the manufacturing process, adopting renewable energy in construction procedures, and improving energy efficiency in masonry residences, may aid in decreasing the carbon footprint of single-family masonry homes. To obtain an exact calculation of the masonry constructions, performing a full life cycle evaluation of the building is suggested. This includes the production of building materials, the construction process, use, and dismantling. Such a study would help identify the key factors that contribute to the carbon footprint of the masonry construction of individual houses. This would allow for the use of effective tactics to reduce GHG emissions.

2.1.2. Building B—Timber Building

The significance of timber buildings is pronounced in carbon footprint calculations. Wood is a natural material that has low GHG emissions compared to conventional building materials, such as concrete or steel. This is mainly because wood can store carbon dioxide during its growth period and the production of wood requires less energy compared to that of other materials. In the energy simulation of the building B model, we used an air-source heat pump and monocrystalline photovoltaic panels for water heating, home heating, and cooling. The additional energy source for heating and cooling is electricity.
We also carried out an analysis of monthly energy requirements. Similarly to the analysed building A, in building B, the winter months, January (1087.32 kWh), February (988.56 kWh), November (863.64 kWh), and December (1041.62 kWh), show a noticeable increase in energy demand (45.45% of annual demand). In contrast, during the summer period, which includes the months of June (561.74 kWh), July (575.94 kWh), and August (527.74 kWh), this demand significantly decreases (19.01% of annual demand). The energy demand during the summer period in building B is greater compared to that in building A, resulting from the increase in energy needed for cooling the house during the summer period (June–July, totalling 1011.04 kWh). The spring and autumn months are characterised by moderate energy consumption, accounting for 35.54% of the annual energy demand. Energy demand in the winter months is largely related to the need for heating, which also includes water heating, accounting for 79.12% of energy demand in the winter months. However, during the spring and summer periods, solar energy gains have a significant impact on the energy balance. Lighting and electronic equipment (excluding cooling and ventilation devices) generate a fairly constant, low energy demand regardless of the season (0.96% of annual demand) (Figure 6).
The chart represents energy consumption according to the source: solar energy (1734.00 kWh/y), heat pump (3580.00 kWh/y), and electrical energy (2788.00 kWh/y). Each of these sources is further divided into components of energy consumption, such as lighting and equipment, solar gains, heating (including hot water), transmission heat losses, ventilation, and cooling. Of the three main sources of energy, the heat pump is most intensively used (44%), especially for heating and cooling needs. When comparing cooling and ventilation in building A to building B, there is greater energy consumption in building B, which results from the adopted structural layout of the wooden building; this is necessary to maintain the proper thermal comfort for residents (Figure 7).
The environmental impact of timber buildings must include every stage of their life cycle, starting with timber production and including the GHGs emitted from the harvesting of trees and the transport of the timber. As a building material, wood has the ability to store carbon dioxide, making its emissions lower throughout the life cycle of the building. During timber construction, energy usage may be reduced compared to in the construction of other buildings using different materials. This is due to the insulation materials and design, which limit thermal bridges in the building [64]. This allows for maintaining the thermal comfort of the building residents and reducing the energy consumed by heating and cooling systems. This reduces the GHG emissions from a timber building. However, it is important to consider other factors when analysing the carbon footprint of timber buildings, such as the production and transport of materials used in the timber structure, including glues and finishes. Furthermore, the assessment of GHG emissions in relation to a timber building’s life cycle should encompass the demolition and disposal stages for a precise analysis.

3. Results

A detached house energy study was carried out in masonry and timber construction to find the level of CO2e emissions needed to identify point B6, which is the energy use in the upcoming LCA analysis. To ensure meaningful findings, buildings A and B are identical models in this study (Table 3).

LCA Analysis

The LCA analysis was carried out according to EN 15978 [65]. The authors used a simplified methodology for the product phase: A1 (extraction of raw materials), A2 (transport to the production site), A3 (production of the product), and B6, the use phase (energy consumption). The analysis was carried out using the Archicad add-in DesignLCA. As part of our research, we analysed the emissions generated by the building materials used in both building A (traditional masonry construction) and building B (timber-frame construction). Emissions associated with building materials contribute significantly to total CO2e emissions from buildings. Table 4 provides a summary of the building materials used in building A and building B. Information on the emissivity of the materials was obtained from the public database ÖKOBAUDAT [61], which complies with EN 15804+A2 [62].
In building B, emissions related to building materials are mainly concentrated in the production of wood and insulation materials. As a natural building material, wood has relatively low CO2e emissions compared to other materials such as steel or concrete. In addition, the use of low-emission insulation materials helps reduce the energy used to heat and cool the building, which has a positive impact on total CO2e emissions. In the case of building A, emissions related to building materials are mainly due to the production of cement, which is the main component of concrete. Cement production is an energy-intensive process and is associated with high CO2e emissions. Furthermore, emissions from steel production, which is required for the structure and load-bearing elements of the building, also contribute to the total CO2e emissions of building A.
Based on the data in Table 4, it was possible to perform an analysis of the impact of each building element on total CO2e emissions. As part of this study, we have broken down the impact of each element on total CO2e expenditure, taking into account both the production phase (A1–A3) and the use phase (B6) of the building. The results of our study for each building element are presented in Table 5.
The table shows that buildings A and B differ significantly in terms of carbon dioxide emissions associated with the different construction elements. In building A, which is a masonry building, the largest contributors to the total CO2e emissions are the external walls (9829.70 kg CO2e), the windows (5971.84 kg CO2e), and the ceiling between floors (4076.31 kg CO2e). On the other hand, in building B, which is a timber building, the main contributors to the total CO2e emissions are the windows (5971.84 kg CO2e), roof (1376.55 kg CO2e), and foundations (1030.86 kg CO2e).
The external walls are responsible for maintaining the thermal insulation of the building, ensuring its structural stability, and protecting it from the weather. In the case of building A (masonry), the CO2e emissions associated with this element amount to 9829.70 kg CO2e, which represents 38.56% of the total CO2e emissions of the building. Therefore, the external walls are one of the main elements responsible for the negative environmental impact of masonry buildings. To minimise the impact of CO2e emissions associated with external walls, it is possible to use alternative building materials with a lower environmental impact, such as materials with low CO2e emissions during production. Furthermore, improved thermal insulation can reduce the amount of energy used to heat and cool the building, which will have an impact on the long-term reduction in CO2e emissions.
The roof plays a key role in protecting the building from precipitation, wind, and other external factors. In the case of building A (masonry), the CO2e emissions associated with the roof amount to 1305.31 kg CO2e, representing 5.12% of the total CO2e emissions of the building. Compared to building A, the roof of building B generates slightly higher CO2e emissions (71.24 kg CO2e more), which is related to the more intensive use of thermal insulation to cover the roof. However, it should be noted that possible optimisation of the building envelope makes it possible to minimise heat loss through adequate insulation and reduce the amount of energy required to heat the building. Such solutions result in lower CO2e emissions at stage B6 of operational energy use.
It should be noted that the CO2e emissions associated with building A are significantly higher than those of building B. This means that masonry buildings have a greater environmental impact than timber buildings, at least as far as the analysed aspect of CO2e emissions is concerned. However, it should be stressed that the impact of individual elements on the total CO2e emissions of buildings is related to the use of wood, which absorbs CO2. For example, in building B, elements such as the inter-storey floor (−5191.64 CO2e), internal walls (−754.03 kg CO2e), and stairs (−573.88 kg CO2e) generate negative emissions and absorb more CO2 than they emit.
In summary, the analysis of the table showed significant differences in CO2e emissions between masonry and timber buildings and the differential impact of individual elements on the total CO2e emissions of the buildings studied. These conclusions are relevant for further work on the sustainable design and construction of buildings that minimise negative environmental impacts.
The cumulative energy comparison (expressed in megajoules—MJ) is an important indicator in assessing the sustainability of buildings. It allows us to compare the total energy consumption associated with different building materials and construction methods. By comparing the cumulative energy consumption of two buildings, we can obtain information on the energy efficiency of different construction approaches (Table 6). During the production phase (A1–A3), the masonry building consumes more cumulative energy, consuming 8,839,875.65 MJ, compared to the timber building, which consumes 7,936,714.68 MJ. This highlights the importance of choosing construction materials and methods that minimise energy consumption throughout the building’s life cycle. Choosing energy-efficient materials, exploring renewable energy sources, and implementing energy-saving strategies can significantly reduce the cumulative energy consumption of buildings and promote building sustainability.
A comparison of the cumulative carbon footprint (expressed in kilogrammes of CO2e) is an important indicator for evaluating the sustainability of buildings (Table 6). It allows us to compare the total GHG emissions associated with different building materials and construction methods. By comparing the cumulative carbon footprint of two buildings, we can obtain information on the efficiency of reducing the carbon footprint of different building materials and construction methods. At the production stage (A1–A3), the masonry building generates a significantly higher carbon footprint (25,492.59 kg CO2e), while the timber building has a negative balance (2455.75 kg CO2e), which may indicate carbon sequestration. Taking into account energy consumption over the entire 50-year life cycle (B6), the timber building also has lower CO2e emissions (11,066.38 kg CO2e) compared to the masonry building (17,734.35 kg CO2e). In total, the total carbon footprint of the masonry building is 43,226.94 kg CO2e, while the timber building generates significantly less at only 13,522.13 kg CO2e. This highlights the importance of choosing low-carbon materials, exploring alternatives such as recycled materials, and implementing strategies to reduce the carbon footprint throughout the life cycle of a building.
Comparing total water use is an important aspect in assessing the sustainability of buildings. Water is a natural resource with limited availability, so it is important to understand how much water is used by different buildings and construction methods [66,67]. Comparing the total combined water use of two buildings can provide information on the efficiency of the water use of different building materials and methods (Table 7). In the production stage (A1–A3), the masonry building again has a higher water consumption (2406.34 m3), compared to the wooden building, which uses 2121.80 m3 of water. There is a need to develop technologies and strategies to minimise water consumption in both the production and use phases of buildings. Optimising production processes, using low-impact materials, and implementing water-saving solutions in buildings are key to achieving sustainable water use and conserving natural resources.
CO2e is an important indicator for evaluating the sustainability of buildings. It refers to the amount of carbon dioxide emitted per unit of area or unit of use of a building. Comparing the CO2e emission intensity of building A and building B allows for evaluating the energy efficiency and environmental performance of different building materials and construction methods. It also highlights the need for further research and innovation to develop low-carbon building solutions that have less impact on climate change. There is a significant difference in CO2e emissions between the buildings analysed. Taking into account the overall CO2e emissions, building B shows a clear environmental advantage over the masonry building (A), which emits up to 29,704.81 kg CO2e less. This significant difference highlights the potential of timber construction to significantly reduce emissions during the building’s life cycle. This translates into emission intensity per square metre (kg CO2e/m2). A timber building has three times lower emission intensity per m2 (96.72 kg CO2e/m2). Reducing the intensity of CO2e emissions is the key to achieving sustainability and environmental protection [68].

4. Discussion

To reduce the negative environmental impact of the construction sector on the development of single-family homes, the discussion should begin with the designed size of homes and appropriate planning for the needs of future residents [69]. Research by Magwood and Huynh [70] shows that sensible choices in the design stage deliver the highest CO2 reductions. Every construction project has a negative environmental impact, but by designing and implementing projects in a sensible and limited way, it is possible to easily reduce the negative impact. Detailed analyses of house designs by Arceo et al. [71] indicate that the elimination of masonry basements in single-family houses alone can lead to an average reduction of 56% in the total consumption of building materials (in terms of weight), which significantly reduces GHG emitted into the atmosphere.
When building a single-family home, it is important to consider the needs of future occupants when analysing the space. The right design of the living space is important not only in terms of comfort and functionality but also in terms of energy efficiency [72,73] and sustainable development. Regarding the project analysed (described in the publication), there is approximately 28 m2 of living space per person for a family of four (two adults and two children). This size aligns with the recommendations presented in the literature on residential design and a study by Bierwirth [74], who suggested 35 m2 per person should be the goal in EU countries. Research has shown that this size is sufficient to provide a satisfactory level of comfort while minimising the environmental impact of the building by reducing the consumption of building materials and energy during operation. At the same time, the design of an optimal house footprint, i.e., one that does not unnecessarily increase the surface area, is an important element of sustainable building design. As suggested by Seo and Hwang [75], the sustainable design of single-family houses should consider both the needs of the occupants and the environmental impact of the building throughout its life cycle. In their study, the authors showed that most of the CO2 emissions produced during the life cycle of a residential building are due to the operation of the building, accounting for 87–97% of total CO2 emissions.
Another critical aspect of creating low-carbon homes is the selection of appropriate energy-efficient building materials. It is important that these materials are not only sustainable and energy-efficient but also have the lowest possible environmental impact throughout their life cycle, from raw material extraction, production, and use to recycling or disposal [76,77]. According to Sathre and O’Connor [78], replacing non-renewable building materials such as concrete or steel with wood can lead to significant reductions in GHG emissions. The authors emphasise that wood, as a renewable material, has significant potential to store carbon, which contributes to reducing overall CO2 emissions from a building, provided that forests are managed sustainably and wood residues are used responsibly. However, the use of wood as a building material alone does not guarantee low CO2 emissions. As shown in a study by Polgár [79], some woods can emit more CO2 than others, depending on the method of production, transport, and processing. Therefore, it is important to consider the entire life cycle of a building material when choosing the most suitable one to build a sustainable home.
Studies carried out on masonry and timber buildings confirm that the use of renewable building materials such as wood-based materials, e.g., structural wood, OSB, significantly reduces the CO2 emissions of the building. The use of wood-frame construction for external walls reduced CO2 emissions by almost 40%. These results are in line with the trend observed in many other building studies. According to Gustavsson et al. [80], timber-frame buildings actually consume less energy and emit less CO2 into the atmosphere compared to buildings with concrete structures. The authors pointed out that wood as a building material can store carbon over the lifetime of a building, which contributes to reducing the carbon dioxide emitted into the atmosphere. Werner and Richter [81] highlighted in their study that wood as a building material has an overall favourable CO2 emission profile throughout their life cycle.
Low-carbon building design should include not only the careful selection of appropriate building materials but also a holistic analysis of energy use over at least the next 50 years [82,83]. This is important because it is the energy use of a building that accounts for most of its total life cycle CO2e emissions. According to a study by Ramesh et al. [84], 80–90% of energy consumption depends on a building’s operation. This long-term analysis allows for the careful design and selection of appropriate energy sources. The introduction of efficient heating and cooling systems, as well as the use of renewable energy sources such as solar or wind power, can contribute significantly to the reduction in CO2e emissions [85]. For example, in studies by Feist [86,87], it was found that a passive building can use up to 90% less energy for heating than a standard building. Choosing such solutions not only improves energy efficiency but also allows a significant reduction in usable and final energy demand [88,89].

5. Conclusions

The aim of this paper is to provide a holistic view of carbon footprint and resource consumption in the context of single-family homes. Using advanced research tools, including BIM technology, a detailed analysis of individual structural elements was carried out, and their impact on the entire building life cycle was assessed. The research process was complemented by an LCA and an energy performance audit to estimate CO2e emissions and total energy consumption throughout the life of the building.
This study compared two building models, one a masonry building and the other a timber-frame building. By analysing the CO2e emissions generated during both the manufacturing process (stages A1–A3) and the use of buildings (stage B), we were able to identify the key factors influencing the carbon footprint. We confirmed that timber structures have a significantly lower carbon footprint than masonry structures, demonstrating their greater sustainability. Equally important was the comparison of total energy consumption for both types of buildings. By using the EcoDesigner star for energy analysis, we were able to accurately calculate the energy consumption (in MJ units). The results confirm the superiority of timber construction, which is characterised by a lower energy consumption during operation and therefore has a positive impact on the environment. Minimising the cumulative carbon footprint of buildings is key to achieving sustainability goals and mitigating climate change. However, this research did not overlook another important natural resource, water. Although our research focused primarily on CO2e emissions and energy consumption, the analysis of water use was an important complement to our research, highlighting that water use during construction is an important element.
As a result, this scientific publication provides valuable information and conclusions for the scientific community, design and construction professionals, and decision makers in the selection of residential building structures. Research results can contribute to the promotion of greener and more sustainable building solutions, which is extremely important in the context of climate change and environmental protection. Further research in these areas can contribute to the development of knowledge about sustainable construction and provide practical tools and guidelines to help designers, investors, and decision makers make more informed decisions in the construction of energy-efficient and eco-efficient buildings. However, LCA studies have not been without their share of criticism and scepticism. An important issue is the variability, quality, and availability of data. In the construction industry, the manufacturers of building materials provide the data for LCA studies. There is a lack of verification of these data, which can jeopardise the reliability and comparability of the results. Furthermore, the use of outdated or generalised data can distort the results, misleading decision makers. Another important material issue is the end-of-life phase, concerning demolition and material disposal or recycling in the construction sector, which is also subject to criticism. The precision of projections regarding future recycling technologies, waste management practises, and subsequent environmental impacts can be notably speculative and possibly distort LCA outcomes.

Author Contributions

Conceptualisation, Ł.M. and A.O.; methodology, Ł.M. and A.O.; software, Ł.M. and A.O.; validation, Ł.M. and A.O.; formal analysis, Ł.M. and A.O.; investigation, Ł.M. and A.O.; resources, Ł.M. and A.O.; data curation, Ł.M. and A.O.; writing—original draft preparation, Ł.M. and A.O.; writing—review and editing, Ł.M. and A.O. All authors have read and agreed to the published version of the manuscript.

Funding

This research received no external funding.

Institutional Review Board Statement

Not applicable.

Informed Consent Statement

Not applicable.

Data Availability Statement

Not applicable.

Conflicts of Interest

The authors declare no conflict of interest.

Appendix A

Table A1. Summary of building materials used in the masonry and timber buildings.
Name of the MaterialUnitsBuilding A
Masonry Building
Building B
Timber Building
Gypsum Fibreboardm374.50653.70
Stone wool acoustic insulationm30.3710.99
Gypsum plaster boardm2-38.47
Clinker bricksm31.531.37
Stone wool heat insulationm323.4253.50
SWISSKRONO OSBm30.073.19
Air barrier membranem258.28131.41
External silicone plasterkg3236.64983.19
Extruded polystyrene (XPS) foam boardm348.1520.61
PE foil, dimpledm210.0110.01
KVH construction timberm36.5327.08
Aerated concrete P3m32.91-
Concrete C20/25m315.076.13
Reinforcing steelkg1544.781383.07
Humidity variable air and vapour membranem260.2262.44
Sandkg80,920.1680,920.16
Profiled aluminium sheets for roofm283.5775.54
Underroof membrane-reinforced PE fabricm283.5775.54
Stoneware tiles, glazedm258.2859.06
Solid wood parquetm260.2262.44
Internal gypsum plasterm34.67-
Masonry bricksm351.00-

References

  1. Mazur, Ł.; Bać, A.; Vaverková, M.D.; Winkler, J.; Nowysz, A.; Koda, E. Evaluation of the Quality of the Housing Environment Using Multi-Criteria Analysis That Includes Energy Efficiency: A Review. Energies 2022, 15, 7750. [Google Scholar] [CrossRef]
  2. Shen, F.; Simayi, Z.; Yang, S.; Mamitimin, Y.; Zhang, X.; Zhang, Y. A Bibliometric Review of Household Carbon Footprint during 2000–2022. Sustainability 2023, 15, 6138. [Google Scholar] [CrossRef]
  3. Yan, X.; Cui, S.; Xu, L.; Lin, J.; Ali, G. Carbon Footprints of Urban Residential Buildings: A Household Survey-Based Approach. Sustainability 2018, 10, 1131. [Google Scholar] [CrossRef]
  4. Isaksson, R.; Rosvall, M.; Espuny, M.; Nunhes, T.V.; De Oliveira, O.J. How Is Building Sustainability Understood?—A Study of Research Papers and Sustainability Reports. Sustainability 2022, 14, 12430. [Google Scholar] [CrossRef]
  5. Architecture 2030 Why the Building Sector? 2022. Available online: https://architecture2030.org/ (accessed on 10 September 2023).
  6. United Nations Environment Programme. 2022 Global Status Report for Buildings and Construction: Towards a Zero-Emission, Efficient and Resilient Buildings and Construction Sector; United Nations Environment Programme: Nairobi, Kenya, 2022. [Google Scholar]
  7. United Nations Environment Programme. Buildings and Climate Change: A Summary for Decision-Makers; UNEP DTIE, Sustainable Consumption and Production Branch: Paris, France, 2011; ISBN 978-92-807-3064-7. [Google Scholar]
  8. Atmaca, A.; Atmaca, N. Carbon Footprint Assessment of Residential Buildings, a Review and a Case Study in Turkey. J. Clean. Prod. 2022, 340, 130691. [Google Scholar] [CrossRef]
  9. Sizirici, B.; Fseha, Y.; Cho, C.-S.; Yildiz, I.; Byon, Y.-J. A Review of Carbon Footprint Reduction in Construction Industry, from Design to Operation. Materials 2021, 14, 6094. [Google Scholar] [CrossRef]
  10. Onat, N.C.; Kucukvar, M. Carbon Footprint of Construction Industry: A Global Review and Supply Chain Analysis. Renew. Sustain. Energy Rev. 2020, 124, 109783. [Google Scholar] [CrossRef]
  11. Ahmetoğlu, S.; Tanik, A. Management of Carbon Footprint and Determination of GHG Emission Sources in Construction Sector. Int. J. Environ. Geoinform. 2020, 7, 191–204. [Google Scholar] [CrossRef]
  12. Starzyk, A.; Donderewicz, M.; Rybak-Niedziółka, K.; Marchwiński, J.; Grochulska-Salak, M.; Łacek, P.; Mazur, Ł.; Voronkova, I.; Vietrova, P. The Evolution of Multi-Family Housing Development Standards in the Climate Crisis: A Comparative Analysis of Selected Issues. Buildings 2023, 13, 1985. [Google Scholar] [CrossRef]
  13. Kuda, D.; Petříčková, M. Modular Timber Gridshells. J. Sustain. Archit. Civ. Eng. 2021, 28, 72–79. [Google Scholar] [CrossRef]
  14. Mitterpach, J.; Štefko, J. An Environmental Impact of a Wooden and Brick House by the LCA Method. Key Eng. Mater. 2016, 688, 204–209. [Google Scholar] [CrossRef]
  15. Hrdlicka, T.; Cupal, M.; Komosna, M. Wood vs. Brick: Impact on Investment Costs of Houses. J. Build. Eng. 2022, 49, 104088. [Google Scholar] [CrossRef]
  16. Ansah, M.K.; Chen, X.; Yang, H.; Lu, L.; Lam, P.T.I. Developing an Automated BIM-Based Life Cycle Assessment Approach for Modularly Designed High-Rise Buildings. Environ. Impact Assess. Rev. 2021, 90, 106618. [Google Scholar] [CrossRef]
  17. Díaz, J.; Antön, L.Á. Sustainable Construction Approach through Integration of LCA and BIM Tools. In Proceedings of the Computing in Civil and Building Engineering 2014, American Society of Civil Engineers, Orlando, FL, USA, 17 June 2014; pp. 283–290. [Google Scholar]
  18. Cheng, B.; Li, J.; Tam, V.W.Y.; Yang, M.; Chen, D. A BIM-LCA Approach for Estimating the Greenhouse Gas Emissions of Large-Scale Public Buildings: A Case Study. Sustainability 2020, 12, 685. [Google Scholar] [CrossRef]
  19. Kylili, A.; Fokaides, P.A. Policy Trends for the Sustainability Assessment of Construction Materials: A Review. Sustain. Cities Soc. 2017, 35, 280–288. [Google Scholar] [CrossRef]
  20. Liu, Z.; Li, P.; Wang, F.; Osmani, M.; Demian, P. Building Information Modeling (BIM) Driven Carbon Emission Reduction Research: A 14-Year Bibliometric Analysis. Int. J. Environ. Res. Public Health 2022, 19, 12820. [Google Scholar] [CrossRef]
  21. Olawumi, T.O.; Chan, D.W.M. An Empirical Survey of the Perceived Benefits of Executing BIM and Sustainability Practices in the Built Environment. Constr. Innov. 2019, 19, 321–342. [Google Scholar] [CrossRef]
  22. Gan, V.J.L.; Deng, M.; Tse, K.T.; Chan, C.M.; Lo, I.M.C.; Cheng, J.C.P. Holistic BIM Framework for Sustainable Low Carbon Design of High-Rise Buildings. J. Clean. Prod. 2018, 195, 1091–1104. [Google Scholar] [CrossRef]
  23. Leszczyszyn, E.; Heräjärvi, H.; Verkasalo, E.; Garcia-Jaca, J.; Araya-Letelier, G.; Lanvin, J.-D.; Bidzińska, G.; Augustyniak-Wysocka, D.; Kies, U.; Calvillo, A.; et al. The Future of Wood Construction: Opportunities and Barriers Based on Surveys in Europe and Chile. Sustainability 2022, 14, 4358. [Google Scholar] [CrossRef]
  24. Freer-Smith, P.; Carnus, J.-M. The Sustainable Management and Protection of Forests: Analysis of the Current Position Globally. AMBIO A J. Hum. Environ. 2008, 37, 254–262. [Google Scholar] [CrossRef]
  25. Baker, S.C.; Spies, T.A.; Wardlaw, T.J.; Balmer, J.; Franklin, J.F.; Jordan, G.J. The Harvested Side of Edges: Effect of Retained Forests on the Re-Establishment of Biodiversity in Adjacent Harvested Areas. For. Ecol. Manag. 2013, 302, 107–121. [Google Scholar] [CrossRef]
  26. ISO 14040:2006; Environmental Management—Life Cycle Assessment—Principles and Framewor. International Organization for Standardization: Geneva, Switzerland, 2006.
  27. ISO 14044:2006; Environmental Management—Life Cycle Assessment—Requirements and Guidelines. International Organization for Standardization: Geneva, Switzerland, 2006.
  28. Pacheco-Torres, R.; Jadraque, E.; Roldán-Fontana, J.; Ordóñez, J. Analysis of CO2 Emissions in the Construction Phase of Single-Family Detached Houses. Sustain. Cities Soc. 2014, 12, 63–68. [Google Scholar] [CrossRef]
  29. Vilches, A.; Garcia-Martinez, A.; Sanchez-Montañes, B. Life Cycle Assessment (LCA) of Building Refurbishment: A Literature Review. Energy Build. 2017, 135, 286–301. [Google Scholar] [CrossRef]
  30. Banias, G.F.; Karkanias, C.; Batsioula, M.; Melas, L.D.; Malamakis, A.E.; Geroliolios, D.; Skoutida, S.; Spiliotis, X. Environmental Assessment of Alternative Strategies for the Management of Construction and Demolition Waste: A Life Cycle Approach. Sustainability 2022, 14, 9674. [Google Scholar] [CrossRef]
  31. Rodríguez, L.; Martínez, L.; Panameño, R.; París, O.; Muros, A.; Rodríguez, R.; Javier, R.; González, C. LCA of the NZEB El Salvador Building, a Model to Estimate the Carbon Footprint in a Tropical Country. J. Clean. Prod. 2023, 408, 137137. [Google Scholar] [CrossRef]
  32. Säynäjoki, A.; Heinonen, J.; Junnila, S. Carbon Footprint Assessment of a Residential Development Project. Int. J. Environ. Sci. Dev. 2011, 2, 116–123. [Google Scholar] [CrossRef]
  33. Tulevech, S.M.; Hage, D.J.; Jorgensen, S.K.; Guensler, C.L.; Himmler, R.; Gheewala, S.H. Life Cycle Assessment: A Multi-Scenario Case Study of a Low-Energy Industrial Building in Thailand. Energy Build. 2018, 168, 191–200. [Google Scholar] [CrossRef]
  34. Ciroth, A. ICT for Environment in Life Cycle Applications OpenLCA—A New Open Source Software for Life Cycle Assessment. Int. J. Life Cycle Assess 2007, 12, 209–210. [Google Scholar] [CrossRef]
  35. Silva, D.A.L.; Nunes, A.O.; da Silva Moris, V.A.; Piekarski, C.M. How Important Is the LCA Software Tool You Choose? Comparative Results from GaBi, OpenLCA, SimaPro and Umberto. In Proceedings of the Conference: VII Conferencia Internacional de Análisis de Ciclo de Vida en Latinoamérica, Medellin, Colombia, 10–15 June 2017. [Google Scholar]
  36. Hemmati, M.; Messadi, T.; Gu, H. Life Cycle Assessment of Cross-Laminated Timber Transportation from Three Origin Points. Sustainability 2021, 14, 336. [Google Scholar] [CrossRef]
  37. Luz, L.M.D.; Francisco, A.C.D.; Piekarski, C.M.; Salvador, R. Integrating Life Cycle Assessment in the Product Development Process: A Methodological Approach. J. Clean. Prod. 2018, 193, 28–42. [Google Scholar] [CrossRef]
  38. Olagunju, B.D.; Olanrewaju, O.A. Comparison of Life Cycle Assessment Tools in Cement Production. S. Afr. J. Ind. Eng. 2020, 31, 70–83. [Google Scholar] [CrossRef]
  39. Grossi, F.; Ge, H.; Zmeureanu, R.; Baba, F. Feasibility of Planting Trees around Buildings as a Nature-Based Solution of Carbon Sequestration—An LCA Approach Using Two Case Studies. Buildings 2022, 13, 41. [Google Scholar] [CrossRef]
  40. Pezeshki, Z.; Ivari, S.A.S. Applications of BIM: A Brief Review and Future Outline. Arch. Comput. Methods Eng. 2018, 25, 273–312. [Google Scholar] [CrossRef]
  41. Azhar, S. Building Information Modeling (BIM): Trends, Benefits, Risks, and Challenges for the AEC Industry. Leadersh. Manag. Eng. 2011, 11, 241–252. [Google Scholar] [CrossRef]
  42. Bahar, Y.; Pere, C.; Landrieu, J.; Nicolle, C. A Thermal Simulation Tool for Building and Its Interoperability through the Building Information Modeling (BIM) Platform. Buildings 2013, 3, 380–398. [Google Scholar] [CrossRef]
  43. Smith, P. BIM & the 5D Project Cost Manager. Procedia-Soc. Behav. Sci. 2014, 119, 475–484. [Google Scholar] [CrossRef]
  44. Antón, L.Á.; Díaz, J. Integration of Life Cycle Assessment in a BIM Environment. Procedia Eng. 2014, 85, 26–32. [Google Scholar] [CrossRef]
  45. Doan, D.T.; Ghaffarianhoseini, A.; Naismith, N.; Ghaffarianhoseini, A.; Zhang, T.; Tookey, J. Examining Green Star Certification Uptake and Its Relationship with Building Information Modelling (BIM) Adoption in New Zealand. J. Environ. Manag. 2019, 250, 109508. [Google Scholar] [CrossRef]
  46. Potrč Obrecht, T.; Röck, M.; Hoxha, E.; Passer, A. BIM and LCA Integration: A Systematic Literature Review. Sustainability 2020, 12, 5534. [Google Scholar] [CrossRef]
  47. Soust-Verdaguer, B.; Llatas, C.; García-Martínez, A. Critical Review of Bim-Based LCA Method to Buildings. Energy Build. 2017, 136, 110–120. [Google Scholar] [CrossRef]
  48. Röck, M.; Hollberg, A.; Habert, G.; Passer, A. LCA and BIM: Visualization of Environmental Potentials in Building Construction at Early Design Stages. Build. Environ. 2018, 140, 153–161. [Google Scholar] [CrossRef]
  49. Carvalho, J.P.; Alecrim, I.; Bragança, L.; Mateus, R. Integrating BIM-Based LCA and Building Sustainability Assessment. Sustainability 2020, 12, 7468. [Google Scholar] [CrossRef]
  50. Bueno, C.; Fabricio, M.M. Comparative Analysis between a Complete LCA Study and Results from a BIM-LCA Plug-In. Autom. Constr. 2018, 90, 188–200. [Google Scholar] [CrossRef]
  51. Antón, L.Á.; Díaz, J. Integration of Lca And Bim For Sustainable Construction. World Acad. Sci. Eng. Technol. 2014, 8, 1378–1382. [Google Scholar] [CrossRef]
  52. Santos, R.; Costa, A.A.; Silvestre, J.D.; Pyl, L. Integration of LCA and LCC Analysis within a BIM-Based Environment. Autom. Constr. 2019, 103, 127–149. [Google Scholar] [CrossRef]
  53. Kim, J.B.; Jeong, W.; Clayton, M.J.; Haberl, J.S.; Yan, W. Developing a Physical BIM Library for Building Thermal Energy Simulation. Autom. Constr. 2015, 50, 16–28. [Google Scholar] [CrossRef]
  54. Kamel, E.; Memari, A.M. Review of BIM’s Application in Energy Simulation: Tools, Issues, and Solutions. Autom. Constr. 2019, 97, 164–180. [Google Scholar] [CrossRef]
  55. Wei, H.; Zheng, S.; Zhao, L.; Huang, R. BIM-Based Method Calculation of Auxiliary Materials Required in Housing Construction. Autom. Constr. 2017, 78, 62–82. [Google Scholar] [CrossRef]
  56. Kim, K.P. BIM-Enabled Sustainable Housing Refurbishment—LCA Case Study. In Sustainable Construction Technologies; Elsevier: Amsterdam, The Netherlands, 2019; pp. 349–394. ISBN 978-0-12-811749-1. [Google Scholar]
  57. EN 1990:2002+A1; Basis of Structural Design. European Committee For Standardization: Brussels, Belgium, 2002.
  58. Cole, R.J.; Kernan, P.C. Life-Cycle Energy Use in Office Buildings. Build. Environ. 1996, 31, 307–317. [Google Scholar] [CrossRef]
  59. Lendager Architects. Formfaktor Aps DesignLCA. Available online: https://www.designlca.com/ (accessed on 10 September 2023).
  60. Polish Green Building Council. Estimating the Carbon Footpront of Buildings. Whole Life Carbon Roadmap for Poland 2050; Polish Green Building Council: Gliwice, Poland, 2021. [Google Scholar]
  61. Bundesministerium für Wohnen, Stadtentwicklung und Bauwesen ÖKOBAUDAT. Available online: www.oekobaudat.de (accessed on 10 September 2023).
  62. EN 15804+A2; Sustainability of Construction Works—Environmental Product Declarations—Core Rules for the Product Category of Construction Products. European Committee For Standardization: Brussels, Belgium, 2019.
  63. Čekon, M.; Struhala, K.; Slávik, R. Cardboard-Based Packaging Materials as Renewable Thermal Insulation of Buildings: Thermal and Life-Cycle Performance. J. Renew. Mater. 2017, 5, 84–93. [Google Scholar] [CrossRef]
  64. Slávik, R.; Čekon, M.; Štefaňák, J. A Nondestructive Indirect Approach to Long-Term Wood Moisture Monitoring Based on Electrical Methods. Materials 2019, 12, 2373. [Google Scholar] [CrossRef] [PubMed]
  65. EN 15978:2011; Sustainability of Construction Works. European Committee For Standardization: Brussels, Belgium, 2011.
  66. Winkler, J.; Jeznach, J.; Koda, E.; Sas, W.; Mazur, Ł.; Vaverková, M. Promoting Biodiversity: Vegetation in a Model Small Park Located in the Research and Educational Centre. J. Ecol. Eng. 2022, 23, 146–157. [Google Scholar] [CrossRef]
  67. Winkler, J.; Mazur, Ł.; Smékalová, M.; Podlasek, A.; Hurajová, E.; Koda, E.; Jiroušek, M.; Jakimiuk, A.; Vaverková, M.D. Influence of Land Use on Plant Community Composition in Vysocina Region Grasslands, Czech Republic. Environ. Protect. Eng. 2022, 48, 21–33. [Google Scholar] [CrossRef]
  68. Vijayan, D.S.; Devarajan, P.; Sivasuriyan, A.; Stefańska, A.; Koda, E.; Jakimiuk, A.; Vaverková, M.D.; Winkler, J.; Duarte, C.C.; Corticos, N.D. A State of Review on Instigating Resources and Technological Sustainable Approaches in Green Construction. Sustainability 2023, 15, 6751. [Google Scholar] [CrossRef]
  69. Magwood, C.; Bowden, E.; Javaria, A.; Deluca, M.; Treadaway, E.; Douglas, N. Establishing the Average Upfront Material Carbon Emissions in New Low-Rise Residential Home Construction in the City of Nelson & the City of Castlegar; Manager of Planning, Development & Sustainability, City of Castlegar: Castlegar, CB, Canada, 2022. [Google Scholar] [CrossRef]
  70. Magwood, C.; Huynh, T. The Hidden Climate Impact of Residential Construction; RMI: Basalt, CO, USA, 2023. [Google Scholar]
  71. Arceo, A.; Tham, M.; Guven, G.; MacLean, H.L.; Saxe, S. Capturing Variability in Material Intensity of Single-Family Dwellings: A Case Study of Toronto, Canada. Resour. Conserv. Recycl. 2021, 175, 105885. [Google Scholar] [CrossRef]
  72. Marchwiński, J.; Starzyk, A.; Kopyłow, O.; Kurtz-Orecka, K. Impact of Atrium Glazing with and without BIPV on Energy Performance of the Low-Rise Building: A Central European Case Study. Energies 2023, 16, 4683. [Google Scholar] [CrossRef]
  73. Struhala, K.; Čekon, M.; Slávik, R. Life Cycle Assessment of Solar Façade Concepts Based on Transparent Insulation Materials. Sustainability 2018, 10, 4212. [Google Scholar] [CrossRef]
  74. Bierwirth, A.; Thomas, S. Estimating the Sufficiency Potential in Buildings: The Space between under Dimensioned and Oversized. In Proceedings of the Eceee Summer Study Proceedings 2019, Giens Peninsula, France, 3–8 June 2019. [Google Scholar]
  75. Seo, S.; Hwang, Y. Estimation of CO2 Emissions in Life Cycle of Residential Buildings. J. Constr. Eng. Manag. 2001, 127, 414–418. [Google Scholar] [CrossRef]
  76. Moncaster, A.M.; Symons, K.E. A Method and Tool for ‘Cradle to Grave’ Embodied Carbon and Energy Impacts of UK Buildings in Compliance with the New TC350 Standards. Energy Build. 2013, 66, 514–523. [Google Scholar] [CrossRef]
  77. Rybak-Niedziółka, K.; Starzyk, A.; Łacek, P.; Mazur, Ł.; Myszka, I.; Stefańska, A.; Kurcjusz, M.; Nowysz, A.; Langie, K. Use of Waste Building Materials in Architecture and Urban Planning—A Review of Selected Examples. Sustainability 2023, 15, 5047. [Google Scholar] [CrossRef]
  78. Sathre, R.; O’Connor, J. Meta-Analysis of Greenhouse Gas Displacement Factors of Wood Product Substitution. Environ. Sci. Policy 2010, 13, 104–114. [Google Scholar] [CrossRef]
  79. Polgár, A. Carbon Footprint and Sustainability Assessment of Wood Utilisation in Hungary. Environ. Dev. Sustain. 2023. [Google Scholar] [CrossRef]
  80. Gustavsson, L.; Pingoud, K.; Sathre, R. Carbon Dioxide Balance of Wood Substitution: Comparing Concrete- and Wood-Framed Buildings. Mitig. Adapt. Strat. Glob. Chang. 2006, 11, 667–691. [Google Scholar] [CrossRef]
  81. Werner, F.; Richter, K. Wooden Building Products in Comparative LCA: A Literature Review. Int. J. Life Cycle Assess 2007, 12, 470–479. [Google Scholar] [CrossRef]
  82. Shao, L.; Chen, G.Q.; Chen, Z.M.; Guo, S.; Han, M.Y.; Zhang, B.; Hayat, T.; Alsaedi, A.; Ahmad, B. Systems Accounting for Energy Consumption and Carbon Emission by Building. Commun. Nonlinear Sci. Numer. Simul. 2014, 19, 1859–1873. [Google Scholar] [CrossRef]
  83. Kasperski, J.; Bać, A.; Oladipo, O. A Simulation of a Sustainable Plus-Energy House in Poland Equipped with a Photovoltaic Powered Seasonal Thermal Storage System. Sustainability 2023, 15, 3810. [Google Scholar] [CrossRef]
  84. Ramesh, T.; Prakash, R.; Shukla, K.K. Life Cycle Energy Analysis of Buildings: An Overview. Energy Build. 2010, 42, 1592–1600. [Google Scholar] [CrossRef]
  85. Min, J.; Yan, G.; Abed, A.M.; Elattar, S.; Amine Khadimallah, M.; Jan, A.; Elhosiny Ali, H. The Effect of Carbon Dioxide Emissions on the Building Energy Efficiency. Fuel 2022, 326, 124842. [Google Scholar] [CrossRef]
  86. Feist, W. Active for More Comfort: Passive House; Nternational Passive House Association: Darmstadt, Germany, 2018. [Google Scholar]
  87. Peper, S.; Feist, W. Energy Efficiency of the Passive House Standard: Expectations Confirmed by Measurements in Practice; Passive House Institute: Darmstadt, Germany, 2015. [Google Scholar]
  88. James, M.; Bill, J. Passive House in Different Climates: The Path to Net Zero; Routledge, Taylor & Francis Group: New York, NY, USA, 2016; ISBN 978-1-138-90403-3. [Google Scholar]
  89. Wąs, K.; Radoń, J.; Sadłowska-Sałęga, A. Maintenance of Passive House Standard in the Light of Long-Term Study on Energy Use in a Prefabricated Lightweight Passive House in Central Europe. Energies 2020, 13, 2801. [Google Scholar] [CrossRef]
Figure 1. Stages of LCA, highlighting the analysed phases: A1–A3 and B6.
Sustainability 15 15486 g001
Figure 2. (a) Ground floor plan, description of rooms: 101—entrance lobby (entry), 102—hall, 103—bathroom, 104—living room with kitchen, 105—utility room, 106—garage, 107—technical room. (b) Attic floor plan, description of the rooms: 201—landing, 202—bedroom I, 203—bedroom II, 204—bedroom III, 205—bathroom, 206—utility room.
Sustainability 15 15486 g002
Figure 3. Architectural visualisation (project authors: Łukasz Mazur, Katarzyna Furgoł, Mariela Soria).
Sustainability 15 15486 g003
Figure 4. Energy audit that shows the monthly energy requirement and the monthly energy emissions for building A—masonry construction.
Sustainability 15 15486 g004
Figure 5. Distribution of energy consumption by source and usage in building A in masonry construction.
Sustainability 15 15486 g005
Figure 6. Energy audit that shows the monthly energy requirement and the monthly energy emissions for building B—timber construction.
Sustainability 15 15486 g006
Figure 7. Distribution of energy consumption by source and usage in building B in timber construction.
Sustainability 15 15486 g007
Table 1. Overview of the available LCA programme.
SoftwareDescription
OpenLCA 2.0.3OpenLCA is an advanced open source software for LCA and Environmental Impact Assessment (EIA) of products and services. It has the advantage of being accessible and versatile, making it widely used in research and industrial practice [34].
SimaPro + Report MakerSimaPro is a professional tool that provides a comprehensive assessment of the environmental footprint of products and processes. Report Maker is a tool that integrates with SimaPro and allows the creation of advanced reports and visualisations of LCA results [35].
Tally (2023.09.13.01)Tally is a specialised software used for analysis in the construction sector. It is used mainly in the United States [36].
Umberto LCA+Umberto LCA+ can calculate carbon footprints, perform LCA analysis, create EPD declarations, and use the integrated ecoinvent database [37,38].
One-Click LCA Product Carbon & EPD Generator One-Click LCA is an expert package that can be split into an LCA and a Carbon Footprint + EPD module. However, the functionality of this software is limited the calculation of carbon footprint. It is integrated with an EPD generator based on the EN15804 standard [39].
Table 2. Overview of the available software in BIM technology.
SoftwareDescription
One-Click LCAThis is a common assessment tool used to measure the environmental sustainability of construction projects. One-Click LCA can be added to Autodesk Revit, ArchiCAD, and SketchUp as an additional feature. It enables users to perform sustainability assessments during the design process, considering factors such as building materials, energy usage, and emissions.
Tally (2023.09.13.01)This is an add-on to Autodesk Revit that allows you to explore the environmental impact of buildings as you design them. It allows the assessment of various aspects of sustainability, including carbon footprint, energy consumption, water consumption, materials, and waste.
Cerclos This is a cloud-based LCA tool that integrates with BIM programme such as Revit and ArchiCAD. It allows detailed LCA analyses to be carried out, taking into account various aspects of the building, such as building materials, energy consumption, waste management, and GHG emissions.
EC3 (Embodied Carbon in Construction Calculator)This is an LCA tool developed by the Carbon Leadership Forum. It can be added on to BIM programme such as Revit, Rhino, and Grasshopper. It makes it easy to measure the carbon footprint of building materials, which can help designers choose sustainable materials and make informed decisions about construction.
Table 3. Dimensional parameters for the buildings studied.
ParameterBuilding A
Masonry Building
Building B
Timber Building
Unit
Gross floor area153.80139.80m2
Usable floor area113.90115.70m2
Number of storeys22
Number of bedrooms33units
U-value heat transfer coefficient (thermal transmittance) (W/m2K)
External walls0.160.17W/m2K
Roof0.120.12W/m2K
Floor 0.140.14W/m2K
Net heating energy57.2141.32kWh/m2y
Net cooling energy5.0212.13kWh/m2y
Total net energy62.2353.45kWh/m2y
Energy consumption63.0254.19kWh/m2y
Fuel consumption9.349.11kWh/m2y
CO2e emissions2.021.97kg/m2y
Internal temperature
(annual average value)
Heated rooms20.6621.51°C
Non-heated rooms14.8315.32°C
Table 4. Emissions produced by construction materials used in buildings A and B. * Primary energy non-renewable (PENRT).
MaterialUnitDensity (kg/m3)Embodied Energy (MJ/kg) PENRT *
A1–A3
Carbon Data
(kg CO2/unit)
Water m3/m3
Reinforcing steelkg7850.005545.000.471.4540
Concrete C20/25kg/m32400.00912.00178.000.7600
Masonry brickskg/m3575.001180.00113.000.1710
KVH construction timberkg/m3492.921124.00−767.800.2247
External silicone plasterkg1700.0013,790.690.0219
Internal gypsum plasterkg/m31000.0087.27119.400.2412
Steel galvanisedkg7850.0025.862.780.0031
Gypsum fibreboardkg/m31180.0017.401.140.0070
Gypsum plaster boardkg/m210.0034.851.620.0079
Swisskrono OSBkg/m3614.503950.00−890.000.7980
Solid wood parquetkg/m2575.0087.27−18.740.0230
Aerated concrete P3kg/m3380.001263184.400.6385
Sandkg1.000.030.000.0000
Profiled aluminium sheets for roofkg/m22.900360.3027.030.3715
Stoneware tiles, glazedkg/m220.00100.406.180.0135
Stone wool acoustic insulation kg/m3155.001836.00196.600.4590
Stone wool heat insulation kg/m3155.001836.00196.600.4590
Extruded polystyrene (XPS) foam boardkg/m332.70786.554.240.3555
Air barrier membranekg/m20.1715.811.180.0149
PE foil, dimpledkg/m21.20114.74.120.0161
Humidity variable air and vapour membranekg/m20.0912.530.530.0035
Underroof membrane-reinforced PE fabrickg/m20.1410.960.430.0037
Table 5. Impact of building elements on the distribution of total CO2e emissions.
Construction
Component
Building A
Masonry Building
Building B
Timber Building
(kg CO2e)(%)(kg CO2e)(%)
Foundations1045.614.10%1030.8641.98%
External walls9829.7038.56%159.756.51%
Internal walls1307.405.13%−754.03−30.70%
Inter-storey floor4076.3115.99%−5191.64−211.41%
Roof1305.315.12%1376.5556.05%
Internal installations2317.009.09%223.009.08%
Stairs−573.88−2.25%−573.88−23.37%
Windows5971.8423.43%5971.84243.18%
Doors213.300.84%213.308.69%
Global Warming Potential—total (GWP-total)25,492.59100.00%2455.75100.00%
Total emission26,066.47 8975.30
Excess CO2 accumulation−573.88 −6519.55
Table 6. Differences between the buildings studied: a. cumulative energy comparison (MJ); b. comparison of the cumulative carbon footprint (kg CO2e); c. cumulative water consumption (m3).
Life Cycle Phasea. Cumulative Energy (MJ)
Building A
Masonry Building
Building B
Timber Building
A1–A3 production stage8,839,875.657,936,714.68
b. Carbon footprint(kg CO2e)
A1–A3 production stage25,492.592455.75
B6 energy consumption over a 50-year life cycle17,734.3511,066.38
Total43,226.9413,522.13
c. Water consumption(m3)
A1–A3 production stage2406.342121.80
Table 7. Embodied carbon emission intensity. * Energy = energy consumed by the building per year.
House TypeNet Emissions
kg CO2e
Emission
Intensity
kg CO2e/m2
Emission
Intensity
kg CO2e/m2/yr
Emission Intensity
kg CO2e/Bedroom
Energy * kWh/yr
Building A—Masonry building43,226.94281.065.6214,408.9894.87
Building B—Timber building13,522.1396.721.934507.3847.72
Disclaimer/Publisher’s Note: The statements, opinions and data contained in all publications are solely those of the individual author(s) and contributor(s) and not of MDPI and/or the editor(s). MDPI and/or the editor(s) disclaim responsibility for any injury to people or property resulting from any ideas, methods, instructions or products referred to in the content.

