Abstract
The flow characteristics of multistage centrifugal pumps in transporting gas–liquid mixed media are highly complex; particularly, the unstable flow of the passage at high gas contents exacerbates energy losses, leading to a decrease in pump efficiency and stability. The excess energy loss in the pump is not conducive to the concept of sustainable development. In this study, a numerical simulation of multistage centrifugal pumps was conducted based on the Euler–Euler heterogeneous two-fluid model. This research revealed that gas primarily accumulates on the suction side of each impeller stage, and the gas distribution decreases progressively with each stage. As the interstage gas volume fraction (IGVF) increases, the gas accumulation within the pump becomes more pronounced. The gas volume fraction of each component is negatively correlated with the flow rate, and the change is more obvious in the impeller. The turbulent kinetic energy distribution inside the impeller is positively correlated with the gas distribution. There is a large fluctuation at 0.6Q and 0.8Q, and the distribution of the impeller vortex is asymmetric. However, the impeller has a lower turbulent kinetic energy near 1.2Q, which indicates that the emergence of gas in the medium increases the high-efficiency area of the multistage pump to a certain extent. This paper reveals how the gas phase is distributed, how energy is lost in the multistage pump, and the gas–liquid two-phase flow characteristics in the pump, which have certain guiding significance for the design and working-condition adjustments of the gas–liquid mixed pump.
1. Introduction
Multistage centrifugal pumps are widely used in industrial sectors such as power generation, refining, and transportation. The energy conversion efficiency in the multistage pump directly affects the energy saving effect. Better energy saving effects can be more environmentally friendly, which is more in line with the concept of sustainable development. With the expansion of their applications, the conveyed media have become increasingly diverse and complex, posing challenges to the design and regulation of multistage pumps for the transportation of gas–liquid two-phase media [1,2]. In a multistage centrifugal pump, each impeller rotates at the same speed as the main shaft, and the increasing pressure within the flow passages continuously changes the distribution characteristics of the gas in the pump. This directly results in the continuous variation of the gas and liquid distribution in the flow passages of each impeller stage and guide vane stage, significantly aggravating the instability of the internal flow [3,4]. Because the flow is unstable, gas–liquid separation will lead to a reduction in the head and efficiency of the multistage centrifugal pump, which cannot meet the normal use of the pump and greatly limits the working efficiency. In severe cases, impeller blockage can occur, leading to irreversible consequences and accidents [5,6,7]. Therefore, it is crucial to explore the variation patterns of gas distribution in a gas–liquid two-phase flow in multistage centrifugal pumps in order to understand the reasons behind the performance deterioration of such pumps.
At present, there have been many studies on the overall performance of multistage pump in gas–liquid two-phase flows [8,9], flow characteristics, and visualization [10,11]. In a gas–liquid two-phase flow, four typical flow patterns have been found and confirmed [12]. Early researchers used numerical simulation methods [13] to study gas-liquid two-phase flows in multistage pumps and attempted various models, such as two-fluid models [14], Euler–Euler models [15], Volume of Fluid (VOF) models [16], etc. Research has found that turbulent dissipation is the primary cause of hydraulic losses in gas-liquid two-phase flows, and bubble behavior can induce turbulence. As the number of stages increases, the behavior of bubbles also varies, thus verifying the feasibility of a stage-by-stage design in multistage pumps [17]. For uniformly distributed gas, its impact on pump performance is relatively small [18]. Furthermore, the generation of pressure pulsations in the dynamic–static interference region between the guide vanes and impeller by the gas–liquid two-phase flow is also identified as a significant factor influencing the performance of multistage pumps [18].
Overall, some progress has been made in the research on multistage pumps under gas-containing conditions. However, there is still a relatively limited quantitative analysis of the gas distribution and turbulent kinetic energy distribution within the impeller passages, particularly the lack of research on inter-stage differences. In order to better realize the view of sustainable development of the environment, more in-depth research is needed. In this study, two parameters, the gas volume average and the turbulent kinetic energy volume average, were employed to investigate the gas-phase distribution patterns in a gas–liquid two-phase flow within multistage centrifugal pumps. The analysis focused on the flow characteristics and energy characteristics of the internal fluid, revealing the influence of the interstage gas volume fraction (IGVF) and flow rate on the performance of multistage multiphase pumps.
2. Geometric Model and Numerical Method
2.1. Model
The model of this multistage pump consists of inlet and outlet pipes, impellers, and guide vanes. The modeling of a single-stage centrifugal pump and the water body was performed using NX10.0. Figure 1 illustrates the models of the impeller and guide vane (left) and the water body (right). The key parameters are as follows: a rotational speed of 2875 r/min, a design flow rate (Q) of 140 m³/h, a rated head of 16 m for a single stage, and a specific speed of 113.48. The geometric parameters of the impeller and guide vane are shown in Table 1.
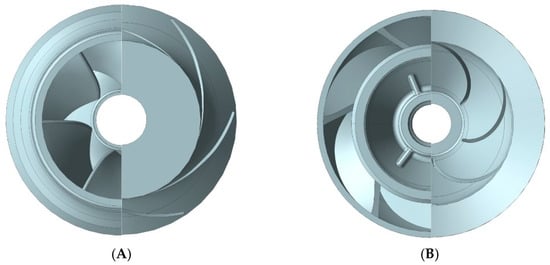
Figure 1.
Three-dimensional models of impeller and diffuser. (A) Impeller. (B) Diffuser.

Table 1.
Inlet and outlet parameters of impeller and diffuser.
2.2. Mesh
The quality of grid partitioning determines the accuracy of numerical simulations, necessitating high requirements for grid quality. Grids can be classified into structured grids and unstructured grids. In this numerical simulation of the pump, a structured grid was employed, with particular emphasis on optimizing the boundary grid. A schematic representation of the grid partitioning for the computational domain and various components can be seen in Figure 2. In order to ensure sufficient development of flow at the inlet and outlet, the inlet and outlet pipelines of the pump were extended by a distance equal to five times the pipe diameter.
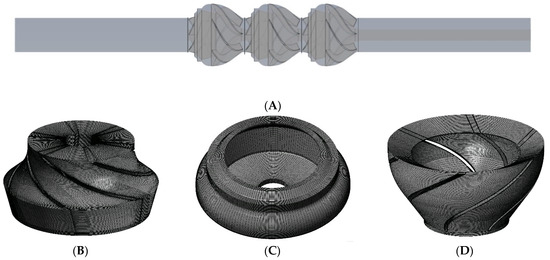
Figure 2.
Computational domain and mesh. (A) Computational domain. (B) Impeller mesh. (C) Pumped cavity mesh. (D) Diffuser mesh.
At the same time, in order to improve the efficiency and accuracy of calculation, the head of the three-stage centrifugal pump was used as a criterion to verify the grid independence. By adjusting the grid of each flow component, the obtained relationship between the pump head and the grid at the rated operating point (Q = 140 m3/h) is shown in Figure 3. It can be seen from Figure 3 that with the increase in the number of grids, the head change gradually tends to be gentle. Considering computational efficiency, a model with a total grid number of 8,090,000 was selected for numerical simulation.
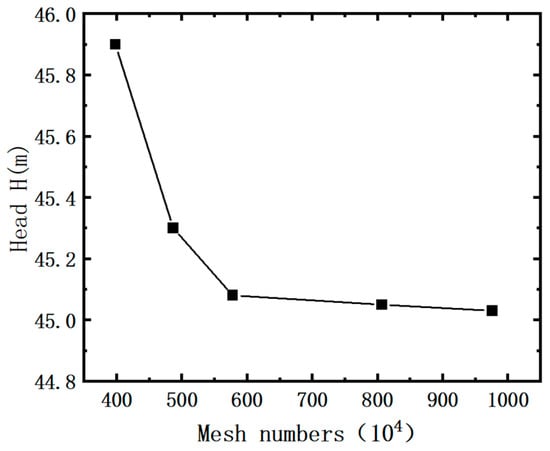
Figure 3.
Mesh independence verification.
2.3. Control Equation of Gas–Liquid Two-Phase Flow
The Euler–Euler heterogeneous two-fluid model is widely used in the gas–liquid two-phase simulation of a pump [19,20,21]. Multiphase flow models in CFX, such as homogeneous flow model and heterogeneous flow model, are often used in the study of gas–liquid two-phase flow. In this paper, the Euler–Euler two-fluid heterogeneous model is selected for numerical calculations. Since the density of the liquid changes only slightly at a very high pressure, the compressibility of the gas at a lower flow speed at a normal temperature and pressure can be ignored, so the fluid is assumed to be incompressible fluid. In addition, it is assumed that the flow is steady flow, the gas–liquid two-phase flow in the pump impeller is bubbly flow, the bubble is a sphere with uniform size and constant shape during the movement, and the bubble diameter is smaller than the characteristic size of the flow channel. The heat exchange of the fluid medium in the multistage centrifugal pump is very small and can be ignored. Therefore, the energy conservation can be ignored, and only the mass conservation equation and the momentum conservation equation need to be solved [22].
Continuity equation:
Momentum equation:
where k represents a different phase (l: liquid, g: gas); represent the density of different phases, kg/m3; represents the volume fraction of different phases; p represents pressure, Pa; represents dynamic viscosity, Pa·s; represents relative fluid velocity, m/s; represents the interfacial force, N; represents the mass force associated with impeller rotation, N; , , and are the external body force, the lift force, and the virtual mass force [23].
In addition, the Euler–Euler heterogeneous flow model is selected for numerical calculations. The phase of gas and liquid follows the following correlation [24]:
where represents the volume flow of gas in the pump, represents the volume flow of liquid in the pump, represents the gas volume fraction in the pump, and represents the gas volume fraction in the pump.
2.4. Method of Calculation
The Euler–Euler heterogeneous two-fluid model was used in the simulation. The liquid was set to a continuous phase, the gas was set to a discrete phase, and the sphere had a constant diameter of 0.3 mm [19]. The standard equation with a wide range of application was selected for the turbulence model [25]:
where is turbulent kinetic energy generation term, is turbulent viscosity coefficient, is turbulent kinetic energy, is turbulent dissipation rate, and is empirical coefficient; = 1.44, = 1.92, = 0.09.
The inlet of the inlet pipe section was a pressure inlet with a pressure of 10 kPa, and different inlet gas contents (IGVF = 1%, 3%, 5%) were set. The outlet was set as a total mass flow outlet with a standard rated flow rate of 140 m3/h. Using the gas–liquid two-phase phase correlation formula, the outlet mass flow table of each working condition is obtained as Table 2. The rotation speed was 2875 r/min, the wall was set to be fixed without slip, and the convergence residual was set to 10−4.
Table 2.
Outlet mass flow setting table.
3. Experimental Setup and Verification
The composition of the relevant experimental equipment is shown in Figure 4. In order to verify the accuracy of the numerical calculation, the experimental study was carried out on the pump performance test bench. The experiment-related measuring equipment includes a flowmeter, inlet and outlet pressure sensors, and torque meter. The performance curve of the experimental pump was obtained by collecting and inputting values to the test software of the computer through the information acquisition equipment.
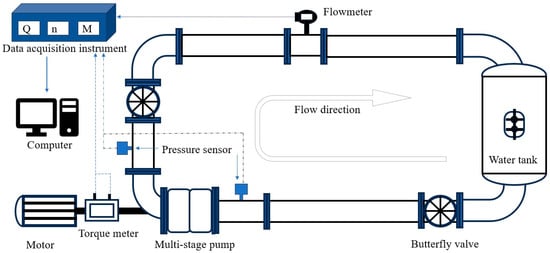
Figure 4.
Multistage pump test bench.
To validate the accuracy of the numerical computation method, experiments were conducted on pure water with a speed of 1450 r/min, a flow rate of 70 m³/h, and a two-stage setup. The comparison performance curve between simulation and experiment under this operating condition is shown in Figure 5. At various flow rates, the simulated results for the head and efficiency were slightly lower than the experimental results. This could be attributed to mechanical losses present in the experiment, such as bearing friction, losses in shaft transmission, and surface roughness effects. However, the trends of the head–efficiency curves obtained from both the experiment and numerical simulation were similar, thereby confirming the high accuracy of the numerical computations.
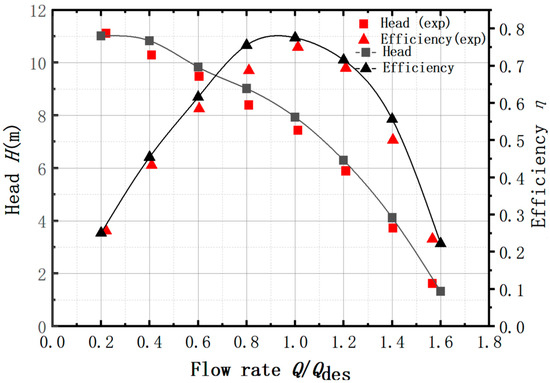
Figure 5.
Comparison of performance results of multistage pump simulation and test.
4. Results and Discussion
4.1. External Characteristics Comparison (2875 r/min, 140 m3/h, Three-Level)
In this study, the calculation and analysis of the gas–liquid two-phase flow in a multistage pump were conducted on a multistage centrifugal pump with IGVF (inlet guide vane angle) conditions of 1%, 3%, and 5%; a speed of 2875 r/min; and a rated flow rate of 140 m³/h. The performance characteristic curves of the head and efficiency of the IGVF under different working conditions are presented in Figure 6 and Figure 7, respectively.
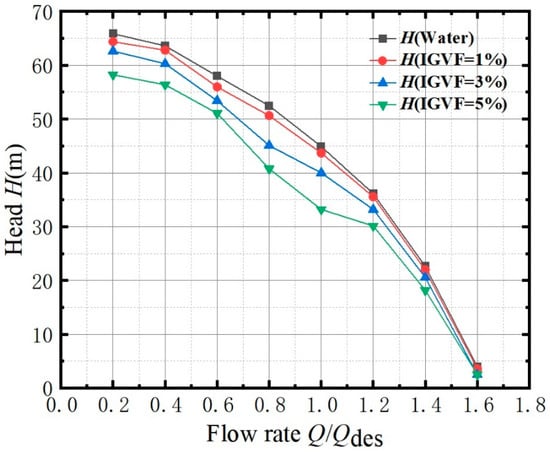
Figure 6.
Effect of IGVF on Q-H curve.
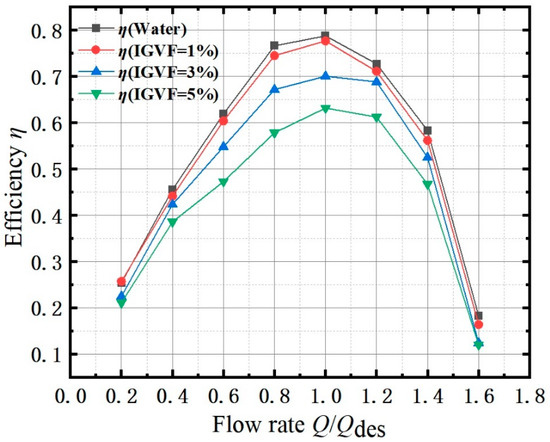
Figure 7.
Effect of IGVF on Q-η curve.
From Figure 6, it can be observed that the head decreases with an increase in IGVF, and the head under gas–liquid conditions is lower compared to that under pure water conditions. In all three gas–liquid conditions, the head exhibits a decreasing trend with an increasing flow rate. Unlike the gradual decrease in head observed under pure water conditions, a significant drop in head is observed in the range of 0.6–0.8Q when IGVF is 3% and 5%. This is because the flow rate of the gas–liquid mixture is low, resulting in a large amount of gas being unable to flow out in time. This leads to blockages in the impeller passages, increased flow resistance, and a noticeable fluctuation in the head. As the flow rate approaches the rated flow condition, the decrease in the head becomes less pronounced. This is because the decreased gas accumulation with increasing flow rate reduces flow losses and diminishes the gas accumulation in the flow passages to some extent. Hence, the decrease in the head becomes milder as the flow rate approaches the rated flow condition. This phenomenon can be explained by the combined effect of reduced gas blockage and increased flow losses associated with increasing flow rate. When the flow rate exceeds the rated flow condition, the gain from a reduced gas concentration is insufficient to reduce the loss of kinetic energy caused by the increase in flow rate. In this case, the dominant factor is the increase in flow losses due to the increasing flow rate, resulting in a rapid decrease in the head. This indicates that there exists an optimum operating flow rate, which is close to the rated flow condition of the multistage pump, between the minimum and maximum flow rates.
From Figure 7, it can be observed that the trend of the efficiency curve for these three low IGVF conditions is similar to that under pure water conditions. Efficiency increases with increasing flow rate and then gradually decreases after reaching the 1.0Q point. In addition, it is not difficult to see that the peak value of the efficiency–power curve decreases with the increase in the IGVF. At low flow rates, the slope of the efficiency curve shows an initial decrease followed by an increase. Specifically, the rate of efficiency increase at around 0.6Q becomes slower, followed by a faster increase at around 0.8Q under gas–liquid two-phase flow conditions. This may be attributed to the unstable accumulation of gas in localized positions within the impeller and the resulting changes in flow patterns in the passageways at low flow rates under the working state of a gas–liquid two-phase flow of a multistage pump. The concentrated gas in the impeller generates vortices, causing significant disturbances to the liquid flow. After reaching the rated flow rate, efficiency decreases with increasing IGVF, corresponding to the decrease in the head. However, the difference lies in the fact that, for IGVF conditions of 3% and 5%, the rate of efficiency decrease is lower in the range of 1.0–1.2Q, indicating an expansion of the high-efficiency range of the multistage pump. Beyond this range, a rapid decrease in efficiency similar to that observed under pure water conditions occurs. This suggests that higher IGVF values result in more significant obstacles in the transition process from mechanical energy to kinetic energy of the fluid due to the rotation of the impeller, leading to higher power consumption and a decrease in head and efficiency, thereby reducing the delivery capacity of the multistage pump.
In short, the external characteristic curve of the multistage centrifugal pump has a certain regularity with the change trend of the IGVF. The head rate performance curves of multistage centrifugal pumps with IGVFs of 1%, 3%, and 5% were analyzed. It was found that with the increase in the IGVF, the performance curve of the multistage pump decreased significantly, and the fluctuation was obvious, which indicated that the operating performance of the multistage pump was extremely sensitive to low-gas-content conditions. Therefore, the following discussion focuses on the two indexes of gas distribution and turbulent kinetic energy in the multistage pump and analyzes the specific law of its influence on the performance of the multistage pump under changes in low IGVFs.
4.2. Gas Phase Distribution
When pumping a medium containing gas, the decrease in head and efficiency becomes significant. This is due to the local concentration of gas in the pump, which blocks the flow passages and, in severe cases, can even result in gas locking of the impeller, causing irreversible damage to the pump. Therefore, it is very important to improve the ability of the pump to transport a gas-containing fluid, understand the distribution of the gas in the flow field, and find out the location of the gas accumulation. The following discussion focuses on three different IGVF conditions (1%, 3%, and 5%) to reveal the distribution pattern of gas in low-IGVF gas–liquid two-phase flows in multistage centrifugal pumps.
First of all, the discussion focuses on the proportion of gas in various parts and the relationship between changes. Gas volume and gas volume fraction are commonly used for quantitative analyses, in which:
where represents the local gas void fraction, and V represents the volume of the component. With the increase in the value of Φ, the more gas content in the component, the more serious the gas lock effect.
Under different IGVF conditions, the variations of Φ of the impeller, diffuser, and pump cavity in each stage are shown in Figure 8. From Figure 8(A1–A3), it can be observed that the gas volume fraction within the impeller decreases with increasing flow rate. During the operation of the multistage pump, the kinetic energy of the liquid flow plays a leading role because the density of the gas is far less than that of the liquid. In the case of a low flow rate, the fluid velocity is slow, resulting in low kinetic energy, making it difficult to remove all the gas. As the flow rate increases, the velocity of the fluid significantly rises, leading to an increase in kinetic energy, thus facilitating the removal of gas by the high-speed liquid flow. Additionally, with the increase in the number of stages, the proportion of gas volume in the impellers at all levels also shows a downward trend, and the magnitude of the decline also gradually becomes gentle. However, it can be observed from Figure 8(A1) that with an increase in IGVF, the trend of the gas volume fraction reduction is steeper for the first-stage impeller compared to the other two stages. The uniform gas–liquid mixed fluid at the inlet is affected by the first-stage rotating unit closest to the inlet, resulting in a more chaotic distribution of gas inside the first-stage impeller, and the gas volume fraction decreases more with the increase in the flow rate. With an increase in the number of stages, the kinetic energy and pressure rise due to the action of the first-stage boosting unit, resulting in an increased ability of the fluid to carry away gas, thus leading to a significant reduction in gas volume fraction for the subsequent two stages. Furthermore, it can be observed that fluctuations occur in the curves of the last two stages, indicating that with an increase in the number of stages, the randomness of the gas–liquid mixture at the inlet of each stage impeller significantly increases, resulting in fluctuations and even slight increases in the gas volume fraction within the last two stages.
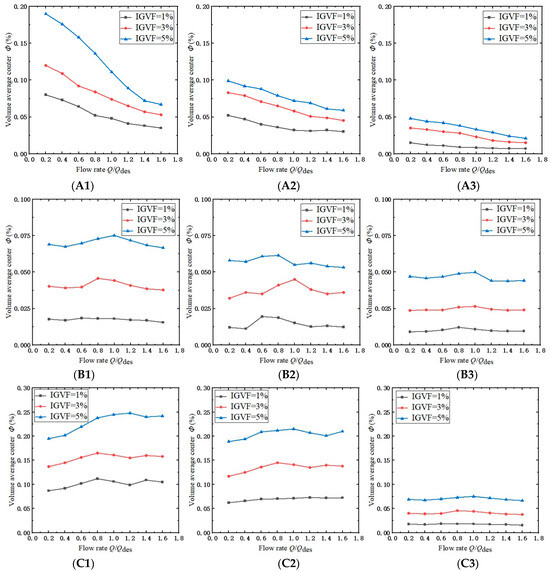
Figure 8.
Volume average of gas content of same stage in impellers, diffusers, and pump cavities under different IGVFs. (A1) in IMPELLER1. (A2) in IMPELLER 2. (A3) in IMPELLER 3. (B1) in DIFFUSER1. (B2) in DIFFUSER2. (B3) in DIFFUSER3. (C1) in CAVITY1. (C2) in CAVITY2. (C3) in CAVITY3.
As shown in Figure 8(B1–B3), under the three IGVF conditions, the curves of the gas volume fraction within each guide vane exhibit a relatively smooth behavior, with noticeable similarity and no significant fluctuations. The slight fluctuations occur near the rated flow rate condition, where the randomness of the gas–liquid mixture intensifies due to the combined effect of the kinetic energy obtained by the fluid through the impeller and the energy loss caused by the gas distribution, resulting in fluctuations in the gas volume fraction. Furthermore, it can be seen from Figure 8(B1–B3) that the gas volume fraction within the guide vanes is slightly higher than the corresponding IGVF conditions. Similar to the impellers, the gas volume fraction within each guide vane also shows a slight decrease with an increasing number of stages, but it does not fall below the IGVF condition.
As shown in Figure 8(C1–C3), the variation of the gas volume fraction in the pump chamber between the impeller and the guide vane is more prominent. With an increase in the number of stages, the gas volume fraction in the pump chamber decreases progressively. However, as depicted in Figure 8(C1,C2), there is a slight increase in the gas volume fraction in the first two stages and the pump chamber, followed by a decrease. Combining this with the gas distribution cloud chart, it is observed that gas accumulates near the axis in the pump chamber. This phenomenon occurs because the high-speed rotating impeller imparts kinetic energy to the fluid, and both the gas and liquid experience centrifugal forces. Since there are no blades inside the pump chamber and the mass of the gas is much smaller than that of the liquid, the centrifugal force acting on the gas is smaller, causing gas to concentrate in the region near the axis, resulting in accumulation and an increase in gas volume fraction in the first two stages. As the gas occupies the entire region near the axis in the pump chamber, an increased flow rate will displace a certain amount of gas, causing the accumulated gas near the axis to overflow and resulting in a decrease in the gas volume fraction in the pump chamber. However, in the third-stage pump chamber, due to the currently low IGVF and the acceleration of the flow velocity caused by the preceding rotating components, there is no significant accumulation of gas in the third-stage pump chamber at present.
Based on Figure 8, it can be observed that the volume fraction of gas within the impeller varies significantly with changes in flow rate, gas–liquid ratio, and number of stages. Figure 9 presents the gas volume histograms for each impeller stage at different IGVF values. From Figure 9, it is evident that the gas volume within the first-stage impeller is noticeably higher than the subsequent two stages. At low flow rates, the gas volume within the first-stage impeller can even exceed the combined gas volume of the latter stages. This indicates distinct variations in gas distribution across the rotating components of the multistage pump during the gas–liquid two-phase flow, necessitating further investigation into the specific location of gas distribution and its impact on the performance characteristics of the multistage pump.
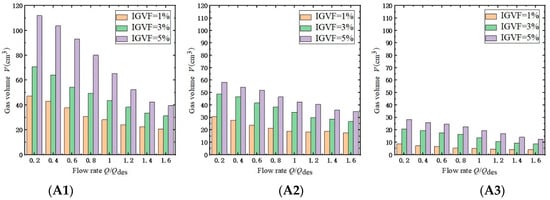
Figure 9.
Gas volume of same stage in impellers under different IGVFs. (A1) in IMPELLER1. (A2) in IMPELLER2. (A3) in IMPELLER3.
4.3. Turbulent Kinetic Energy Distribution
When discussing the energy dissipation in the fluid, the turbulent kinetic energy (TKE) is an important parameter that has to be mentioned to compare the flow loss. In the gas–liquid two-phase flow of multistage pumps, the distribution of the gas also significantly affects the distribution of the turbulent kinetic energy. In this study, we focus on the axial section of a multistage centrifugal pump to examine the relationship between gas volume distribution and turbulent kinetic energy distribution. Figure 10 depicts the contour maps of gas distribution and turbulent kinetic energy distribution for a gas volume fraction (IGVF) of 3% and a flow rate of 0.6Q.
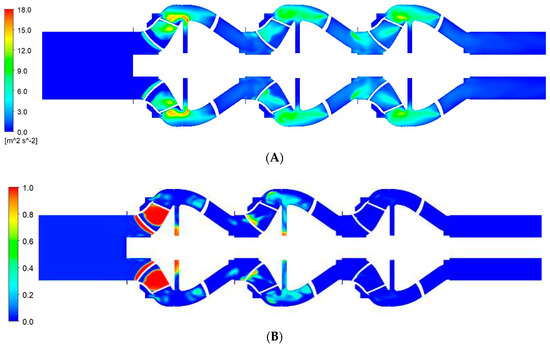
Figure 10.
Turbulent kinetic energy and gas distribution nephogram in middle section. (A) Turbulent kinetic energy distribution nephogram. (B) Gas distribution nephogram.
The turbulent kinetic energy distribution cloud map reveals that turbulent energy is primarily distributed within the stages of impellers and pump chambers, with the maximum value of turbulent energy observed at the exit of the first-stage impeller. Examining the gas distribution cloud map, it can be observed that there is a significant amount of gas distribution within the first two stages of the impellers. Due to friction and turbulent effects between the gas and liquid, there is an energy loss, resulting in higher turbulent energy at the exit. There is also a large turbulent kinetic energy distribution at the outlet of the third-stage impeller, but the main distribution position appears at the inlet of the third-stage impeller and the position near the hub near the middle of the impeller. At the same time, this level of gas distribution is lower. This is due to the fluid gaining significant kinetic energy through the rotation of the first two stages of impellers. The high-speed movement of the fluid combined with the rotation of the third-stage impeller imposes constraints, promoting the continuous growth and enhancement of turbulence, leading to an increase in turbulent energy. It is worth noting that the gas distribution near the axis in the pump chamber, as indicated by the gas distribution cloud map, does not significantly affect the turbulent energy. In conclusion, the cloud maps provide evidence that the locations with higher turbulent flow energy within the impellers correspond to the areas with greater gas distribution. They demonstrate the concentration of gas within the impeller channels and illustrate the underlying factors contributing to the generation of higher turbulent energy.
In order to further discover the relationship between the gas volume distribution and the turbulent kinetic energy intensity, the volume average of the turbulent kinetic energy of each part of each stage under different ICVFs is quantitatively analyzed, in which:
where k represents the turbulent kinetic energy, and V represents the volume of different parts. The performance of the pump is inversely proportional to the K value. Excessive K values lead to increased energy dissipation in the multistage pump.
Figure 11 shows the variation of the turbulent kinetic energy volume average values for each stage of the multistage pump at different IGVF levels with respect to flow rate. In the impeller, the overall trend of the turbulent kinetic energy volume average values is an initial decrease followed by an increase as the flow rate increases. At the operating point of 1.2Q, it corresponds to the minimum value of K. Prior to this, significant fluctuations occur in the turbulent kinetic energy volume average values for each stage when the IGVF is at 3% and 5%. Combined with the decreasing trend of gas volume average values inside the impeller as shown in Figure 8(A1–A3), it can be concluded that the energy loss and gas content of the multistage pump under gas–liquid flow conditions are closely related. A higher gas content leads to a greater energy loss, and the energy loss fluctuates significantly depending on the gas distribution. At 1.2Q, the minimum point in the turbulent kinetic energy is observed, consistent with the results discussed in Section 4.1. The high-efficiency region of the multistage pump under gas–liquid flow conditions expands to some extent. Beyond the flow rate corresponding to the minimum average value of the turbulent kinetic energy, each stage of the impeller exhibits similar increasing curves at different gas content levels. This is because in the subsequent high-flow operating conditions, the main factor influencing the turbulent kinetic energy variation shifts from the gas-phase distribution to turbulent effects, resulting in performance degradation. The operating conditions in which the peak values of turbulent kinetic energy occur in the first two stages are mainly concentrated at 0.6Q or 0.8Q, while in the third stage, these fluctuations consistently appear at 1.0Q, with higher peak values as IGVF increases.
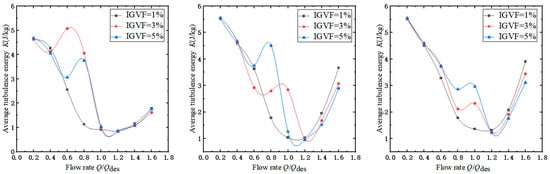
Figure 11.
Volume average of turbulent kinetic energy of same stage in impellers under different IGVFs.
4.4. Distribution of Vortices in the First-Stage Impeller
The analysis above proves that the gas distribution within the impellers affects the turbulent energy distribution, leading to a decrease in performance of the multistage centrifugal pump under low-gas-content conditions. This effect is particularly pronounced at low flow rates, especially within the first-stage impeller. Additionally, the presence of vortices within the rotating components also influences the pump’s operational performance. The sequential arrangement of the six flow passages within the impeller is shown in Figure 12.
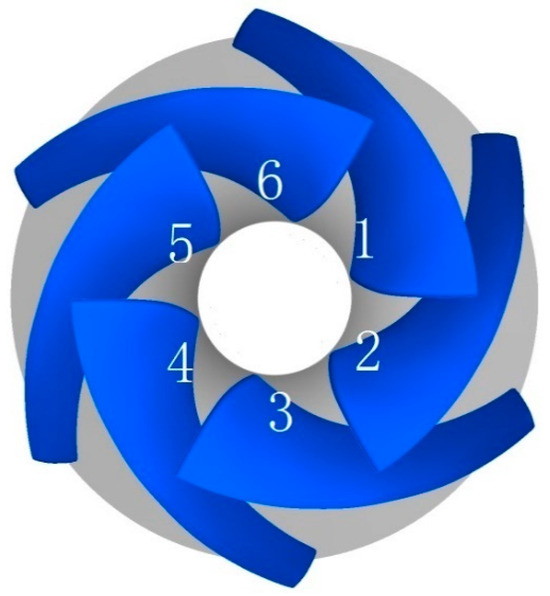
Figure 12.
Order of impeller flow channels.
The following analysis focuses on the operating conditions with an IGVF of 3% and flow rates of 0.6Q and 0.8Q. Figure 13 illustrates the gas distribution at different blade heights within the first-stage impeller, the turbulent energy distribution of the liquid phase, and the streamline distribution for these two flow rate conditions. In Figure 13A, at the 0.6Q operating condition, gas distribution is primarily concentrated in the middle-to-rear portion of the suction side of the impeller blades. Though gas is distributed in all flow channels, the distribution is not axisymmetric. As the flow rate increases, as shown in Figure 13B, this asymmetry becomes more pronounced. Gas appears only in a small amount near the front end of the suction side close to the back cover plate in the sixth flow channel. A higher gas distribution is observed at the exits of the second, third, and fourth flow channels. Additionally, it is worth noting that at the 0.6Q operating condition, the peak values of turbulent kinetic energy occur at the exits near the back cover plate of specific flow channels. When the flow rate increases gradually, there is a significant distribution of turbulent kinetic energy at the rear edge of the suction side in the fifth flow channel. This location also exhibits a high concentration of gas distribution, as observed in the corresponding streamline map, where dense streamlines appear. This directly indicates that gas accumulation varies with the flow rate, leading to increased instability and significant impact on the streamline distribution of water, even generating vortices. The vortex cores resulting from the gas accumulation are located in the regions with the highest gas volume fraction, and secondary vortices even appear in the second and third flow channels. The existence of the vortex will form a disturbance in the fluid, resulting in additional pressure loss. At the same time, the turbulent kinetic energy increases, which increases the resistance loss and power consumption of the pump and reduces the operating performance of the multistage pump.
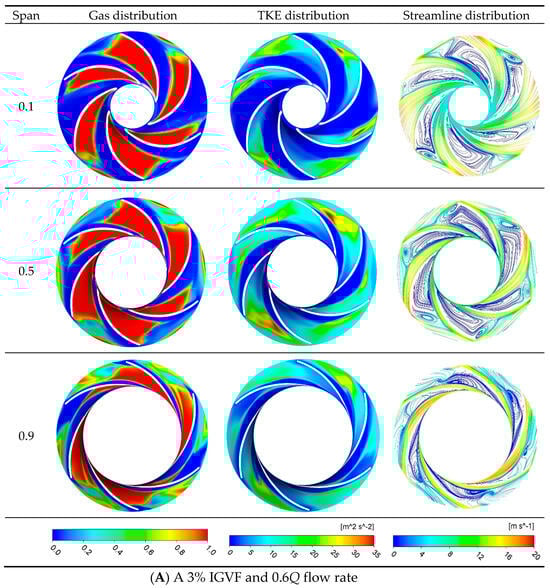
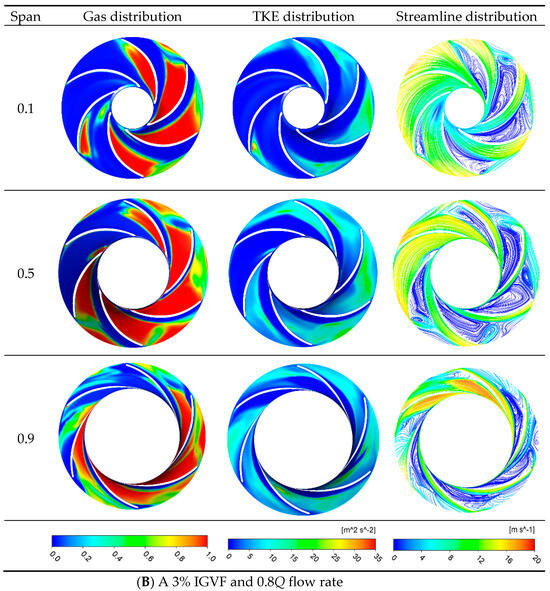
Figure 13.
Gas distribution nephogram, turbulent kinetic energy distribution nephogram, and streamline distribution nephogram at different blade heights of the first-stage impeller.
5. Conclusions
The multistage pump experiences a decrease in the head and efficiency to varying degrees when operating under gas–liquid two-phase conditions due to the excessive accumulation of gas in the impeller, leading to gas blockage in the flow passages. This study focuses on the operation of the multistage pump in transporting gas media, with a detailed investigation of the gas distribution characteristics and energy characteristics.
- (1)
- By analyzing the performance curves under the different IGVF conditions of 1%, 3%, and 5%, it is observed that the performance of the multistage pump decreases as the IGVF increases. However, under IGVF conditions of 3% and 5%, the high-efficiency region of the multistage pump expands to a certain range. This suggests that under certain gas contents, increasing the flow rate can maintain the high-efficiency operation of the multistage pump.
- (2)
- With the increase in the IGVF, the gas aggregation degree of each component increases. However, the average gas volume in the fluid domain is inversely proportional to the flow rate, and the content of the gas decreases with the increase in the series. Furthermore, due to the centrifugal effect of the rotary unit, gases and liquids experience different centrifugal forces. Gases experience a relatively smaller centrifugal force, resulting in the occurrence of aggregation near the rotating axis within the pump chamber.
- (3)
- Under low flow conditions, the asymmetric distribution of the gas within the impeller occurs in the mid-to-rear sections of the suction side. Additionally, there is a strong correlation between turbulent energy and the location of gas aggregation, exhibiting significant fluctuations. This proves that the energy loss of multistage pump under gas-containing working conditions is indeed related to the IGVF. In subsequent high-flow conditions, the main factor affecting the variation of turbulence intensity shifts from gas distribution to the impact of turbulence. This leads to an increase in turbulence intensity and a decrease in the performance of multistage pumps.
- (4)
- In the first-stage impeller, the gas distribution significantly affects the variation of turbulent kinetic energy. The gas accumulates in regions where streamlines are relatively dense, indicating the presence of vortices at these locations. As the asymmetric gas distribution becomes more pronounced in the flow passage of the impeller, the regions of a dense streamline distribution increase, and in some cases, secondary vortices occur in particular flow passages, severely affecting the gas–liquid two-phase operation performance of the multistage pump.
In this paper, the relationship between turbulent kinetic energy and the gas phase in a multistage pump is obtained by comparing the influence of gas distribution on turbulent kinetic energy distribution. Moreover, the main differences between the stages are discussed, and the effect of gas distribution on energy loss is provided for the subsequent multistage pump in the study of gas–liquid two-phase flows. This research can provide some help for the subsequent realization of better energy saving effects in the gas–liquid two-phase flow of multistage pumps, reduce energy loss, and contribute to the sustainable development of human beings.
Author Contributions
X.W., analysis, writing, and revision; Y.Y., methodology and revision; W.S., analysis and revision; S.W., validation and revision; Y.J., data analysis and revision. All authors have read and agreed to the published version of the manuscript.
Funding
This research was funded by the National Key Research and Development Project of China (No. 2019YFB 2005300), National High-Tech Ship Scientific Research Project of China (No. MIIT [2019] 360), National Natural Science Foundation of China (No. 51979138), National Natural Science Foundation of China (No. 273746), National Natural Science Foundation of China (No. 51979240), Jiangsu Natural Science Research Project (No. 19KJB470029), China Postdoctoral Science Foundation (No. 273746), and Natural Science Foundation of Jiangsu Province (No. BK20220609), Project funded by China Postdoctoral Science Foundation (No. 2022TQ0127), Open Research Subject of Key Laboratory of Fluid Machinery and Engineering (Xihua University) of China (No. LTDL-2022001).
Data Availability Statement
The raw data supporting the conclusions of this article will be made available by the authors, without undue reservation.
Conflicts of Interest
The authors declare no conflict of interest.
References
- Zhou, D.; Sachdeva, R. Simple model of electric submersible pump in gassy well. J. Pet. Sci. Eng. 2010, 70, 204–213. [Google Scholar] [CrossRef]
- Castellanos, M.B.; Serpa, A.L.; Biazussi, J.L.; Verde, W.M.; Sassim, N.D.S.D.A. Fault identification using a chain of decision trees in an electrical submersible pump operating in a liquid-gas flow. J. Pet. Sci. Eng. 2020, 184, 106490. [Google Scholar] [CrossRef]
- Zhang, W.; Zhu, B.; Yu, Z. Characteristics of bubble motion and distribution in a multiphase rotodynamic pump. J. Pet. Sci. Eng. 2020, 193, 107435. [Google Scholar] [CrossRef]
- Nimwegen, A.; Portela, L.; Henkes, R. The effect of surfactants on air–water annular and churn flow in vertical pipes. Part 1: Morphology of the air–water interface. Int. J. Multiph. Flow 2015, 71, 133–145. [Google Scholar] [CrossRef]
- Xiaoping, J.; Li, W.; Ling, Z.; Wei, L.; Chuan, W. Transient response analysis of cantilever multistage centrifugal pump based on multi-source excitation. J. Low Freq. Noise Vib. Act. Control 2019, 39, 146134841987231. [Google Scholar] [CrossRef]
- Zhang, M.; Jiang, Z.; Feng, K. Research on variational mode decomposition in rolling bearings fault diagnosis of the multistage centrifugal pump. Mech. Syst. Signal Process. 2017, 93, 460–493. [Google Scholar] [CrossRef]
- Sedlar, M.; Kratky, T.; Zima, P. Numerical Analysis of Unsteady Cavitating Flow around Balancing Drum of Multistage Pump. Int. J. Fluid Mach. Syst. 2016, 9, 119–128. [Google Scholar] [CrossRef]
- Verde, W.M.; Biazussi, J.; Porcel, C.E.; Estevam, V.; Tavares, A.; Neto, S.J.A.; Rocha, P.S.d.M.; Bannwart, A.C. Experimental investigation of pressure drop in failed Electrical Submersible Pump (ESP) under liquid single-phase and gas-liquid two-phase flow. J. Pet. Sci. Eng. 2020, 198, 108127. [Google Scholar] [CrossRef]
- Pirouzpanah, S.; Gudigopuram, S.R.; Morrison, G.L. Two-phase flow characterization in a split vane impeller Electrical Submersible Pump. J. Pet. Sci. Eng. 2017, 148, 82–93. [Google Scholar] [CrossRef]
- Matsushita, N.; Watanabe, S.; Okuma, K.; Hasui, T.; Furukawa, A. Similarity Law of Air-Water Two-Phase Flow Performance of Centrifugal Pump. In Proceedings of the ASME/JSME 2007 5th Joint Fluids Engineering Conference, San Diego, CA, USA, 30 July–2 August 2007. [Google Scholar] [CrossRef]
- Barrios, L.; Prado, M.G. Modeling Two Phase Flow Inside an Electrical Submersible Pump Stage. In Proceedings of the ASME 2009 28th International Conference on Ocean, Offshore and Arctic Engineering, Honolulu, HI, USA, 31 May–5 June 2009. [Google Scholar] [CrossRef]
- Zhang, W.; Yu, Z.; Li, Y.; Yang, J.; Ye, Q. Numerical analysis of pressure fluctuation in a multiphase rotodynamic pump with air–water two-phase flow. Oil Gas Sci. Technol.–Rev. IFP Energies Nouv. 2019, 74, 18. [Google Scholar] [CrossRef]
- Shi, G.; Wang, S.; Xiao, Y.; Liu, Z.; Li, H.; Liu, X. Effect of cavitation on energy conversion characteristics of a multiphase pump. Renew. Energy 2021, 177, 1308–1320. [Google Scholar] [CrossRef]
- Si, Q.; Cui, Q.; Zhang, K.; Yuan, J.; Bois, G. Investigation on centrifugal pump performance degradation under air-water inlet two-phase flow conditions. La Houille Blanche 2018, 104, 41–48. [Google Scholar] [CrossRef]
- Zhu, J.; Zhu, H.; Zhang, J.; Zhang, H.-Q. A numerical study on flow patterns inside an electrical submersible pump (ESP) and comparison with visualization experiments. J. Pet. Sci. Eng. 2019, 173, 339–350. [Google Scholar] [CrossRef]
- Poullikkas, A. Two phase flow performance of nuclear reactor cooling pumps. Prog. Nucl. Energy 2000, 36, 123–130. [Google Scholar] [CrossRef]
- Shi, Y.; Zhu, H. Proposal of a stage-by-stage design method and its application on a multi-stage multiphase pump based on numerical simulations. Adv. Mech. Eng. 2021, 13, 538–546. [Google Scholar] [CrossRef]
- Zhang, W.; Xie, X.; Zhu, B.; Ma, Z. Analysis of phase interaction and gas holdup in a multistage multiphase rotodynamic pump based on a modified Euler two-fluid model. Renew. Energy 2021, 164, 1496–1507. [Google Scholar] [CrossRef]
- Wang, B.; Zhang, H.; Deng, F.; Wang, C.; Si, Q. Effect of Short Blade Circumferential Position Arrangement on Gas-Liquid Two-Phase Flow Performance of Centrifugal Pump. Processes 2020, 8, 1317. [Google Scholar] [CrossRef]
- Zhang, H.; Yuan, S.; Deng, F.; Liao, M.; Chen, M.; Si, Q. Characteristics of gas-liquid two-phase flow in centrifugal pump based on dimensionless method. J. Drain. Irrig. Mach. Eng. 2021, 39, 451e6. [Google Scholar]
- El-Emam, M.A.; Zhou, L.; Yasser, E.; Bai, L.; Shi, W. Computational Methods of Erosion Wear in Centrifugal Pump: A State-of-the-Art Review. Arch. Comput. Methods Eng. 2022, 29, 3789–3814. [Google Scholar] [CrossRef]
- Zhang, J.; Cai, S.; Zhu, H.; Yang, K. Numerical investigation of compessible flow in a three-stage helico-axial multiphase pump. Nongye Jixie Xuebao/Trans. Chin. Soc. Agric. Mach. 2014, 45, 89–95. [Google Scholar] [CrossRef]
- Huang, S.; Su, X.; Guo, J.; Yue, L. Unsteady numerical simulation for gas–liquid two-phase flow in self-priming process of centrifugal pump. Energy Convers. Manag. 2014, 85, 694–700. [Google Scholar] [CrossRef]
- Sina, Y.; Xingqi, L.; Jianjun, F.; Guojun, Z.; Lefu, Z.; Senlin, C. Numerical Simulation of a Gas-Liquid Centrifugal Pump under Different Inlet Gas Volume Fraction Conditions. Int. J. Fluid Mach. Syst. 2019, 12, 56–63. [Google Scholar] [CrossRef]
- Launder, B.E.; Spalding, D.B. Lectures in Mathematical Model of Turbulence; Academic Press: Cambridge, MA, USA, 1972. [Google Scholar]
Disclaimer/Publisher’s Note: The statements, opinions and data contained in all publications are solely those of the individual author(s) and contributor(s) and not of MDPI and/or the editor(s). MDPI and/or the editor(s) disclaim responsibility for any injury to people or property resulting from any ideas, methods, instructions or products referred to in the content. |
© 2023 by the authors. Licensee MDPI, Basel, Switzerland. This article is an open access article distributed under the terms and conditions of the Creative Commons Attribution (CC BY) license (https://creativecommons.org/licenses/by/4.0/).