


Predicting the Degree of Reaction of Supplementary Cementitious Materials in Hydrated Portland Cement


Abstract
:1. Introduction

| DOR Tests | Description | Limitations | References |
|---|---|---|---|
| Selective dissolution | The unreacted clinker phases, as well as the hydrates from the clinker and SCMs, are dissolved, leaving just the unreacted SCM as a residue for quantification |
| [25,26,27] |
| XRD (Rietveld-PONKCS) | Quantification of amorphous and crystalline phases using diffraction data |
| [28,29] |
| SEM-BSE | Determination of element composition by forming a relation between image brightness and atomic number |
| [25,30,31] |
| NMR | Determination of composition, local structure ordering, and bonding from resonance frequencies that are determined by the gyromagnetic ratio of the nucleus, the magnetic shielding interaction and the quadrupolar interaction, peak multiplicities that are generated by the scalar couplings to neighboring nuclei, and peak intensities. |
| [7,27,32,33] |
| Chapelle’s test | Quantification of consumed portlandite from (Ca(OH)2) reaction with pozzolan |
| [7,34,35,36] |
| Frattini test | Chemical titration to quantify the amounts of dissolved Ca2+ and OH− in a cement and pozzolan solution. |
| [7,36,37,38] |
| Saturated lime method | Similar to the Frattini test but a saturated lime solution is mixed with a pozzolan to determine amounts of dissolved Ca2+ and OH− |
| [37,39] |
| Strength activity index | Relation derived from mortar compressive strength containing cement and pozzolan |
| [7,37,39] |
| Bulk resistivity index test | Relation derived from mortar bulk resistivity containing cement and pozzolan |
| [40] |
| R3 test (heat release and bound water methods) | A paste prepared from the major components (SCM and portlandite) with calcite and sulfate is investigated for released heat until seven days, and bound water is assessed for 7-day cured samples that are heated at 350 °C for 2 h |
| [40,41] |
| Modified R3 test | The heat release of a KOH solution containing calcium hydroxide and SCM is measured until ten days, and additionally, TGA is performed on the resulting blends after 240 h |
| [41] |
2. Methods
2.1. Data Collection and Machine Learning Algorithm
2.2. Thermodynamic Modeling
3. Results
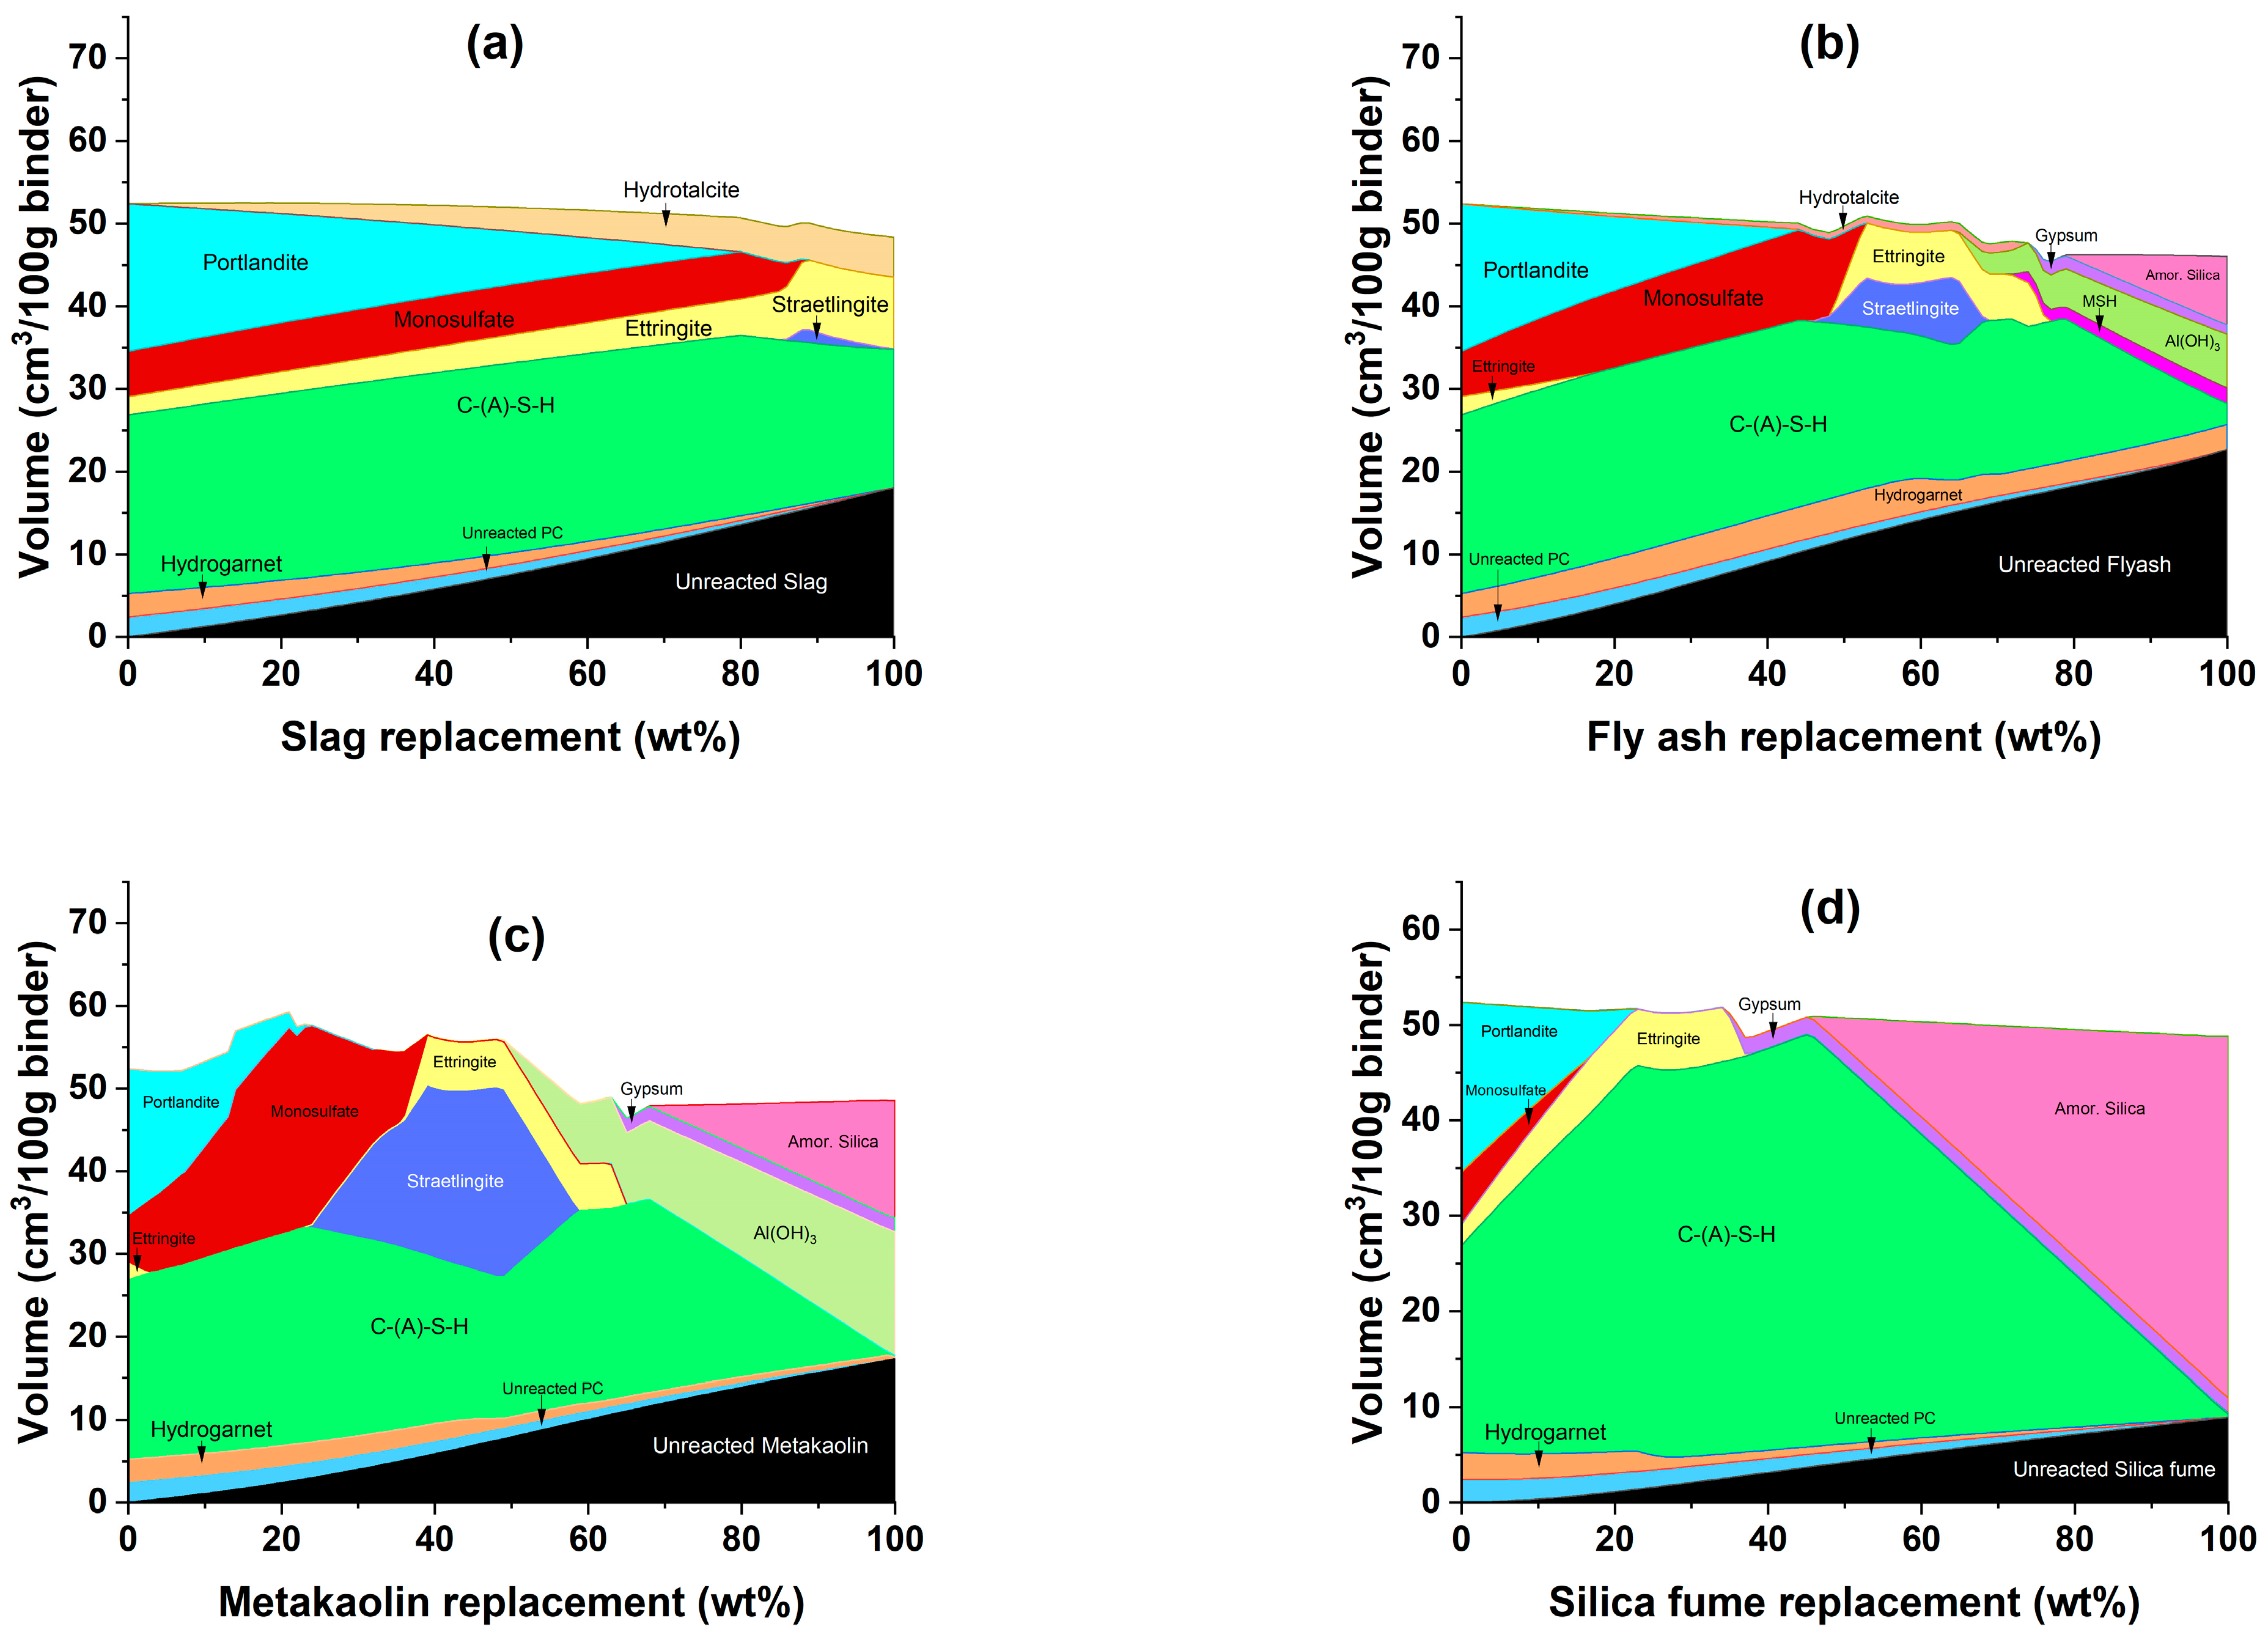
4. Predicted Phase Assemblages
4.1. PC–Slag
4.2. PC–Fly Ash
4.3. PC–Metakaolin
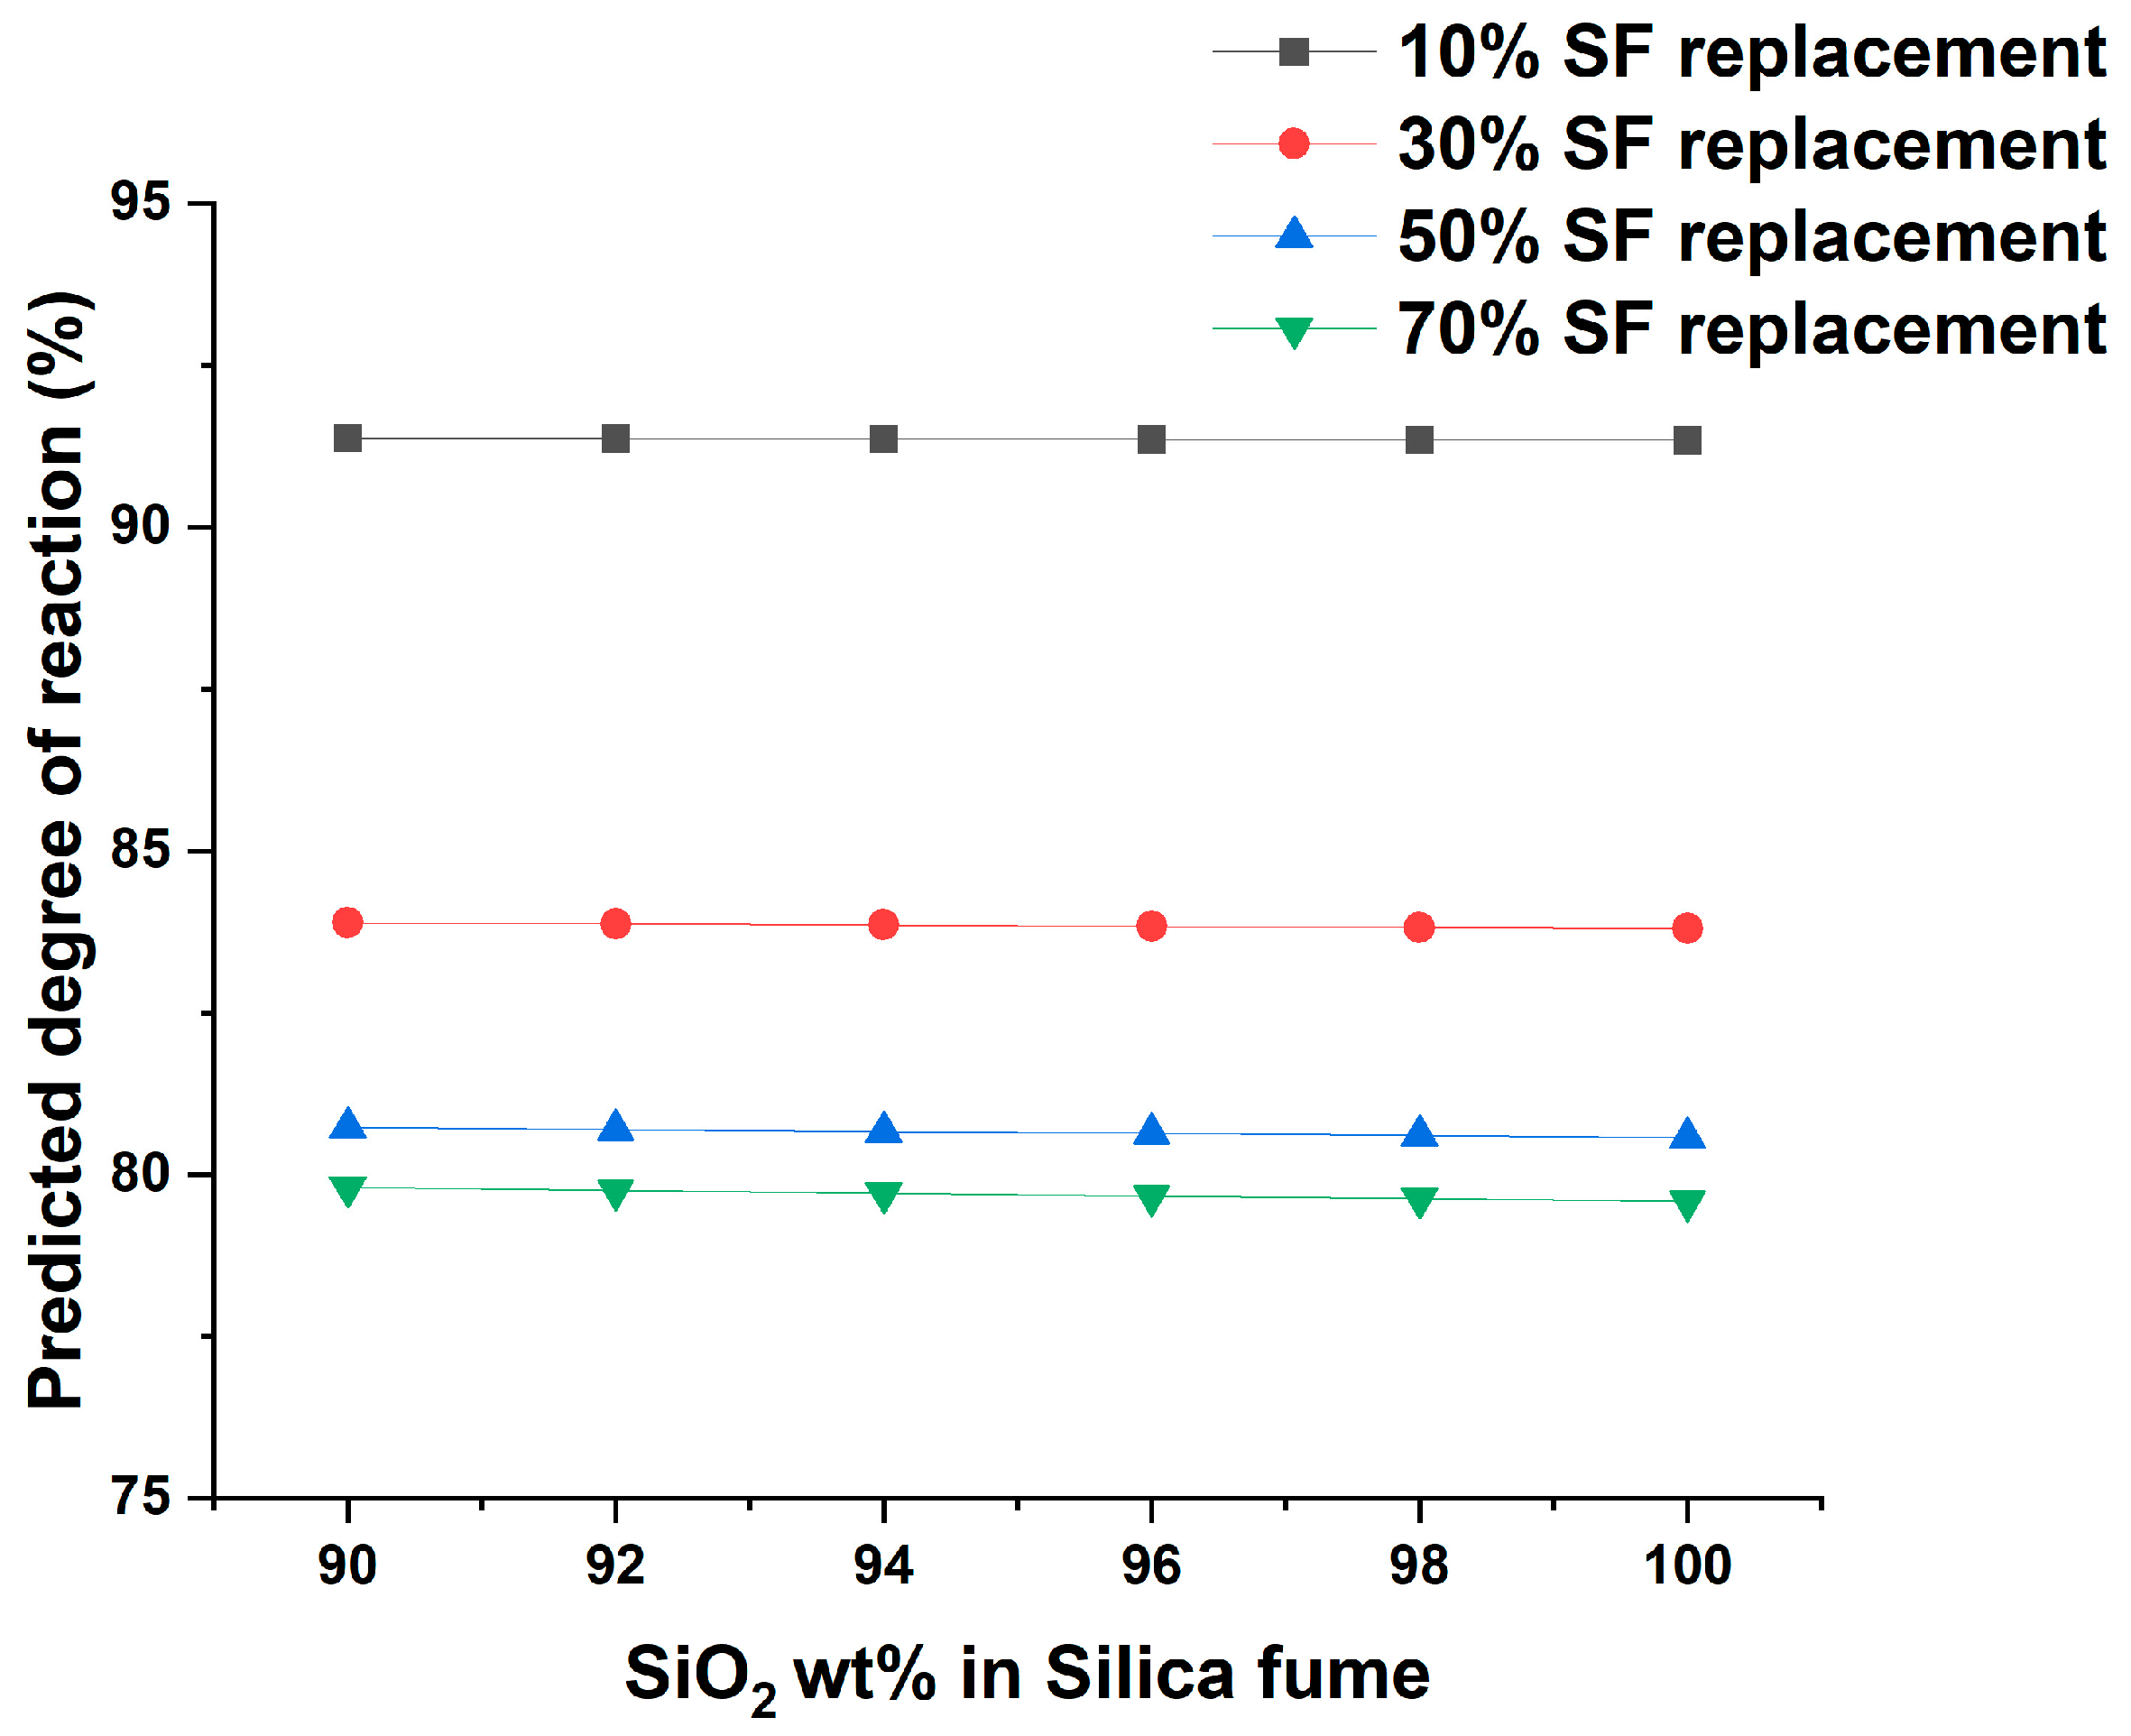
4.4. PC–Silica Fume
5. Conclusions
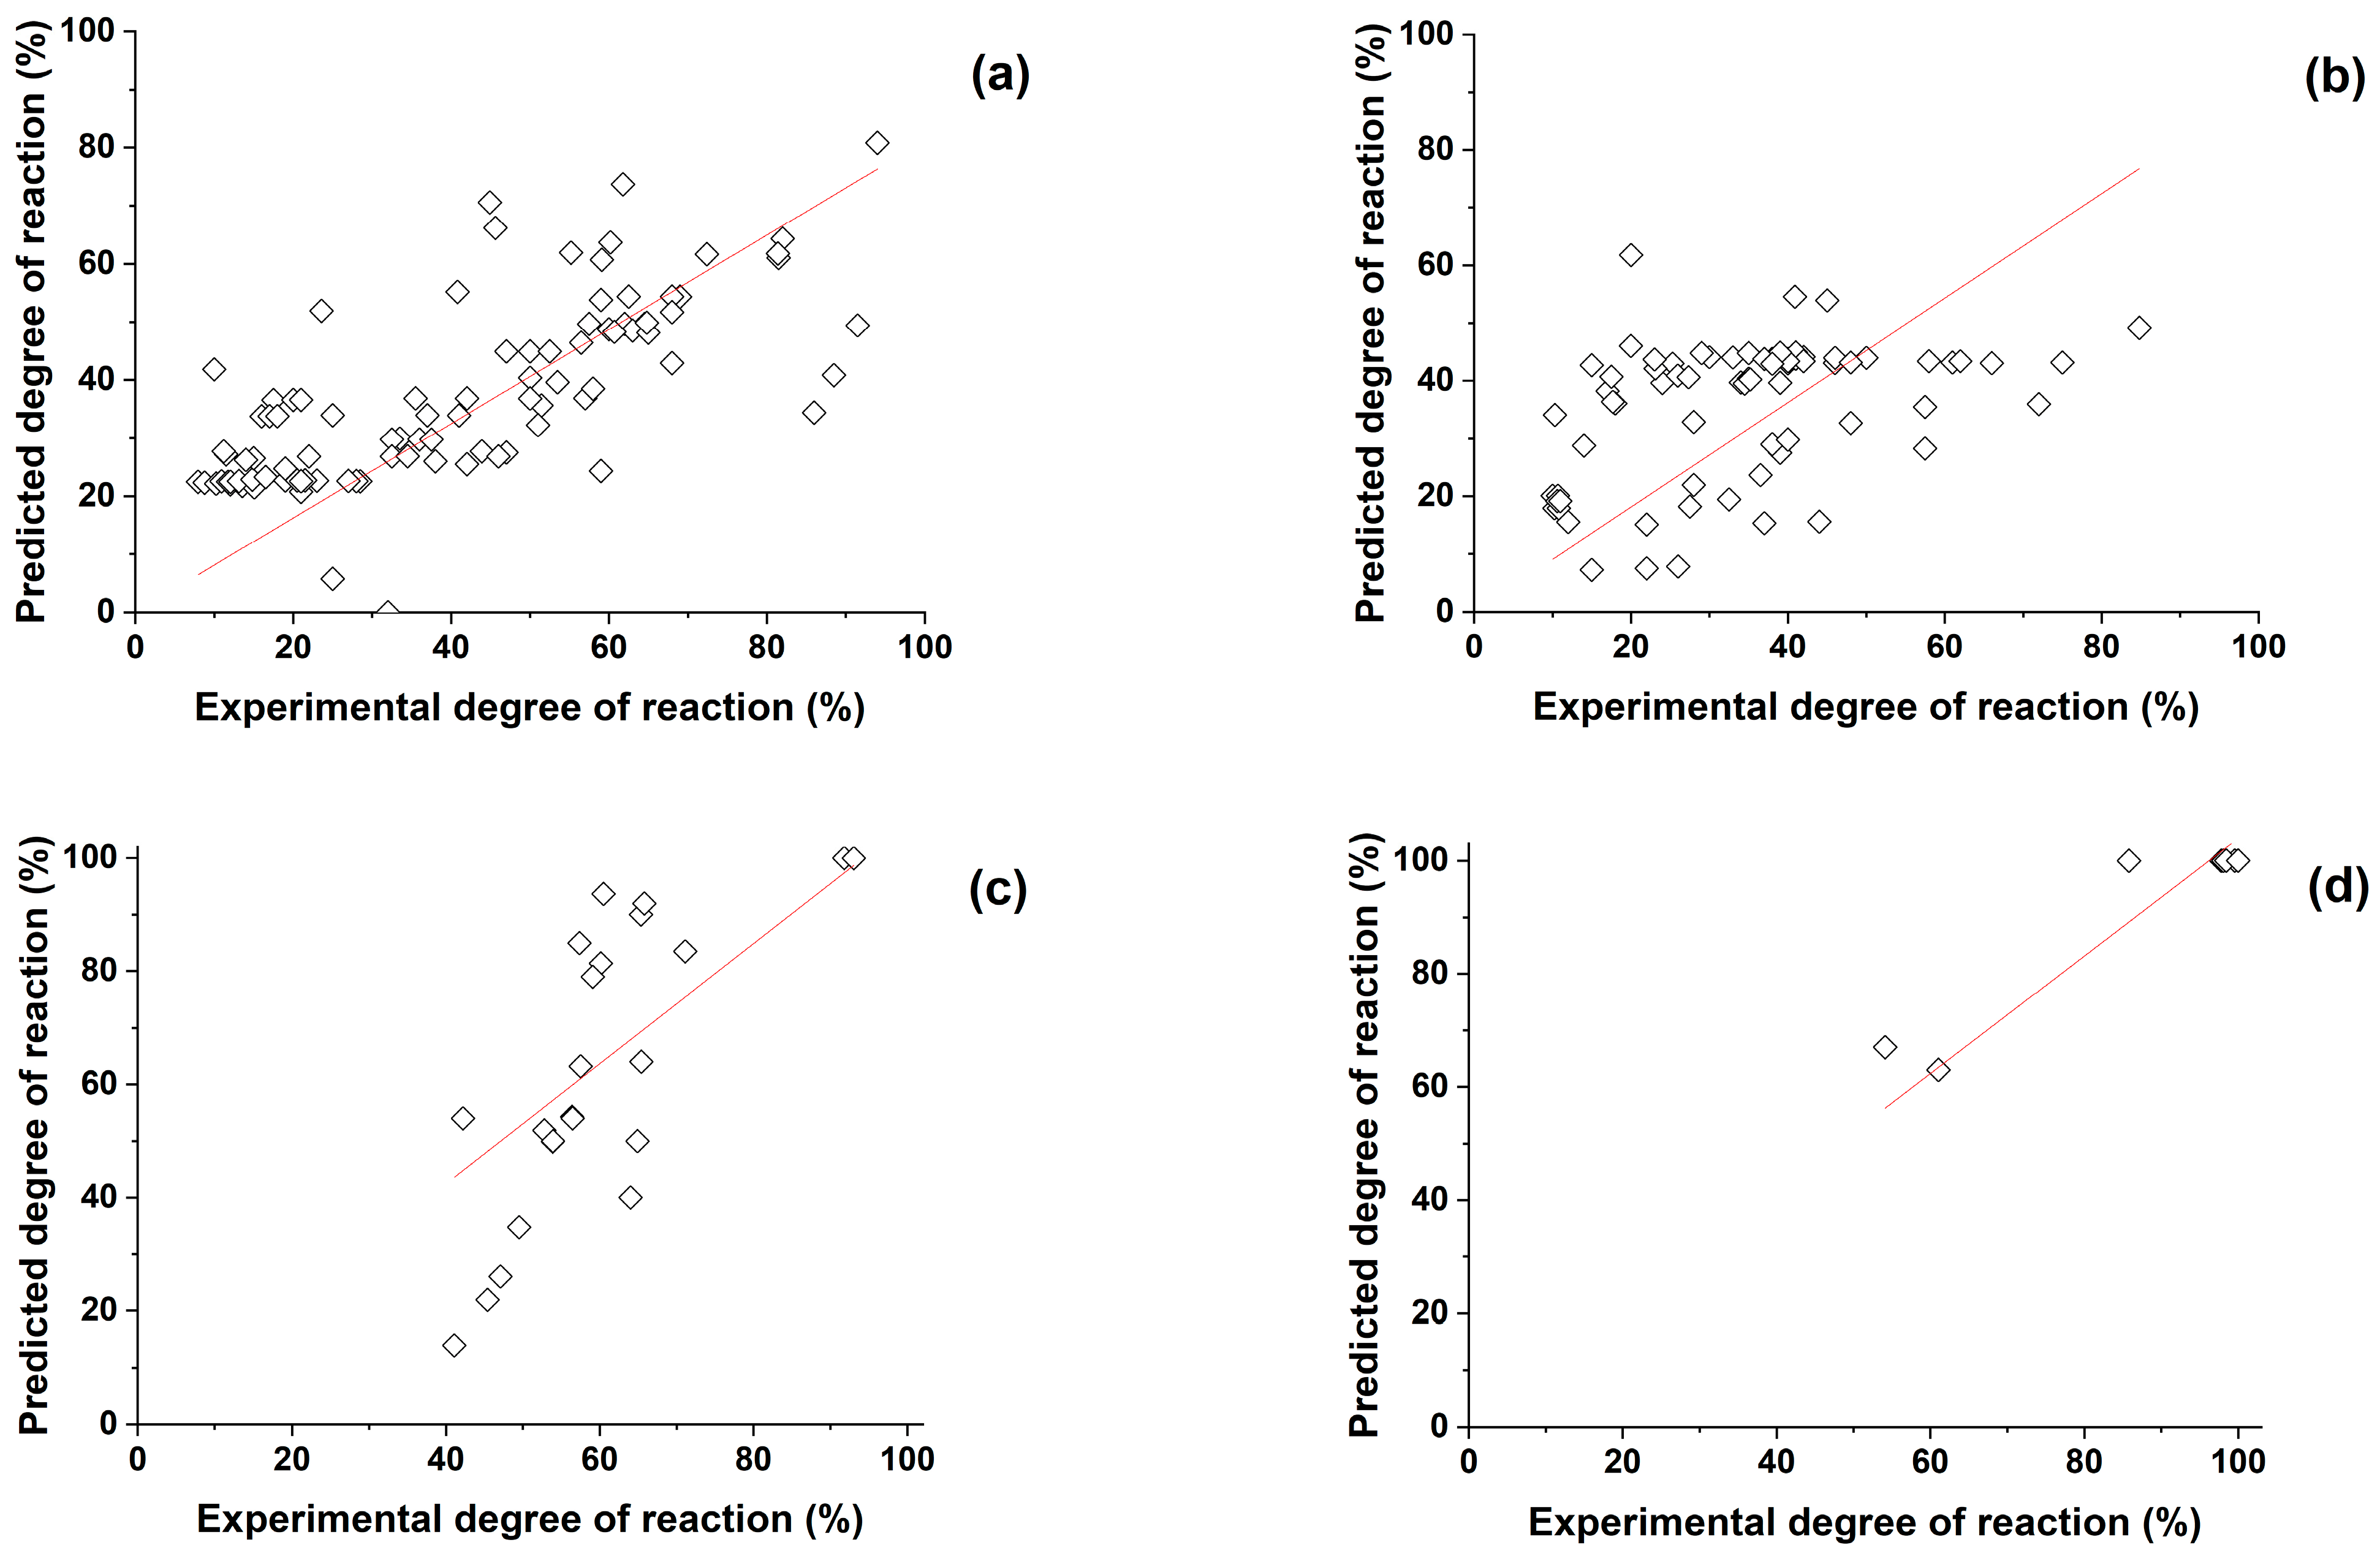
- The model exhibited satisfactory performance for predicting the DOR of SCMs, achieving an average accuracy of 89% and a minimum accuracy of 83%. These findings establish a solid foundation for predicting DOR and analyzing diverse DOR-related relationships in SCMs, encompassing different known or unknown properties, particularly in the case of new materials.
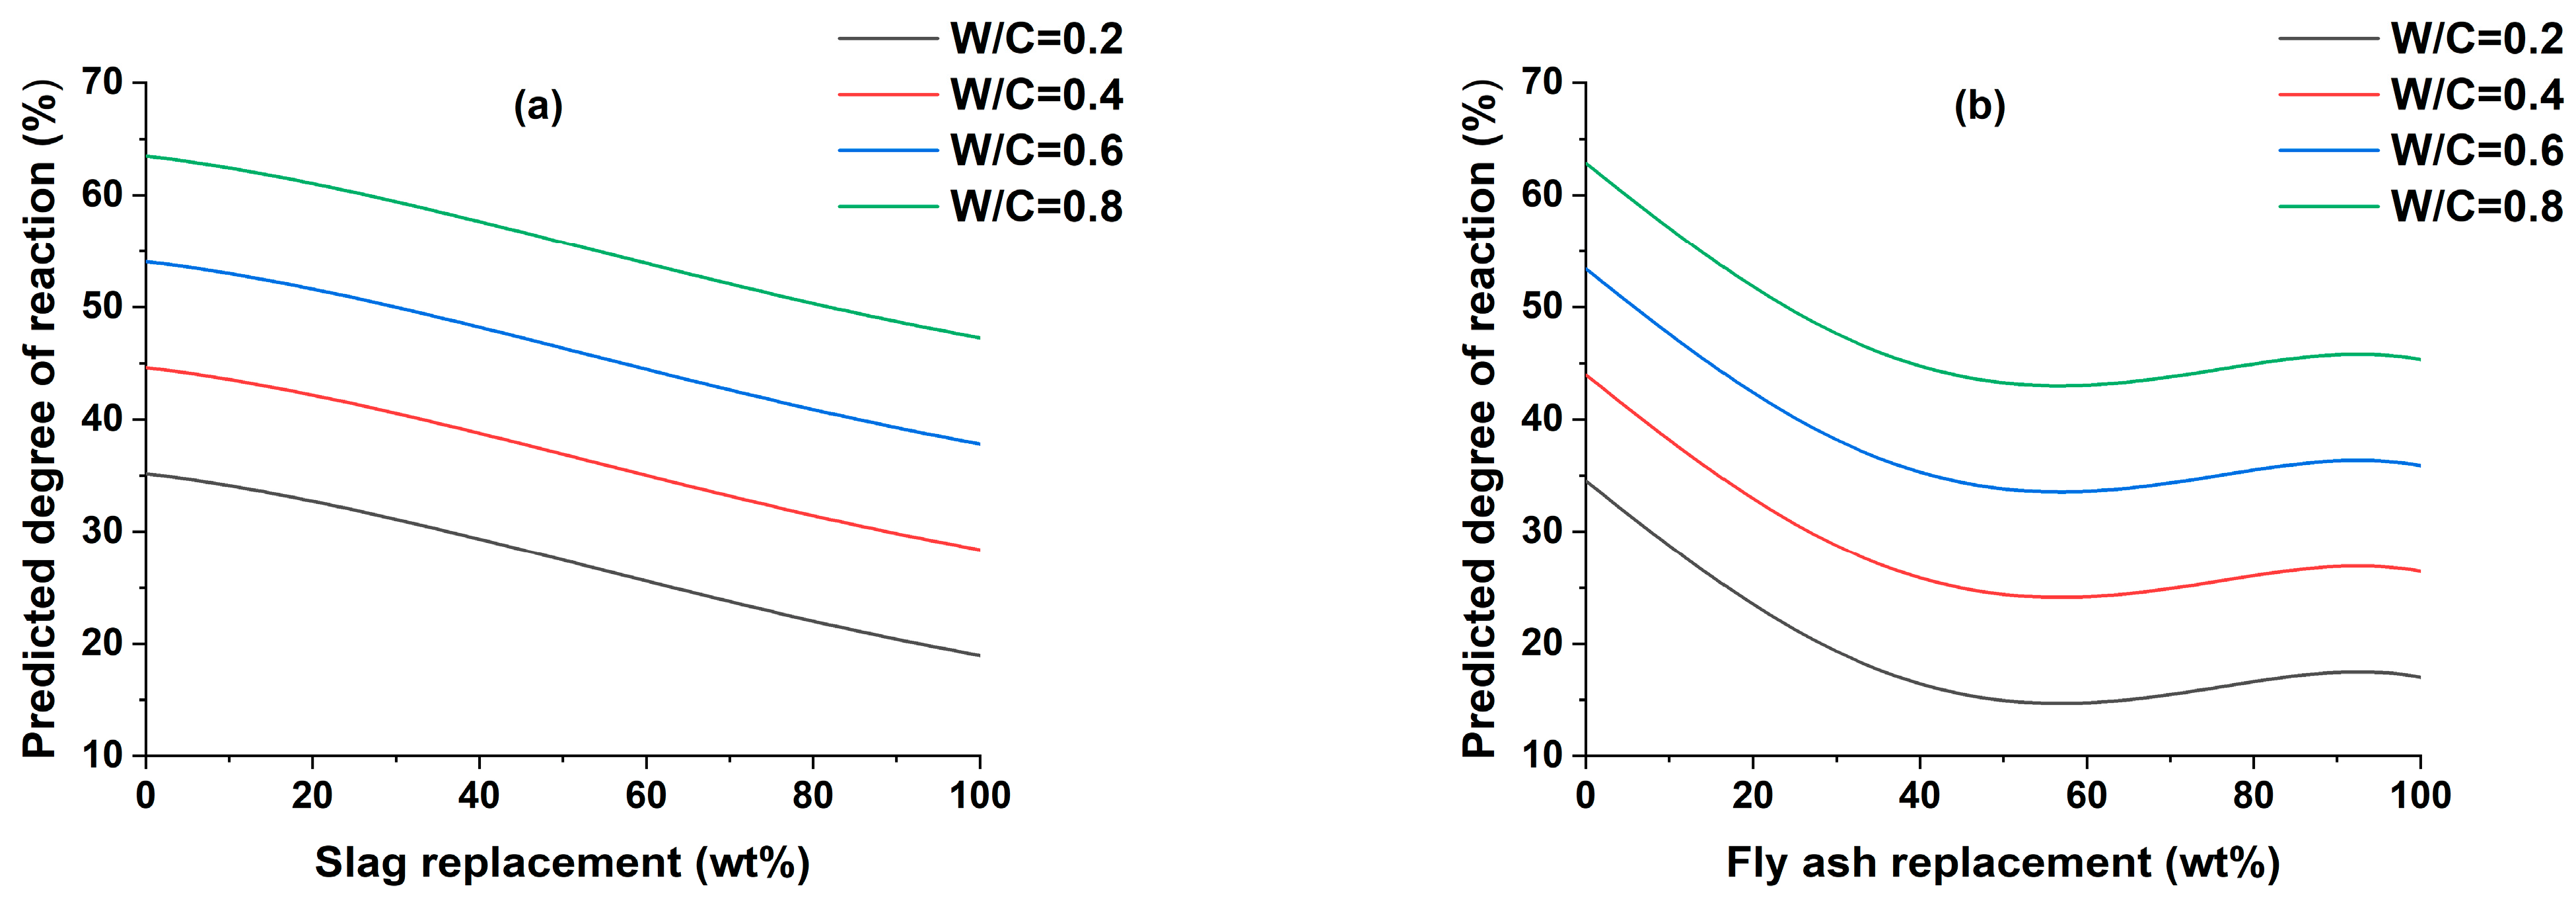
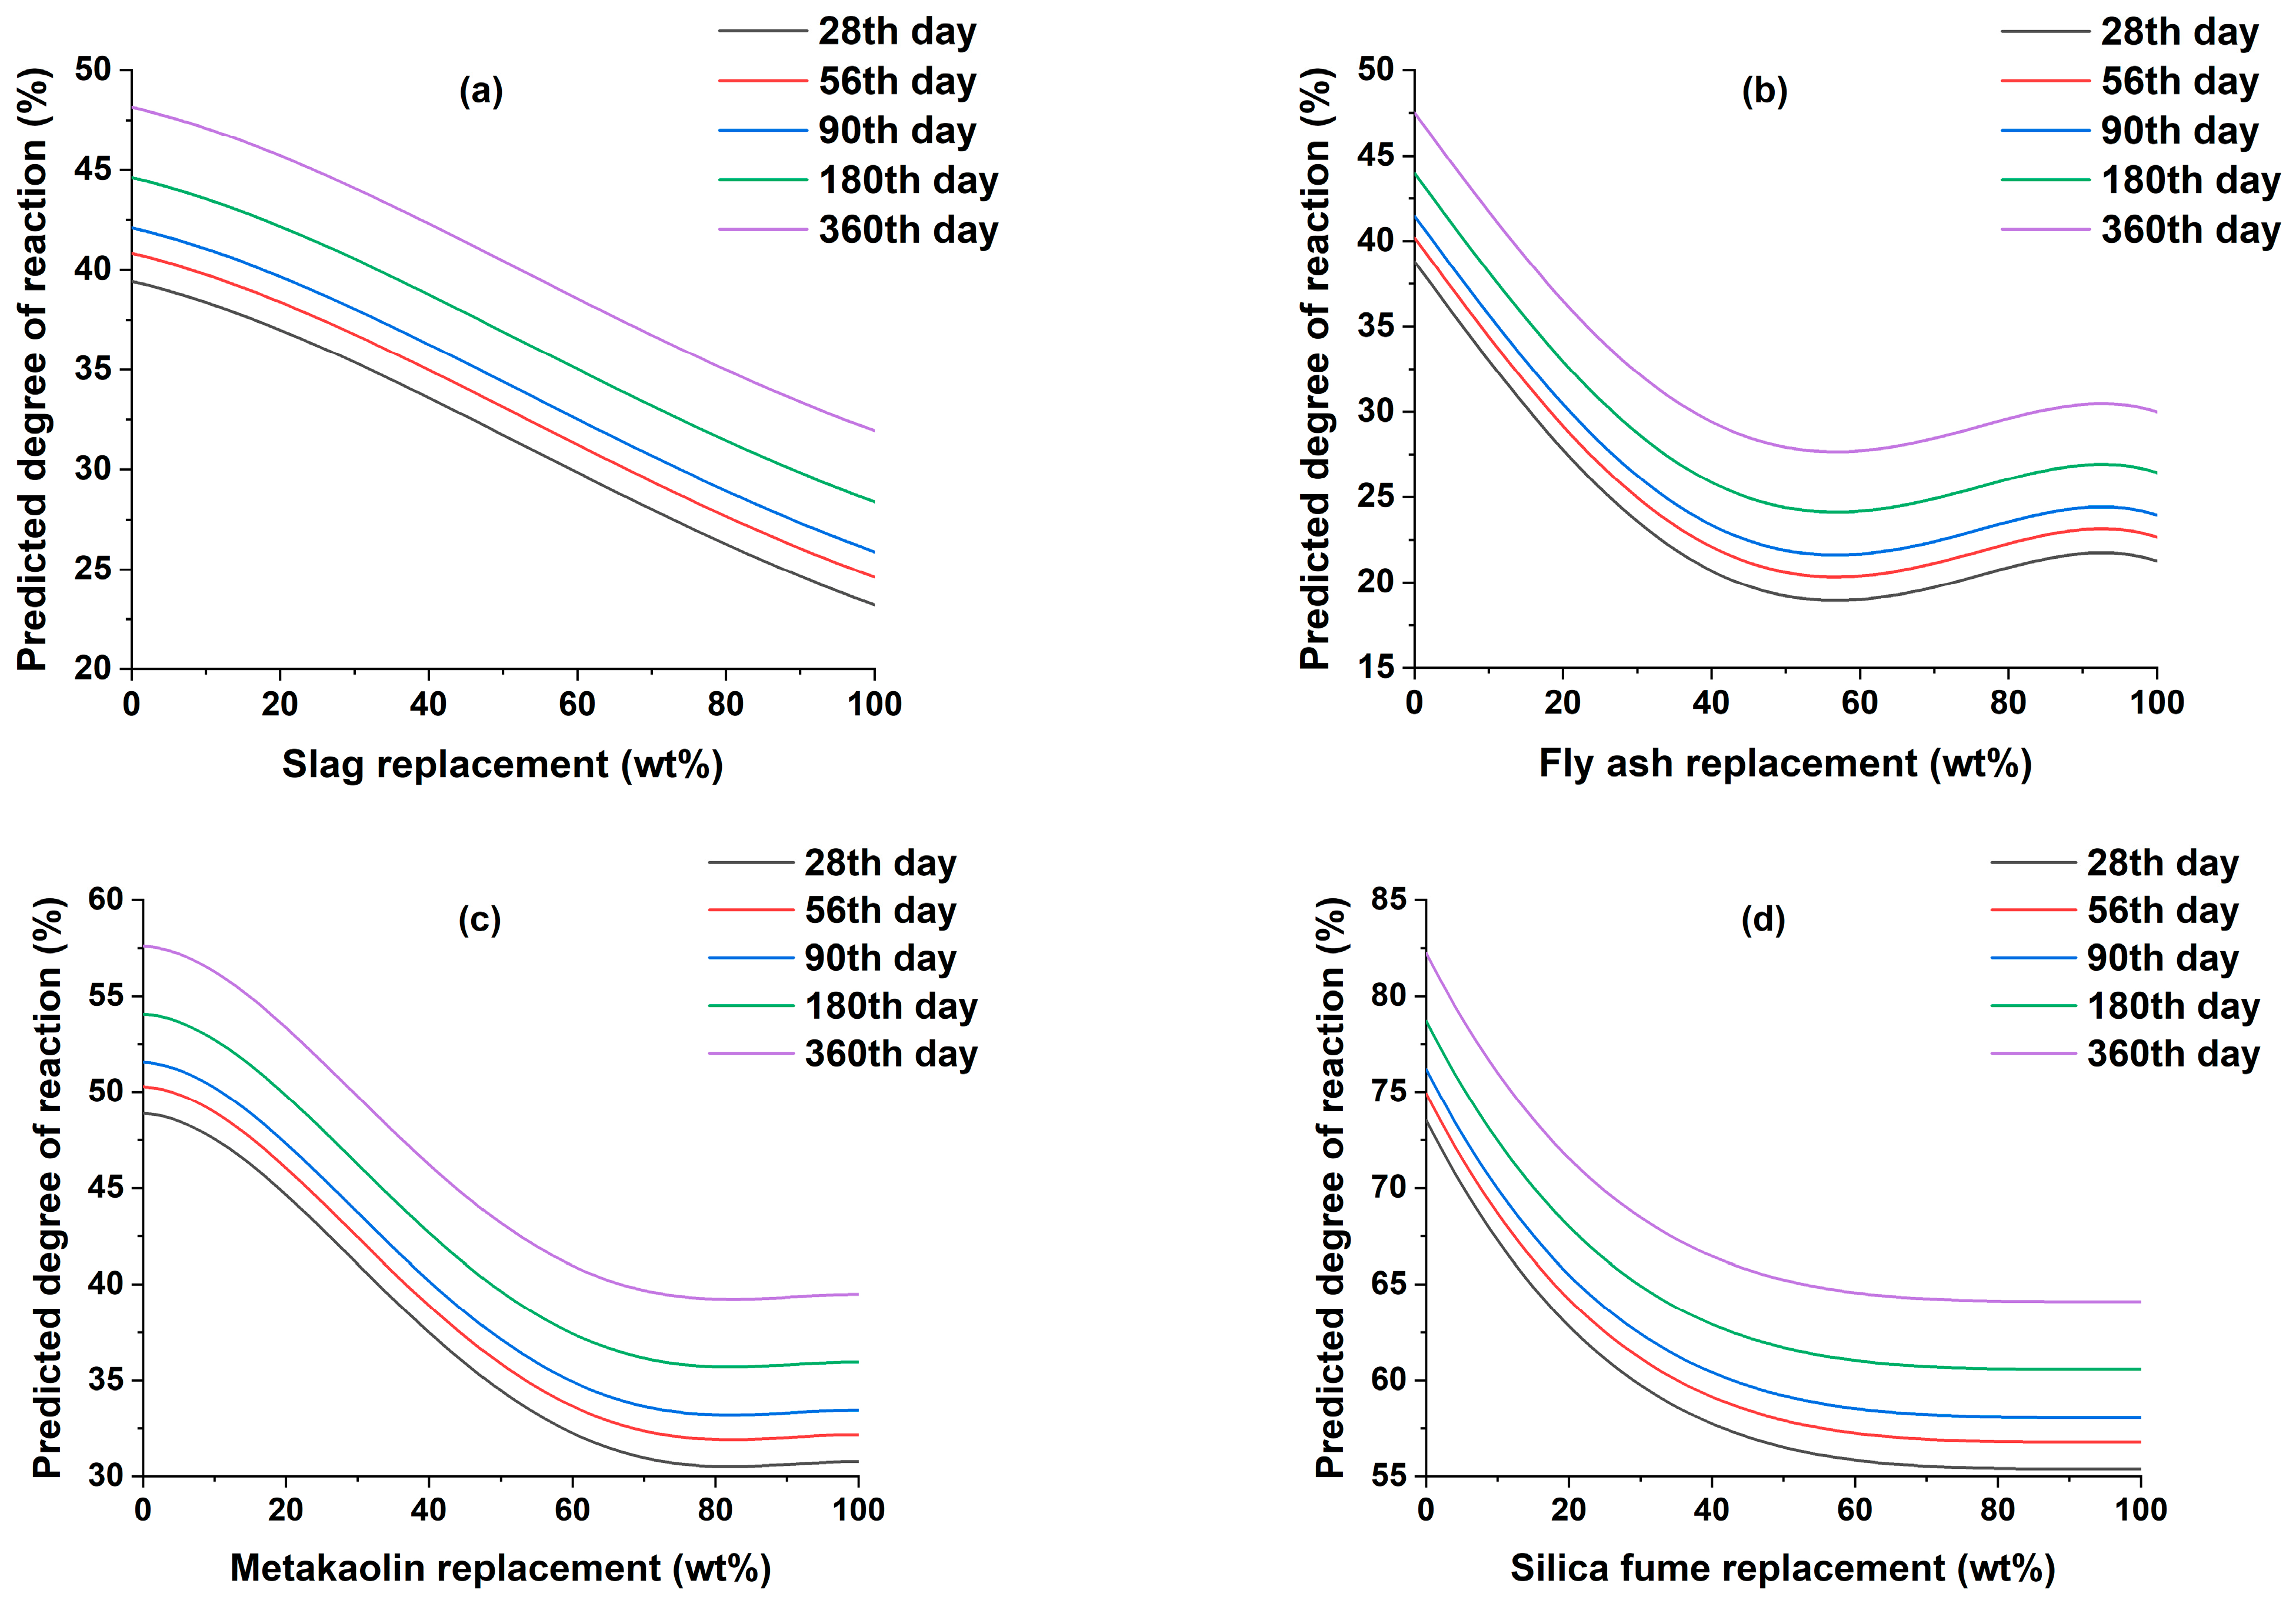
- For all SCMs, the DOR increases with increasing w/c ratios and curing time and decreases with replacement ratios.
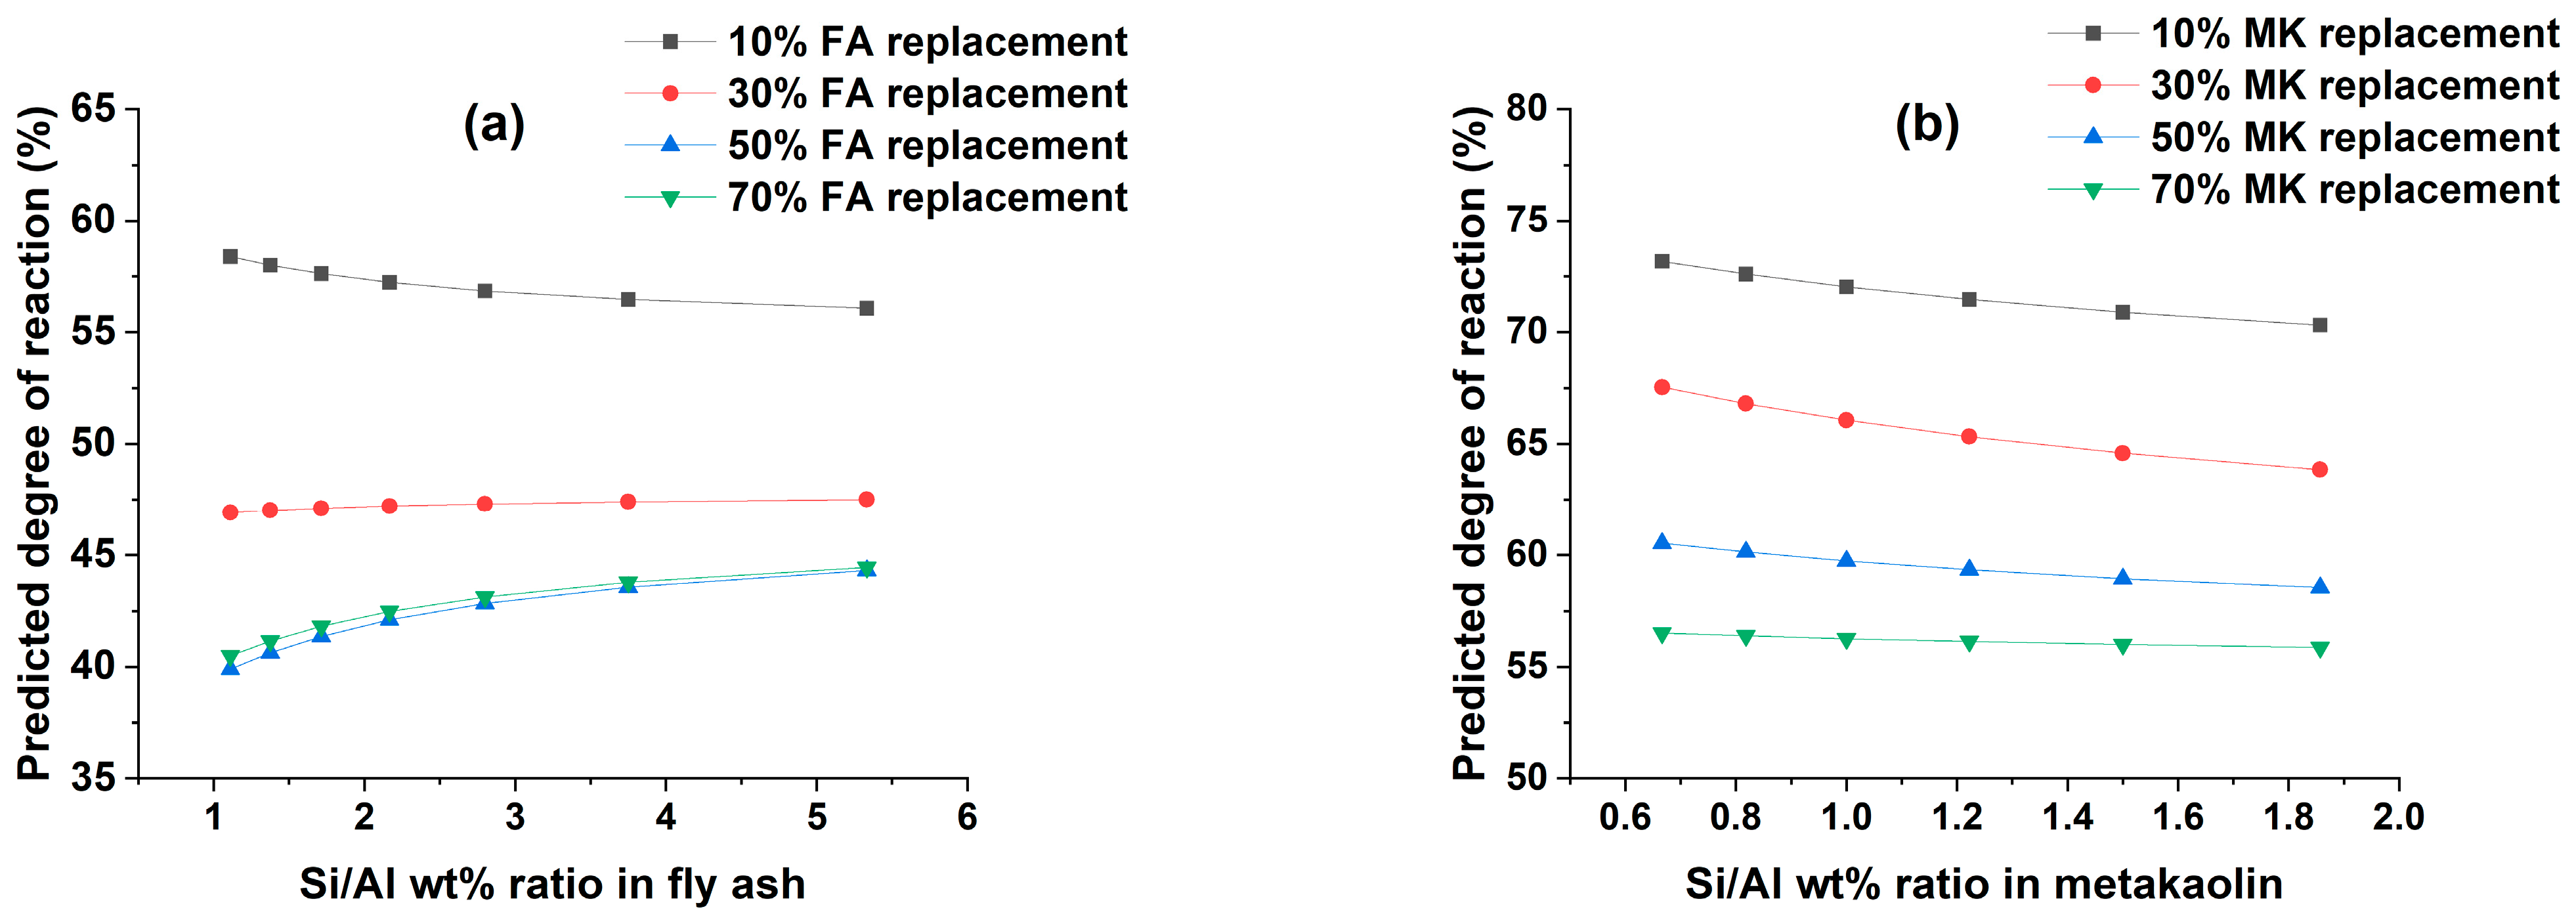
- The DOR of SCMs is predicted to exhibit significant changes based on oxide composition. For instance, slag with higher Al2O3 content is expected to show higher levels of DOR, while the DOR of metakaolin show less extent of change despite the variations in the Si/Al ratio of metakaolin.
- The proposed model will be highly useful for simulating phase assemblages of SCM-blended PC, as it provides a reasonable basis for predicting the DOR of SCMs covering numerous parameters related to material properties and curing conditions when no experimental data are available.
Author Contributions
Funding
Institutional Review Board Statement
Informed Consent Statement
Data Availability Statement
Conflicts of Interest
References
- Scrivener, K.L.; John, V.M.; Gartner, E.M. Eco-Efficient Cements: Potential Economically Viable Solutions for a Low-CO2 Cement-Based Materials Industry. Cem. Concr. Res. 2018, 114, 2–26. [Google Scholar] [CrossRef]
- Cormos, C.-C. Decarbonization Options for Cement Production Process: A Techno-Economic and Environmental Evaluation. Fuel 2022, 320, 123907. [Google Scholar] [CrossRef]
- Wei, J.; Cen, K.; Geng, Y. China’s Cement Demand and CO2 Emissions toward 2030: From the Perspective of Socioeconomic, Technology and Population. Environ. Sci. Pollut. Res. 2019, 26, 6409–6423. [Google Scholar] [CrossRef] [PubMed]
- Tam, C.; Taylor, M.; Gielen, D.; Twigg, C.; Klee, H.; Rocha, P.; Meer, R.v.d. Cement Technology Roadmap 2009—Carbon Emissions Reductions Up to 2050. Available online: https://www.iea.org/reports/cement-technology-roadmap-carbon-emissions-reductions-up-to-2050 (accessed on 1 July 2022).
- Vass, T.; Levi, P.; Gouy, A.; Mandová, H. Cement; IEA: Paris, French, 2021. [Google Scholar]
- Coffetti, D.; Crotti, E.; Gazzaniga, G.; Carrara, M.; Pastore, T.; Coppola, L. Pathways towards Sustainable Concrete. Cem. Concr. Res. 2022, 154, 106718. [Google Scholar] [CrossRef]
- Juenger, M.C.G.; Snellings, R.; Bernal, S.A. Supplementary Cementitious Materials: New Sources, Characterization, and Performance Insights. Cem. Concr. Res. 2019, 122, 257–273. [Google Scholar] [CrossRef]
- Schneider, M. The Cement Industry on the Way to a Low-Carbon Future. Cem. Concr. Res. 2019, 124, 105792. [Google Scholar] [CrossRef]
- Pacewska, B.; Wilińska, I. Usage of Supplementary Cementitious Materials: Advantages and Limitations: Part I. C–S–H, C–A–S–H and Other Products Formed in Different Binding Mixtures. J. Therm. Anal. Calorim. 2020, 142, 371–393. [Google Scholar] [CrossRef]
- Snellings, R. Assessing, Understanding and Unlocking Supplementary Cementitious Materials. RILEM Tech. Lett. 2016, 1, 50. [Google Scholar] [CrossRef]
- Moon, G.D.; Oh, S.; Jung, S.H.; Choi, Y.C. Effects of the Fineness of Limestone Powder and Cement on the Hydration and Strength Development of PLC Concrete. Constr. Build. Mater. 2017, 135, 129–136. [Google Scholar] [CrossRef]
- Scrivener, K.; Martirena, F.; Bishnoi, S.; Maity, S. Calcined Clay Limestone Cements (LC3). Cem. Concr. Res. 2018, 114, 49–56. [Google Scholar] [CrossRef]
- Bullard, J.W.; Garboczi, E.J.; Stutzman, P.E.; Feng, P.; Brand, A.S.; Perry, L.K.; Hagedorn, J.; Griffin, W.; Terrill, J.E. Measurement and Modeling Needs for Microstructure and Reactivity of Next-Generation Concrete Binders. Cem. Concr. Compos. 2019, 101, 24–31. [Google Scholar] [CrossRef]
- Choi, T. Bayesian Regression with Gaussian Processes: A Tutorial. In Proceedings of the Spring Conference, Hong Kong, 23–25 May 2011; The Korean Statistical Society: Seoul, Republic of Korea; pp. 77–81. [Google Scholar]
- Li, Z.; Yoon, J.; Zhang, R.; Rajabipour, F.; Srubar, W.V., III; Dabo, I.; Radlińska, A. Machine Learning in Concrete Science: Applications, Challenges, and Best Practices. NPJ Comput. Mater. 2022, 8, 127. [Google Scholar] [CrossRef]
- Ahmad, W.; Ahmad, A.; Ostrowski, K.A.; Aslam, F.; Joyklad, P.; Zajdel, P. Application of Advanced Machine Learning Approaches to Predict the Compressive Strength of Concrete Containing Supplementary Cementitious Materials. Materials 2021, 14, 5762. [Google Scholar] [CrossRef]
- Quan Tran, V. Machine Learning Approach for Investigating Chloride Diffusion Coefficient of Concrete Containing Supplementary Cementitious Materials. Constr. Build. Mater. 2022, 328, 127103. [Google Scholar] [CrossRef]
- Rahla, K.M.; Mateus, R.; Bragança, L. Comparative Sustainability Assessment of Binary Blended Concretes Using Supplementary Cementitious Materials (SCMs) and Ordinary Portland Cement (OPC). J. Clean. Prod. 2019, 220, 445–459. [Google Scholar] [CrossRef]
- Shah, H.A.; Yuan, Q.; Photwichai, N. Use of Materials to Lower the Cost of Ultra-High-Performance Concrete—A Review. Constr. Build. Mater. 2022, 327, 127045. [Google Scholar] [CrossRef]
- Hossain, M.U.; Poon, C.S.; Dong, Y.H.; Xuan, D. Evaluation of Environmental Impact Distribution Methods for Supplementary Cementitious Materials. Renew. Sustain. Energy Rev. 2018, 82, 597–608. [Google Scholar] [CrossRef]
- Wei, C.; Yan, Y.; Zhang, Z.; Liu, X.; Wu, P.; Gu, J.; Han, F.; Ren, Q. Insight into the Synergic Effects of Circulating Fluidized Bed Fly Ash, Red Mud and Blast Furnace Slag in Preparation of Ultrahigh-Performance Concrete: Reaction Mechanism and Performance Optimization. Constr. Build. Mater. 2023, 403, 133120. [Google Scholar] [CrossRef]
- Tushar, Q.; Bhuiyan, M.A.; Zhang, G.; Maqsood, T.; Tasmin, T. Application of a Harmonized Life Cycle Assessment Method for Supplementary Cementitious Materials in Structural Concrete. Constr. Build. Mater. 2022, 316, 125850. [Google Scholar] [CrossRef]
- Siddika, A.; Al Mamun, M.A.; Alyousef, R.; Mohammadhosseini, H. State-of-the-Art-Review on Rice Husk Ash: A Supplementary Cementitious Material in Concrete. J. King Saud Univ. Eng. Sci. 2021, 33, 294–307. [Google Scholar] [CrossRef]
- Searson, D. GPTIPS Symbolic Data Mining Platform for MATLAB. 2014. Available online: https://sites.google.com/site/gptips4matlab/ (accessed on 1 July 2022).
- Ben Haha, M.; De Weerdt, K.; Lothenbach, B. Quantification of the Degree of Reaction of Fly Ash. Cem. Concr. Res. 2010, 40, 1620–1629. [Google Scholar] [CrossRef]
- Kocaba, V.; Gallucci, E.; Scrivener, K.L. Methods for Determination of Degree of Reaction of Slag in Blended Cement Pastes. Cem. Concr. Res. 2012, 42, 511–525. [Google Scholar] [CrossRef]
- Scrivener, K.L.; Lothenbach, B.; De Belie, N.; Gruyaert, E.; Skibsted, J.; Snellings, R.; Vollpracht, A. TC 238-SCM: Hydration and Microstructure of Concrete with SCMs: State of the Art on Methods to Determine Degree of Reaction of SCMs. Mater. Struct. Constr. 2015, 48, 835–862. [Google Scholar] [CrossRef]
- Durdziński, P.T.; Ben Haha, M.; Bernal, S.A.; De Belie, N.; Gruyaert, E.; Lothenbach, B.; Menéndez Méndez, E.; Provis, J.L.; Schöler, A.; Stabler, C.; et al. Outcomes of the RILEM Round Robin on Degree of Reaction of Slag and Fly Ash in Blended Cements. Mater. Struct. Constr. 2017, 50, 135. [Google Scholar] [CrossRef]
- Kang, H.; Lee, N.; Moon, J. Elucidation of the Hydration Reaction of Uhpc Using the Ponkcs Method. Materials 2020, 13, 4661. [Google Scholar] [CrossRef]
- Pfingsten, J.; Rickert, J.; Lipus, K. Estimation of the Content of Ground Granulated Blast Furnace Slag and Different Pozzolanas in Hardened Concrete. Constr. Build. Mater. 2018, 165, 931–938. [Google Scholar] [CrossRef]
- Li, L.; Yang, J.; Shen, X. Measuring the Hydration Product Proportion in Composite Cement Paste by Using Quantitative BSE-EDS Image Analysis: A Comparative Study. Measurement 2022, 19, 111290. [Google Scholar] [CrossRef]
- Walkley, B.; Provis, J.L. Solid-State Nuclear Magnetic Resonance Spectroscopy of Cements. Mater. Today Adv. 2019, 1, 100007. [Google Scholar] [CrossRef]
- Polenova, T.; Gupta, R.; Goldbourt, A. Magic Angle Spinning NMR Spectroscopy: A Versatile Technique for Structural and Dynamic Analysis of Solid-Phase Systems. Anal. Chem. 2015, 87, 5458–5469. [Google Scholar] [CrossRef]
- Ferraz, E.; Andrejkovičová, S.; Hajjaji, W.; Velosa, A.L.; Silva, A.S.; Rocha, F. Pozzolanic Activity of Metakaolins by the French Standard of the Modified Chapelle Test: A Direct Methodology. Acta Geodyn. Geomater. 2015, 12, 289–298. [Google Scholar] [CrossRef]
- Quarcioni, V.A.; Chotoli, F.F.; Coelho, A.C.V.; Cincotto, M.A. Indirect and Direct Chapelle’s Methods for the Determination of Lime Consumption in Pozzolanic Materials Métodos de Ensaio Indiretos e Método Chapelle Direto Para Determinação Do Consumo de Cal Pelos Materiais Pozolânicos. Rev. Ibracon Estrut. Mater. 2015, 8, 1–7. [Google Scholar] [CrossRef]
- Snellings, R.; Scrivener, K.L. Rapid Screening Tests for Supplementary Cementitious Materials: Past and Future. Mater. Struct. Constr. 2016, 49, 3265–3279. [Google Scholar] [CrossRef]
- Donatello, S.; Tyrer, M.; Cheeseman, C.R. Comparison of Test Methods to Assess Pozzolanic Activity. Cem. Concr. Compos. 2010, 32, 121–127. [Google Scholar] [CrossRef]
- BS EN 196-5; BSI Standards Publication Methods of Testing Cement Part 5: Pozzolanicity Test for Pozzolanic Cement. European Standard; BSI Publications: London, UK, 2011.
- Tironi, A.; Trezza, M.A.; Scian, A.N.; Irassar, E.F. Assessment of Pozzolanic Activity of Different Calcined Clays. Cem. Concr. Compos. 2013, 37, 319–327. [Google Scholar] [CrossRef]
- Wang, Y.; Burris, L.; Shearer, C.R.; Hooton, D.; Suraneni, P. Strength Activity Index and Bulk Resistivity Index Modifications That Differentiate Inert and Reactive Materials. Cem. Concr. Compos. 2021, 124, 104240. [Google Scholar] [CrossRef]
- Ramanathan, S.; Pestana, L.R.; Suraneni, P. Reaction Kinetics of Supplementary Cementitious Materials in Reactivity Tests. Cement 2022, 8, 100022. [Google Scholar] [CrossRef]
- Narmluk, M.; Nawa, T. Effect of Fly Ash on the Kinetics of Portland Cement Hydration at Different Curing Temperatures. Cem. Concr. Res. 2011, 41, 579–589. [Google Scholar] [CrossRef]
- Gandomi, A.H.; Atefi, E. Software Review: The GPTIPS Platform. Genet. Program. Evolvable Mach. 2020, 21, 273–280. [Google Scholar] [CrossRef]
- Dagli, C.H. Natural Selection of Asphalt Mix Stiffness Predictive Models with Genetic Programming. Intell. Eng. Syst. Artif. Neural Netw. 2010, 20, 389–396. [Google Scholar] [CrossRef]
- Aquino, H.L.; Concepcion, R.S.; Mayol, A.P.; Bandala, A.A.; Culaba, A.; Cuello, J.; Dadios, E.P.; Ubando, A.T.; San Juan, J.L.G. Prediction of Moisture Content of Chlorella Vulgaris Microalgae Using Hybrid Evolutionary Computing and Neural Network Variants for Biofuel Production. In Proceedings of the 2021 IEEE 13th International Conference on Humanoid, Nanotechnology, Information Technology, Communication and Control, Environment, and Management (HNICEM 2021), Virtual, 28–30 November 2021; pp. 1–6. [Google Scholar] [CrossRef]
- Shin, Y.; Park, H.M.; Park, J.; Cho, H.; Oh, S.E.; Chung, S.Y.; Yang, B. Effect of Polymer Binder on the Mechanical and Microstructural Properties of Pervious Pavement Materials. Constr. Build. Mater. 2022, 325, 126209. [Google Scholar] [CrossRef]
- Wagner, T.; Kulik, D.A.; Hingerl, F.F.; Dmytrievava, S.V. Gem-Selektor Geochemical Modeling Package: TSolMod Library and Data Interface for Multicomponent Phase Models. Can. Mineral. 2012, 50, 1173–1195. [Google Scholar] [CrossRef]
- Kulik, D.A.; Wagner, T.; Dmytrieva, S.V.; Kosakowski, G.; Hingerl, F.F.; Chudnenko, K.V.; Berner, U.R. GEM-Selektor Geochemical Modeling Package: Revised Algorithm and GEMS3K Numerical Kernel for Coupled Simulation Codes. Comput. Geosci. 2013, 17, 1–24. [Google Scholar] [CrossRef]
- Lothenbach, B.; Kulik, D.A.; Matschei, T.; Balonis, M.; Baquerizo, L.; Dilnesa, B.; Miron, G.D.; Myers, R.J. Cemdata18: A Chemical Thermodynamic Database for Hydrated Portland Cements and Alkali-Activated Materials. Cem. Concr. Res. 2019, 115, 472–506. [Google Scholar] [CrossRef]
- Helgeson, H.C.; Kirkham, D.H.; Flowers, G.C. Theoretical Prediction of the Thermodynamic Behavior of Aqueous Electrolytes at High Pressures and Temperatures: IV. Calculation of Activity Coefficients, Osmotic Coefficients, and Apparent Molal and Standard and Relative Partial Molal Properties to 600 °C. Am. J. Sci. 1981, 281, 1249–1516. [Google Scholar] [CrossRef]
- Lothenbach, B.; Winnefeld, F. Thermodynamic Modelling of the Hydration of Portland Cement. Cem. Concr. Res. 2006, 36, 209–226. [Google Scholar] [CrossRef]
- Lothenbach, B.; Matschei, T.; Möschner, G.; Glasser, F.P. Thermodynamic Modelling of the Effect of Temperature on the Hydration and Porosity of Portland Cement. Cem. Concr. Res. 2008, 38, 1–18. [Google Scholar] [CrossRef]
- Parrot, L.J.; Killoh, D.C. Prediction of Cement Hydration. Br. Ceram. Proc. 1984, 35, 41–53. [Google Scholar]
- Ke, X.; Bernal, S.A.; Provis, J.L.; Lothenbach, B. Thermodynamic Modelling of Phase Evolution in Alkali-Activated Slag Cements Exposed to Carbon Dioxide. Cem. Concr. Res. 2020, 136, 106158. [Google Scholar] [CrossRef]
- Reddy, V.M.; Rao, D.M.V.S. Effect of w/c Ratio on Workability and Mechanical Properties of High Strength Self Compacting Concrete (M70 Grade). IOSR J. Mech. Civ. Eng. 2014, 11, 15–21. [Google Scholar] [CrossRef]
- Lothenbach, B.; Le Saout, G.; Ben Haha, M.; Figi, R.; Wieland, E. Hydration of a Low-Alkali CEM III/B-SiO 2 Cement (LAC). Cem. Concr. Res. 2012, 42, 410–423. [Google Scholar] [CrossRef]
- Snellings, R.; Machner, A.; Bolte, G.; Kamyab, H.; Durdzinski, P.; Teck, P.; Zajac, M.; Muller, A.; de Weerdt, K.; Haha, M. Ben Hydration Kinetics of Ternary Slag-Limestone Cements: Impact of Water to Binder Ratio and Curing Temperature. Cem. Concr. Res. 2022, 151, 106647. [Google Scholar] [CrossRef]
- Escalante, J.I.; Gómez, L.Y.; Johal, K.K.; Mendoza, G.; Mancha, H.; Méndez, J. Reactivity of Blast-Furnace Slag in Portland Cement Blends Hydrated under Different Conditions. Cem. Concr. Res. 2001, 31, 1403–1409. [Google Scholar] [CrossRef]
- Snellings, R.; Kazemi-Kamyab, H.; Nielsen, P.; Van den Abeele, L. Classification and Milling Increase Fly Ash Pozzolanic Reactivity. Front. Built Environ. 2021, 7, 670996. [Google Scholar] [CrossRef]
- Zhang, G.; Wei, Q.; Ding, Q.; Wang, A.; Liu, K. Effect of Curing Temperature and Fly Ash Content on the Hydration and Microstructure of Fly Ash–Cement Pastes. J. Sustain. Cem. Mater. 2018, 7, 372–383. [Google Scholar] [CrossRef]
- Zhao, D.; Khoshnazar, R. Microstructure of Cement Paste Incorporating High Volume of Low-Grade Metakaolin. Cem. Concr. Compos. 2020, 106, 103453. [Google Scholar] [CrossRef]
- Wei, Y.; Yao, W.; Xing, X.; Wu, M. Quantitative Evaluation of Hydrated Cement Modified by Silica Fume Using QXRD, 27Al MAS NMR, TG-DSC and Selective Dissolution Techniques. Constr. Build. Mater. 2012, 36, 925–932. [Google Scholar] [CrossRef]
- Uzbas, B.; Aydin, A.C. Microstructural Analysis of Silica Fume Concrete with Scanning Electron Microscopy and X-Ray Diffraction. Eng. Technol. Appl. Sci. Res. 2020, 10, 5845–5850. [Google Scholar] [CrossRef]
- Wei, J.; Gencturk, B. Hydration of Ternary Portland Cement Blends Containing Metakaolin and Sodium Bentonite. Cem. Concr. Res. 2019, 123, 105772. [Google Scholar] [CrossRef]
- Whittaker, M.; Zajac, M.; Ben Haha, M.; Bullerjahn, F.; Black, L. The Role of the Alumina Content of Slag, plus the Presence of Additional Sulfate on the Hydration and Microstructure of Portland Cement-Slag Blends. Cem. Concr. Res. 2014, 66, 91–101. [Google Scholar] [CrossRef]
- Wang, S.D.; Scrivener, K.L. Hydration Products of Alkali Activated Slag Cement. Cem. Concr. Res. 1995, 25, 561–571. [Google Scholar] [CrossRef]
- Mozgawa, W.; Deja, J. Spectroscopic Studies of Alkaline Activated Slag Geopolymers. J. Mol. Struct. 2009, 924–926, 434–441. [Google Scholar] [CrossRef]
- Kocak, Y. Effects of Metakaolin on the Hydration Development of Portland–Composite Cement. J. Build. Eng. 2020, 31, 101419. [Google Scholar] [CrossRef]
- Juengsuwattananon, K.; Winnefeld, F.; Chindaprasirt, P.; Pimraksa, K. Correlation between Initial SiO2/Al2O3, Na2O/Al2O3, Na2O/SiO2 and H2O/Na2O Ratios on Phase and Microstructure of Reaction Products of Metakaolin-Rice Husk Ash Geopolymer. Constr. Build. Mater. 2019, 226, 406–417. [Google Scholar] [CrossRef]
- Duxson, P.; Provis, J.L.; Lukey, G.C.; Mallicoat, S.W.; Kriven, W.M.; Van Deventer, J.S.J. Understanding the Relationship between Geopolymer Composition, Microstructure and Mechanical Properties. Colloids Surf. A Physicochem. Eng. Asp. 2005, 269, 47–58. [Google Scholar] [CrossRef]
- ASTM International. ASTM C 1240 Standard Specification for Silica Fume Used in Cementitious Mixtures. Annu. B. ASTM Stand. 2003, 15, 1–6. [Google Scholar]
- Wolsiefer, J.; Sivasundaram, V.; Malhotra, V.M.; Carette, G.C. Performance of Concretes Incorporating Various Forms of Silica Fume. Am. Concr. Inst. ACI Spec. Publ. 1995, SP-153, 591–655. [Google Scholar]
- Lothenbach, B.; Scrivener, K.; Hooton, R.D. Supplementary Cementitious Materials. Cem. Concr. Res. 2011, 41, 1244–1256. [Google Scholar] [CrossRef]
- Park, K.B.; Wang, Y.S.; Wang, X.Y. Property Analysis of Slag Composite Concrete Using a Kinetic–Thermodynamic Hydration Model. Appl. Sci. 2021, 11, 7191. [Google Scholar] [CrossRef]
- Papadakis, V.G. Effect of Fly Ash on Portland Cement Systems: Part I. Low-Calcium Fly Ash. Cem. Concr. Res. 1999, 29, 1727–1736. [Google Scholar] [CrossRef]
- Durdziński, P.T.; Ben Haha, M.; Zajac, M.; Scrivener, K.L. Phase Assemblage of Composite Cements. Cem. Concr. Res. 2017, 99, 172–182. [Google Scholar] [CrossRef]
- Kunther, W.; Dai, Z.; Skibsted, J. Thermodynamic Modeling of Hydrated White Portland Cement-Metakaolin-Limestone Blends Utilizing Hydration Kinetics from 29Si MAS NMR Spectroscopy. Cem. Concr. Res. 2016, 86, 29–41. [Google Scholar] [CrossRef]


| Oxides (Mass-%) | SiO2 | Al2O3 | Fe2O3 | CaO | MgO | SO3 | Na2O | K2O |
|---|---|---|---|---|---|---|---|---|
| PC | 20.2 ± 0.12 | 5.6 ± 0.13 | 2.4 ± 0.12 | 65.9 ± 0.14 | 2.0 ± 0.05 | 2.6 ± 0.1 | 0.5 ± 0.04 | 0.7 ± 0.03 |
| Slag | 36.49 | 12.26 | 0 | 41.79 | 7.48 | 1.98 | 0 | 0 |
| Fly ash | 51.8 ± 1.12 | 23.4 ± 0.48 | 7.2 ± 0.3 | 10.8 ± 1.08 | 2.7 ± 0.22 | 1.1 ± 0.2 | 1.3 ± 0.17 | 1.6 ± 0.13 |
| Metakaolin | 54.1 ± 0.4 | 43.6 ± 0.6 | 1.1 ± 0.18 | 0.2 ± 0.03 | 0.2 ± 0.05 | 0.1 ± 0.04 | 0.1 ± 0.02 | 0.5 ± 0.09 |
| Silica fume | 99.3 ± 0.47 | 0.1 ± 0.05 | 0 | 0.1 ± 0.11 | 0.1 ± 0.09 | 0 | 0.1 ± 0.06 | 0.2 ± 0.15 |
| Fitting Method | Coefficient of Determination | Pearson Correlation Coefficient |
|---|---|---|
| Slag | 88.5 | 94.1 |
| Fly ash | 83.6 | 91.4 |
| Metakaolin | 93.3 | 96.6 |
| Silica fume | 99.7 | 99.8 |
Disclaimer/Publisher’s Note: The statements, opinions and data contained in all publications are solely those of the individual author(s) and contributor(s) and not of MDPI and/or the editor(s). MDPI and/or the editor(s) disclaim responsibility for any injury to people or property resulting from any ideas, methods, instructions or products referred to in the content. |
© 2023 by the authors. Licensee MDPI, Basel, Switzerland. This article is an open access article distributed under the terms and conditions of the Creative Commons Attribution (CC BY) license (https://creativecommons.org/licenses/by/4.0/).
Share and Cite
Degefa, A.B.; Park, S.; Yang, B.; Park, S. Predicting the Degree of Reaction of Supplementary Cementitious Materials in Hydrated Portland Cement. Sustainability 2023, 15, 15471. https://doi.org/10.3390/su152115471
Degefa AB, Park S, Yang B, Park S. Predicting the Degree of Reaction of Supplementary Cementitious Materials in Hydrated Portland Cement. Sustainability. 2023; 15(21):15471. https://doi.org/10.3390/su152115471
Chicago/Turabian StyleDegefa, Aron Berhanu, Seunghee Park, Beomjoo Yang, and Solmoi Park. 2023. "Predicting the Degree of Reaction of Supplementary Cementitious Materials in Hydrated Portland Cement" Sustainability 15, no. 21: 15471. https://doi.org/10.3390/su152115471
APA StyleDegefa, A. B., Park, S., Yang, B., & Park, S. (2023). Predicting the Degree of Reaction of Supplementary Cementitious Materials in Hydrated Portland Cement. Sustainability, 15(21), 15471. https://doi.org/10.3390/su152115471