
Indicator Construction of Road Surface Deformation Activity in Cold Regions and Its Relationship with the Distribution and Development of Longitudinal Cracks

Abstract
:1. Introduction
2. Field Monitoring Results
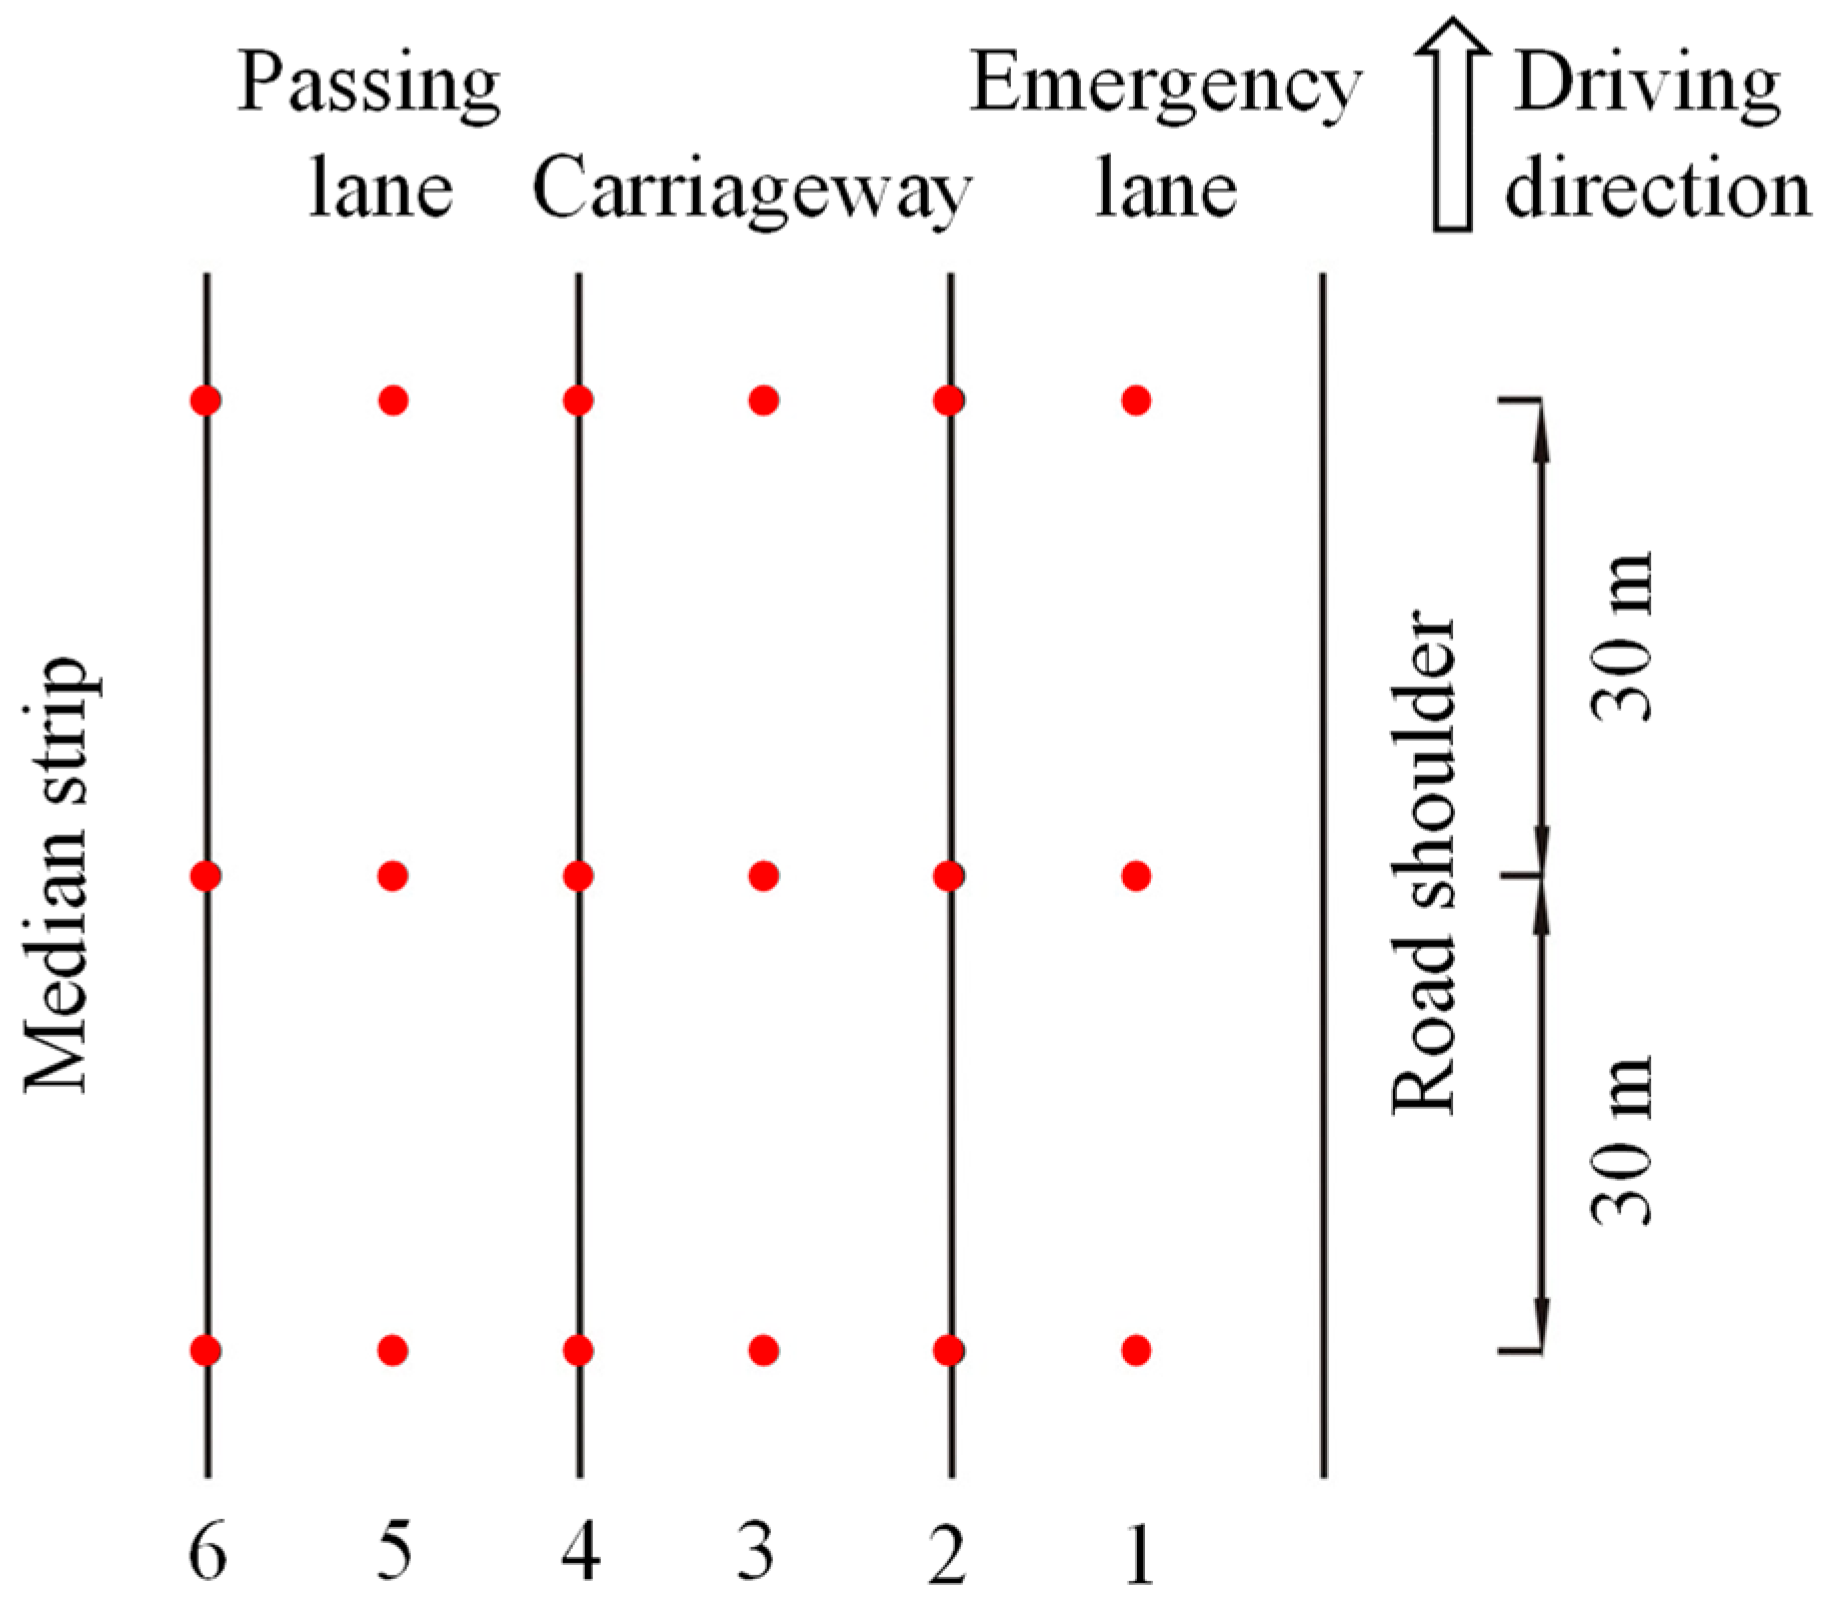
2.1. Test Section
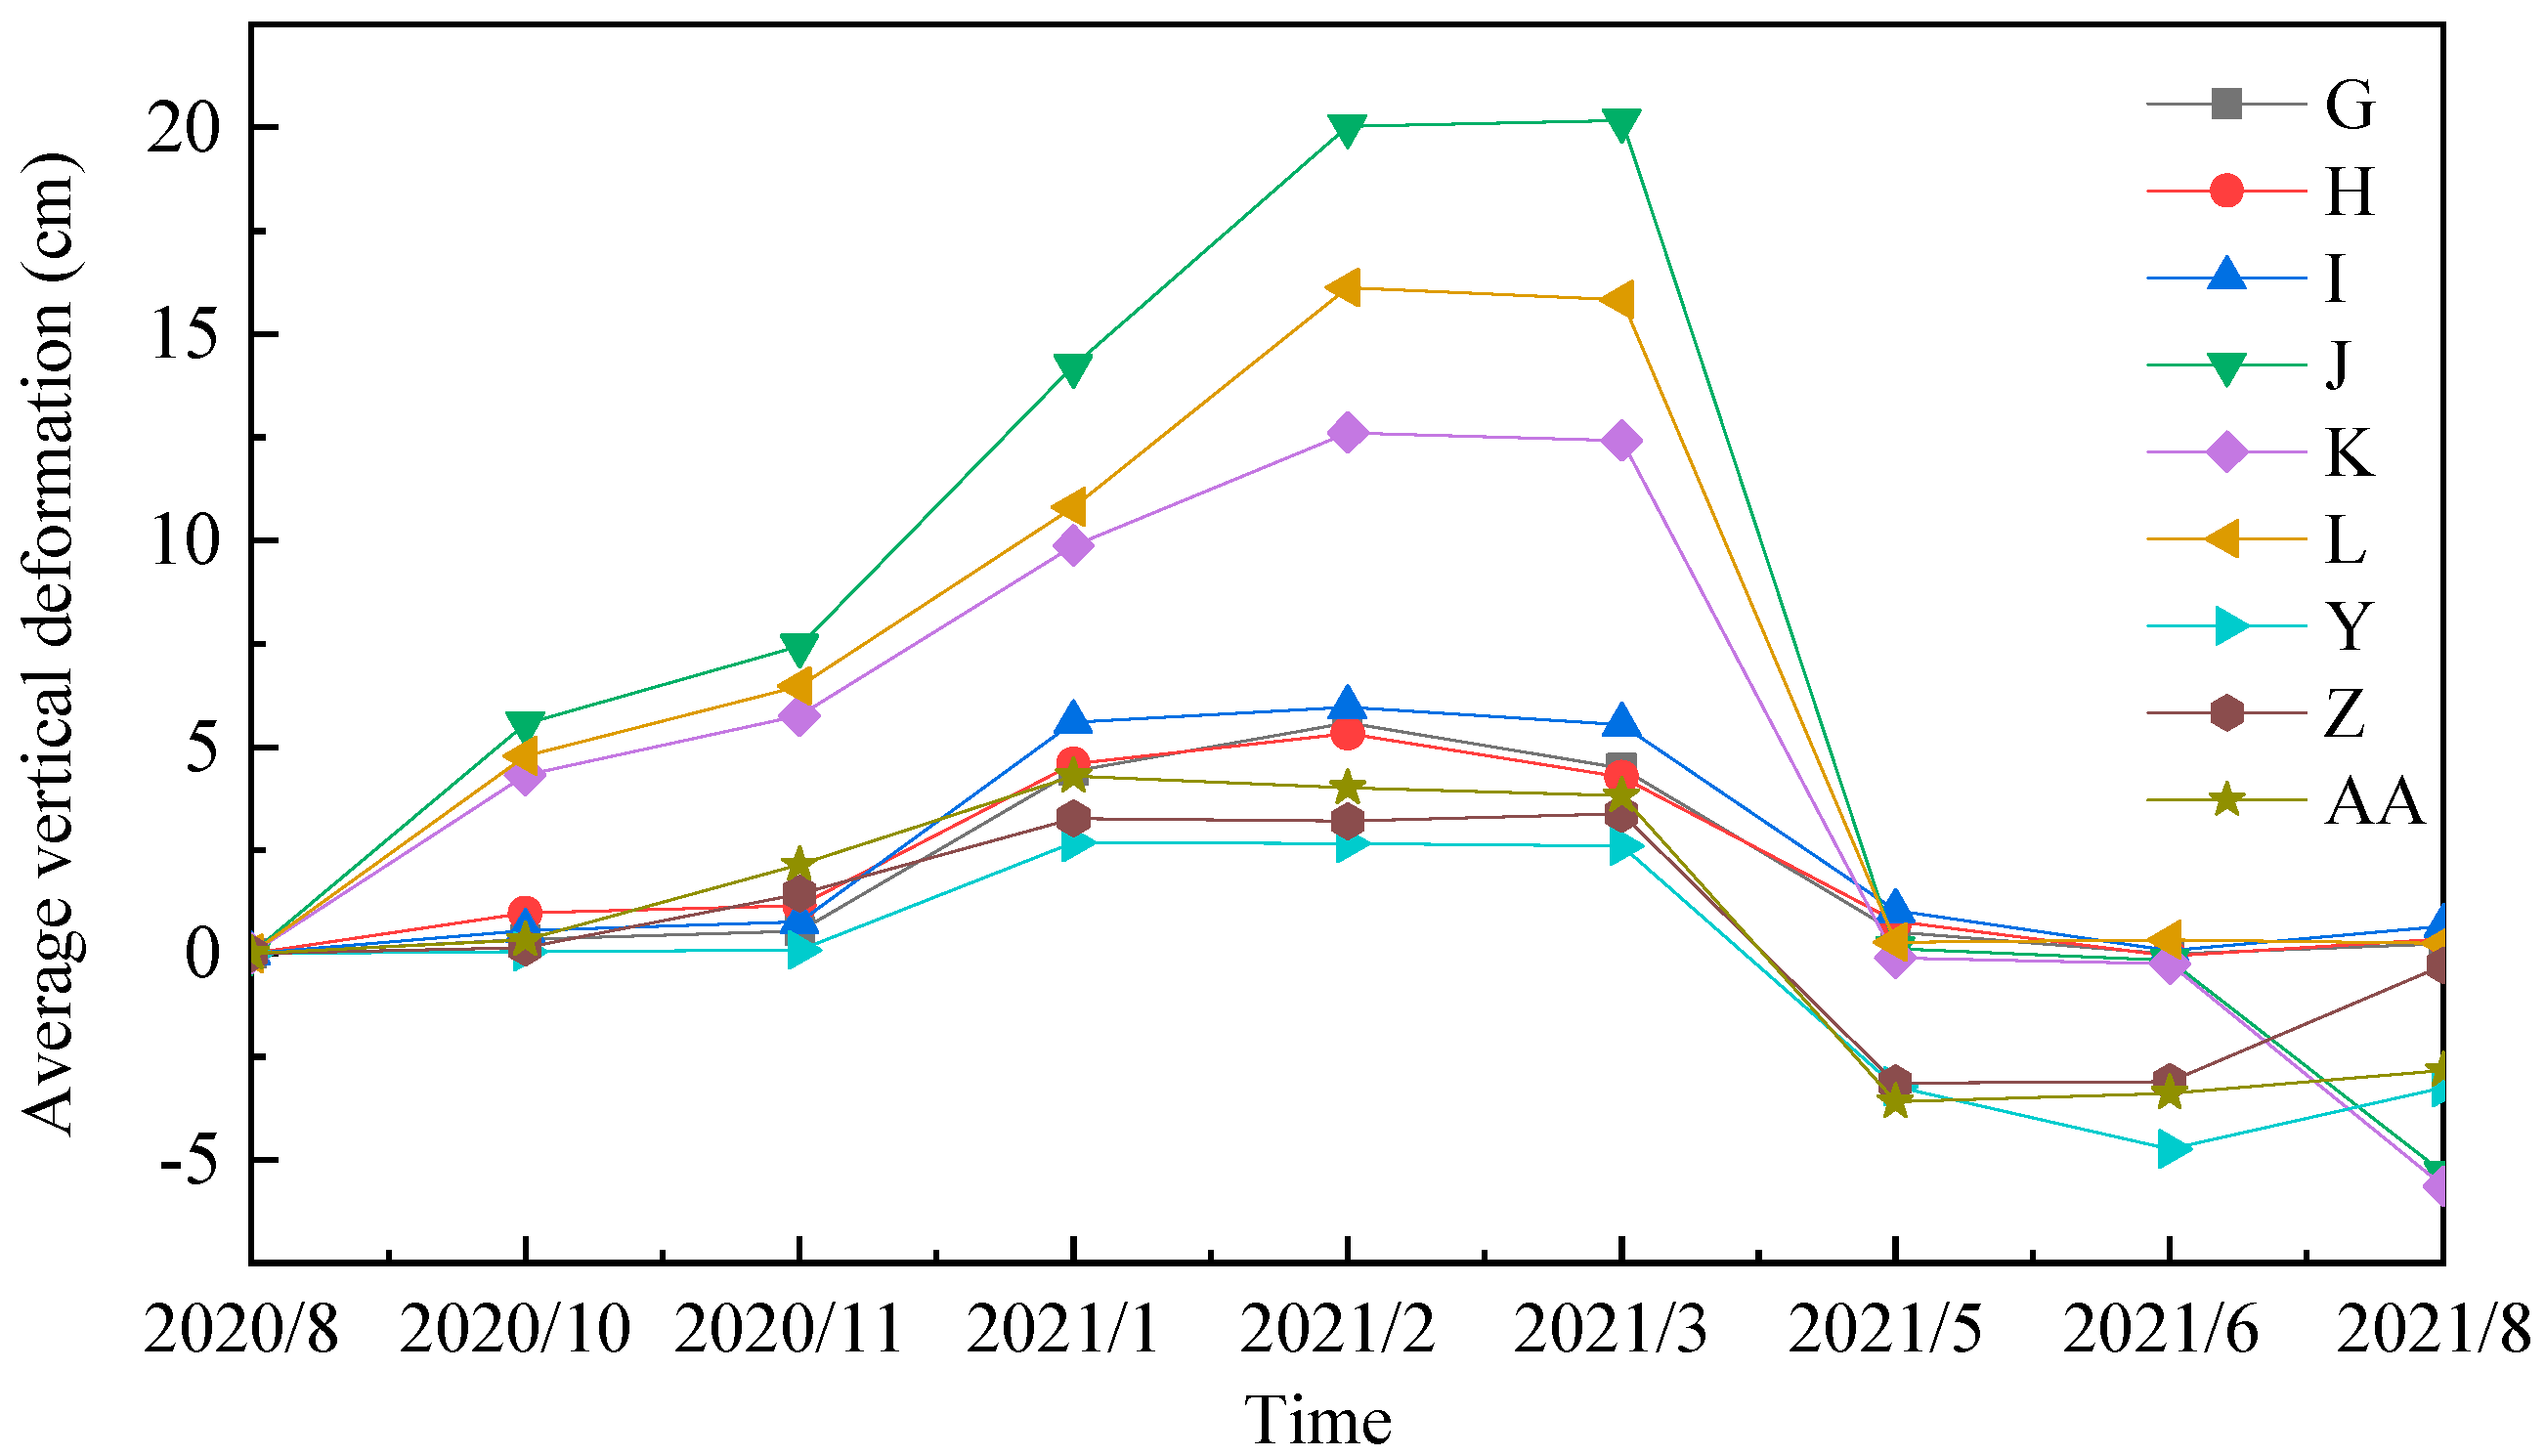
2.2. Road Surface Deformation Characteristics
2.3. Monitoring Results of Longitudinal Crack Conditions
2.3.1. Length and Growth Trends of Longitudinal Cracks
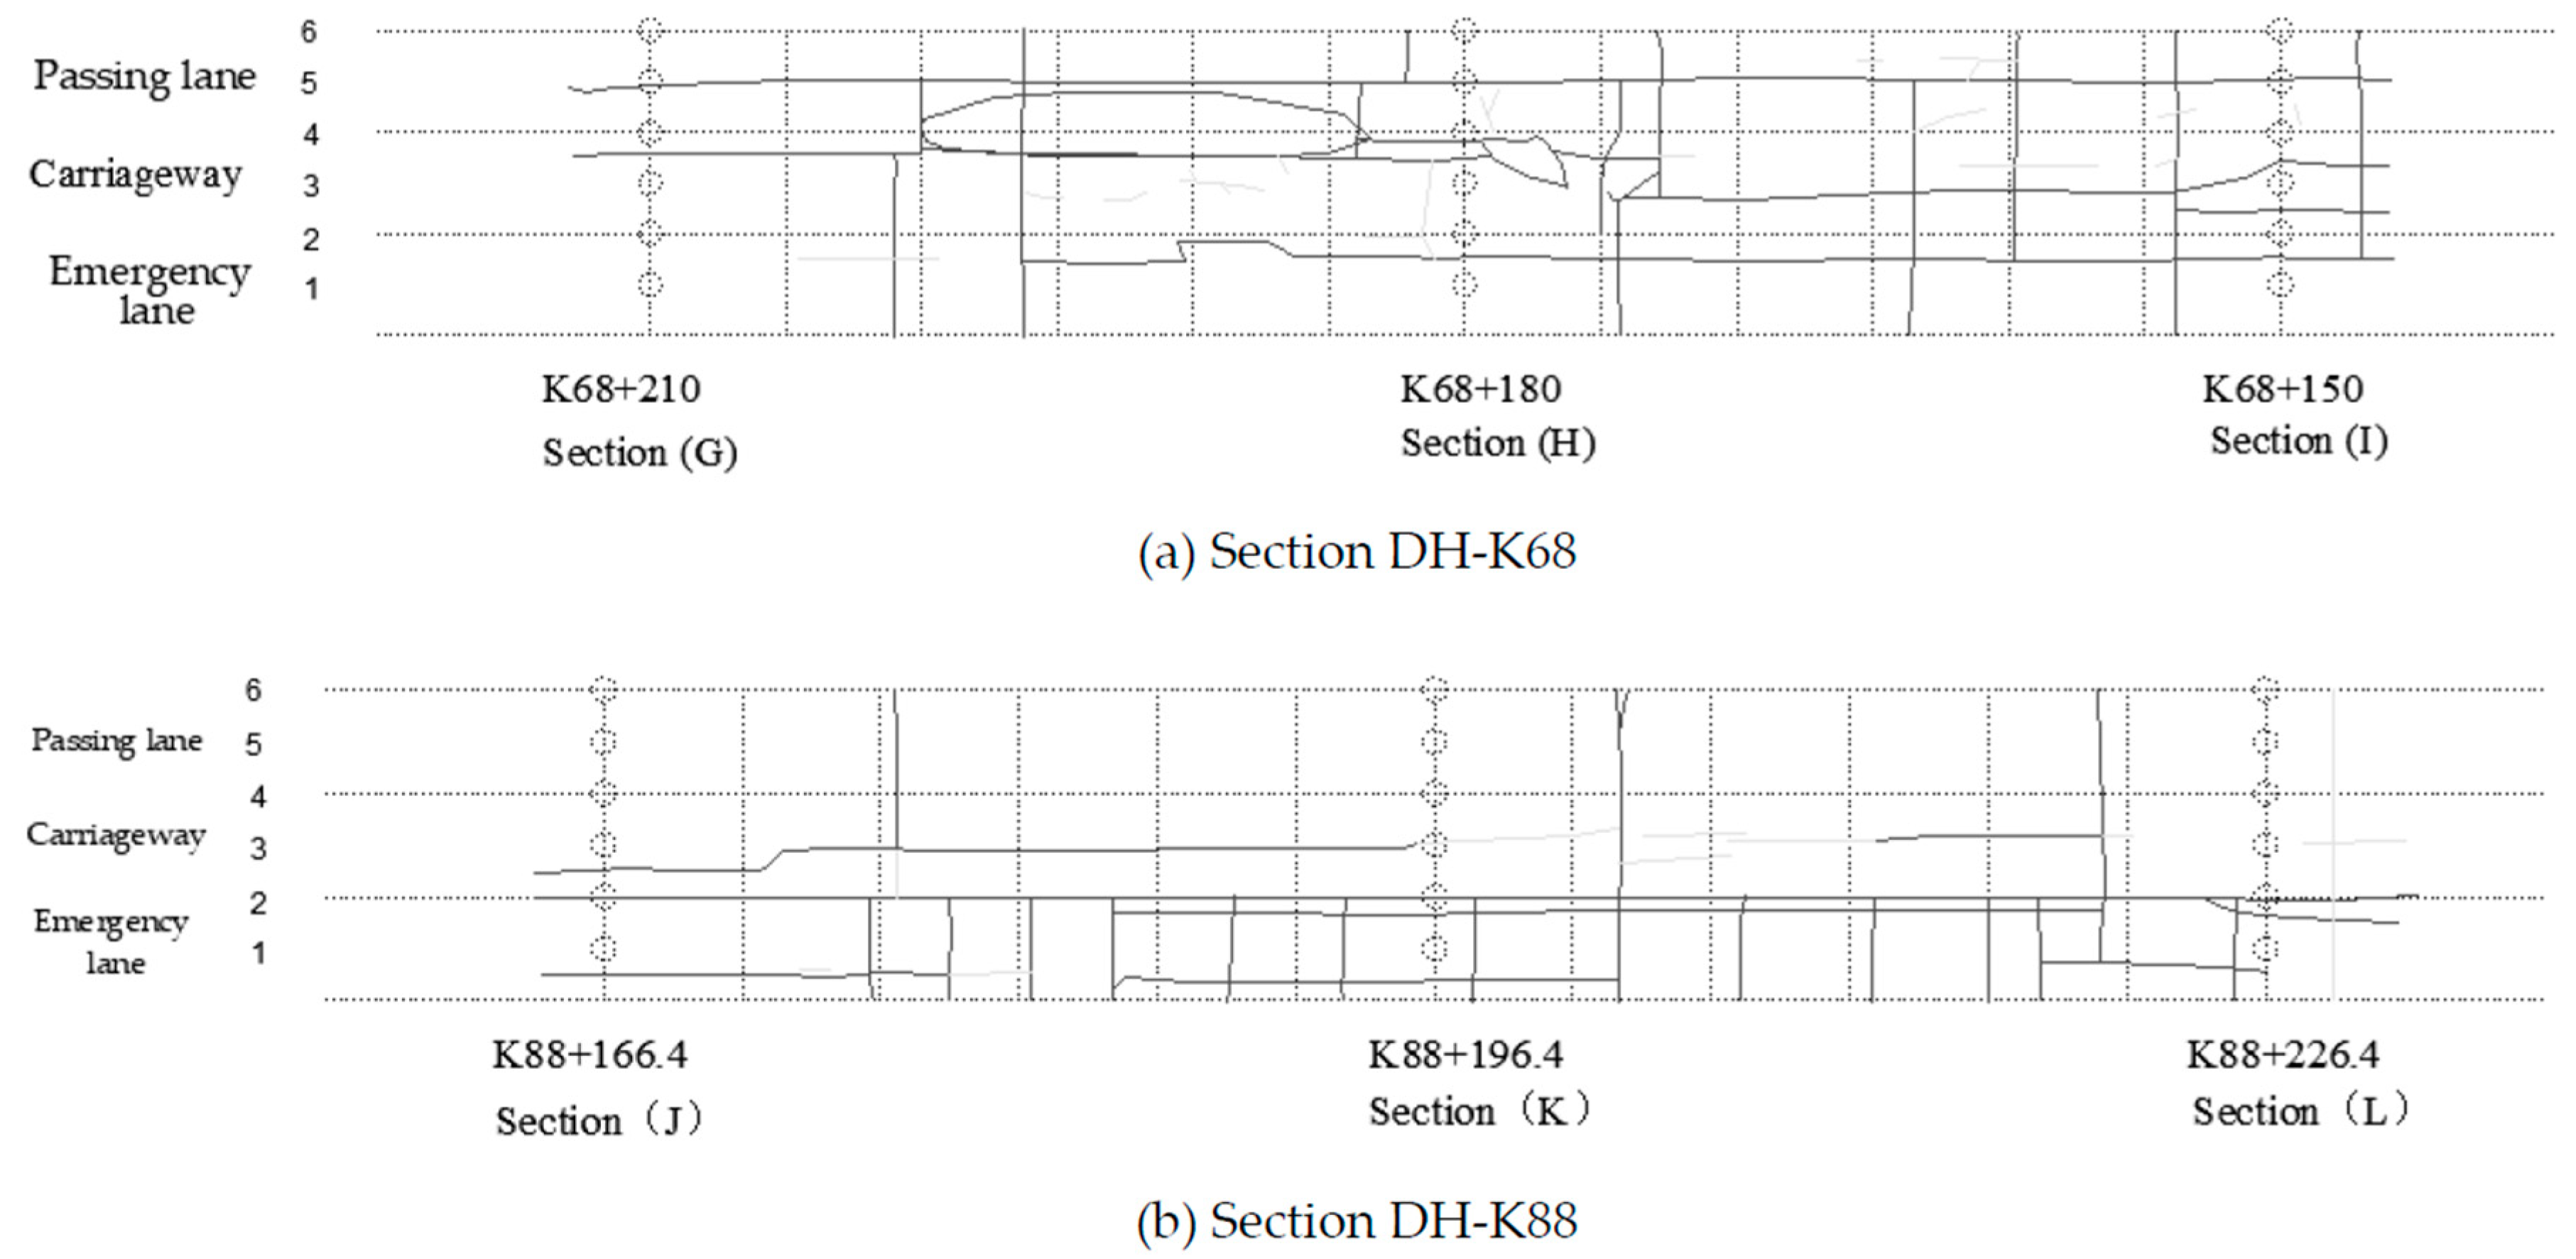
2.3.2. Distribution Laws of Longitudinal Cracks
3. Calculation of Deformation Changes and Variances of Monitoring Data
3.1. Calculation of the Difference in Time-Series Elevation Change
3.2. Standard Deviation of Elevation Differences
- (1)
- Standard deviation calculation of the difference in elevation change between periods for each monitoring section.
- (2)
- Standard deviation calculation of the elevation differences between different periods at monitoring points as shown in Table 6.
4. Activity Definition and Calculation Results
4.1. Definition of Activity
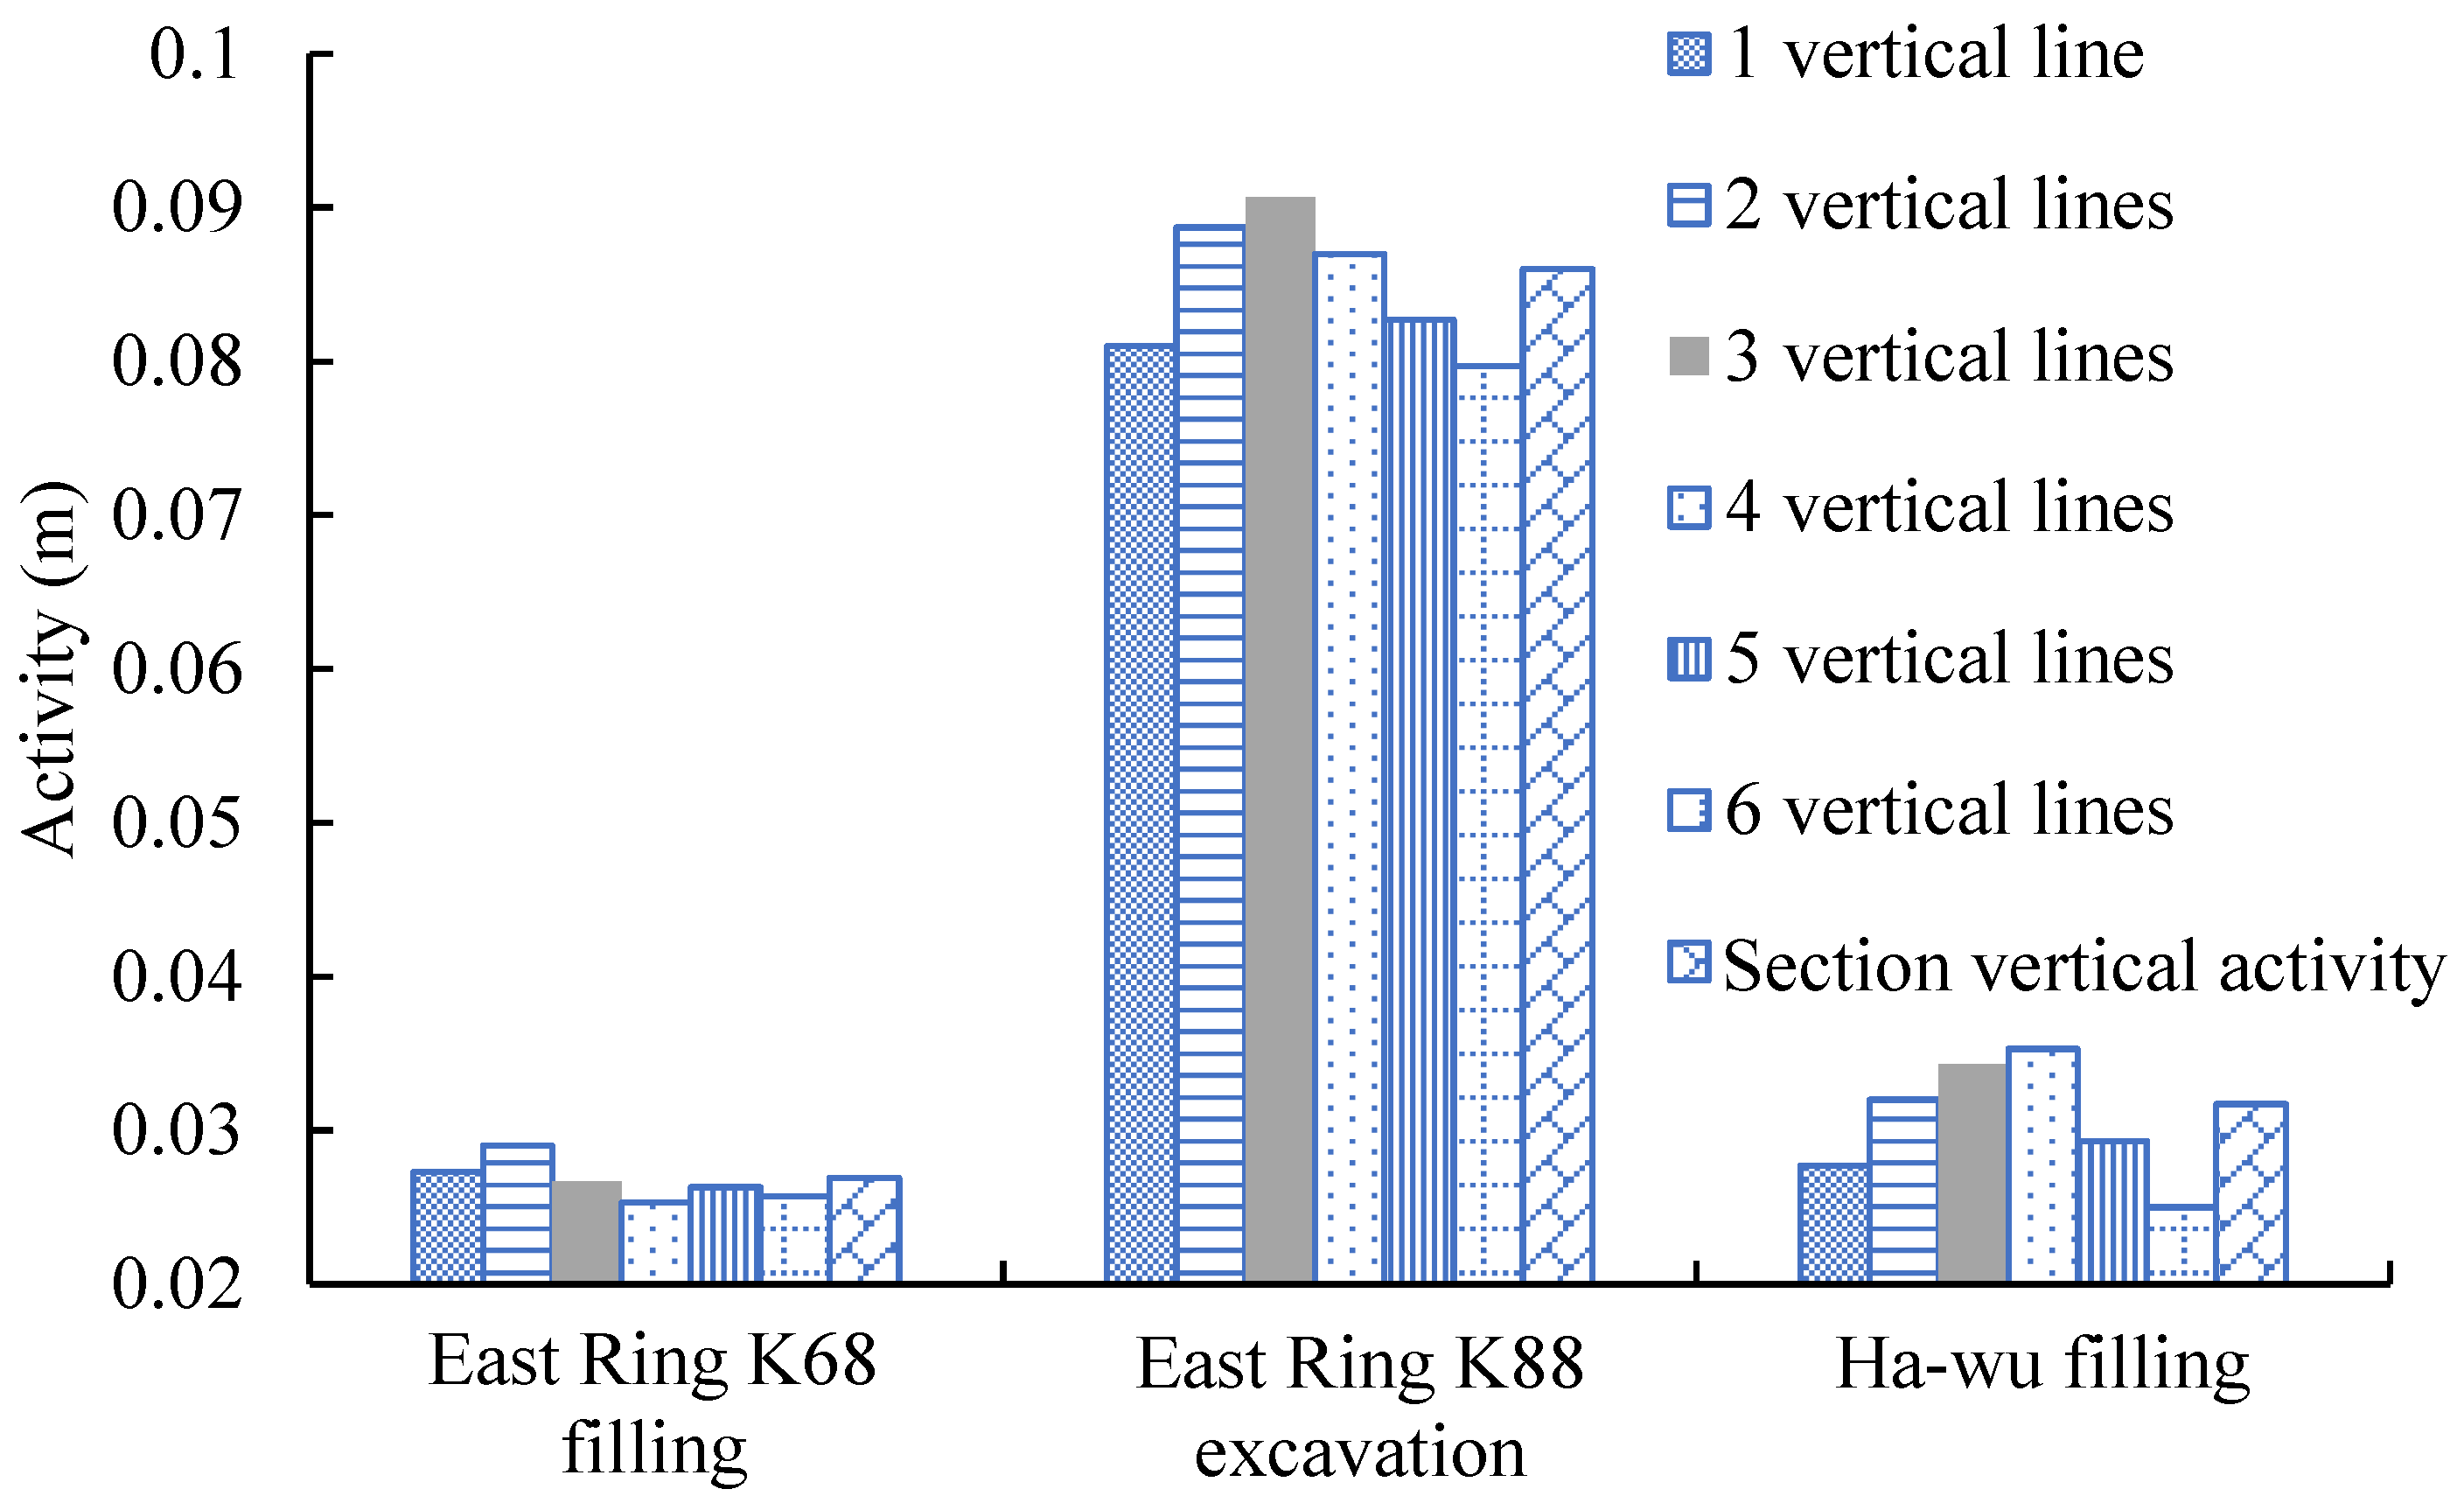
4.2. Longitudinal Line Activity and Section Vertical Activity
5. Relationship between Activity and Longitudinal Cracks
5.1. Longitudinal Line Activity
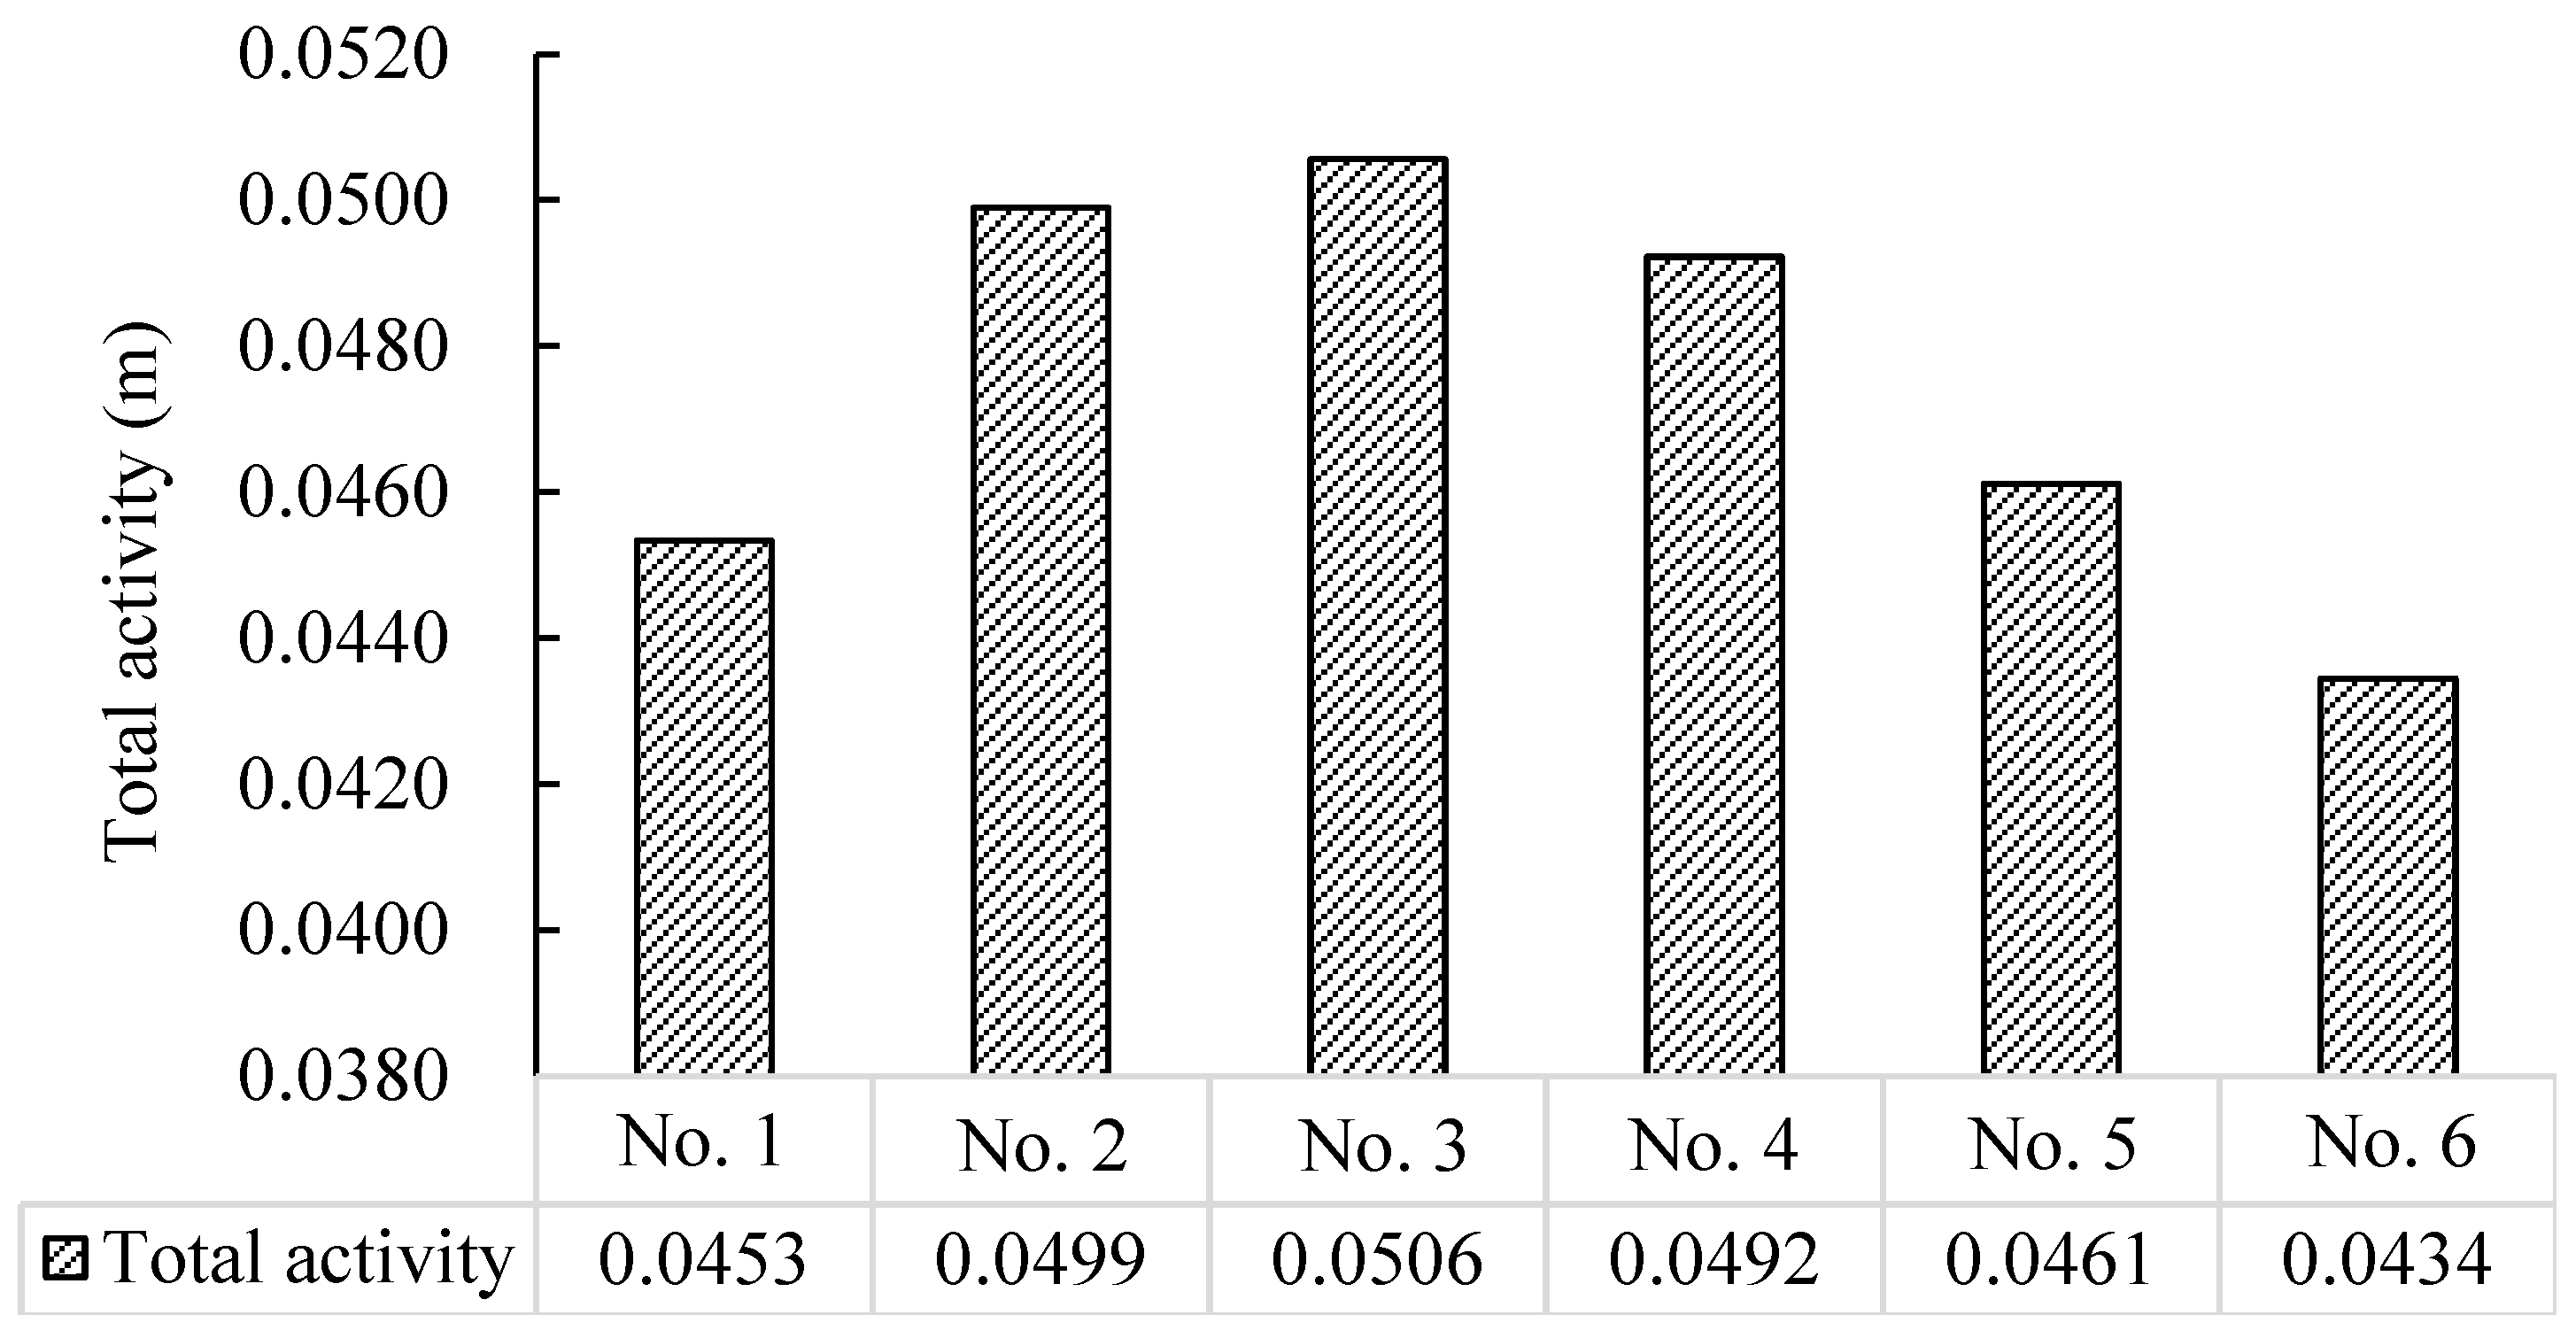
5.2. Relationship between Activity and Longitudinal Crack Lengths
5.3. Relationship between Activity and Longitudinal Crack Distribution Characteristics
5.4. Relationship between Activity and Longitudinal Crack Development in Different Periods of the Section
6. Conclusions
- (1)
- The discrete characteristics and variance distribution characteristics of road surface deformation can be used to describe the degree of activity of the vertical deformation and to establish an activity index.
- (2)
- The time series elevation variance and standard deviation of elevation change of road surface deformation were analyzed to construct an activity index, used to describe the activity of road points, sections, longitudinal lines, intervals, and longitudinal deformation.
- (3)
- Vertical deformation activity was significantly correlated with longitudinal crack condition, distribution, and development characteristics. Longitudinal activity was used to describe the activity of vertical deformation in a longitudinal line of the road surface. The mean value of the activity of adjacent longitudinal lines was used to describe the activity of vertical deformation in a transverse interval. Longitudinal activity was used to describe the average condition of longitudinal activity in a section or several sections.
- (4)
- The activity was greatest in each monitoring section from March to May. From Aug. to Jan., during the period of thermal expansion and frost heave, activity was relatively greater. The longitudinal activity varied significantly between sections, with numerical differences reaching 3 to 4 times.
- (5)
- The relationship between activity and longitudinal crack condition was analyzed. There was a correlation between crack length and total activity in the interval. The greater the activity, the greater the longitudinal crack length, and the two followed an exponential relationship.
- (6)
- An analysis of the activity and its relationship with the development of longitudinal cracks in different periods indicates that there was a logarithmic relationship between the annual growth length of longitudinal cracks and the relationship between the longitudinal activity of the section. The greater the activity, the greater the annual growth length of longitudinal cracks. The activity from Feb. to May shows a linear relationship with the development rate of longitudinal cracks.
Author Contributions
Funding
Institutional Review Board Statement
Informed Consent Statement
Data Availability Statement
Acknowledgments
Conflicts of Interest
References
- Feng, D.-C.; Lin, B.; Zhang, F.; Feng, X. A review of freeze-thaw effect on soil geotechnical properties. Sci. Sin. Technol. 2017, 47, 111–127. [Google Scholar] [CrossRef]
- Rivière, A.; Jost, A.; Gonçalvès, J.; Font, M. Pore water pressure evolution below a freezing front under saturated conditions: Large-scale laboratory experiment and numerical investigation. Cold Reg. Sci. Technol. 2019, 158, 76–94. [Google Scholar] [CrossRef]
- Zhao, T.; Zhang, M.; Lu, J.; Yan, Z. Correlation between ground surface deformation and influential factors in permafrost regions. J. Harbin Inst. Technol. 2021, 53, 145–153. [Google Scholar]
- Batenipour, H.; Alfaro, M.; Kurz, D.; Graham, J. Deformations and ground temperatures at a road embankment in northern Canada. Can. Geotech. J. 2015, 51, 260–271. [Google Scholar] [CrossRef]
- Wang, J. Study on Deformation Characteristics of Embankment of Overly Wet Soil in Reconstruction and Extension of Old Road in Seasonal Frozen Area; Northeast Forestry University: Harbin, China, 2018. [Google Scholar]
- Liang, B.; Wei, C.; Zhang, X.; Zhang, P. Prediction of Frost Heave Deformation of High-speed Railway Subgrade Based on Dynamic GM-Markov Optimization Model. Subgrade Eng. 2022, 4, 7–12. [Google Scholar]
- Luo, X.; Yu, Q.; Ma, Q.; Guo, L. Study on the heat and deformation characteristics of an expressway embankment with shady and sunny slopes in warm and ice-rich permafrost regions. Transp. Geotech. 2020, 24, 100390. [Google Scholar] [CrossRef]
- Hu, T.; Wang, L. Ground source heat pump heating of embankments in cold regionsto eliminate frost heave. J. Tsinghua Univ. (Sci. Technol.) 2022, 62, 871–880. [Google Scholar]
- He, B. Experimental Study on Frost Heaving Characteristics of the Embankment Filler of Jungar Banner-Shenchi Railway. J. Water Resour. Archit. Eng. 2022, 20, 160–165+216. [Google Scholar]
- Zhang, H.T.; Yang, L.Q.; Guo, F. Solution and Analysis of Dynamic Response for Layered Pavement Structure Based on PIM. J. Chongqing Jiaotong Univ. (Nat. Sci.) 2022, 41, 82–91. [Google Scholar]
- Liang, N. Study on the Deformation and Stability of Highway Embankment in Permafrost Region under the Condition of Climate Warming; Chongqing Jiaotong University: Chongqing, China, 2018. [Google Scholar]
- Wang, Y.; Peng, C. Prevention and control technology of longitudinal cracks at new and old road splices in highway widening projects. Transp. World 2019, 65–66. [Google Scholar]
- Zhang, C.; Wang, H.; You, Z.; Ma, B. Sensitivity analysis of longitudinal cracking on asphalt pavement using MEPDG in permafrost region. J. Transp.-Tion Eng. Engl. Ed. 2015, 2, 40–47. [Google Scholar] [CrossRef]
- Cao, J.; Shen, T.; Li, R. Analysis of longitudinal cracks in asphalt pavement of highway reconstruction and expansion in severe cold interval. Highway 2021, 66, 368–371. [Google Scholar]
- Zhou, J. Investigation, Investigation Analysis and Research of Typical Diseases of Longitudinal Cracks on Expressways in Liaoning Province. North. Commun. 2019, 12, 51–54. [Google Scholar]
- Chang, Y.; Yu, Q.; You, Y.; Guo, L. Formation mechanism of longitudinal cracks in expressway em-bankments with inclined thermosyphons in warm and ice-rich permafrost regions. Appl. Therm. Eng. Des. Process. Equip. Econ. 2017, 133, 21–32. [Google Scholar] [CrossRef]
- Chai, M.; Mu, Y.; Zhang, J.; Ma, W.; Liu, G.; Chen, J. Characteristics of Asphalt Pavement Damage in De-grading Permafrost Regions: Case Study of the Qinghai–Tibet Highway, China. J. Cold Reg. Eng. 2018, 32, 05018003. [Google Scholar] [CrossRef]
- Linares C, M. Effect of freeze-thaw cycles on low temperature performance of asphalt mixtures. Transp. Res. Procedia 2020, 48, 3634–3641. [Google Scholar]
- Li, G.Y.; Ma, W.; Wang, F.; Mu, Y. Processes and mechanisms of multi-collapse of loess roads in seasonally frozen ground regions: A review. Sci. Cold Arid. Reg. 2015, 7, 456–468. [Google Scholar]
- Liu, J.; Tai, B.; Fang, J. Ground temperature and deformation analysis for an expressway embankment in warm permafrost regions of the Tibet plateau. Permafr. Periglac. Process. 2019, 30, 208–221. [Google Scholar] [CrossRef]
- Simonsen, E.; Isacsson, U. Thaw weakening of pavement structures in cold regions. Cold Reg. Sci. Technol. 1999, 29, 135–151. [Google Scholar] [CrossRef]
- Cheng, Y. Deformation Monitoring Technology and Stability Evaluation of Silty Clay Subgrade in Seasonal Frozen Region; Northeast Forestry University: Harbin, China, 2021. [Google Scholar]
- Zhang, Y.; Yang, W.; Li, R.; Zhao, W.; Zhang, G.; Li, P. Monitoring and Rule Analysis of Frost Heaving and Thawing Settlements of Heavy Haul Railway Roadbedin Seasonal Frozen Region. China Railw. Sci. 2022, 43, 1–10. [Google Scholar]
- Long, X.; Shen, G.; Cai, L.; Liu, J. Hydro-thermal coupling model test and field validation of uneven frost heave of pavement structure. J. Harbin Inst. Technol. 2019, 51, 172–178. [Google Scholar]


| Serial Number | Monitoring Locations | Distress Information |
|---|---|---|
| #3 | G1001 East Ring Road K68 + 150–K68 + 210 (Jiangbei direction) The monitoring sections were: G, H, and I. | There are six linear longitudinal cracks with a regular alignment, with one of them incurring map cracks accompanied by rutting. Four cracks were located in the middle lane, with staggered development at the transverse cracks. One longitudinal crack of 60 m in the inner overtaking lane ran through the investigated section. Another longitudinal crack of 46 m was distributed in the outer emergency lane. There were nine transverse cracks, predominantly long cracks, with five transverse cracks exceeding 7.5 m. |
| #4 | G1001 East Ring K88 + 166.4–K88 + 226.4 (Wapengyao direction)The monitoring sections were: J, K, and L. | There were 6 linear longitudinal cracks, 2 of 60 m, 2 in the range of 30–40 m in length, and the other 2 within 10 m in length. There were 14 transverse cracks, with 11 running through the outer emergency lane and cutting off at the location of the longitudinal cracks. The distribution of the transverse cracks was more evenly spaced and concentrated in the outer emergency lane. |
| #9 | G202 Ha Wu Road K652 + 100–K652 + 160 (Harbin direction) The monitoring sections were: Y, Z, and AAI | The longitudinal cracks struck regularly in a straight line, with only one crack of 60 m in length, one of 12 m in length, and the others being short cracks of no more than 6 m in length. Longitudinal cracks were mainly distributed in the middle lane. There were five transverse cracks, with three cracks running through the roadway and two cracks within 4–8 m in length. There was one small area of pockmark. |
| Date of Monitoring | Monitoring Time (d) | Length of Longitudinal Cracks (m) | ||
|---|---|---|---|---|
| DH Expressway K68 | DH Expressway K88 | HW Highway K652 | ||
| 20 August 2020 | 0.0 | 176.2 | 235.0 | 100.4 |
| 7 November 2020 | 77.0 | 180.3 | 238.6 | 103.2 |
| 23 February 2021 | 183.0 | 182.2 | 241.3 | 105.4 |
| 22 May 2021 | 273.0 | 183.6 | 244.0 | 106.3 |
| 16 August 2021 | 357.0 | 184.0 | 248.0 | 110.0 |
| Time Period | Longitudinal Crack Development Rate (m/10 d) | ||
|---|---|---|---|
| DH Expressway K68 | DH Expressway K88 | HW Highway K652 | |
| Aug.–Nov. | 0.53 | 0.47 | 0.36 |
| Nov.–Feb. | 0.18 | 0.25 | 0.21 |
| Feb.–May | 0.16 | 0.30 | 0.10 |
| May.–Aug. | 0.05 | 0.48 | 0.44 |
| Difference in Time-Series Elevation Change | Jan. 2021–Aug. 2020 | Feb. 2021–Jan. 2021 | Mar. 2021–Feb. 2021 | May 2021–Mar. 2021 | Jun. 2021–May 2021 | Aug. 2021–Jun. 2021 |
|---|---|---|---|---|---|---|
| G1 | 0.0404 | 0.0134 | −0.0084 | −0.0393 | −0.0036 | 0.0003 |
| G2 | 0.0405 | 0.0154 | −0.0091 | −0.0404 | −0.0037 | 0.0008 |
| G3 | 0.0427 | 0.0113 | −0.0137 | −0.0346 | −0.0034 | 0.0002 |
| G4 | 0.0462 | 0.0100 | −0.0159 | −0.0343 | −0.0063 | 0.0030 |
| G5 | 0.0490 | 0.0089 | −0.0146 | −0.0397 | −0.0075 | 0.0042 |
| G6 | 0.0456 | 0.0115 | −0.0042 | −0.0492 | −0.0082 | 0.0068 |
| H1 | 0.0523 | 0.0026 | −0.0062 | −0.0412 | −0.0064 | 0.003 |
| H2 | 0.0510 | 0.0053 | −0.0119 | −0.0348 | −0.0081 | 0.0027 |
| H3 | 0.0459 | 0.0072 | −0.0161 | −0.0294 | −0.0085 | 0.0026 |
| H4 | 0.0458 | 0.0076 | −0.0129 | −0.0324 | −0.0089 | 0.0041 |
| H5 | 0.0427 | 0.0113 | −0.0101 | −0.0371 | −0.0080 | 0.0047 |
| H6 | 0.0379 | 0.0103 | −0.006 | −0.0353 | −0.0106 | 0.0080 |
| I1 | 0.0612 | 0.0014 | −0.0081 | −0.0427 | −0.0094 | 0.0047 |
| I2 | 0.0637 | 0.0005 | 0.0089 | −0.0595 | −0.0110 | 0.0054 |
| I3 | 0.0556 | 0.0013 | 0.0090 | −0.0560 | −0.0084 | 0.0044 |
| I4 | 0.0562 | 0.0010 | −0.0157 | −0.0303 | −0.0118 | 0.0066 |
| I5 | 0.0541 | 0.0067 | −0.0120 | −0.0401 | −0.0085 | 0.0064 |
| I6 | 0.0455 | 0.0104 | −0.0072 | −0.0413 | −0.0094 | 0.0084 |
| J1 | 0.1197 | 0.0556 | 0.0024 | −0.1776 | −0.0008 | −0.0528 |
| J2 | 0.1408 | 0.0604 | 0.002 | −0.2037 | −0.0026 | −0.0524 |
| J3 | 0.1514 | 0.0628 | 0.0002 | −0.2173 | −0.0027 | −0.0498 |
| J4 | 0.1498 | 0.0595 | −0.0004 | −0.2100 | −0.0030 | −0.0508 |
| J5 | 0.1511 | 0.0575 | 0.0020 | −0.2042 | −0.0043 | −0.0508 |
| J6 | 0.1412 | 0.0520 | 0.0021 | −0.1898 | −0.0046 | −0.0513 |
| K1 | 0.0991 | 0.0364 | −0.0010 | −0.1379 | −0.0003 | −0.0541 |
| K2 | 0.1006 | 0.0352 | −0.0010 | −0.1384 | −0.0026 | −0.0519 |
| K3 | 0.1033 | 0.0343 | −0.0017 | −0.1392 | −0.0004 | −0.0539 |
| K4 | 0.0920 | 0.0333 | −0.0012 | −0.1303 | −0.0007 | −0.0533 |
| K5 | 0.0869 | 0.0313 | −0.0028 | −0.1083 | −0.0043 | −0.0545 |
| K6 | 0.1107 | −0.0065 | −0.0039 | −0.0966 | −0.0011 | −0.0557 |
| L1 | 0.1019 | 0.0561 | −0.0037 | −0.1491 | 0.0003 | −0.0011 |
| L2 | 0.1103 | 0.0624 | −0.0031 | −0.1688 | 0.0025 | −0.0026 |
| L3 | 0.1070 | 0.0596 | 0.0006 | −0.1677 | 0.0012 | −0.0006 |
| L4 | 0.1070 | 0.0536 | −0.0012 | −0.1609 | 0.0002 | 0.0006 |
| L5 | 0.1120 | 0.0458 | −0.0043 | −0.1481 | −0.0014 | 0.0009 |
| L6 | 0.1100 | 0.0413 | −0.0054 | −0.1393 | 0.0006 | −0.0018 |
| Y1 | 0.0239 | −0.0017 | −0.0069 | −0.0493 | −0.0226 | 0.0232 |
| Y2 | 0.0283 | 0.0016 | 0.0011 | −0.0620 | −0.0214 | 0.0196 |
| Y3 | 0.0358 | −0.0009 | −0.0003 | −0.0677 | −0.0209 | 0.0201 |
| Y4 | 0.0333 | −0.0014 | 0.0002 | −0.0653 | −0.0208 | 0.0201 |
| Y5 | 0.0250 | −0.0012 | 0.0008 | −0.0544 | −0.0038 | 0.0025 |
| Y6 | 0.0148 | 0.003 | 0.0009 | −0.0512 | −0.0011 | 0.0039 |
| Z1 | 0.0223 | 0.0062 | 0.0020 | −0.0607 | 0.0005 | −0.0012 |
| Z2 | 0.0308 | 0.0039 | 0.0030 | −0.0706 | 0.0022 | 0.0020 |
| Z3 | 0.0404 | −0.0006 | 0.0022 | −0.0734 | 0.0006 | 0.0009 |
| Z4 | 0.0413 | −0.0030 | 0.0009 | −0.0710 | 0.0011 | 0.0018 |
| Z5 | 0.0354 | −0.0063 | 0.0023 | −0.0624 | −0.0027 | 0.0059 |
| Z6 | 0.0261 | −0.0044 | 0.0004 | −0.0532 | 0.0004 | 0.0032 |
| AA1 | 0.0380 | −0.0034 | −0.0017 | −0.0667 | 0.0003 | 0.0051 |
| AA2 | 0.0433 | −0.0014 | −0.0032 | −0.0741 | 0.0040 | 0.0036 |
| AA3 | 0.0462 | −0.0056 | −0.0022 | −0.0777 | 0.0006 | 0.0065 |
| AA4 | 0.0519 | −0.0030 | −0.0032 | −0.0859 | 0.0067 | 0.0049 |
| AA5 | 0.0437 | −0.0028 | −0.0008 | −0.0745 | 0.0017 | 0.0051 |
| AA6 | 0.0350 | −0.0014 | −0.0002 | −0.0659 | −0.0008 | 0.0075 |
| Cross-Section | Jan. 2021–Aug. 2020 | Feb. 2021–Jan. 2021 | Mar. 2021–Feb. 2021 | May 2021–Mar. 2021 | Jun. 2021–May 2021 | Aug. 2021–Jun. 2021 |
|---|---|---|---|---|---|---|
| G | 0.0031 | 0.0021 | 0.0041 | 0.0049 | 0.0020 | 0.0024 |
| H | 0.0049 | 0.0029 | 0.0036 | 0.0037 | 0.0012 | 0.0019 |
| I | 0.0058 | 0.0037 | 0.0097 | 0.0099 | 0.0013 | 0.0013 |
| J | 0.0110 | 0.0035 | 0.0011 | 0.0131 | 0.0012 | 0.0010 |
| K | 0.0077 | 0.0152 | 0.0011 | 0.0166 | 0.0014 | 0.0012 |
| L | 0.0033 | 0.0074 | 0.0020 | 0.0109 | 0.0012 | 0.0012 |
| Y | 0.0093 | 0.0031 | 0.0024 | 0.0095 | 0.0095 | 0.0074 |
| Z | 0.0070 | 0.0045 | 0.0009 | 0.0071 | 0.0015 | 0.0022 |
| AA | 0.0055 | 0.0014 | 0.0011 | 0.0068 | 0.0025 | 0.0012 |
| Points | Standard Deviation | Points | Standard Deviation | Points | Standard Deviation |
|---|---|---|---|---|---|
| G1 | 0.0239 | J1 | 0.0924 | Y1 | 0.0255 |
| G2 | 0.0245 | J2 | 0.1058 | Y2 | 0.0298 |
| G3 | 0.0236 | J3 | 0.1126 | Y3 | 0.0330 |
| G4 | 0.0249 | J4 | 0.1097 | Y4 | 0.0317 |
| G5 | 0.0269 | J5 | 0.1080 | Y5 | 0.0240 |
| G6 | 0.0282 | J6 | 0.1007 | Y6 | 0.0213 |
| H1 | 0.0275 | K1 | 0.0736 | Z1 | 0.0260 |
| H2 | 0.0260 | K2 | 0.0738 | Z2 | 0.0312 |
| H3 | 0.0237 | K3 | 0.0748 | Z3 | 0.0339 |
| H4 | 0.0240 | K4 | 0.0693 | Z4 | 0.0332 |
| H5 | 0.0242 | K5 | 0.0617 | Z5 | 0.0292 |
| H6 | 0.0224 | K6 | 0.0636 | Z6 | 0.0239 |
| I1 | 0.0309 | L1 | 0.0772 | AA1 | 0.0311 |
| I2 | 0.0361 | L2 | 0.0862 | AA2 | 0.0348 |
| I3 | 0.0326 | L3 | 0.0848 | AA3 | 0.0367 |
| I4 | 0.0274 | L4 | 0.0819 | AA4 | 0.0409 |
| I5 | 0.0284 | L5 | 0.0781 | AA5 | 0.0350 |
| I6 | 0.0261 | L6 | 0.0744 | AA6 | 0.0303 |
| Longitudinal Number | East Ring K 68 Filling | East Ring K 88 Excavation | Ha-wu Filling |
|---|---|---|---|
| 1 | 0.0273 | 0.0810 | 0.0277 |
| 2 | 0.0290 | 0.0887 | 0.0320 |
| 3 | 0.0267 | 0.0907 | 0.0343 |
| 4 | 0.0253 | 0.0870 | 0.0353 |
| 5 | 0.0263 | 0.0827 | 0.0293 |
| 6 | 0.0257 | 0.0797 | 0.0250 |
| Section longitudinal activity | 0.0269 | 0.0860 | 0.0317 |
| Longitudinal Number | Total Activity/m | Three Section Analysis | East Ring K68 Filling | East Ring K88 Excavation | Ha-wu Filling |
|---|---|---|---|---|---|
| 1 | 0.045 | Slightly active | Most active | Slightly active | Slightly active |
| 2 | 0.050 | Most active | Most active | Most active | Moderately active |
| 3 | 0.051 | Most active | Moderately active | Most active | Most active |
| 4 | 0.049 | Moderately active | Least active | Moderately active | Most active |
| 5 | 0.046 | Slightly active | Slightly active | Slightly active | Slightly active |
| 6 | 0.043 | Least active | Slightly active | Least active | Least active |
| Longitudinal Number | 1 Longitudinal Line | 2 Longitudinal Lines | 3 Longitudinal Lines | 4 Longitudinal Lines | 5 Longitudinal Lines | 6 Longitudinal Lines | ||||
|---|---|---|---|---|---|---|---|---|---|---|
| Total activity(m) | 0.0453 | 0.0499 | 0.0506 | 0.0492 | 0.0461 | 0.0434 | ||||
| Point Intervals | 1–2 | 2–3 | 3–4 | 4–5 | 5–6 | |||||
| Interval activity(m) | 0.0476 | 0.0502 | 0.0499 | 0.0477 | 0.0448 | |||||
| Length of longitudinal cracks(m) | 140 | 345 | 498 | 193 | 118 | |||||
| Section | Jan. 2021–Aug. 2020 | Feb. 2021–Jan. 2021 | Mar. 2021–Feb. 2021 | May 2021–Mar. 2021 | Jun. 2021–May 2021 | Aug. 2021–Jun. 2021 |
|---|---|---|---|---|---|---|
| DH expressway K68 | 0.0046 | 0.0029 | 0.0058 | 0.0062 | 0.0015 | 0.0019 |
| DH expressway K88 | 0.0073 | 0.0087 | 0.0014 | 0.0136 | 0.0013 | 0.0011 |
| HW expressway K652 | 0.0073 | 0.0030 | 0.0015 | 0.0078 | 0.0045 | 0.0036 |
| Time Period | Longitudinal Crack Development Rate (m/10d) | Activity (m) | ||||
|---|---|---|---|---|---|---|
| DH Expressway K68 | DH Expressway K88 | HW Highway K652 | DH Expressway K68 | DH Expressway K88 | HW Highway K652 | |
| Aug.–Nov.–Feb. | 0.3300 | 0.3400 | 0.2700 | 0.0038 | 0.0080 | 0.0052 |
| Feb.–May | 0.1600 | 0.300 | 0.1000 | 0.0060 | 0.0075 | 0.0047 |
| May to Aug. | 0.0500 | 0.4800 | 0.4400 | 0.0017 | 0.0012 | 0.00405 |
Disclaimer/Publisher’s Note: The statements, opinions and data contained in all publications are solely those of the individual author(s) and contributor(s) and not of MDPI and/or the editor(s). MDPI and/or the editor(s) disclaim responsibility for any injury to people or property resulting from any ideas, methods, instructions or products referred to in the content. |
© 2023 by the authors. Licensee MDPI, Basel, Switzerland. This article is an open access article distributed under the terms and conditions of the Creative Commons Attribution (CC BY) license (https://creativecommons.org/licenses/by/4.0/).
Share and Cite
Wang, H.; Ji, L.; Zhang, H.; Lou, Y.; Xu, L.; Tan, Y. Indicator Construction of Road Surface Deformation Activity in Cold Regions and Its Relationship with the Distribution and Development of Longitudinal Cracks. Sustainability 2023, 15, 15466. https://doi.org/10.3390/su152115466
Wang H, Ji L, Zhang H, Lou Y, Xu L, Tan Y. Indicator Construction of Road Surface Deformation Activity in Cold Regions and Its Relationship with the Distribution and Development of Longitudinal Cracks. Sustainability. 2023; 15(21):15466. https://doi.org/10.3390/su152115466
Chicago/Turabian StyleWang, Hao, Lun Ji, Hongju Zhang, Yuqi Lou, Linlin Xu, and Yiqiu Tan. 2023. "Indicator Construction of Road Surface Deformation Activity in Cold Regions and Its Relationship with the Distribution and Development of Longitudinal Cracks" Sustainability 15, no. 21: 15466. https://doi.org/10.3390/su152115466
APA StyleWang, H., Ji, L., Zhang, H., Lou, Y., Xu, L., & Tan, Y. (2023). Indicator Construction of Road Surface Deformation Activity in Cold Regions and Its Relationship with the Distribution and Development of Longitudinal Cracks. Sustainability, 15(21), 15466. https://doi.org/10.3390/su152115466