
Identifying the Critical Supply Chains for Black Carbon and CO2 in the Sichuan Urban Agglomeration of Southwest China

 ,
, 
Abstract
:1. Introduction
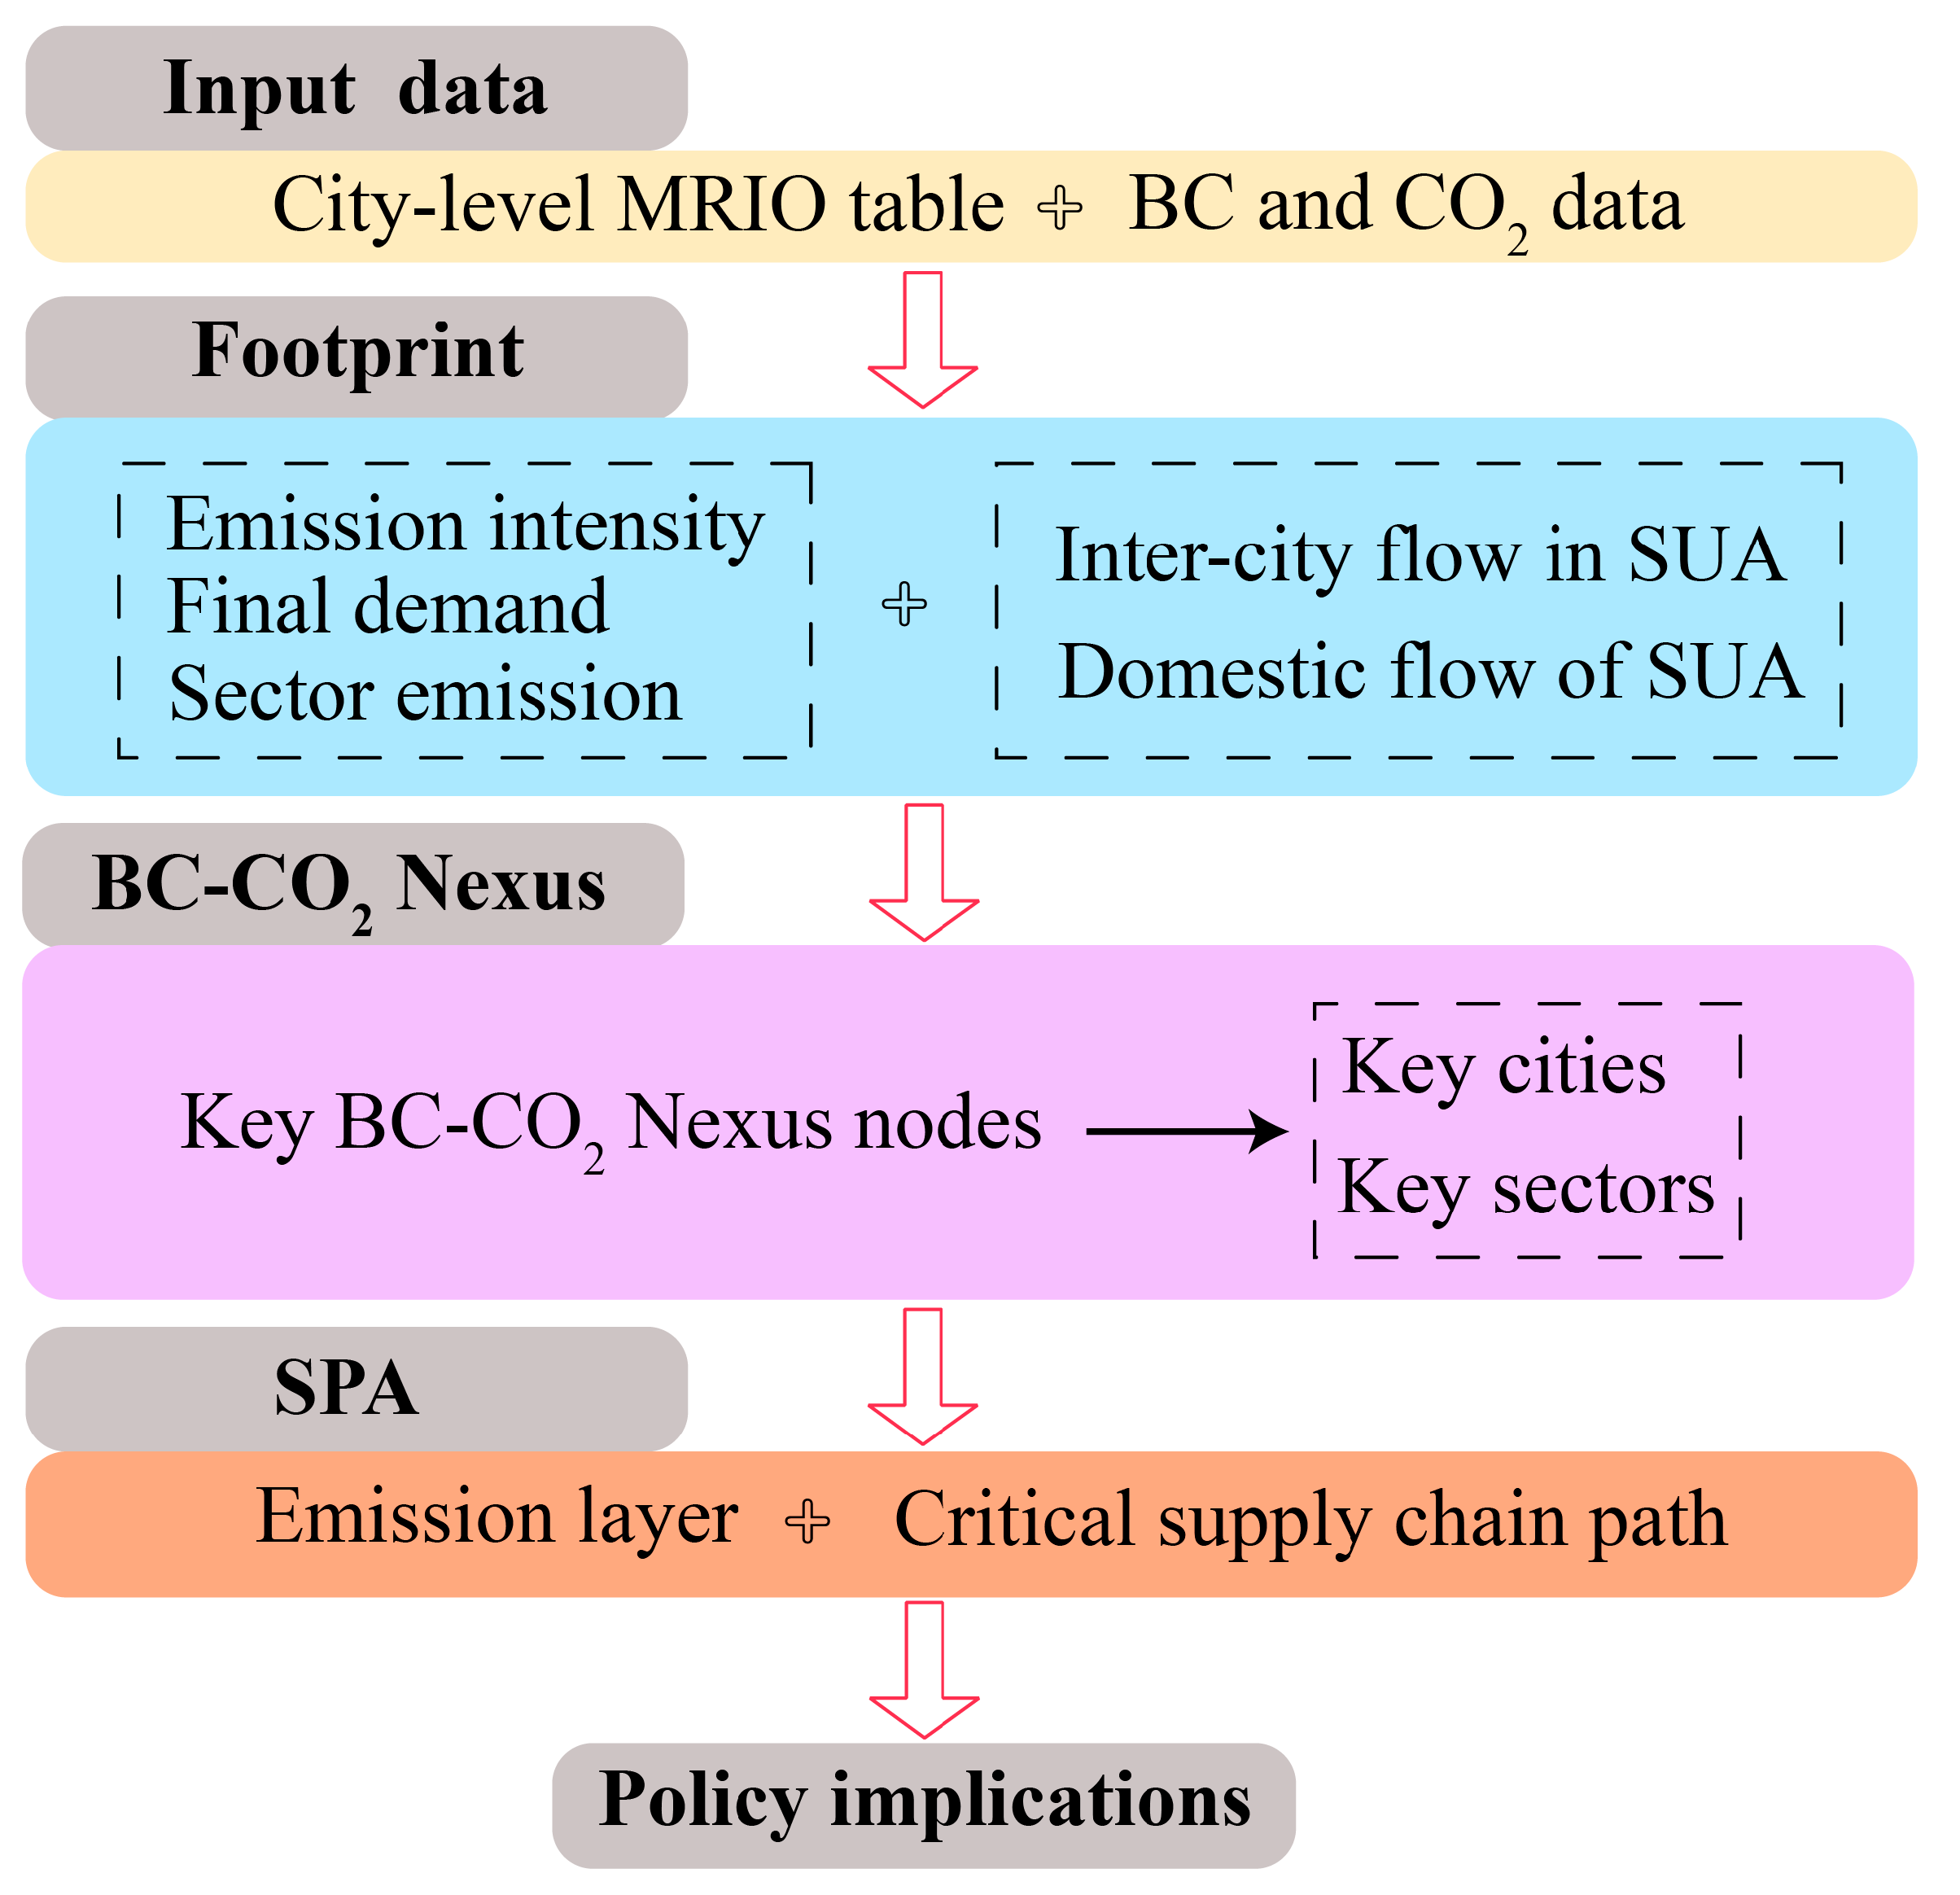
2. Methods
2.1. BC and CO2 Footprint Calculation
2.1.1. Environmentally Extended Input–Output Analysis
2.1.2. Identification of BC–CO2 Nexus Nodes
2.1.3. Structural Path Analysis
2.2. Data Sources
3. Results
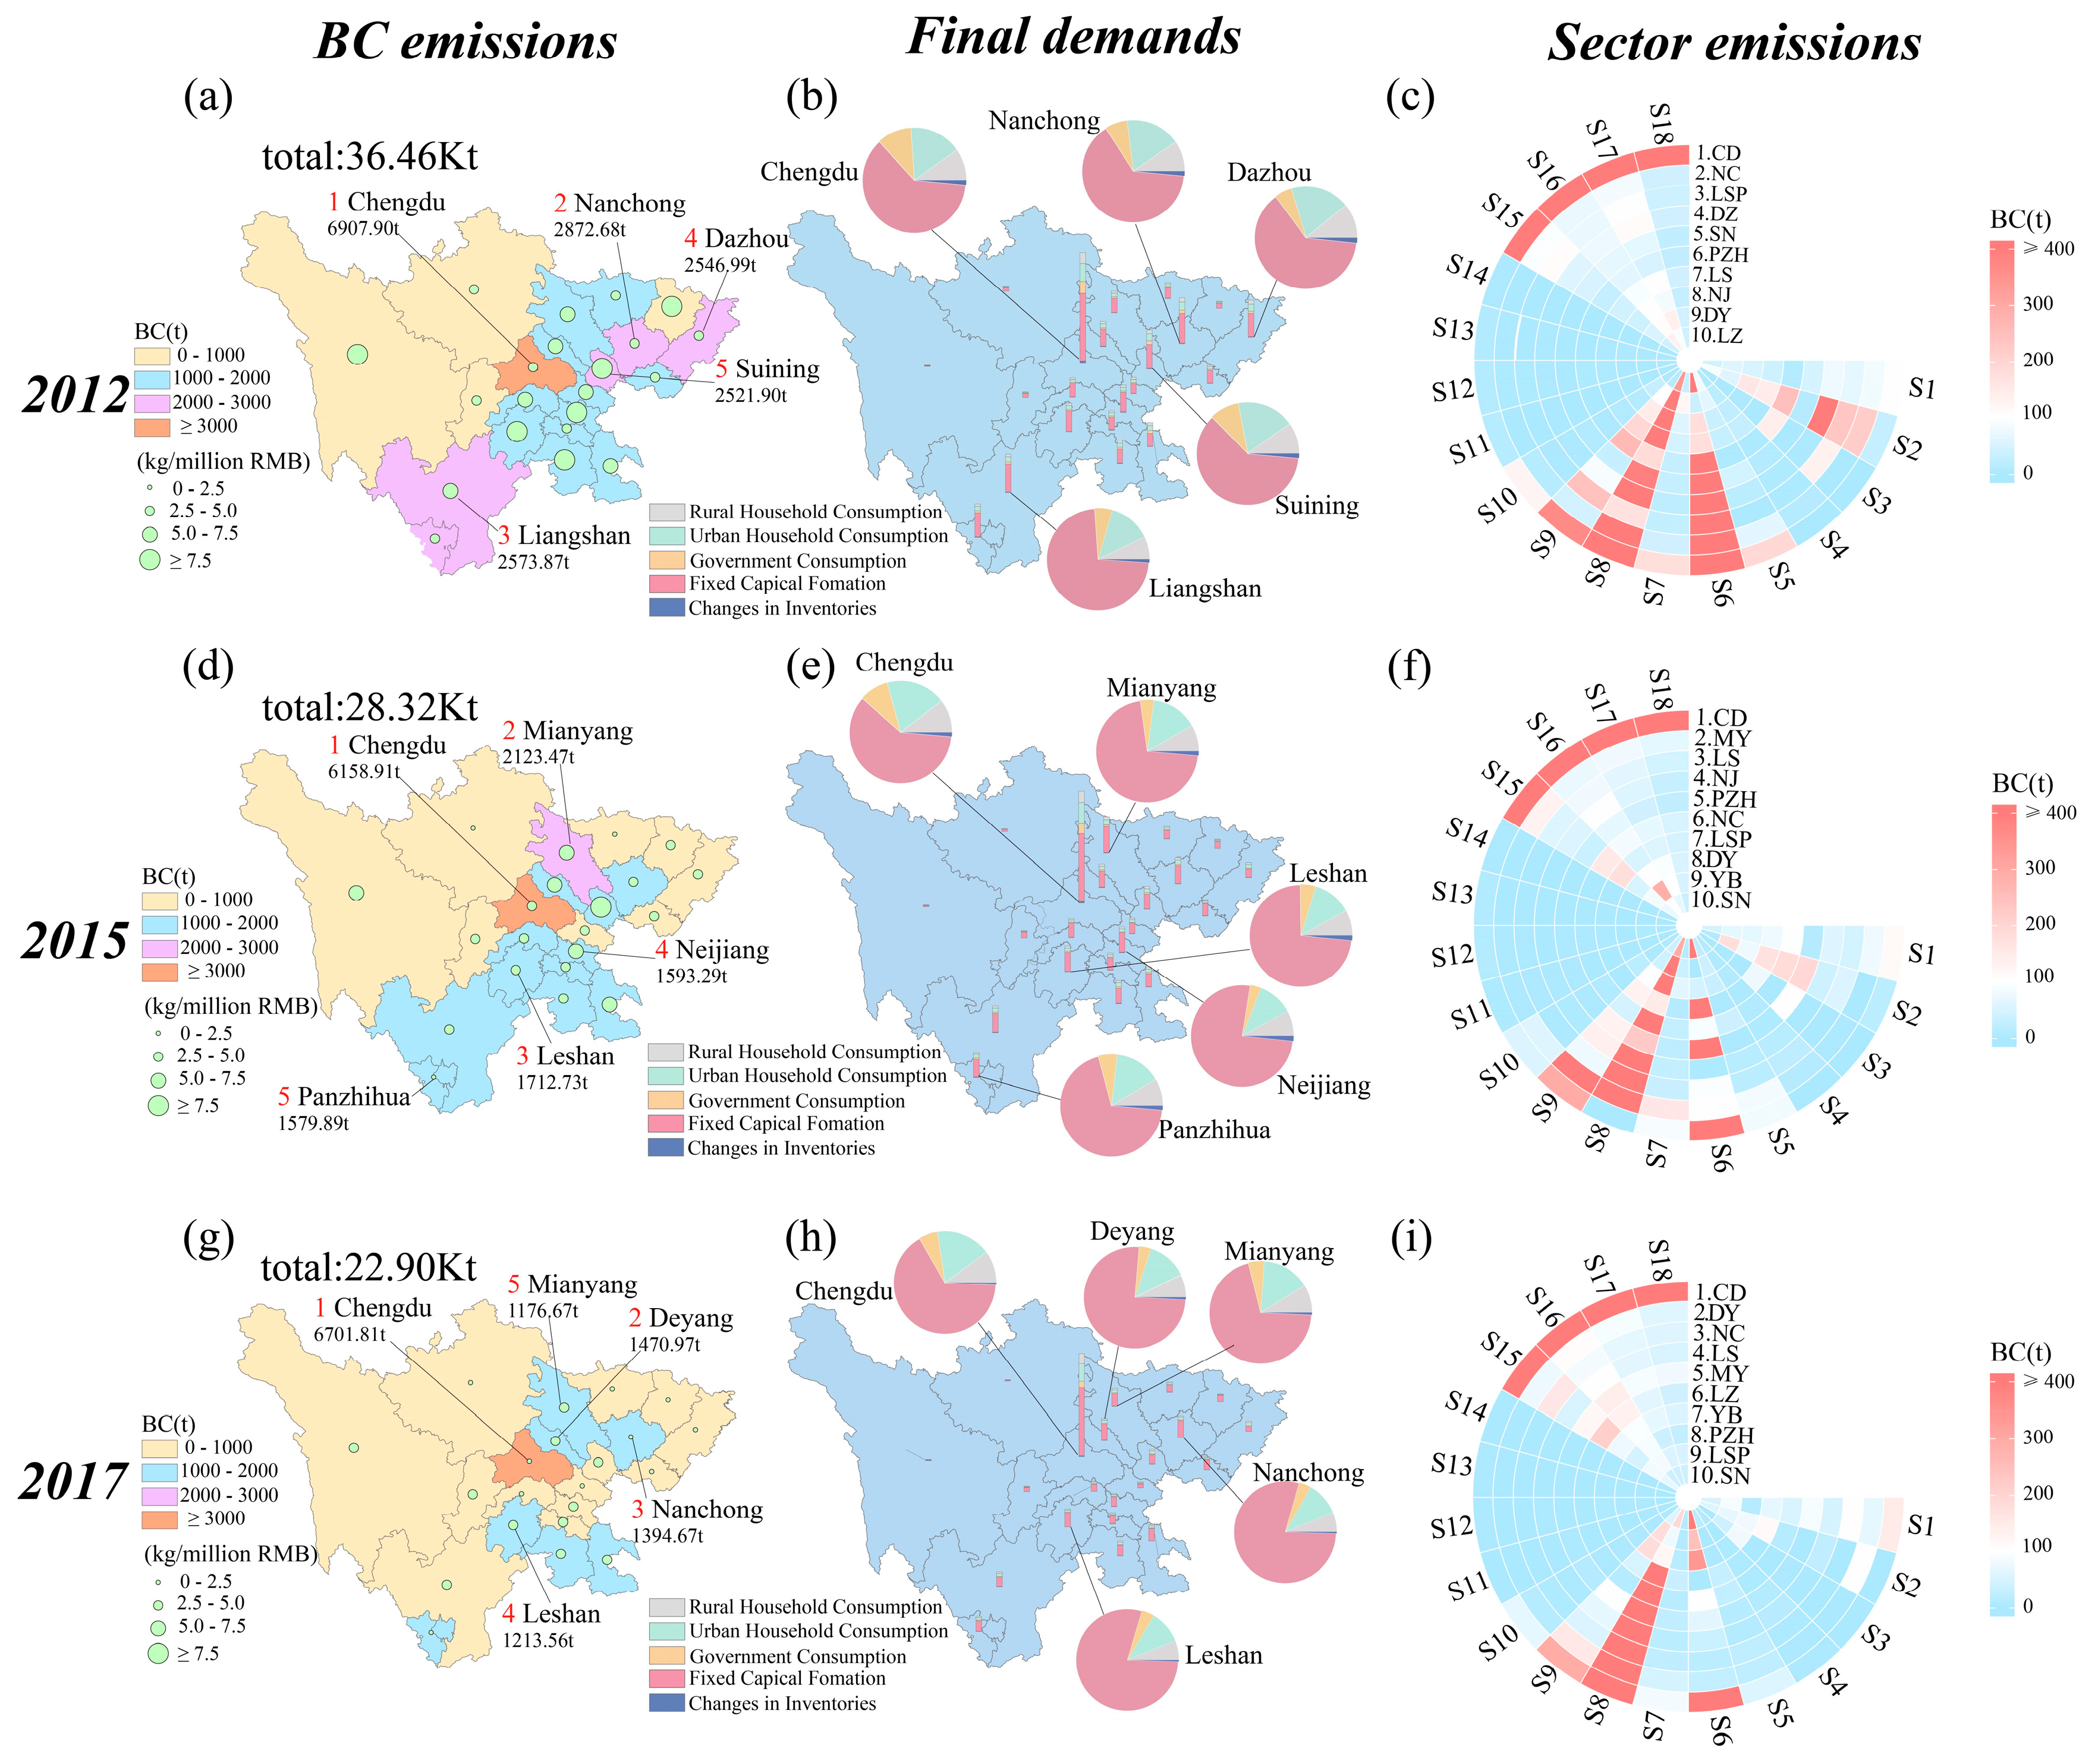
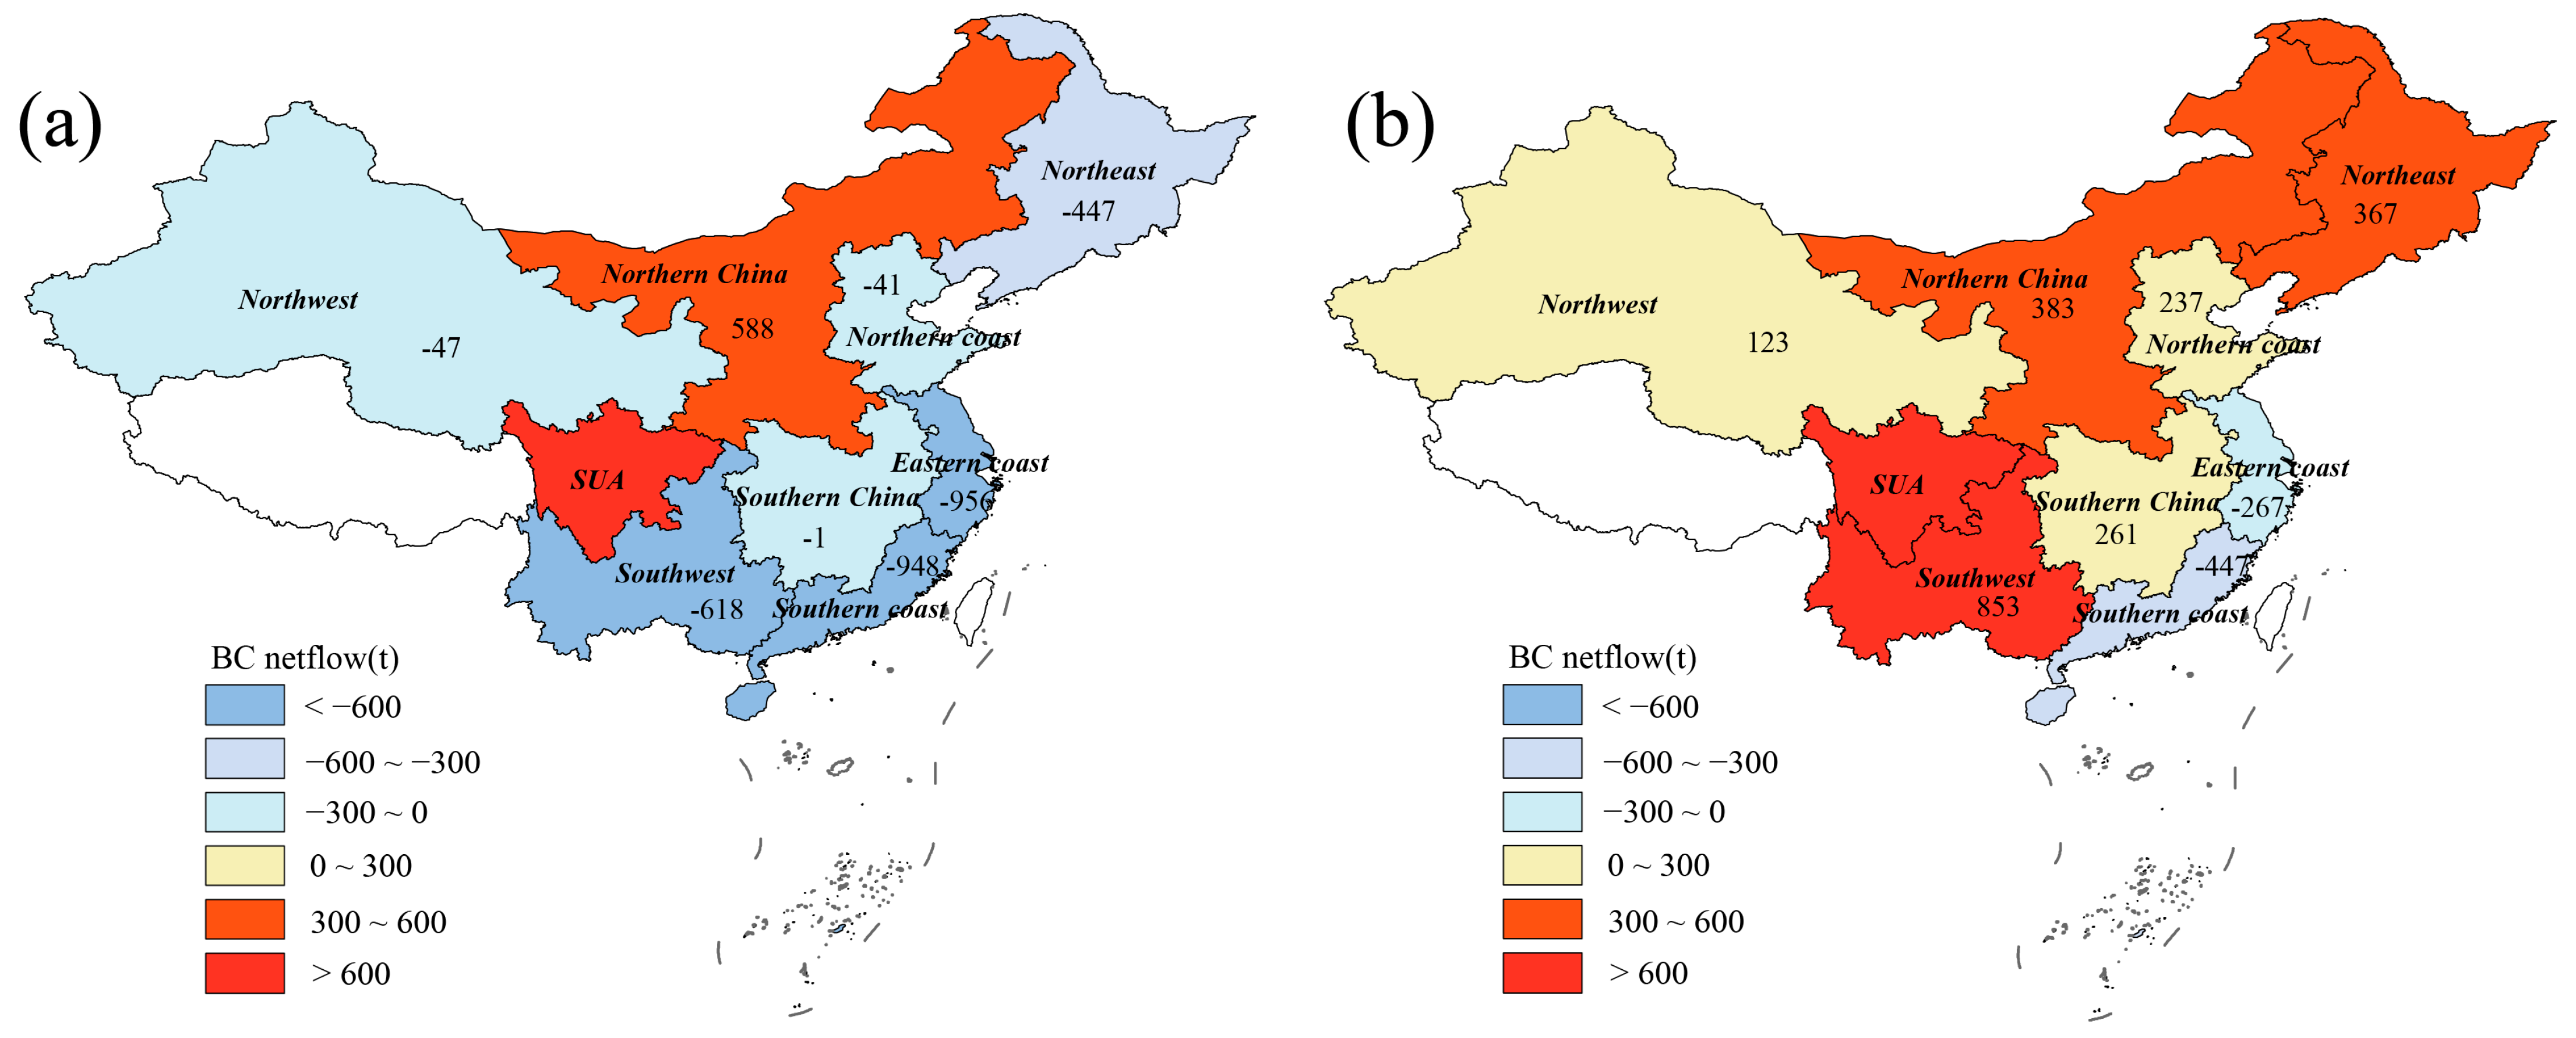
3.1. BC and CO2 Footprints and Interregional Flow
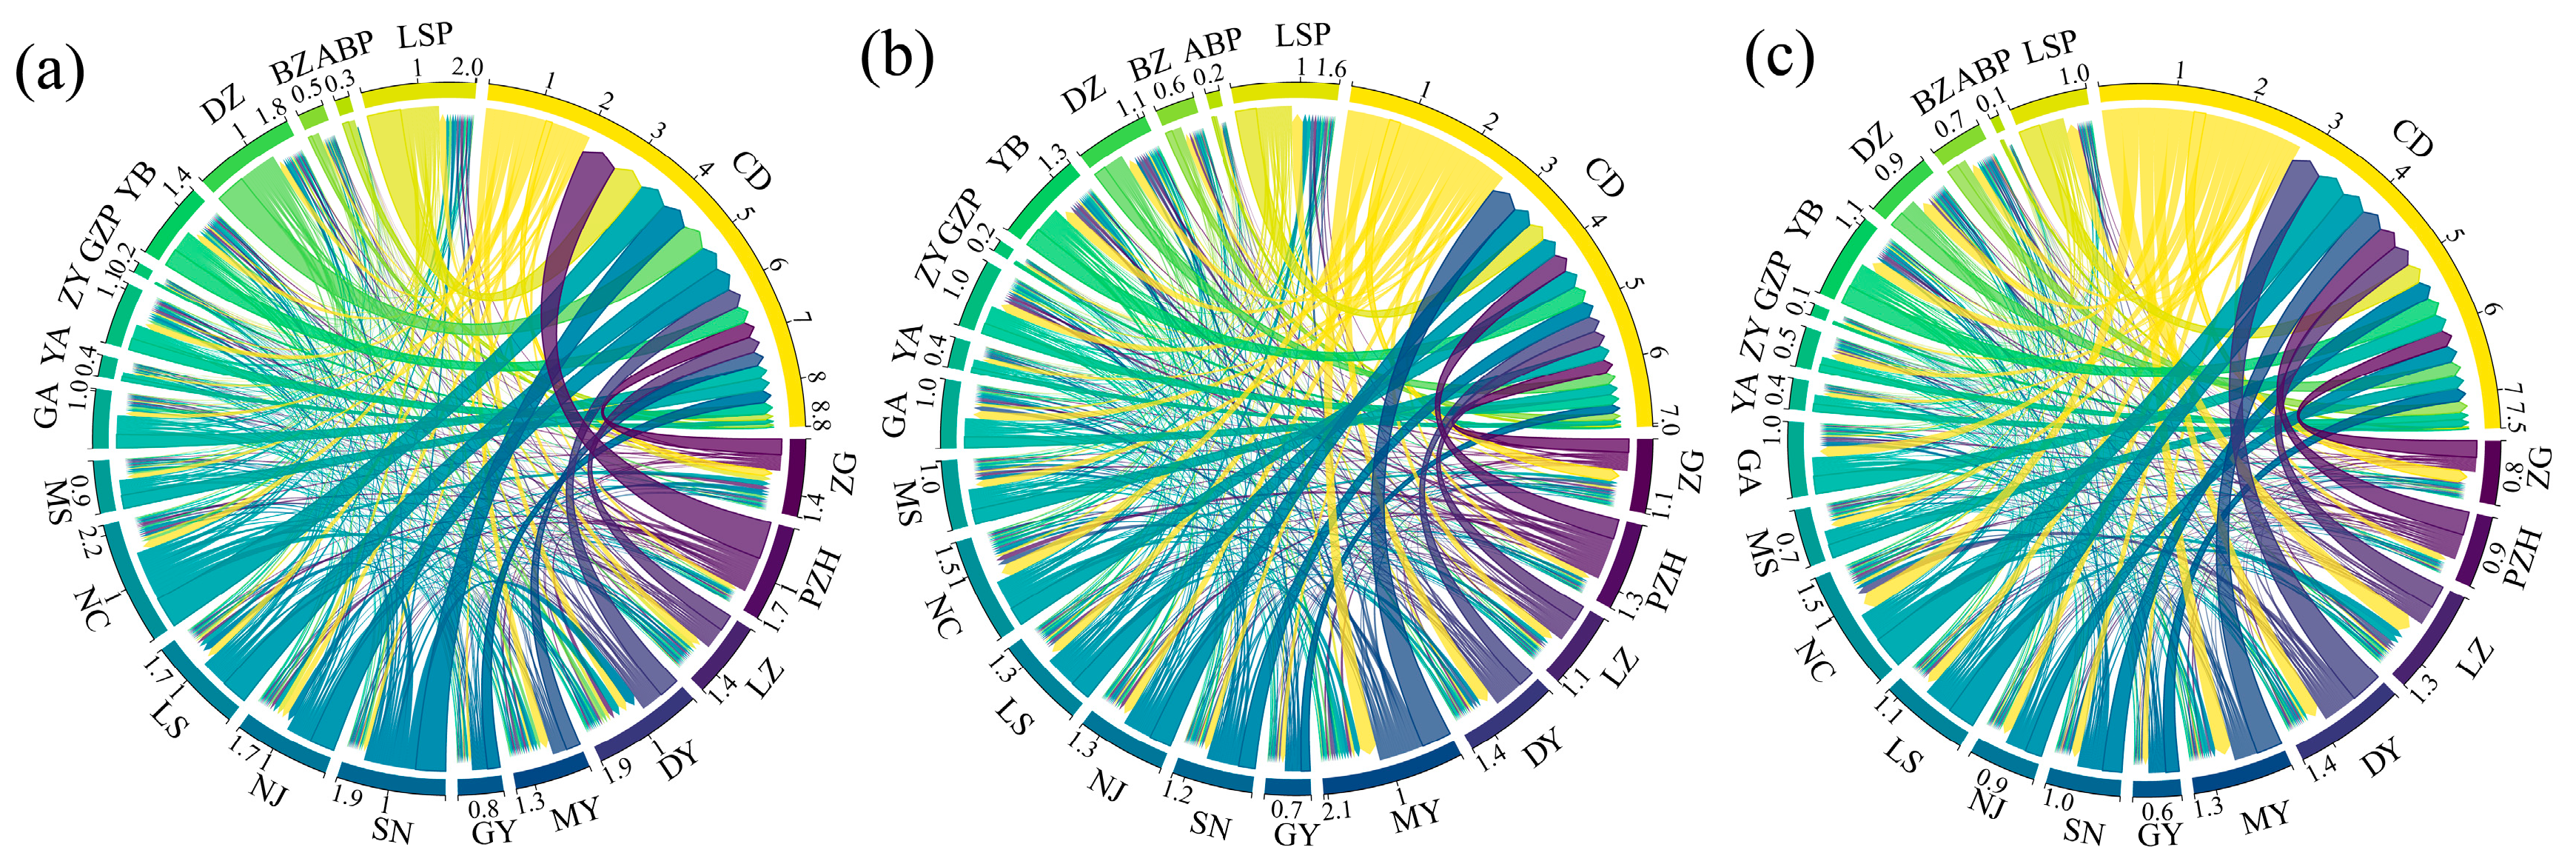
3.2. BC–CO2 Nexus
3.3. Structural Path Analysis
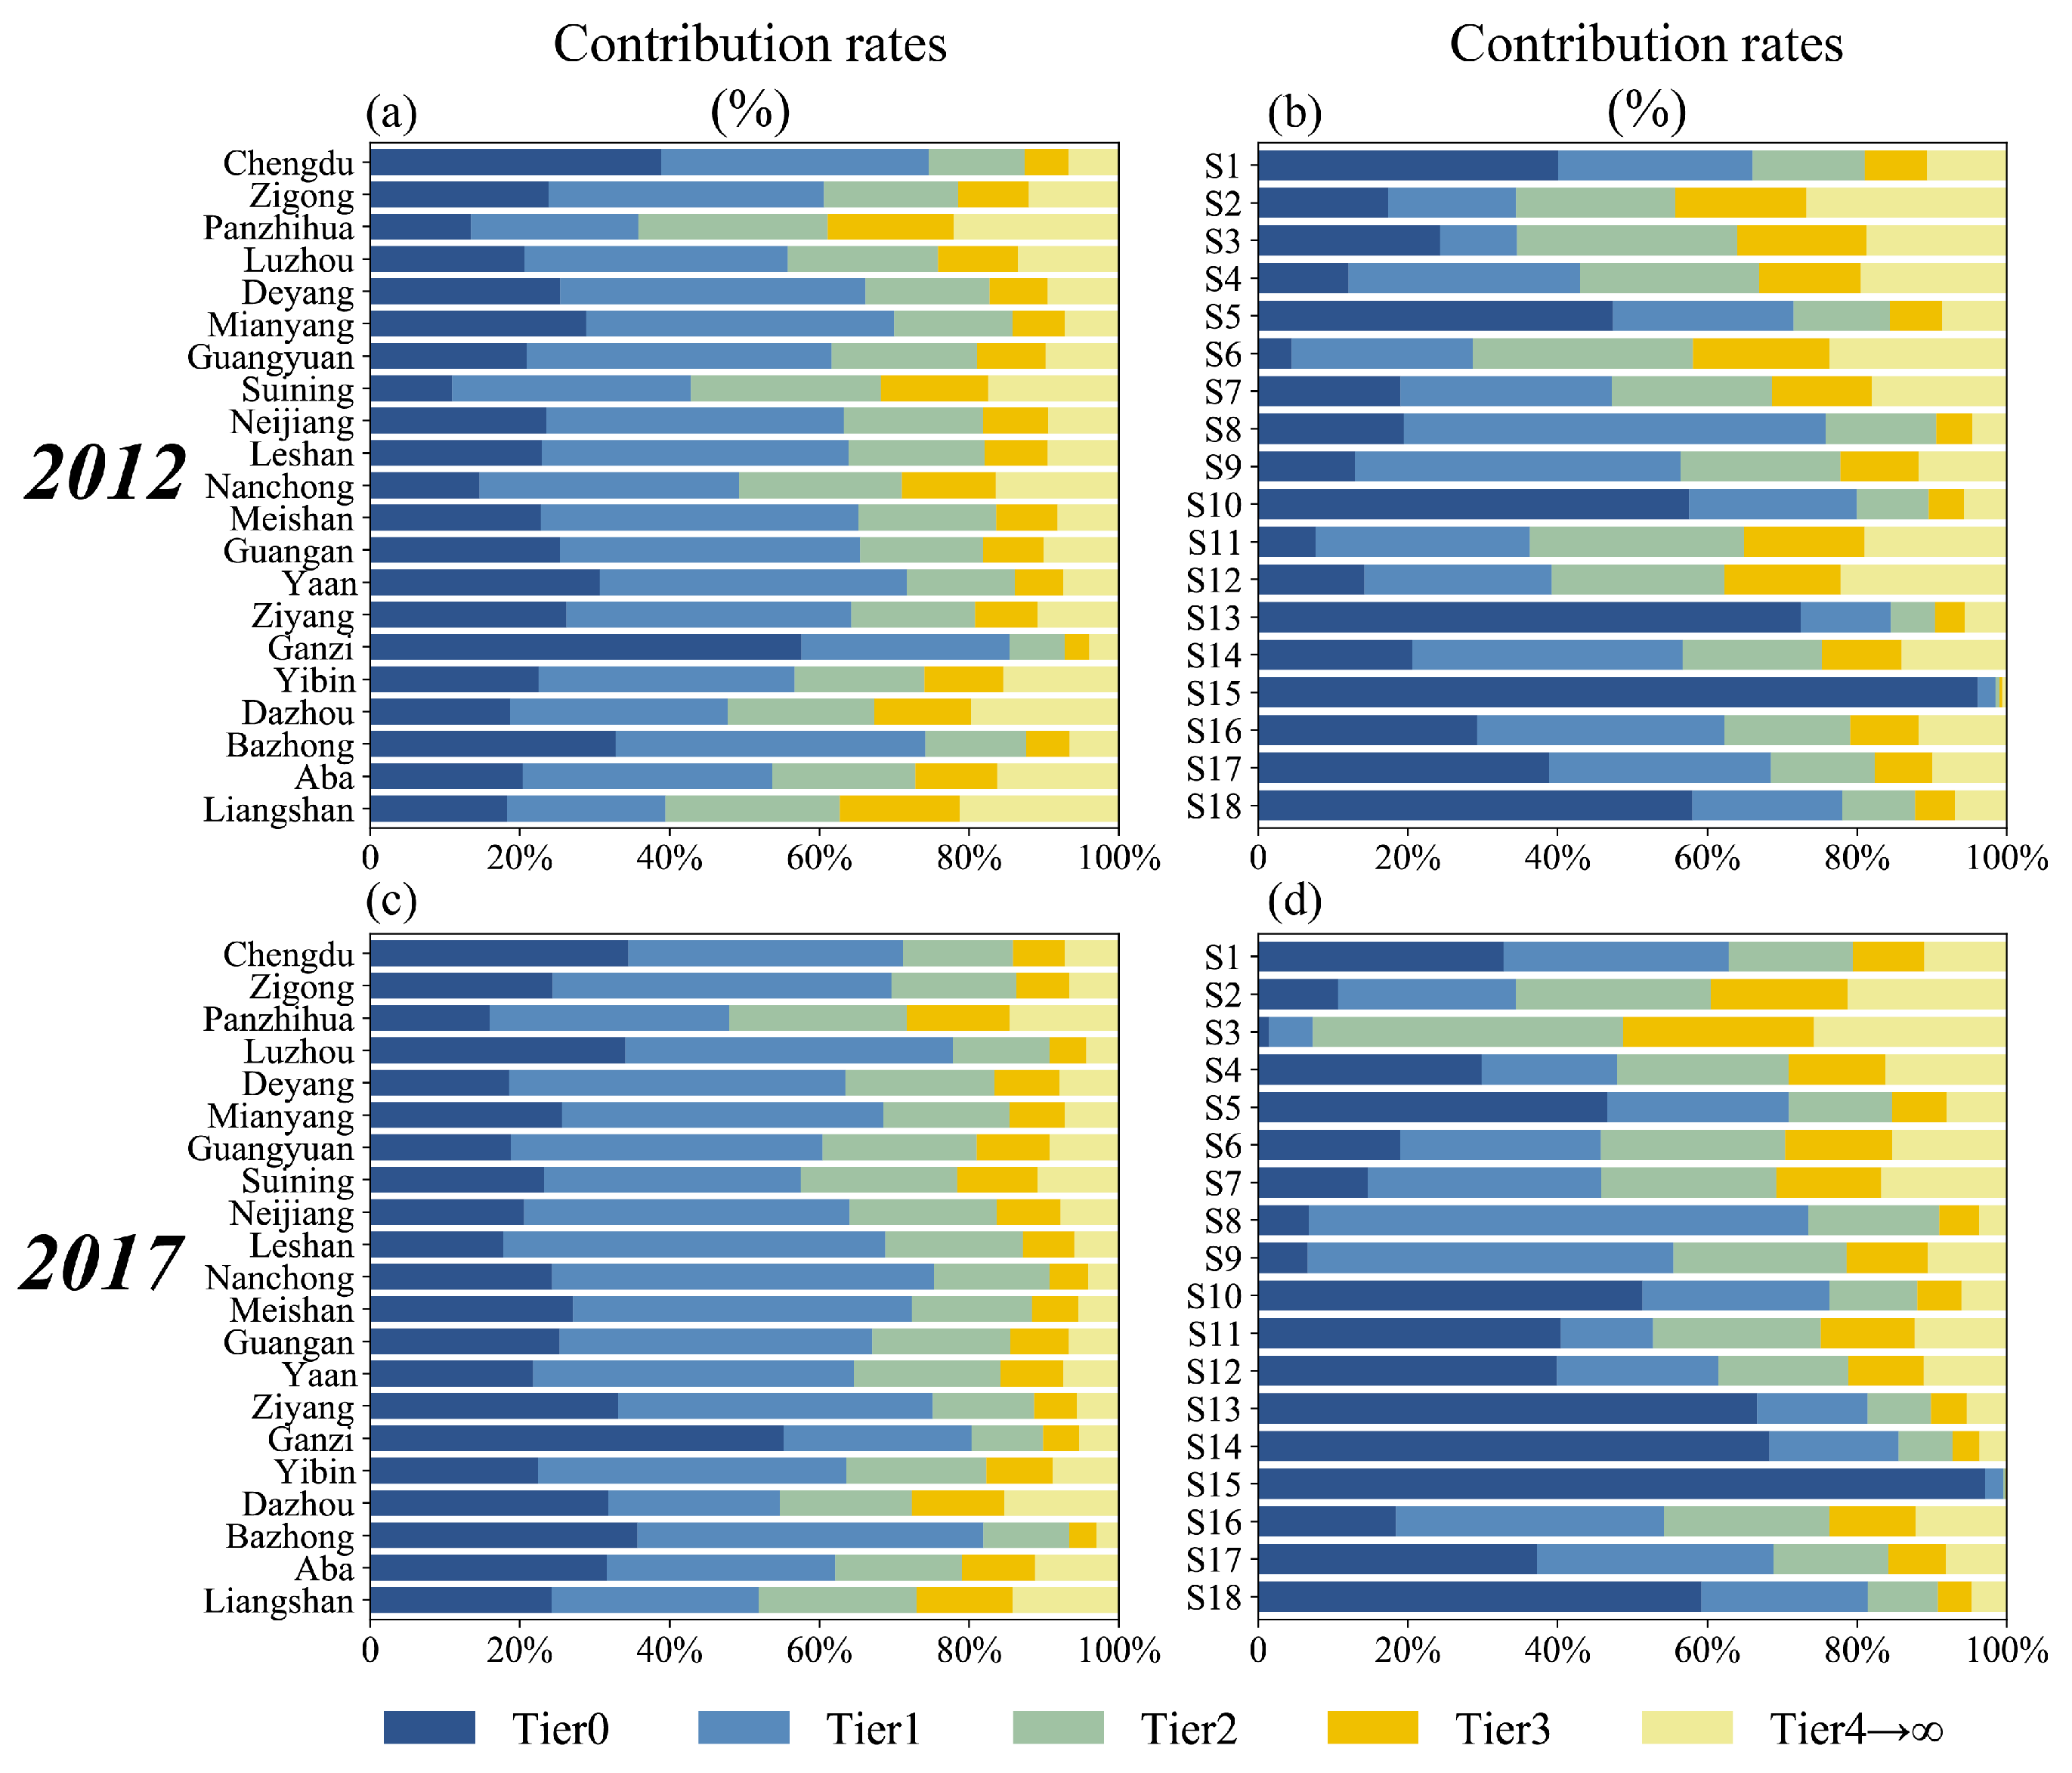
3.3.1. Distribution of Emission Layers
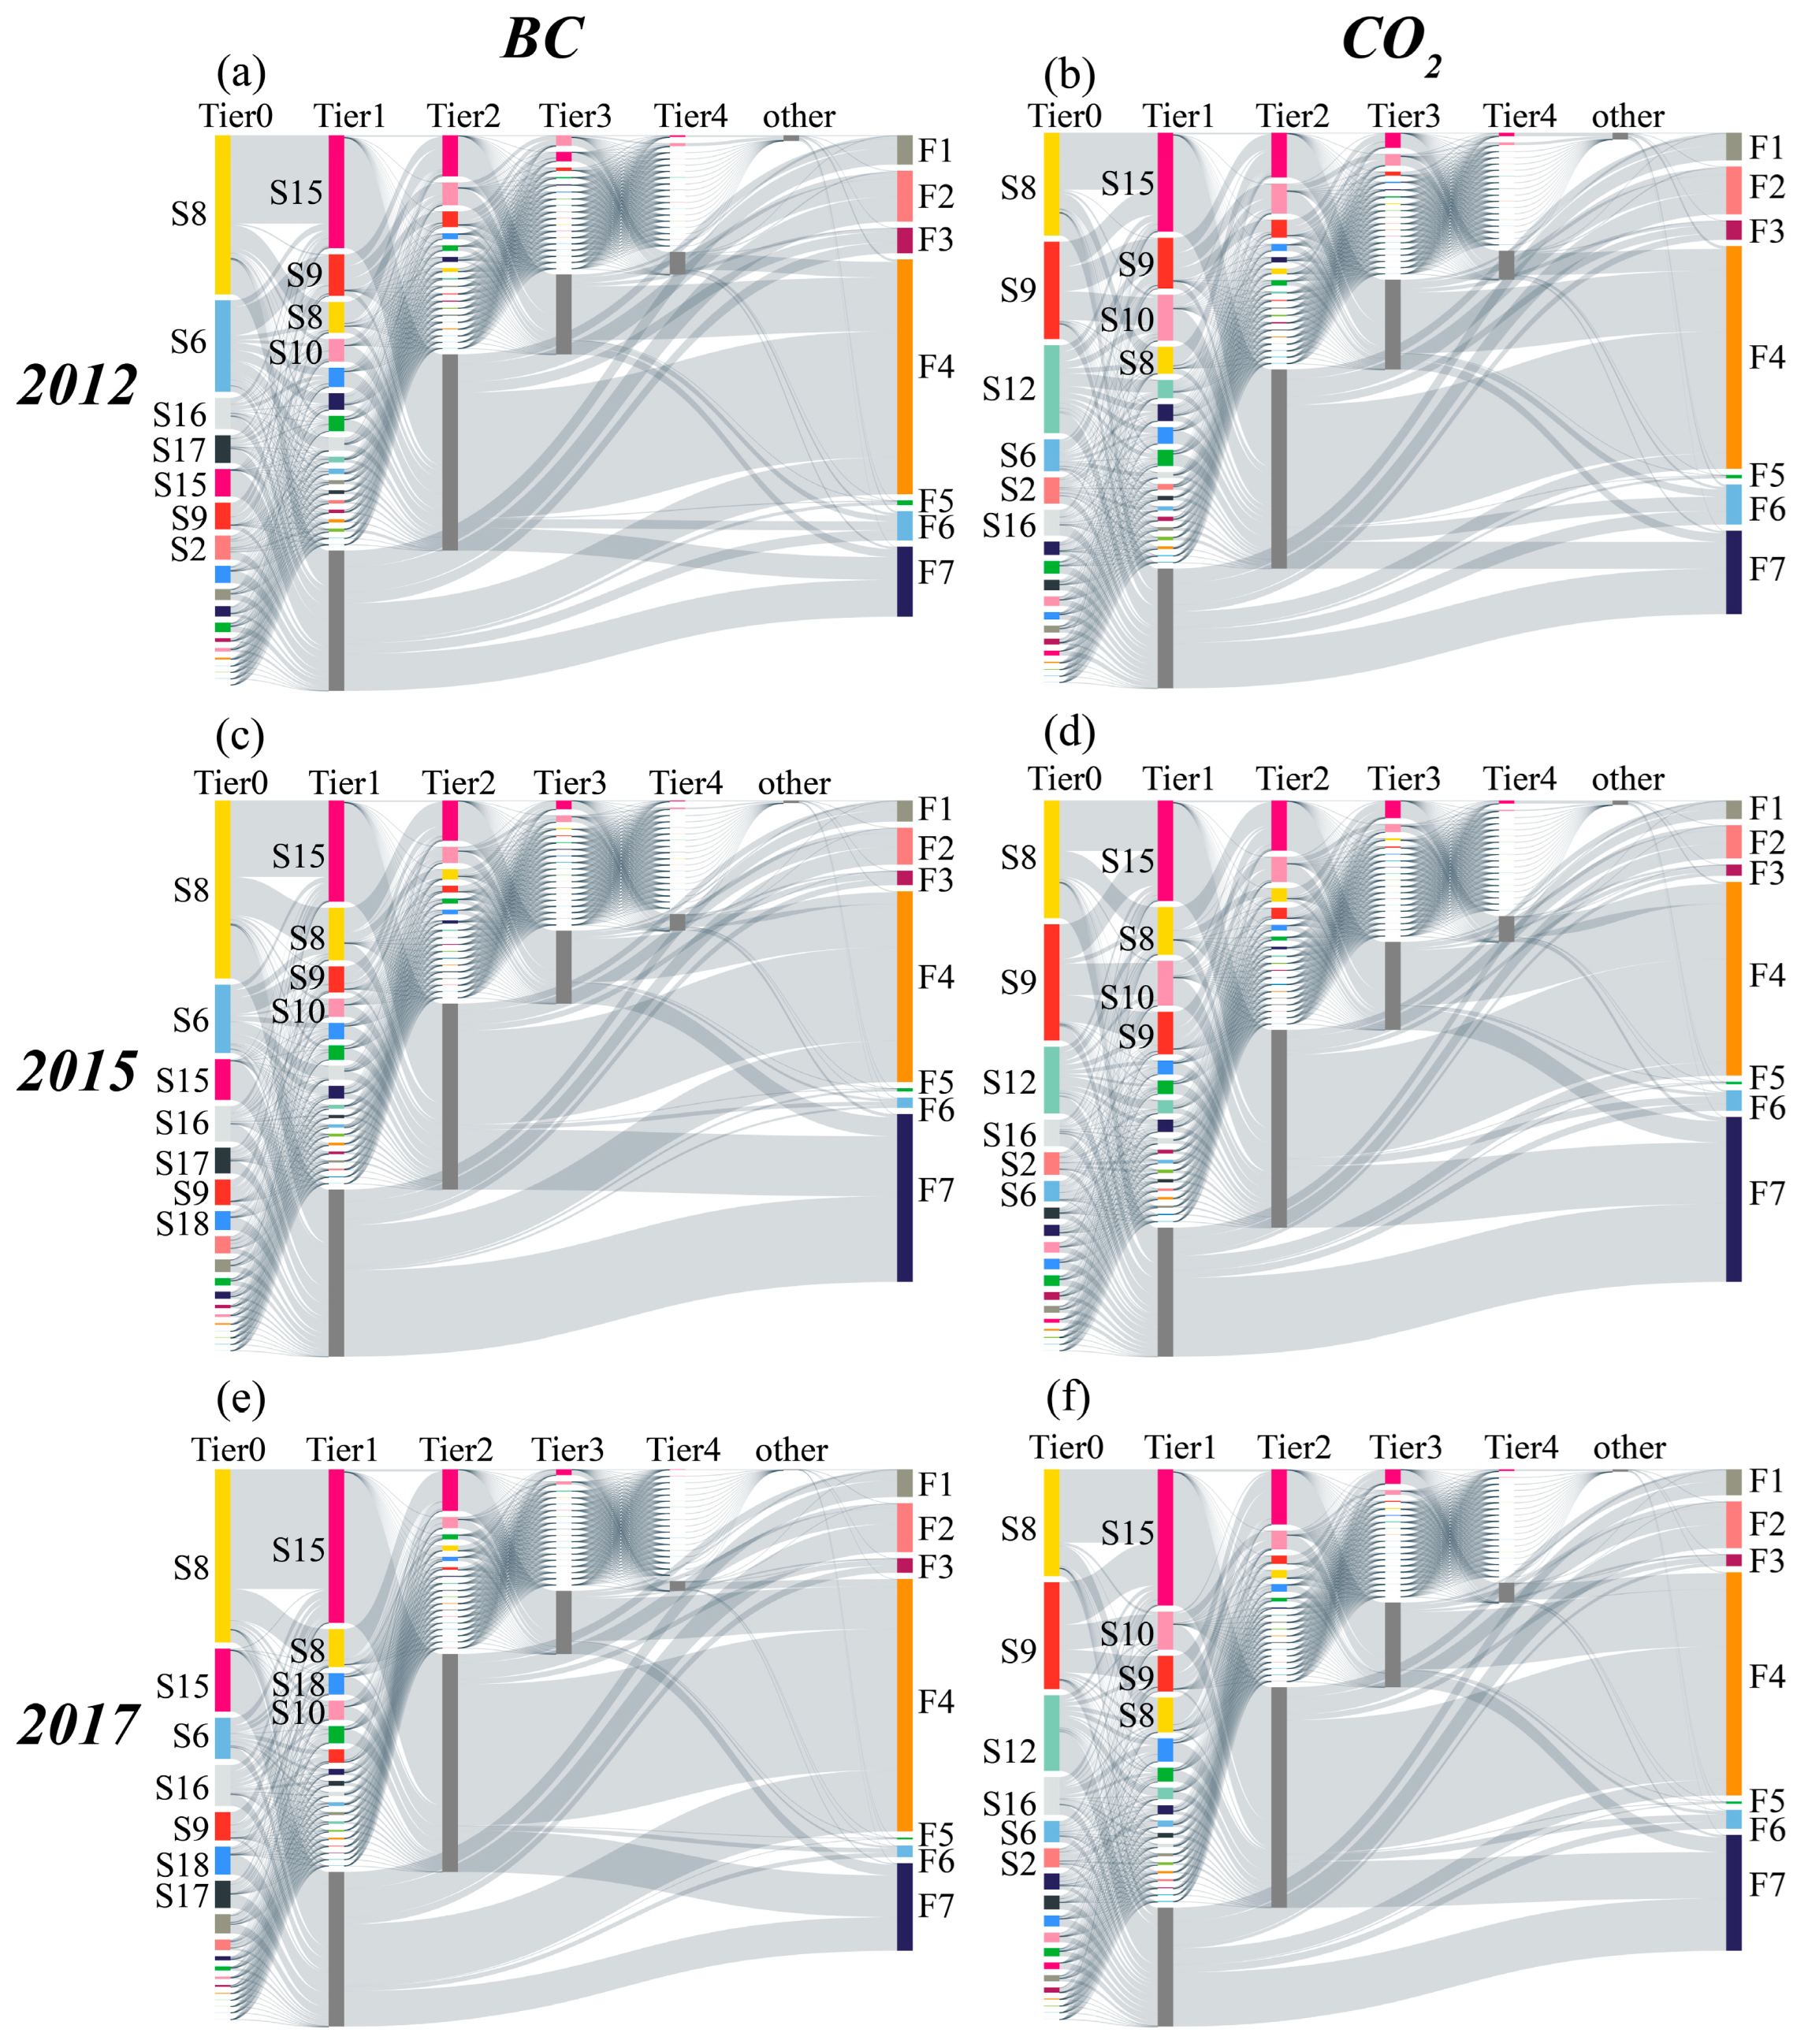
3.3.2. Critical Supply Chain Path
4. Discussions and Conclusions
Supplementary Materials
Author Contributions
Funding
Institutional Review Board Statement
Informed Consent Statement
Data Availability Statement
Conflicts of Interest
References
- Liu, Z.; Guan, D.B.; Wei, W.; Davis, S.J.; Ciais, P.; Bai, J.; Peng, S.S.; Zhang, Q.; Hubacek, K.; Marland, G.; et al. Reduced carbon emission estimates from fossil fuel combustion and cement production in China. Nature 2015, 524, 335–339. [Google Scholar] [CrossRef] [PubMed]
- Zhao, X.; Ma, X.W.; Chen, B.Y.; Shang, Y.P.; Song, M.L. Challenges toward carbon neutrality in China: Strategies and countermeasures. Resour. Conserv. Recy. 2022, 176, 105959. [Google Scholar] [CrossRef]
- Cao, G.L.; Zhang, X.Y.; Zheng, F.C. Inventory of black carbon and organic carbon emissions from China. Atmos. Environ. 2006, 40, 6516–6527. [Google Scholar] [CrossRef]
- Yang, Y.; Ruan, Z.L.; Wang, X.J.; Yang, Y.; Mason, T.G.; Lin, H.L.; Tian, L.W. Short-Term and Long-Term Exposures to Fine Particulate Matter Constituents and Health: A Systematic Review and Meta-Analysis. Environ. Pollut. 2019, 247, 874–882. [Google Scholar] [CrossRef] [PubMed]
- Weilnhammer, V.; Schmid, J.; Mittermeier, I.; Schreiber, F.; Jiang, L.; Pastuhovic, V.; Herr, C.; Heinze, S. Extreme weather events in Europe and their health consequences—A systematic review. Int. J. Hyg. Environ. Health 2021, 233, 113688. [Google Scholar] [CrossRef] [PubMed]
- Bové, H.; Bongaerts, E.; Slenders, E.; Bijnens, E.M.; Saenen, N.D.; Gyselaers, W.; Van Eyken, P.; Plusquin, M.; Roeffaers, M.B.J.; Ameloot, M.; et al. Ambient Black Carbon Particles Reach the Fetal Side of Human Placenta. Nat. Commun. 2019, 10, 3866. [Google Scholar] [CrossRef]
- Clark, P.U.; Shakun, J.D.; Marcott, S.A.; Mix, A.C.; Eby, M.; Kulp, S.; Levermann, A.; Milne, G.A.; Pfister, P.L.; Santer, B.D.; et al. Consequences of Twenty-First-Century Policy for Multi-Millennial Climate and Sea-Level Change. Nat. Clim. Change 2016, 6, 360–369. [Google Scholar] [CrossRef]
- Bond, T.C.; Doherty, S.J.; Fahey, D.W.; Forster, P.M.; Berntsen, T.; Deangelo, B.; Flanner, M.G.; Ghan, S.J.; Karcher, B.; Koch, D. Bounding the role of black carbon in the climate system: A scientific assessment. J. Geophys. Res. Atmos. 2013, 118, 5380–5552. [Google Scholar] [CrossRef]
- Fischer, E.M.; Knutti, R. Anthropogenic contribution to global occurrence of heavy-precipitation and high-temperature extremes. Nat. Clim. Change 2015, 5, 560–564. [Google Scholar] [CrossRef]
- Stott, P. How climate change affects extreme weather events Research can increasingly determine the contribution of climate change to extreme events such as droughts. Science 2016, 352, 1517–1518. [Google Scholar] [CrossRef]
- Ebi, K.L.; Vanos, J.; Baldwin, J.W.; Bell, J.E.; Hondula, D.M.; Errett, N.A.; Hayes, K.; Reid, C.E.; Saha, S.; Spector, J.; et al. Extreme Weather and Climate Change: Population Health and Health System Implications. Annu. Rev. Public. Health 2021, 42, 293–315. [Google Scholar] [CrossRef] [PubMed]
- Jansen, K.L.; Larson, T.V.; Koenig, J.Q.; Mar, T.F.; Fields, C.; Stewart, J.; Lippmann, M. Associations between health effects and particulate matter and black carbon in subjects with respiratory disease. Environ. Health Perspect. 2005, 113, 1741–1746. [Google Scholar] [CrossRef] [PubMed]
- Fayad, M.A.; Al-Ogaidi, B.R.; Abood, M.K.; Al-Salihi, H.A. Influence of post-injection strategies and CeO2 nanoparticles additives in the C30D blends and diesel on engine performance, NOX emissions, and PM characteristics in diesel engine. Part. Sci. Technol. 2022, 40, 824–837. [Google Scholar] [CrossRef]
- Fayad, M.A.; Chaichan, M.T.; Dhahad, H.A.; Al-Amiery, A.A.; Wan Isahak, W.N.R. Reducing the Effect of High Sulfur Content in Diesel Fuel on NOx Emissions and PM Characteristics Using a PPCI Mode Engine and Gasoline–Diesel Blends. ACS Omega 2022, 7, 37328–37339. [Google Scholar] [CrossRef] [PubMed]
- Shahbaz, M.; Destek, M.A.; Okumus, I.; Sinha, A. An Empirical Note on Comparison between Resource Abundance and Resource Dependence in Resource Abundant Countries. Resour. Policy 2019, 60, 47–55. [Google Scholar] [CrossRef]
- Su, H.N.; Moaniba, I.M. Does innovation respond to climate change? Empirical evidence from patents and greenhouse gas emissions. Technol. Forecast. Soc. Change 2017, 122, 49–62. [Google Scholar] [CrossRef]
- Rao, S.; Klimont, Z.; Smith, S.J.; Van Dingenen, R.; Dentener, F.; Bouwman, L.; Riahi, K.; Amann, M.; Bodirsky, B.L.; Van Vuuren, D.P.; et al. Future air pollution in the Shared Socio-economic Pathways. Global Environ. Change 2017, 42, 346–358. [Google Scholar] [CrossRef]
- Wang, Q. Effects of Urbanisation on Energy Consumption in China. Energy Policy 2014, 65, 332–339. [Google Scholar] [CrossRef]
- Zhao, C.; Wang, B. How Does New-Type Urbanization Affect Air Pollution? Empirical Evidence Based on Spatial Spillover Effect and Spatial Durbin Model. Environ. Int. 2022, 165, 107304. [Google Scholar] [CrossRef]
- Mi, Z.F.; Guan, D.B.; Liu, Z.; Liu, J.R.; Viguié, V.; Fromer, N.; Wang, Y.T. Cities: The Core of Climate Change Mitigation. J. Clean. Prod. 2019, 207, 582–589. [Google Scholar] [CrossRef]
- Batty, M. The size, scale, and shape of cities. Science 2008, 319, 769–771. [Google Scholar] [CrossRef] [PubMed]
- Liu, Y.S.; Cao, Y.; Hou, J.J.; Zhang, J.T.; Yang, Y.O.; Liu, L.C. Identifying common paths of carbon and air pollutants emissions in China. J. Clean. Prod. 2020, 256, 120599. [Google Scholar] [CrossRef]
- Hepburn, C.; Qi, Y.; Stern, N.; Ward, B.; Xie, C.P.; Zenghelis, D. Towards Carbon Neutrality and China’s 14th Five-Year Plan: Clean Energy Transition, Sustainable Urban Development, and Investment Priorities. Environ. Sci. Ecotechnol. 2021, 8, 100130. [Google Scholar] [CrossRef] [PubMed]
- Zhang, Q.; Streets, D.G.; Carmichael, G.R.; He, K.B.; Huo, H.; Kannari, A.; Klimont, Z.; Park, I.S.; Reddy, S.; Fu, J.S.; et al. Asian emissions in 2006 for the NASA INTEX-B mission. Atmos. Chem. Phys. 2009, 9, 5131–5153. [Google Scholar] [CrossRef]
- Tao, J.; Zhang, L.M.; Cao, J.J.; Zhang, R.J. A review of current knowledge concerning PM2.5 chemical composition, aerosol optical properties and their relationships across China. Atmos. Chem. Phys. 2017, 17, 9485–9518. [Google Scholar] [CrossRef]
- Tian, P.F.; Cao, X.J.; Zhang, L.; Sun, N.X.; Sun, L.; Logan, T.; Shi, J.S.; Wang, Y.; Ji, Y.M.; Lin, Y.; et al. Aerosol vertical distribution and optical properties over China from long-term satellite and ground-based remote sensing. Atmos. Chem. Phys. 2017, 17, 2509–2523. [Google Scholar] [CrossRef]
- Kang, P.; Deng, Z.C.; Zhang, X.L.; Wang, Z.; Li, W.J.; Qi, H.; Lei, Y.; Ou, Y.H.; Deng, Z.R. Disparities in driving forces behind energy-related black carbon emission changes across China’s provinces. J. Clean. Prod. 2022, 330, 129849. [Google Scholar] [CrossRef]
- Liu, M.M.; Huang, Y.N.; Ma, Z.W.; Jin, Z.; Liu, X.Y.; Wang, H.; Liu, Y.; Wang, J.N.; Jantunen, M.; Bi, J.; et al. Spatial and temporal trends in the mortality burden of air pollution in China: 2004–2012. Environ. Int. 2017, 98, 75–81. [Google Scholar] [CrossRef]
- Wen, W.; Wang, Q. Identification of Key Sectors and Key Provinces at the View of CO2 Reduction and Economic Growth in China: Linkage Analyses Based on the Mrio Model. Ecol. Indic. 2019, 96, 1–15. [Google Scholar] [CrossRef]
- Zhang, J.H.; Wang, H.M.; Ma, L.; Wang, J.; Wang, J.S.; Wang, Z.; Yue, Q. Structural path decomposition analysis of resource utilization in China, 1997–2017. J. Clean. Prod. 2021, 322, 129006. [Google Scholar] [CrossRef]
- Zhang, C.; Anadon, L.D. A multi-regional input-output analysis of domestic virtual water trade and provincial water footprint in China. Ecol. Econ. 2014, 100, 159–172. [Google Scholar] [CrossRef]
- Wiedmann, T.; Wilting, H.C.; Lenzen, M.; Lutter, S.; Palm, V. Quo Vadis MRIO? Methodological, Data and Institutional Requirements for Multi-Region Input-Output Analysis. Ecol. Econ. 2011, 70, 1937–1945. [Google Scholar] [CrossRef]
- Zhang, W.C.; Peng, S.J.; Sun, C.W. Carbon emissions in the global supply chains of services: An analysis based on a multi-regional input-output model. Energy Policy 2015, 86, 93–103. [Google Scholar] [CrossRef]
- Liu, Q.; Long, Y.; Wang, C.; Wang, Z.; Wang, Q.; Guan, D. Drivers of Provincial SO2 Emissions in China—Based on Multi-Regional Input-Output Analysis. J. Clean. Prod. 2019, 238, 117893. [Google Scholar] [CrossRef]
- Meng, J.; Mi, Z.F.; Yang, H.Z.; Shan, Y.L.; Guan, D.B.; Liu, J.F. The consumption-based black carbon emissions of China’s megacities. J. Clean. Prod. 2017, 161, 1275–1282. [Google Scholar] [CrossRef]
- Zheng, H.; Zhang, Z.; Wei, W.; Song, M.; Dietzenbacher, E.; Wang, X.; Meng, J.; Cao, H.; Zhang, Y.; Shan, Y. Regional Determinants of China’s Consumption-Based Emissions in the Economic Transition. Environ. Res. Lett. 2020, 15, 074001. [Google Scholar] [CrossRef]
- Liang, S.; Guo, S.; Newell, J.P.; Qu, S.; Feng, Y.; Chiu, A.S.F.; Xu, M. Global Drivers of Russian Timber Harvest. J. Ind. Ecol. 2016, 20, 515–525. [Google Scholar] [CrossRef]
- Xing, Z.; Jiao, Z.; Wang, H. Carbon Footprint and Embodied Carbon Transfer at City Level: A Nested MRIO Analysis of Central Plain Urban Agglomeration in China. Sustain. Cities Soc. 2022, 83, 103977. [Google Scholar] [CrossRef]
- Xia, C.Q.; Zheng, H.R.; Meng, J.; Li, S.P.; Du, P.F.; Shan, Y.L. The Evolution of Carbon Footprint in the Yangtze River Delta City Cluster during Economic Transition 2012-2015. Resour. Conserv. Recy. 2022, 181, 106266. [Google Scholar] [CrossRef]
- Li, Q.P.; Wu, S.M.; Lei, Y.L.; Li, S.T.; Li, L. Evolutionary path and driving forces of inter-industry transfer of carbon emissions in China: Evidence from structural path and decomposition analysis. Sci. Total Environ. 2021, 765, 142773. [Google Scholar] [CrossRef]
- Nagashima, F. Critical structural paths of residential PM2.5 emissions within the Chinese provinces. Energy Econ. 2018, 70, 465–471. [Google Scholar] [CrossRef]
- Liu, L.J.; Liu, L.C.; Liang, Q.M. Common footprints of the greenhouse gases and air pollutants in China. J. Clean. Prod. 2021, 293, 125991. [Google Scholar] [CrossRef]
- Font Vivanco, D.; Wang, R.; Hertwich, E. Nexus Strength: A Novel Metric for Assessing the Global Resource Nexus. J. Ind. Ecol. 2018, 22, 1473–1486. [Google Scholar] [CrossRef]
- Tian, P.; Lu, H.; Reinout, H.; Li, D.; Zhang, K.; Yang, Y. Water-Energy-Carbon Nexus in China’s Intra and Inter-Regional Trade. Sci. Total Environ. 2022, 806, 150666. [Google Scholar] [CrossRef] [PubMed]
- Fang, D.L.; Chen, B. Linkage analysis for water-carbon nexus in China. Appl. Energy 2018, 225, 682–695. [Google Scholar] [CrossRef]
- Gao, T.; Fang, D.L.; Chen, B. Multi-regional input-output and linkage analysis for water-PM2.5 nexus. Appl. Energy 2020, 268, 115018. [Google Scholar] [CrossRef]
- Albrecht, T.R.; Crootof, A.; Scott, C.A. The Water-Energy-Food Nexus: A Systematic Review of Methods for Nexus Assessment. Environ. Res. Lett. 2018, 13, 043002. [Google Scholar] [CrossRef]
- Hong, J.K.; Shen, Q.P.; Xue, F. A multi-regional structural path analysis of the energy supply chain in China’s construction industry. Energy Policy 2016, 92, 56–68. [Google Scholar] [CrossRef]
- Yang, Z.Y.; Dong, W.J.; Xiu, J.F.; Dai, R.F.; Chou, J.M. Structural Path Analysis of Fossil Fuel Based Carbon Emissions: A Case Study for China. PLoS ONE 2015, 10, e0135727. [Google Scholar]
- Xu, D.X.; Zhang, Y.; Chen, B.; Bai, J.H.; Liu, G.Y.; Zhang, B.Y. Identifying the critical paths and sectors for carbon transfers driven by global consumption in 2015. Appl. Energy 2022, 306, 118137. [Google Scholar] [CrossRef]
- Zhang, Y.Q.; Guan, C.H.; Chen, B.; Zeng, L.; Zhang, B. Tracking embodied water uses and GHG emissions along Chinese supply chains. J. Clean. Prod. 2021, 288, 125590. [Google Scholar] [CrossRef]
- Fang, D.; Yang, J. Drivers and critical supply chain paths of black carbon emission: A structural path decomposition. J. Environ. Manag. 2021, 278, 111514. [Google Scholar] [CrossRef] [PubMed]
- Ding, Y.K.; Li, Y.P.; Zheng, H.R.; Ma, Y.; Huang, G.H.; Li, Y.F.; Shen, Z.Y. Mapping Water, Energy and Carbon Footprints Along Urban Agglomeration Supply Chains. Earth’s Future 2022, 10, 2021EF002225. [Google Scholar] [CrossRef]
- Zheng, H.R.; Tobben, J.; Dietzenbacher, E.; Moran, D.; Meng, J.; Wang, D.P.; Guan, D.B. Entropy-based Chinese city-level MRIO table framework. Econ. Syst. Res. 2022, 34, 519–544. [Google Scholar] [CrossRef]
- Leontief, W. Environmental repercussions and the economic structure: An input-output approach. Rev. Econ. Stat. 1970, 52, 262–271. [Google Scholar] [CrossRef]
- Owen, A.; Scott, K.; Barrett, J. Identifying critical supply chains and final products: An input-output approach to exploring the energy-water-food nexus. Appl. Energy 2018, 210, 632–642. [Google Scholar] [CrossRef]
- Li, M.; Liu, H.; Geng, G.N.; Hong, C.P.; Liu, F.; Song, Y.; Tong, D.; Zheng, B.; Cui, H.Y.; Man, H.Y.; et al. Anthropogenic emission inventories in China: A review. Nat. Sci. Rev. 2017, 4, 834–866. [Google Scholar] [CrossRef]
- Zheng, B.; Tong, D.; Li, M.; Liu, F.; Hong, C.P.; Geng, G.N.; Li, H.Y.; Li, X.; Peng, L.Q.; Qi, J.; et al. Trends in China’s anthropogenic emissions since 2010 as the consequence of clean air actions. Atmos. Chem. Phys. 2018, 18, 14095–14111. [Google Scholar] [CrossRef]
- Shan, Y.L.; Guan, D.B.; Zheng, H.R.; Ou, J.M.; Li, Y.; Meng, J.; Mi, Z.F.; Liu, Z.; Zhang, Q. China CO2 Emission Accounts 1997–2015. Sci. Data 2018, 5, 170201. [Google Scholar] [CrossRef]
- Shan, Y.L.; Huang, Q.; Guan, D.B.; Hubacek, K. China CO2 Emission Accounts 2016–2017. Sci. Data 2020, 7, 54. [Google Scholar] [CrossRef]
- Yang, X.; Zhang, W.Z.; Fan, J.; Li, J.M.; Meng, J. The temporal variation of SO2 emissions embodied in Chinese supply chains, 2002–2012. Environ. Pollut. 2018, 241, 172–181. [Google Scholar] [CrossRef] [PubMed]


Disclaimer/Publisher’s Note: The statements, opinions and data contained in all publications are solely those of the individual author(s) and contributor(s) and not of MDPI and/or the editor(s). MDPI and/or the editor(s) disclaim responsibility for any injury to people or property resulting from any ideas, methods, instructions or products referred to in the content. |
© 2023 by the authors. Licensee MDPI, Basel, Switzerland. This article is an open access article distributed under the terms and conditions of the Creative Commons Attribution (CC BY) license (https://creativecommons.org/licenses/by/4.0/).
Share and Cite
Li, S.; Zhang, X.; Deng, Z.; Liu, X.; Yang, R.; Yin, L. Identifying the Critical Supply Chains for Black Carbon and CO2 in the Sichuan Urban Agglomeration of Southwest China. Sustainability 2023, 15, 15465. https://doi.org/10.3390/su152115465
Li S, Zhang X, Deng Z, Liu X, Yang R, Yin L. Identifying the Critical Supply Chains for Black Carbon and CO2 in the Sichuan Urban Agglomeration of Southwest China. Sustainability. 2023; 15(21):15465. https://doi.org/10.3390/su152115465
Chicago/Turabian StyleLi, Shuangzhi, Xiaoling Zhang, Zhongci Deng, Xiaokang Liu, Ruoou Yang, and Lihao Yin. 2023. "Identifying the Critical Supply Chains for Black Carbon and CO2 in the Sichuan Urban Agglomeration of Southwest China" Sustainability 15, no. 21: 15465. https://doi.org/10.3390/su152115465
APA StyleLi, S., Zhang, X., Deng, Z., Liu, X., Yang, R., & Yin, L. (2023). Identifying the Critical Supply Chains for Black Carbon and CO2 in the Sichuan Urban Agglomeration of Southwest China. Sustainability, 15(21), 15465. https://doi.org/10.3390/su152115465