Abstract
Over the past two decades, significant progress has been observed in the energy sector. Solar power systems have emerged as a popular choice for both individuals and companies. Despite the country’s energy crisis and reliance on fossil fuels, the adoption rate of solar power systems in Pakistan remains slow. This research aims to develop a cost-effective model that can help consumers in Pakistan adopt solar power systems. The unified theory of acceptance and use of technology 2 (UTAUT2) served as the foundation for this research, which is used to understand and predict individuals’ acceptance of new technology. This study included an internet-based survey conducted among 200 respondents in the southern region of Pakistan. Deductive reasoning was used to analyse the data, and the structural equation model was utilised through SmartPLS 3 software to test the research hypothesis. The survey results revealed that effort expectancy and performance expectancy were not significantly associated with attitude towards use. However, all other factors, such as environmental belief, social influence, hedonic motivation, price value, and facilitating conditions used in the model, have positive and significant influences on the use of solar technology. The findings of this project also enable government and private sector organisations to optimise their planning and resources to promote environment-friendly energy, and they should work on significant factors such as cost, which is one of the most dominant indicators that can attract consumers to shift towards alternate energy resources. This study presents the first attempt to model the intention and behaviour of Pakistani consumers towards using solar technology with the help of UTAUT2.
1. Introduction
In the last two decades, vast developments have been noticed in the energy sector [1]. Many companies and individuals have preferred to rely on the scholar system for generating electricity and using the power systems in their homes and specific workplace areas. Although consumers are shifting toward solar energy systems, we are far from developing a framework that could motivate people to adopt solar energy systems while keeping in mind social and economic factors [2]. Energy is the lifeblood of the world’s economy. To perform tasks related to all walks of life, energy plays a vital role. It can be said that no human action is possible without the use of energy, as all important sectors of a country need a continuous supply of energy. A nation’s development cannot progress without energy. So, we can say that energy is a fundamental factor in a nation’s economy [3]. Pakistan is rapidly growing as a developing nation, and to run the economy of the country, energy generation is a must. To help its enormous population and industry, the nation needs a tremendous measure of energy to keep things flourishing [4,5].
Recently, the whole world has been facing an economic crisis that may persist for a longer period due to the ongoing Russian–Ukraine War and many other political issues around the globe. This war has caused magnificent disruptions to production and the oil trade, and the exporters are badly affected. Pakistan has very little or limited oil production resources and is mainly dependent on oil imports. As per the latest data, the import bill for oil increased by 95.9 percent to USD 17.03 billion during July–April FY 2022 [6] compared to USD 8.69 billion during the same period last year. The massive increase in oil prices and the massive depreciation of the Pakistani currency are making oil prices more expensive, and the trade deficit is increasing day by day. Thus, the whole economy is shaking.
According to the Energy Report of FY 2021–2022 [6], there is an increase in the percentage share of renewable energy, which is a good sign for the economy as well as for the environment. The percentage share of solar has also increased from 1.07 percent in July–April FY2021 to 1.4 percent during July–April FY2022.
The current floods in the year 2022 that moved throughout the Pakistani nation incurred more annihilation than was at any point envisioned. They likewise contributed essentially to the monetary destruction, with the assessed total of harms increasing to almost USD 40 billion, a surprising amount for a nation previously attempting to monetarily make due.
Moving in the direction of efficient power energy, in any case, is not simply a better choice—it is likewise a financially savvy one. Hydel, wind, and solar-oriented controlled developments, considered sustainable, perfect, and green wellsprings of energy, convey no petroleum expenses in power levies through an essentially lesser price of force creation than that of grimy petroleum-based power plants.
According to [7], the implementation of renewable energy solutions holds the potential to assist Pakistan in overcoming its circular debt. The adoption of more green projects can gradually reduce the country’s mounting circular debt and alleviate the burden of capacity payments. Unlike traditional energy sources, renewable energy projects operate without the need for fuel, which contributes to minimising the circular debt. However, challenges associated with capacity payments, such as the cost of fixed maintenance and certain rates of return, would persist till elder developments reach leaving age or there is an increase in power demand within the country.
Studying the factors influencing the adoption of solar power systems is important as it provides valuable insights into overcoming barriers, promoting incentives, and designing effective policies to accelerate the widespread adoption of clean and sustainable energy sources, contributing to mitigating climate change, enhancing energy security, and fostering economic and environmental benefits.
From the literature, it comes to the observation that the current energy resources are quite expensive, like oil and gas, and they are becoming more costly day by day and even going beyond the reach of people with low incomes. It is also worth mentioning that the current energy resources, oil, gas, and coal, are not environmentally friendly and cause irreparable damage to our whole ecological system. Therefore, environment-friendly resources like solar can be the best alternatives because they are low in cost, affordable, and environmentally friendly, and they can cover the needs of the masses. The future lies in them, so through this study, we will develop a model for consumers in their decision-making about their selection of solar power systems. Although fellow countrymen and organisations are shifting towards renewable energy systems, we are far from developing a framework that could motivate people to adopt the solar energy system while keeping in mind social and economic factors. This study aims to focus on the unified theory of acceptance and use of technology 2 (UTAUT2) model that could provide consumers with a way out so that it will help them adopt the most economical power system, which is solar energy.
The UTAUT2 model is a comprehensive theoretical framework for understanding user acceptance and usage behaviour towards technology. The UTAUT model was further established in 2003 [8], which integrated eight IT acceptance models. Previously, the UTAUT model had four key factors: facilitating condition (FC), social influence (SI), effort expectancy (EE), and performance expectancy (PE). These factors influenced usage behaviour and the behavioural intention to switch to technology. Moreover, the moderating variables like experience, age, and gender varied from person to person and affected the four factors of the UTAUT2 model. Some minor changes are based on the findings gathered through the investigation of three new factors added to the UTAUT model and then termed UTAUT2 [9]. The first extra construct of the UTAUT2 model was hedonic motivation (HM). The next one was price value (PV), which was measured as a major factor where consumers had to accept the cost connected with buying the products. Habit was the final UTAUT2 construct to be added. These updates to UTAUT2 make clear significant improvements to the explanation of the alteration of behaviour intention and technology use [9]. The model was developed by combining theoretical research with empirical validation using experiments, surveys, and interviews with a variety of user populations. A significant tool for researchers and practitioners looking to understand and encourage the adoption of new technologies, this rigorous approach ensures the model’s dependability and applicability in a variety of technical scenarios.
Compared to past models of technology adoption, the UTAUT2 model provides a more comprehensive and all-encompassing approach. Traditional models generally focus on a restricted number of factors, but UTAUT2 takes a wider variety of factors into account, such as social impact and enabling conditions. Personal qualities are considered moderating elements in addition. Additionally, UTAUT2 emphasises empirical validation more, making it a stronger and more reliable model for understanding and projecting user acceptance and usage behaviour across a variety of technologies and scenarios.
When it comes to describing and forecasting consumer acceptance and usage of technology, the UTAUT2 model has proven to be very successful. The model has demonstrated its usefulness in capturing the essential components and their interrelationships that drive technology adoption through empirical validation and research investigations. UTAUT2 offers a thorough framework that produces trustworthy insights into user behaviour by taking into account elements including performance expectancy, effort expectancy, social impact, and enabling situations, along with moderating variables. Its useful applications have been effectively implemented in a variety of fields, assisting technology implementers and designers in improving the user experience and boosting adoption rates.
Comparison with the recently published research work.
Ref. [10] addresses Pakistan’s severe water shortage and expensive cost of irrigation. While highlighting the promise of solar-powered irrigation systems (SPIS), it also points out that these systems face technical, financial, and policy obstacles. Despite difficulties such as high initial costs, maintenance requirements, and groundwater concerns, the study concludes that SPIS is cost-effective, particularly in remote locations. It urges investment in research and the sustainable management of groundwater and solar energy. Promoting SPIS for effective irrigation, educating stakeholders, and putting legislation into place are all advised to lower costs, boost production, and enhance food security through the use of solar energy in agriculture.
Ref. [11] explains the significance of understanding the factors affecting the adoption of solar photovoltaic (SPV) systems as part of the transition to sustainable energy. The study compares Somalia and Pakistan to specifically identify these drivers in a cross-cultural context. Perceived usefulness, perceived ease-of-use, compatibility, observability, and perceived trust are important determinants of SPVS uptake in both nations, according to an analysis using a quantitative methodology using data from 464 users. Intriguingly, the study’s multi-group analysis uncovers no discernible cultural variations in these contributing elements. However, in the Somalian setting, perceived trust does not seem to have a substantial effect on behavioural intention. In both cultures, there is a significant correlation between attitude and behavioural intention. The study concludes with implications for academics and managers to promote the adoption of SPVS.
Ref. [12] highlights Pakistan’s energy crisis and the expanding use of solar photovoltaic (PV) technology in agriculture. It gives a cost-benefit analysis of solar PV energy systems, with an emphasis on the Baluchistan province. According to the study, solar PV systems are more cost-effective than grid electricity, with a benefit-to-cost ratio of 9.3 vs. 8.4 for solar PV systems. Solar PV systems provide constant power for irrigation systems that pump water, increasing agricultural productivity. Adoption, though, is difficult due to large upfront expenditures and reliance on the weather. Despite these challenges, fluctuating grid power and rising energy prices are pushing local farmers to use solar PV irrigation systems to increase crop yield.
Ref. [13] explains how to deal with the urgent problem of non-renewable energy depletion, which has increased support for sustainable alternatives like solar energy. The rate of solar service uptake has not improved despite numerous efforts. In response, using the Unified Theory of Acceptance and Use of Technology as a guide, this research seeks to investigate the variables influencing the intention to embrace solar energy. The study used a self-administered questionnaire that was disseminated via purposive sampling to working individuals who now own or want to purchase a property. Homeowners in cooperative structures, including condos and apartments, are not included. Partial least squares structural equation modelling was used for data analysis. Overall, this study emphasises the importance of educating Malaysia’s public and offers useful information for those involved in the solar energy field. It also emphasises how crucial performance expectations, effort expectations, and enabling circumstances are for promoting the use of solar energy as a sustainable substitute. To determine the factors impacting the adoption and use of solar power generators (SPG) at the household level in India, as well as the subsequent switching behaviour from conventional energy sources, this study uses a form of the unified theory of adoption and use of technology (UTAUT 2). With the aid of structural equation modelling and factor analysis, data from six Indian cities (n = 1246) are examined.
Ref. [14] shows that several UTAUT variables, including behavioural intentions to adopt SPG and performance expectancy, effort expectancy, social influence, and hedonic factors, all have a positive influence on these intentions. However, these intents are not considerably impacted by the facilitating circumstances or perceived worth. Importantly, switching behaviour from conventional energy sources is favourably correlated with behavioural intentions to use SPG. This study deepens our understanding of consumer behaviour about household adoption of alternative energy sources, particularly solar energy. For marketers and decision-makers, these findings have important practical ramifications since they provide information on consumer attitudes and behaviours related to the adoption of solar energy and the ensuing switch from conventional energy sources.
Ref. [15] explains the value of off-grid solar photovoltaic (SPV) systems in supplying electricity to isolated rural locations as well as how simple they are to install. The main goal of the study is to evaluate the potential for solar energy and its economic viability in Sindh Province, Pakistan’s rural areas. It has been discovered that the sun irradiation levels in these regions are suitable for producing electricity, with estimated tilt angles optimising energy output. Importantly, the economic research shows that off-grid solar PV systems provide electricity for PKR 6.87/kWh, considerably less expensive than traditional sources, which cost PKR 20.79/kWh on average. Additionally, implementing these systems throughout these rural areas can reduce CO2 emissions annually. According to the report, the government should take into account installing off-grid solar PV systems in these isolated rural areas to meet their energy requirements.
This research has a distinctive focus and contributions in comparison to the other research that has been described. The difficulties in Pakistan’s adoption of solar energy are specifically covered in this paper. This research stands out due to its specific focus on the energy environment of one nation. The goal of this research is to create an economic model that will make the adoption of solar power systems easier. This emphasis on creating a workable solution to adoption hurdles makes a significant contribution. Utilising the UTAUT2 Framework Although the Unified Theory of Acceptance and Use of Technology (UTAUT) is a well-known framework, applying its UTAUT2 form to Pakistan’s adoption of solar technology adds a special dimension. The empirical data used in this study were acquired from 200 respondents in Pakistan’s southern area. This nationwide primary data gathering adds novelty.
2. Theoretical Framework
As described above, the UTAUT2 model is an improved form of the UTAUT model for investigating different problems such as smart mobile device adoption, self-technology service, healthcare industry, software acceptance, and learning management systems. The modified version of the UTAUT2 model for the Pakistani context is mentioned in Figure 1. One more factor, environmental belief (EVB), was also added to the UTAUT2 model, as this is a very important factor for this research. Figure 1 indicates that attitudes toward the use of solar power systems (ATU) depend on six key factors that influence consumers’ intentions to use solar technology. The details of all 11 key factors used in Figure 1, along with the proposed hypothesis of the UTAUT2 model, are given below.
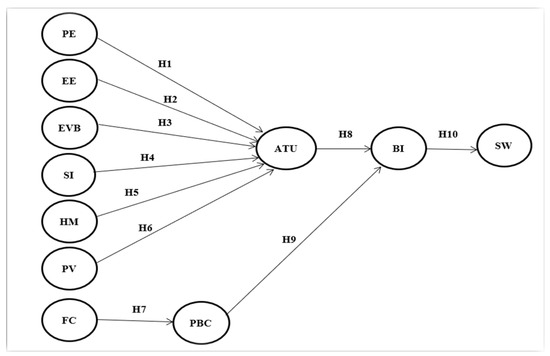
Figure 1.
Theoretical study framework.
2.1. Performance Expectancy (PE)
PE has been proven to be the most accurate predictor of behaviour intended for the use of technology, and it is a crucial factor in determining adoption and ultimate usage. It can be characterised for the sake of this study as a degree of belief among people that utilising solar PV will be more useful and will reduce electricity bills. The proposed hypothesis is:
H1.
Performance expectancy is a significant factor in estimating customers’ attitudes toward the use of solar technology.
2.2. Effort Expectancy (EE)
The UTAUT model includes a construct named effort expectancy that estimates how simple an information technology is to use. Effort expectancy mentions how simple it is to use an information system [8]. It conveys the degree to which users of all ages anticipate that using solar PV will not involve significant physical or mental exertion. The foundation of effort expectation is the notion that there are relations between the effort made at work, the results attained as a response to that effort, and the rewards achieved because of that work. The proposed hypothesis is:
H2.
Effort expectancy is a significant factor in estimating customers’ attitudes toward the use of solar technology.
2.3. Environmental Belief (EVB)
Environmental beliefs are observed as a system of attitudes and beliefs that determine people’s environmental behaviour. In this study, EVB is used as people’s beliefs on climate change and opinions about the shift to green energy, i.e., solar PV. The proposed hypothesis is:
H3.
Consumers’ beliefs about the environment are a significant factor in estimating customers’ attitudes toward the use of solar technology.
2.4. Social Influence
SI refers to how much an individual values other people’s opinions in deciding whether or not to use a new product. In this research, SI is used as a factor to determine how much people are influenced by others to use new technology, i.e., solar PV. The proposed hypothesis is:
H4.
Social influence is a significant factor in estimating customers’ attitudes toward the use of solar technology.
2.5. Hedonic Motivation (HM)
Hedonic motivation is the willingness to initiate behaviours that improve pleasant experiences and behaviours that decline bad experiences. In this study, HM is used as a factor to determine consumer enjoyment of using solar PV. The proposed hypothesis is:
H5.
Hedonic motivation is a significant factor in estimating customers’ attitudes toward the use of solar technology.
2.6. Price Value (PV)
An approach to concluding the cost of an item is based on what customers think it is worth and what they will pay for it, as opposed to what it costs to create. In this study, PV is used as a factor of people’s perceived worth of using solar PV against its benefit. The proposed hypothesis is:
H6.
Price value is a significant factor in estimating customers’ attitudes toward the use of solar technology.
2.7. Facilitating Condition (FC)
FC refers to how much an individual values the fact that the current administrative and technical infrastructure can support the use of technology. In this study, FC is used as a factor to determine whether people have enough space or infrastructure to use solar PV. The proposed hypothesis is:
H7.
Facilitating conditions is a significant factor in estimating perceived behaviour control towards the use of solar technology.
2.8. Attitude towards Use (ATU)
ATU refers to how much an individual values the use of technology. In this study, ATU is used as a factor to determine people’s attitudes toward the use of solar PV. The proposed hypothesis is:
H8.
Attitude toward use is a significant factor in estimating customers’ behaviour and intention toward the use of solar technology.
2.9. Perceive Behaviour (PBC)
PBC refers to how much an individual values the ability to perform a specified behaviour. Perceived behavioural control contains the opinion of the person’s particular capability to execute the behaviour. In this study, PBC was used as a factor to determine the interest of people in using solar PV. The proposed hypothesis is:
H9.
Perceived behaviour control is a significant factor in estimating customers’ behaviour intentions toward the use of solar technology.
2.10. Behaviour Intention (BI)
In many intention models, the actual use of technology is strongly influenced by BI. In this study, BI refers to how often people plan to (and do) use solar PV at home. The proposed hypothesis is:
H10.
Customers’ intention is a significant factor in estimating customers’ switching.
2.11. Switching Behaviour (SW)
It refers to the way customers shift from one supplier to another. In this study, SW is used as a factor to determine people’s plans to replace traditional electricity with solar PV.
3. Methodology
3.1. Questionnaire
The questionnaire was based on earlier studies [16] and underwent further modifications. The demographic part of the questionnaire is based on information related to gender, age, education level, occupation, monthly family income, marital status, and residence area. In addition, some more questions regarding knowing about renewable energy (RE) and the monthly consumption of electricity were added to the questionnaire. Furthermore, it investigates 11 factors of UTAUT2, with each of them measured on a scale of 1 to 5 (1 being the least and 5 being the highest).
3.2. Participants
It was a challenging task to survey consumer intention towards the use of solar technology, so for this, an exploratory investigation was designed as the knowledge available is quite limited relating to the solar power system’s adoption and social acceptance within Pakistan. A survey questionnaire was designed with close-ended questions and circulated among the targeted population in different regions of Pakistan, particularly the southern region. The information was gathered from the urban areas. Moreover, the questionnaire’s language was kept simple with limited technical terms so that participants from different educational and family backgrounds could easily comprehend it. Furthermore, a deductive approach was used, and a hypothesis was made based on the currently existing theory. Also, the research plan was aimed at testing the hypothesis. To conduct research, the quantitative research method was used, and primary data were collected. Further, a research technique was utilised for collecting the primary data from the participants. Before data collection, the participants were asked some questions regarding knowing about renewable energy (RE) and the monthly consumption of electricity. The sample size is the small portion of the population that is thought to be crucial in lowering sampling error. The rule of thumb for choosing sample size is given by [17], who states that sample sizes larger than 30 and smaller than 500 are suitable for the majority of investigations. In contrast, some statisticians advise using a dataset that is 5 to 10 times as large as the scale’s number of items [18]. Here, we have 41 Likert scale measurement questions. Therefore, the internet-based survey was effectively filled by 200 respondents with the following descriptive statistics, as mentioned in Table 1.

Table 1.
Demographics.
Table 1 indicates that 20.5% of respondents were females, while 79.5% were males. A total of 92% of the respondents were aged between 18 and 44, and the rest, 8%, were over 44 years old. A total of 97% of the respondents in the survey were well educated and were either graduates or postgraduates. Additionally, most respondents reported that 52% worked as private employees. The result also indicates that 86% of the people are residents of Karachi.
3.3. Structural Equation Modelling (SEM)
Structural equation modelling (SEM) is a multivariate technique used to determine the association between observed and latent factors [19]. SEM utilises a few models to portray relationships among observed factors, with a similar significant goal of giving a quantitative trial of a theoretical model [20].
More precisely, several hypothetical models can be tested in SEM that explain the association among factors with latent variables [21]. SEM was solved by using SmartPLS 3 software to determine the association between factors and the significance of the model.
We use PLS-SEM as this is more suitable for this type of complex research model [22,23,24,25,26] and also because of the Likert-type scale data used for the study [27].
The proposed structure model equations are:
are slopes for each independent factor, also known as the regression coefficients, indicate the effect of each independent factor on the dependent factor.
4. Results
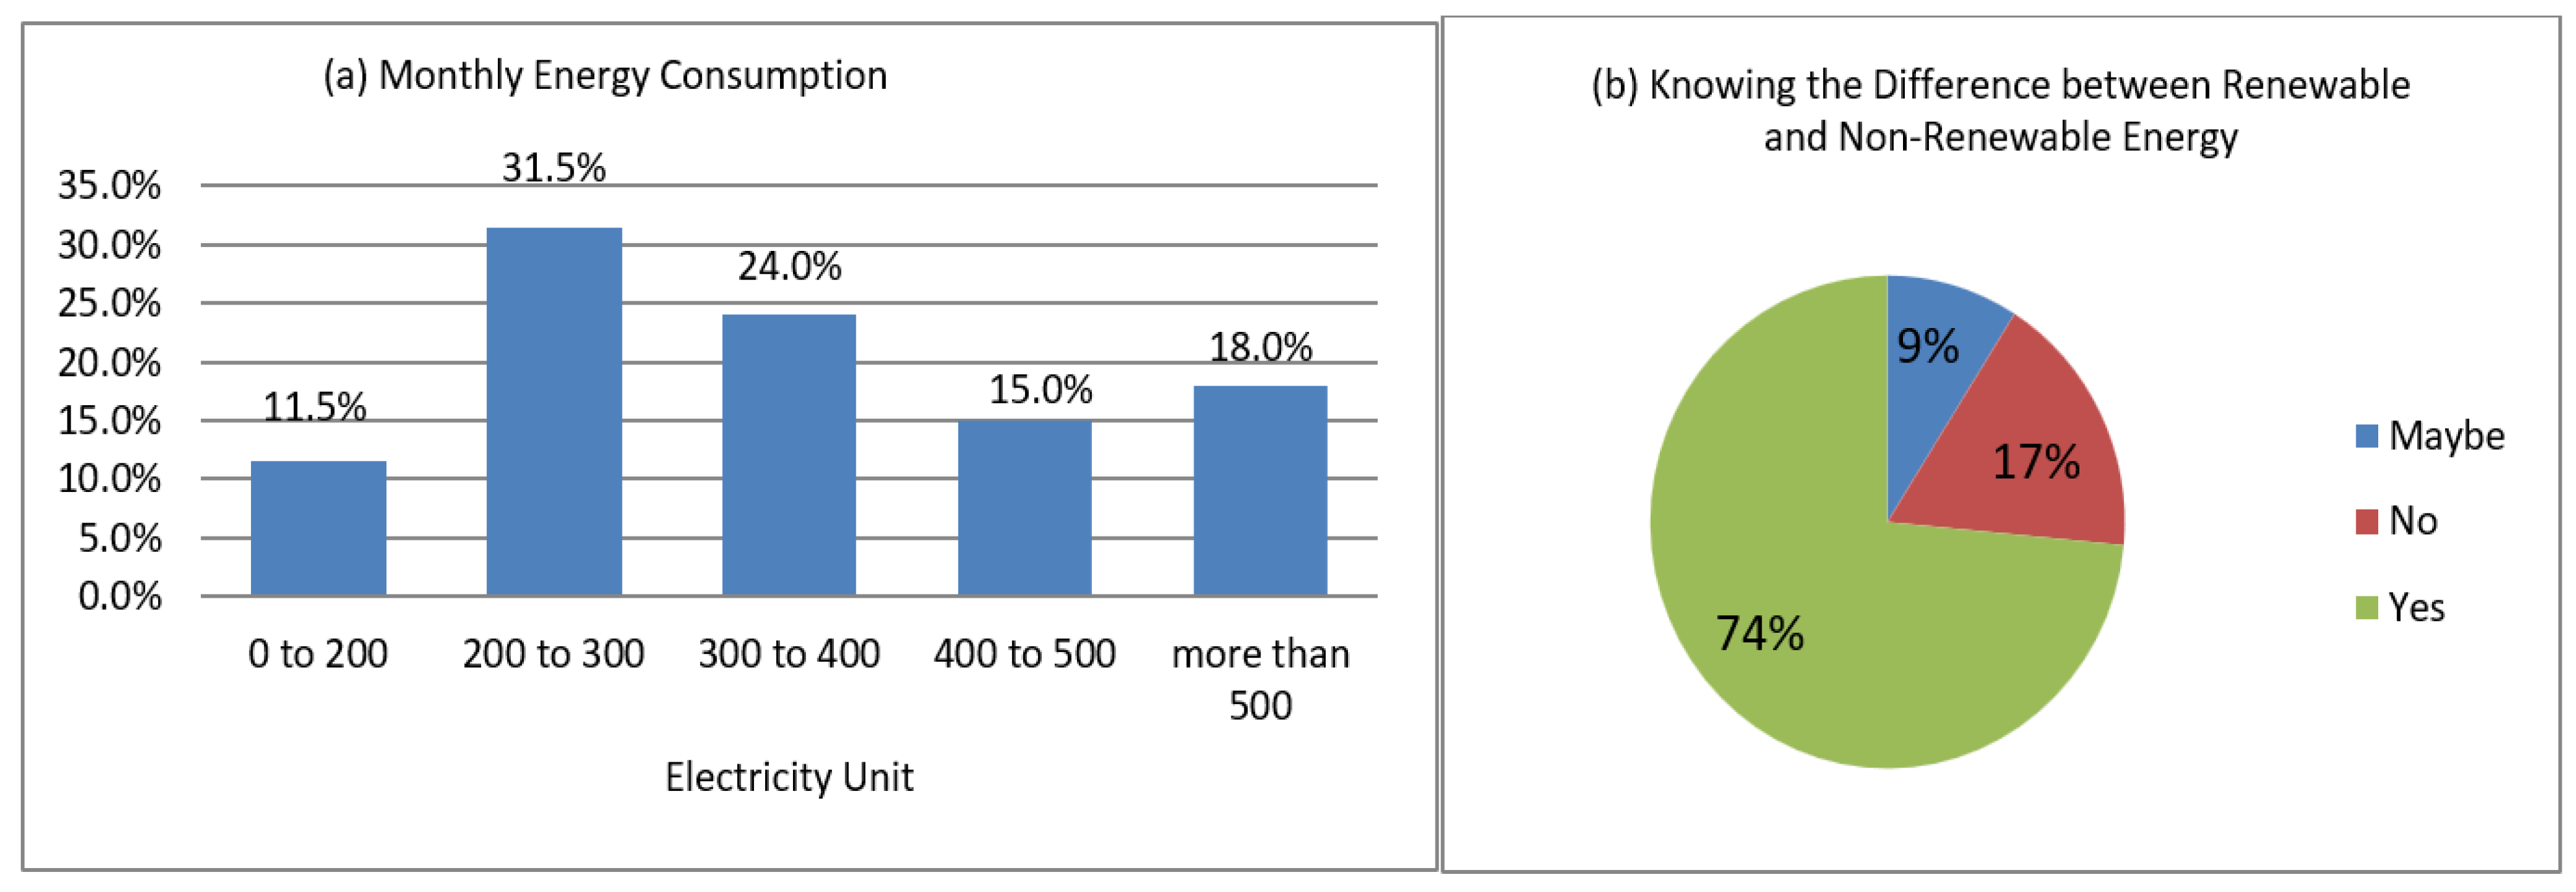
From the descriptive statistics mentioned in Figure 2, we can see that 43% of consumers, on average, use electricity units of 300 or less, and 57% of consumers use more than 300 electricity units. Figure 2 also mentions the knowledge of consumers about renewable energy. The result indicates that 17% of consumers do not know much about renewable energy, but 74% are familiar with renewable energy and its products.

Figure 2.
Demographic profiles of respondents.
4.1. Measurement Model
The UTAUT2 model was measured through construct reliability and validity tests. The factor’s reliability was measured by factor loadings. The variance is explained by each factor explained in factor loading, as mentioned in Table 2. The result shows that each factor meets the recommended value of 0.6, which explains sufficient variance from a particular variable [28]. The Cronbach’s alpha and composite reliability analyses were used to explain the internal reliability of each factor. The average variance reliability (AVE) was used to validate each model [29]. The values of Cronbach alpha mentioned in Table 2 indicate high-level reliability, as all the values are 0.7 or above [30]. The results of composite reliability are also above the recommended value of 0.7, and AVE is also above the recommended value of 0.5 [31,32].
Table 2.
Reliability and validity test.
The discriminant values mentioned in Table 3 are all below the square roots of AVE scores, which shows the strong fit and validity of the model [33], so from all these results, we can conclude that all factors are statistically significant and are suitable for use with the structural equation model.
Table 3.
Discriminant validity.
4.2. Structural Equation Model and Its Significance
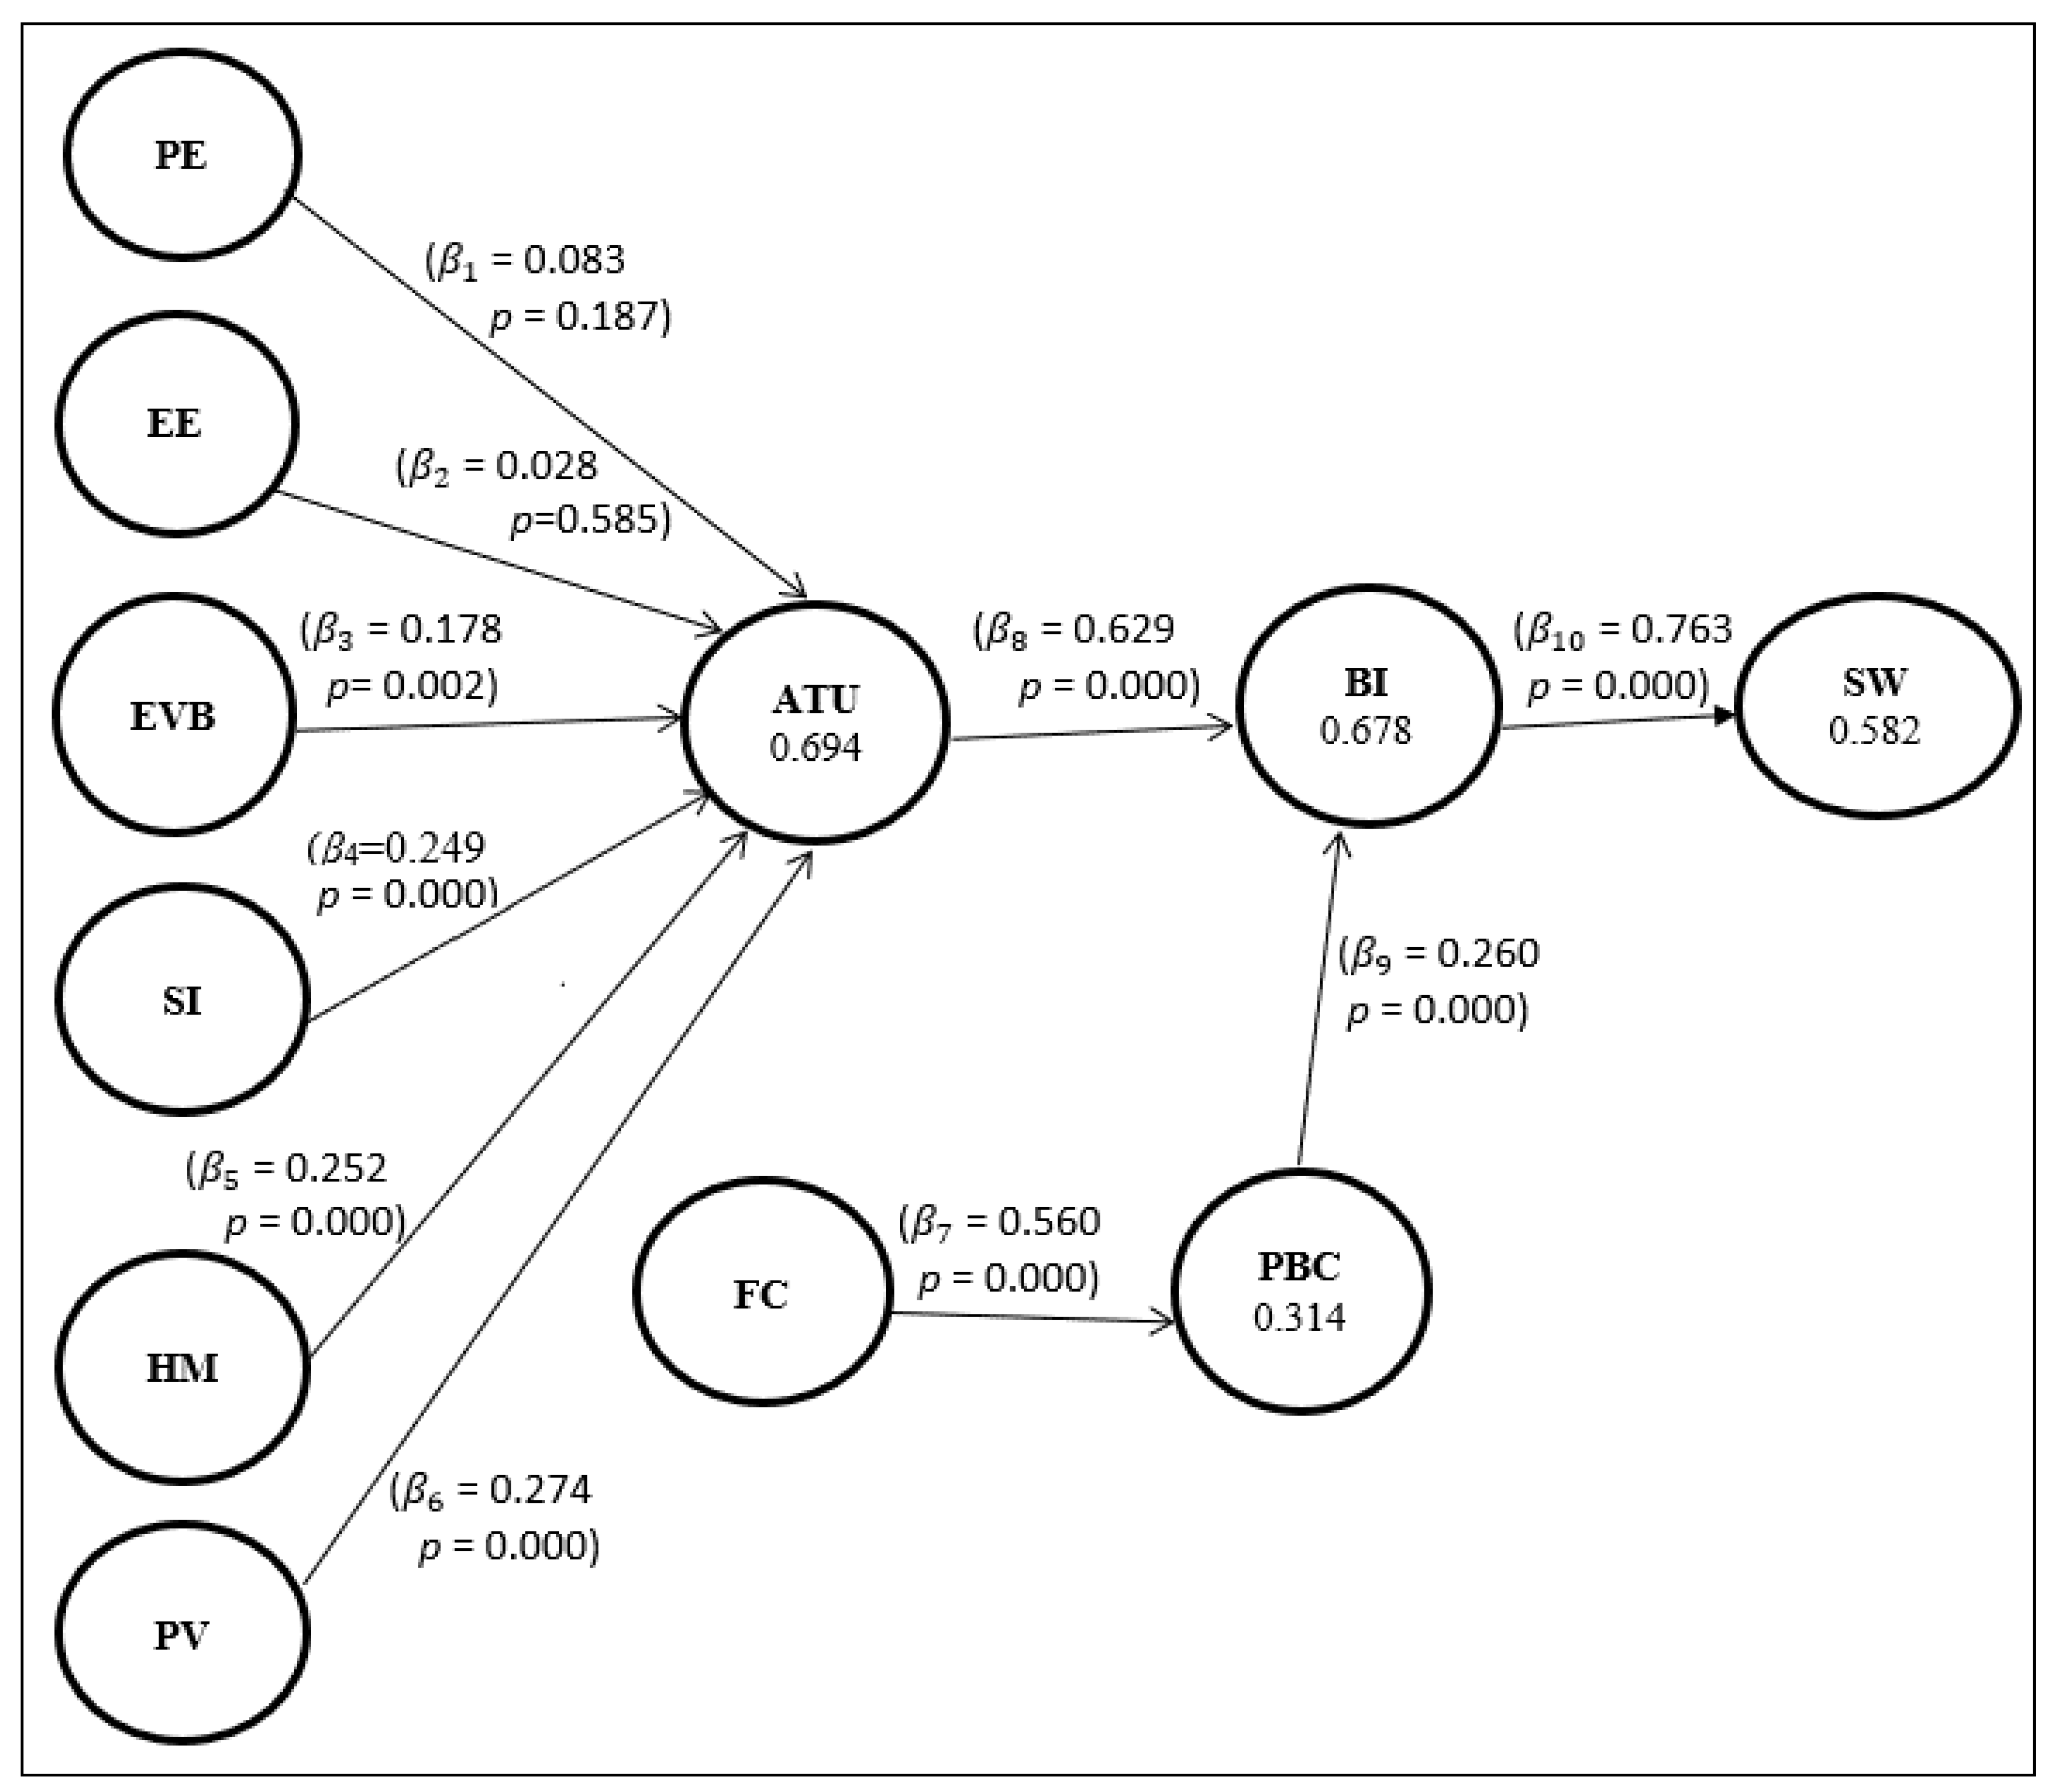
Table 4 indicates performance expectancy (PE) ( = 0.083 and p-value = 0.187) and effort expectancy (EE) ( = 0.028 and p-value = 0.585) are not significant factors in estimating consumers’ attitudes toward the use (ATU) of solar technology. Whereas environmental belief (EVB) ( = 0.178 and p-value = 0.002), social influences (SI) ( = 0.249 and p-value = 0.000), hedonic motivation (HM) ( = 0.252 and p-value = 0.000), and price values (PV) ( = 0.274 and p-value = 0.000) are the significant factors to estimate the attitude of consumers toward the use of solar technology, so in Table 5, we use a predicting equation to estimate ATU without using two insignificant factors, PE and EE. Similarly, facilitating condition (FC) ( = 0.560 and p-value = 0.000) is also a significant factor in estimating perceived behaviour control (PBC). Further, the results also indicate that ATU ( = 0.629 and p-value = 0.000) and PBC ( = 0.260 and p-value = 0.000) are the significant factors in estimating behaviour intention (BI) of consumers towards the use of solar PV, and finally, BI ( = 0.763 and p-value = 0.000) also shows that it is a significant factor in estimating SW. Table 5 shows the model equation calculated from SEM using SmartPLS 3 software. The first equation involves all significant factors to estimate consumer attitude toward the use of solar PV after removing two insignificant factors, PE and EE. The R-square corresponding to each equation indicates the accuracy of the model. The value of the R-square for perceived behaviour control is 31.4%, and for switching behaviour, it is 58.2%. For attitude toward use, it is 69.4%, and for behaviour intention, it is 67.8%, indicating the good explanatory power of the model [34]. According to the research hypothesis, H1 and H2 are rejected, whereas other hypotheses, H3, H4, H5, H6, H7, H8, H9, and H10, are all accepted, as mentioned in Figure 3.
Table 4.
Structural equation model estimates.
Table 5.
Model accuracy.
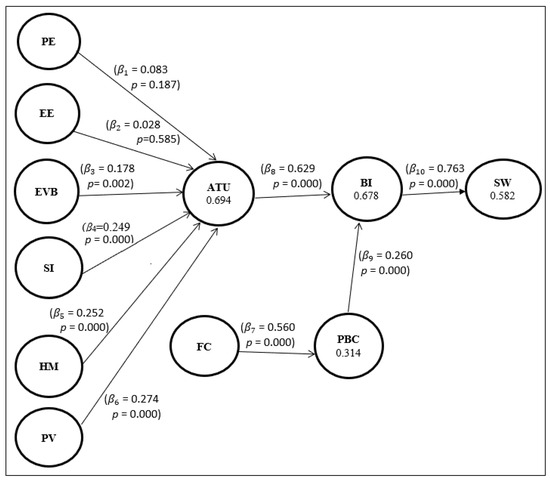
Figure 3.
Results of PLS-SEM.
5. Discussion and Contributions
Factors Significantly Influencing Consumer Attitudes:
The UTAUT2 model was used in the study to investigate the variables affecting consumer sentiments. According to the findings, customers are significantly influenced by four factors—social influence (SI), environmental belief (EVB), hedonic motivation (HM), and price value (PV)—to utilise solar power systems. These variables’ p-values were less than 0.05, indicating a significant impact.
Factors Found Insignificant:
However, because their p-values were higher than 0.05, two factors, performance expectancy (PE) and effort expectancy (EE), were deemed to be unimportant. This indicates that these elements had little impact on customers’ opinions of solar energy systems.
Extension of Research in Southern Pakistan:
This study claims that it is a continuation of research in Pakistan’s southern region (Sindh province) on the acceptability of technology. It claims that this study is the first to apply the UTAUT2 model to analyse customer attitudes, intentions, and behaviours toward solar power systems in this region.
Statistical Significance of the Model:
This study emphasises the statistical significance of the created model, which was based on reliability and validity analysis utilising SEM (structural equation modelling).
6. Conclusions, Limitations, and Future Research
Impact of Energy Crisis and Climate Change:
Climate change is a current phenomenon that is affecting everyone, and if measures have not been taken at the government level, this could become lethal. Pakistan needs solar energy, and to meet the increasing demand for energy not only at the community level but also at the industrial level, there would be grave consequences. We need mass mobilisation and awareness-raising campaigns. The renewable revolution is the only way to save us from a horrifying future.
Cost as a Major Factor:
Pakistan is facing the worst financial crisis in its history, and cost is one of the indicators that can be the most dominant indicator, which can attract consumers to shift towards alternate energy resources. The government should also run an awareness campaign and allocate funds to move toward green energy.
Limitations of the Study:
This study is aware of its limitations, including the fact that it only focuses on the southern part of Pakistan, which may restrict the applicability of the findings to other parts of the country.
Future Research Directions:
A future study is suggested to focus on several areas, including cost-benefit analyses, the adoption of solar power systems in different regions of Pakistan, and longitudinal studies to explain sustained adoption. Additionally, it urges cooperation between stakeholders and consumer education programmes. Also, future research can be conducted to involve larger-scale surveys, which will enhance the study’s external validity.
Call for a Renewable Revolution:
To improve financial issues and stop climate change, the conclusion fervently urges Pakistan to embrace a “renewable revolution” by switching to solar energy. A future study is suggested to focus on several areas, including cost-benefit analyses, the adoption of solar power systems in different regions of Pakistan, and longitudinal studies to explain sustained adoption. Additionally, it urges cooperation between stakeholders and consumer education programmes.
In conclusion, the offered material analyses the findings of a study on the variables impacting customer perceptions of solar power systems in the southern region of Pakistan. The adoption of renewable energy is discussed along with some key points, the requirement for government assistance and awareness, and recommendations for further research and action. It also emphasises the significance of using sustainable energy options like solar power to combat the energy problem and climate change.
Author Contributions
Conceptualization, S.T.A.H.; Methodology, S.T.A.H.; Software, S.T.A.H.; Investigation, S.T.A.H.; Writing—original draft, S.T.A.H.; Writing—review & editing, F.R.; Supervision, F.R.; Project administration, M.M.B. All authors have read and agreed to the published version of the manuscript.
Funding
This research received no external funding.
Institutional Review Board Statement
Not applicable.
Informed Consent Statement
Informed consent was obtained from all subjects involved in the study.
Data Availability Statement
Data are available on request due to privacy/ethical restrictions.
Acknowledgments
We would like to express our gratitude and appreciation to NED University of Engineering & Technology Karachi, Pakistan, for the support of this research work.
Conflicts of Interest
The authors declare no conflict of interest.
References
- Solangi, K.H.; Saidur, R.; Luhur, M.R.; Aman, M.M.; Badarudin, A.; Kazi, S.N.; Lwin, T.N.W.; Rahim, N.A.; Islam, M.R. Social acceptance of solar energy in Malaysia: Users’ perspective. Clean Technol. Environ. Policy 2015, 17, 1975–1986. [Google Scholar] [CrossRef]
- Urpelainen, J.; Yoon, S. Solar home systems for rural India: Survey evidence on awareness and willingness to pay from Uttar Pradesh. Energy Sustain. Dev. 2015, 24, 70–78. [Google Scholar] [CrossRef]
- Naseem, I.; Khan, J. Impact of Energy Crisis on Economic Growth of Pakistan. Int. J. Afr. Asian Stud. 2015, 7, 33. [Google Scholar]
- Fatai, K.; Oxley, L.; Scrimgeour, F.G. Modelling the causal relationship between energy consumption and GDP in New Zealand, Australia, India, Indonesia, The Philippines and Thailand. Math. Comput. Simul. (MATCOM) 2004, 64, 431–445. [Google Scholar] [CrossRef]
- Muneer, T.; Maubleu, S.; Asif, M. Prospects of solar water heating for textile industry in Pakistan. Renew. Sustain. Energy Rev. 2006, 10, 1–23. [Google Scholar] [CrossRef]
- |Ministry of Finance|Government of Pakistan|.Pakistan Economic Survey 2021–22. 2022. Available online: https://www.finance.gov.pk/survey_2022.html (accessed on 31 July 2022).
- Tribune. Pakistan’s Foray into Renewable Energy. The Express Tribun. Available online: https://tribune.com.pk/story/2393075/pakistans-foray-into-renewable-energy?cv=1 (accessed on 29 December 2022).
- Venkatesh, V.; Morris, M.G.; Davis, G.B.; Davis, F.D. User Acceptance of Information Technology: Toward a Unified View. MIS Q. 2003, 27, 425–478. [Google Scholar] [CrossRef]
- Venkatesh, V.; Thong, J.Y.L.; Xu, X. Consumer Acceptance and Use of Information Technology: Extending the Unified Theory of Acceptance and Use of Technology. MIS Q. 2012, 36, 157–178. [Google Scholar] [CrossRef]
- Hussain, F.; Maeng, S.-J.; Cheema, M.J.M.; Anjum, M.N.; Afzal, A.; Azam, M.; Wu, R.-S.; Noor, R.S.; Umair, M.; Iqbal, T. Solar Irrigation Potential, Key Issues and Challenges in Pakistan. Water 2023, 15, 1727. [Google Scholar] [CrossRef]
- Ahmed, Y.A.; Rashid, A.; Khurshid, M.M. Investigating the Determinants of the Adoption of Solar Photovoltaic Systems—Citizen’s Perspectives of Two Developing Countries. Sustainability 2022, 14, 11764. [Google Scholar] [CrossRef]
- Mustafa, Z.; Iqbal, R.; Siraj, M.; Hussain, I. Cost–Benefit Analysis of Solar Photovoltaic Energy System in Agriculture Sector of Quetta, Pakistan. Environ. Sci. Proc. 2022, 23, 26. [Google Scholar] [CrossRef]
- Aravindan, K.L.; Thurasamy, R.; Raman, M.; Ilhavenil, N.; Annamalah, S.; Rathidevi, A.S. Modeling Awareness as the Crux in Solar Energy Adoption Intention through Unified Theory of Acceptance and Use of Technology. Mathematics 2022, 10, 2045. [Google Scholar] [CrossRef]
- Roy, S.; Mohapatra, S. Problems of Adoption of Solar Power and Subsequent Switching Behavior: An Exploration in India. Int. J. Energy Sect. Manag. 2021. ahead-of-print. [Google Scholar] [CrossRef]
- Xu, L.; Wang, Y.; Solangi, Y.A.; Zameer, H.; Shah, S.A.A. Off-Grid Solar PV Power Generation System in Sindh, Pakistan: A Techno-Economic Feasibility Analysis. Processes 2019, 7, 308. [Google Scholar] [CrossRef]
- Andres, L. Designing and Doing Survey Research, 1st ed.; Sage Publications: Thousand Oaks, CA, USA, 2012. [Google Scholar]
- Roscoe, J.T. Fundamental Research Statistics for the Behavioral Sciences; Roscoe, J.T., Ed.; Holt, Rinehart and Winston; New York, NY, USA, 1975; References-Scientific Research Publishing. (n.d.); Available online: https://www.scirp.org/%28S%28lz5mqp453edsnp55rrgjct55%29%29/reference/referencespapers.aspx?referenceid=1691933 (accessed on 1 March 2016).
- Hair, J.F.; Black, W.C.; Babin, B.J.; Anderson, R.E. Multivariate Data Analysis, 7th ed.; Pearson: New York, NY, USA, 2010; Available online: https://www.scirp.org/(S(i43dyn45teexjx455qlt3d2q))/reference/ReferencesPapers.aspx?ReferenceID=1841396 (accessed on 27 July 2016).
- Beran, T.N.; Violato, C. Structural equation modeling in Medical Research: A primer. BMC Res. Notes 2010, 3, 267. [Google Scholar] [CrossRef] [PubMed]
- Prasetyo, Y.T.; Tanto, H.; Mariyanto, M.; Hanjaya, C.; Young, M.N.; Persada, S.F.; Miraja, B.A.; Redi, A.A.N.P. Factors Affecting Customer Satisfaction and Loyalty in Online Food Delivery Service during the COVID-19 Pandemic: Its Relation with Open Innovation. J. Open Innov. Technol. Mark. Complex. 2021, 7, 76. [Google Scholar] [CrossRef]
- Kumar, K. A Beginner’s Guide to Structural Equation Modeling, 3rd edn. J. R. Stat. Soc. Ser. A Stat. Soc. 2012, 175, 828–829. [Google Scholar] [CrossRef]
- Hair, J.F.; Sarstedt, M.; Ringle, C.M.; Mena, J.A. An assessment of the use of partial least squares structural equation modeling in marketing research. J. Acad. Mark. Sci. 2012, 40, 414–433. [Google Scholar] [CrossRef]
- Hair, J.F.; Hult, G.T.M.; Ringle, C.M.; Sarstedt, M. A Primer on Partial Least Squares Structural Equation Modeling (PLS-SEM), 3rd ed.; Sage: Thousand Oaks, CA, USA, 2022. [Google Scholar]
- Sarstedt, M.; Ringle, C.M.; Cheah, J.H.; Ting, H.; Moisescu, O.I.; Radomir, L. Structural model robustness checks in PLS-SEM. Tour. Econ. 2020, 26, 531–555. [Google Scholar] [CrossRef]
- Lim, X.J.; Ng, S.I.; Chuah, F.; Cham, T.H.; Rozali, A. I see, and I hunt: The link between gastronomy online reviews, involvement and behavioural intention towards ethnic food. Br. Food J. 2019, 122, 1777–1800. [Google Scholar] [CrossRef]
- Purohit, S.; Arora, R.; Paul, J. The bright side of online consumer behavior: Continuance intention for mobile payments. J. Consum. Behav. 2022, 21, 523–542. [Google Scholar] [CrossRef]
- Reinartz, W.; Haenlein, M.; Henseler, J. An empirical comparison of the efficacy of covariance-based and variance-based SEM. Int. J. Res. Mark. 2009, 26, 332–334. [Google Scholar] [CrossRef]
- Hair, F.J., Jr.; Sarstedt, M.; Hopkins, L.; Kuppelwieser, V.G. Partial least squares structural equation modeling (PLS-SEM). Eur. Bus. Rev. 2014, 26, 106–121. [Google Scholar] [CrossRef]
- Akbar, A.; Ali, S.; Ahmad, M.A.; Akbar, M.; Danish, M. Understanding the Antecedents of Organic Food Consumption in Pakistan: Moderating Role of Food Neophobia. Int. J. Environ. Res. Public Health 2019, 16, 4043. [Google Scholar] [CrossRef] [PubMed]
- Taber, K.S. The Use of Cronbach’s Alpha When Developing and Reporting Research Instruments in Science Education. Res. Sci. Educ. 2017, 48, 1273–1296. [Google Scholar] [CrossRef]
- Anderson, J.C.; Gerbing, D.W. Structural Equation Modeling in Practice: A Review and Recommended Two-Step Approach. Psychol. Bull. 1988, 103, 411–423. [Google Scholar] [CrossRef]
- Bekti, D.B.M.; Prasetyo, Y.T.; Redi, A.A.N.P.; Budiman, A.S.; Mandala, I.M.P.L.; Putra, A.R.; Persada, S.F.; Nadlifatin, R.; Young, M.N. Determining Factors Affecting Customer Intention to Use Rooftop Solar Photovoltaics in Indonesia. Sustainability 2021, 14, 280. [Google Scholar] [CrossRef]
- Fornell, C.; Larcker, D.F. Evaluating Structural Equation Models with Unobservable Variables and Measurement Error. J. Mark. Res. 1981, 18, 39–50. [Google Scholar] [CrossRef]
- Breiman, L.; Friedman, J.H. Estimating Optimal Transformations for Multiple Regression and Correlation. J. Am. Stat. Assoc. 1985, 80, 580–598. [Google Scholar] [CrossRef]

Disclaimer/Publisher’s Note: The statements, opinions and data contained in all publications are solely those of the individual author(s) and contributor(s) and not of MDPI and/or the editor(s). MDPI and/or the editor(s) disclaim responsibility for any injury to people or property resulting from any ideas, methods, instructions or products referred to in the content. |
© 2023 by the authors. Licensee MDPI, Basel, Switzerland. This article is an open access article distributed under the terms and conditions of the Creative Commons Attribution (CC BY) license (https://creativecommons.org/licenses/by/4.0/).