Abstract
The COVID-19 pandemic and lockdown have caused serious impacts on people’s lives, especially on daily travel like online car-hailing. Understanding the impacts of the pandemic on online car-hailing travel is essential for sustainable urban planning and governance, especially during public health emergencies including COVID-19. However, few studies have delved into the in-depth patterns and interpretations of crowd behaviors and mobility variations resulting from the lockdown, especially from different perspectives. This study attempts to make contributions to this gap by building a three-step method from a macroscopic to mesoscopic perspective. A dataset of online car-hailing trajectories for 15 days in 2018 and 3 special days (before and after the lockdown) in 2022 was used. Detailed analyses of the overall spatiotemporal patterns, the flows between administrative districts, and the four-perspective investigation in the central urban area were conducted. The main findings include a dramatic plunge in ride counts for online car-hailing due to the lockdown and a significant change in human mobility associated with hospitals and traffic hubs. Our study provides insights into the understanding of impacts of COVID-19 and lockdown and hopefully helps with the resilience and sustainability of the city. The workflow might also be inspiring for further studies.
1. Introduction
The COVID-19 pandemic swept through the world from the end of 2019. As of 13 September 2023, there have been 770,563,467 confirmed cases of COVID-19, including 6,957,216 deaths worldwide [1]. The pandemic of coronavirus has brought tremendous impacts on the production and life of human beings, and many countries have taken various measures (e.g., mask-wearing, restrictions on gatherings, and even lockdowns) to control its spread.
Few industries have been hit as severely by COVID-19 as transportation [2]. Due to the restriction policies and people’s fear of contracting COVID-19, the riding of means of transportation decreased sharply, including trains, metros, taxis, and online car-hailing, both for inter-city and intra-city transportation modes. The way people travel and live was significantly affected. People needed to work from home or conduct online meetings if the working conditions permitted. Students needed to take classes online. Fortunately, e-shopping, takeaways, and other online consumption modes enabled people to live and stay at home to some extent [3].
Tougher measures, like grid management (people are restricted to moving within the grid) and even lockdowns (blockades of large areas within the city), were adopted in China before 2023. Metropolises like Shanghai and Wuhan and small cities (especially at the border) like Ruili, Yunnan experienced lockdown. In Shanghai, the number of infected individuals suddenly increased in March 2022. To quickly curb the spread of the pandemic, the government announced that Pudong (the part east of Huangpu River in Shanghai) and Puxi (the part west of Huangpu River in Shanghai) would be closed off at 5:00, 28 March 2022, and 3:00, 1 April 2022, respectively. Shanghai is divided by the Huangpu River into two regions, i.e., Pudong and Puxi, both administrative and natural areas. The government probably implemented lockdowns in Pudong and Puxi separately and successively to facilitate management and reduce economic losses. As a result, these two parts of Shanghai showed a certain degree of independence during the lockdown, and communication between them became minimal, which would be conducive to rapid control of the pandemic. However, almost all aspects of residents’ lives, such as travel, work, medical treatment, and education, were greatly affected due to the lockdown. The riding of urban transportation including online car-hailing dropped precipitately as Pudong and Puxi were sealed off in turn. External traffic in Shanghai was nearly completely halted to prevent the spread of the pandemic, so the throughput of transportation hubs declined significantly. Almost all regular activities were required to be brought online or suspended. It is worth noting that residents were told in advance of the lockdown. Due to the uncertainty of the actual time of lockdown, specific crowd behaviors emerged, including snapping up food, medicines, and other daily essentials, namely, panic buying [4,5]. These behaviors of the crowd could also be reflected in residents’ travel. As an important mode of transportation, car-hailing provides a common, point-to-point, and private service. Especially during the pandemic, people tended to travel via more independent modes like ride-hailing to mitigate infection risks. As a result, it is meaningful to research the impacts of the pandemic and particular crowd behaviors with the car-hailing data, which may help to enhance the resilience and sustainability of the city.
In this study, we studied the impacts of COVID-19 and lockdown on car-hailing travel in Shanghai. A dataset of 15 days in 2018 and 3 days comprising 6 March, 28 March, and 1 April 2022 (regular pandemic prevention and control in Shanghai, the first day of lockdown in Pudong, and the first day of lockdown in Puxi, respectively) were used for our research. Our findings revealed the changes in human mobility patterns and the underlying causes due to the lockdown against the COVID-19 pandemic. The results will hopefully help the government to better understand the impacts of the pandemic, as well as support the decision-making of the government.
2. Literature Review
2.1. Studies Related to COVID-19
As a typical case of a public health emergency, the COVID-19 pandemic has caused profound impacts on various aspects worldwide, such as the economy [6,7], employment and production [8,9], society [10], as well as transportation [11], and logistics [12]. Few industries have been hit as severely by COVID-19 as transportation, especially the lockdown which directly imposes restrictions on residents’ movement. Borkowski, Jazdzewska-Gutta [13] used a CATI (computer-assisted telephone interviewing system) survey and revealed significant reductions in daily travel during the pandemic. The effectiveness of mobility restrictions like lockdowns was confirmed, and other discoveries concerning changes in crowd behaviors were also made. Yu, Xie [3] conducted a regression analysis for the productivity of ride-sourcing and taxi markets and unraveled the impact of the pandemic. Silveira-Santos, Gonzalez [14] attempted to determine whether ride-hailing prices were affected due to the COVID-19 pandemic using time series forecasting and machine learning. Shen [15] studied the commute in Shanghai during post-pandemic rehabilitation and provided a clearer understanding of the health and sustainability challenges for policymakers. Yang [16] also proposed a collaborative use of location-based datasets, statistical datasets, and theoretical urban economic models to build a planning support framework. A novel public health concept, Fangcang Shelter Hospitals, was implemented to tackle the coronavirus disease 2019 outbreak in China [17]. It should be noted that in many Western countries, the policies and measures to cope with COVID-19 were not as stringent as those in China. In Italy, initiatives including city time planning, decentralization of public facilities, and lockdowns in some regions [18] were implemented. The roles of public transport [19] and transport accessibility [20] during the COVID-19 pandemic were also studied in Italy, to facilitate the definition of possible policies or best practices.
A specific mode of transportation is often used as a sample to reflect and analyze the changes in human mobility in the context of the pandemic, especially for public transport in a broad sense including public mass transit, bike-sharing, and ride-hailing. Hu, Xiong [21] leveraged two-year bike-sharing trips to examine spatiotemporal changing patterns during the epidemic. Zhou, Liu [22] researched the impact of COVID-19 on microtransit (between individual private transport and public mass transit) using eigen decomposition and K-clique percolation and tracked the variation in and evolution of spatiotemporal mobility patterns. The impact of COVID-19 on an individual’s travel mode choice was also studied [23]. They found that public mass transit was a trend on long trips, and the industry of online car-hailing had received a sharp shock.
2.2. Studies Based on Online Car-Hailing Data
The vast quantity of online car-hailing data collected by TNCs (Transportation Network Companies) provide researchers with a golden opportunity to study residents’ travel behavior and human mobility from a new perspective. Copious studies based on ride-hailing (or taxi) data have been conducted in numerous aspects such as spatiotemporal patterns [24,25,26], traffic congestion [27], land use [28], travel for specific purposes [29,30], the competitive relationship between online car-hailing and the cruise car market [2,31], and so on. Liu, Kang [32] researched intra-urban trip patterns in Shanghai using online car-hailing data containing approximately one and a half million trips. Bi et al. [33] successfully identified job-housing sites using online car-hailing data. Notably, machine learning (especially deep learning) methods were also introduced into the study of online car-hailing data, to predict variations in patterns [34], changes in the supply and demand [35], and so on.
Since the onset of COVID-19, the car-hailing industry has been remarkably affected, which has attracted much attention from scholars. Zheng, Zhang [2] utilized the taxi data covering the lockdown period and phased reopening in Shenzhen, China, to analyze the relationship and variations in the supply and demand. Many insights were gained in their study and suggestions were made. Yu, Xie [3] empirically revealed the impact of the epidemic on the ride-sourcing and taxi markets in Ningbo, China. Li, Bao [36] explored spatio-temporal and behavioral variations in taxi travel in New York City during COVID-19. They found that the hotspots of travel destinations had changed by spatial clustering.
Additionally, the modifiable areal unit problem (MAUP) is a well-known problem in geographical studies, which is a source of statistical bias that often occurs in spatially aggregated data. The MAUP was first addressed by Openshaw [37] in 1984: “The areal units (zonal objects) used in many geographical studies are arbitrary, modifiable, and subject to the whims and fancies of whoever is doing, or did, the aggregating”. Some scholars have conducted research [38,39] based on online car-hailing data in the context of MAUP. Approaches to handle the MAUP include simply acknowledging its presence and performing multiscale and multizonal system analyses. The other extreme is to develop scale-independent or insensitive analytical techniques, but it has little success [40]. In this study, quantitative research with multi-perspective and different spatial scales are conducted, to mitigate the influence and potential biases resulting from different methods and scales. The analytical framework can also provide researchers with valuable guidance and insights across different spatial scales by adjusting parameters to align with the specific scale of investigation.
In conclusion, previous studies have made great contributions towards the information mining of online car-hailing data, characteristics, and impacts of the COVID-19 epidemic, and pandemic-related mobility. However, to the best of our knowledge, few of them have delved into the underlying patterns and in-depth interpretations of the particular crowd behaviors and human mobilities resulting from the pandemic and lockdown, especially using different perspectives and scales. As a result, we tried to examine the impacts of the epidemic and lockdown on online car-hailing travel using our specific datasets and to make certain contributions to filling this gap.
3. Study Area and Data
3.1. Study Area
Shanghai is the national economic center and a megacity of China, with a population of over 24 million and an area of more than 6300 square kilometers. Shanghai has jurisdiction over 16 municipal districts, and its GDP ranks first among Chinese cities. However, Shanghai experienced a rapid outbreak of the COVID-19 pandemic since March 2022, leading to a great loss of production and life for its residents, and the government adopted the lockdown to contain the spread of the pandemic. As a result, we chose Shanghai as the study area to analyze the impacts of the pandemic and lockdown on online car-hailing travel. The numbers of 16 administrative districts in Shanghai are listed in Table 1, and the study area is shown in Figure 1.

Table 1.
Numbers of 16 administrative districts.
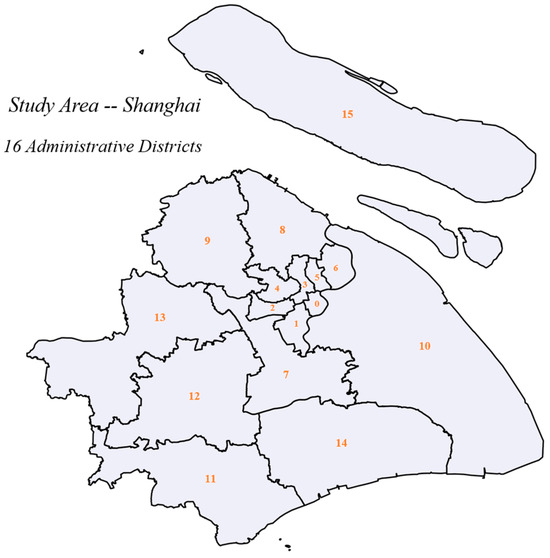
Figure 1.
Study area and locations of 16 administrative districts.
3.2. Data
3.2.1. Data Description
The dataset of online car-hailing trajectories used in this study was collected from the Shanghai Transportation Information Center, which centralizes and manages various types of traffic data in Shanghai. We obtained data for two time periods, pre-epidemic and post-epidemic. The former period of data contains 15 days of GPS trajectory data of online car-hailing in Shanghai from 7 April to 21 April 2018. The latter contains three days of trajectory data for 6 March, 28 March, and 1 April 2022, which correspond to the regular time of pandemic prevention and control in Shanghai, the first day of lockdown management in Pudong, and the first day of lockdown management in Puxi, respectively. Although data as close as possible to the time of the COVID-19 outbreak (the end of 2019) are preferable to be set as the pre-pandemic baseline, we chose data for 15 days in 2018 as an alternative due to our limited access to online car-hailing data, which is adequate for the empirical research in this work and serves our objective for exploring impacts of the pandemic and lockdown.
The GPS trajectory data mainly contain the following fields: vehicle number, time stamp, location of the car, and the passenger state which indicates whether passengers are on board. The size of the entire dataset is around 30 GB, which requires preprocessing to gain informative and concise order records before the formal analysis.
3.2.2. Data Preprocessing
The procedure of data preprocessing in this study is shown in Figure 2. To begin with, we cleaned the raw data to exclude drift data and the data beyond the time or area range of our study. Afterward, we identified the ODs (origins and destinations) of trips from massive trajectory GPS data using the field of passenger state. The passenger state change from “off” to “on” means the passenger(s) is (are) picked up (which means the origin of the trip), and conversely indicates a drop-off point (destination). The online car-hailing trips were matched and saved. Additionally, several anomalies were observed. Ping-pong data, incomplete data, duplicate data, and records with travel times greater than 1 day and less than 1 min were removed. Finally, a unified order dataset was obtained as the basis for the following study, preserving concise information on the location and time of the origins and destinations.
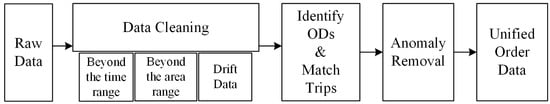
Figure 2.
Flow chart of data preprocessing.
4. Methodology
In this section, we present our methodology in three steps (i.e., the overall perspective, the administrative district perspective, and the central urban area perspective). We propose a research method gradually from a macroscopic to a mesoscopic perspective (from the whole region to the administrative districts to the central area). The three perspectives corroborate with each other to obtain a more reliable conclusion. The overview of the method is shown in Figure 3. Based on this method, appropriate parameters need to be set aligning with the spatial scales studied in each step.
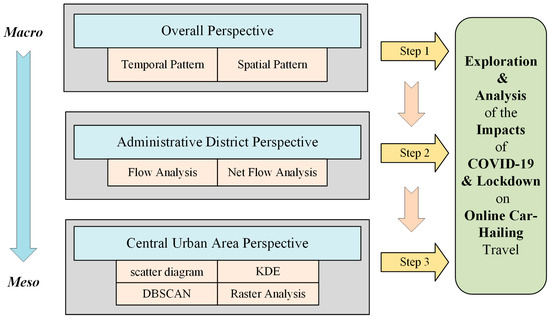
Figure 3.
Overview of the methodology.
4.1. The Overall Perspective
Firstly, the overall temporal and spatial patterns are studied from a macroscopic perspective, which showcases the natural patterns of travel volume and spatial distribution of online car-hailing trips.
For the overall temporal pattern, the numbers of trips were counted to draw a line chart of time distribution, depicting the temporal variation in online car-hailing ridership. Spatial analysis was performed in the whole region of Shanghai. Firstly, the study area was divided into grid cells of 500 m by 500 m, which is refined enough to observe residents’ travel, as well as a suitable size for studying residents’ activities in many previous works. Then, the origins and destinations of the trips were aggregated in these grids. Furthermore, in this paper, the standard deviation ellipse was applied to measure the direction distribution of spatial point patterns. This method calculates the standard deviation of the x-coordinates and y-coordinates from the mean center to define the axes of the ellipse. The standard deviation ellipse can identify the direction and distribution of the data and understand implied characteristics. The factor of 4.24 (three standard deviations) was selected to cover approximately 99.7% of the sample points in two dimensions.
4.2. The Administrative District Perspective
The second step of our method investigates the flows between administrative districts. In China, the administrative districts are regions divided by levels for the convenience of administrative management. There is often a high degree of consistency in management and policy within the same administrative area. Therefore, the characteristics of residents’ mobility patterns could be reasonably reflected from the administrative district’s perspective.
A matrix was generated and flows between administrative districts were calculated. The element records the flow from the administrative district to the administrative district , which indicates the number of online car-hailing trips that occur with the origin of and the destination of . A visualization of was established, which uses the shade of the color to reflect the value of ridership. In practice, is usually a diagonally dominant matrix, which means trips within the administrative district (from the district to itself) are far more numerous than trips to others. As a result, a matrix which sets the diagonal elements to zero was generated for the purpose of a better visualization. It can be calculated from the following equation:
where represents a matrix with diagonal values preserved and others set to zero.
Furthermore, we intended to investigate the net flows between administrative districts. A matrix was built to record the net flows. This matrix is calculated from the following equation:
where denotes the transpose of matrix .
Consequently, each element in follows: , which means the net trip flow from administrative district to administrative district . In particular, is a skew-symmetric matrix. In addition, the sum of line of represents the net flow of administrative district :
where denotes the net flow of administrative district . If is greater than zero, this district outflows as a whole, namely the “source”. Conversely, if is less than zero, the district is a “sink”.
4.3. The Central Urban Area Perspective
The last step of our method focuses on the central urban area for a more refined view of the impacts of the pandemic and lockdown. A four-perspective research method is introduced to analyze the impact of the pandemic and the lockdown on residents’ travel to fulfill a comprehensive and multi-perspective analysis. The four perspectives refer to the scatter diagram, the kernel density estimation (KDE), the clustering method of density-based spatial clustering of applications with noise (DBSCAN), and the raster analysis, respectively.
The scatter diagram is a common method to present the real spatial distribution of the data points. Based on the longitudes and latitudes of the destinations of online car-hailing trips, the actual end positions of the large amount trips can be plotted on the diagram.
The kernel density estimation (KDE) is a nonparametric method to estimate the probability density function of the sample data which have an unknown distribution. The kernel density estimate is a function defined as the sum of a kernel function on every data point. In two dimensions, the kernel density estimation is calculated as follows:
where is the bandwidth; is the number of points within the bandwidth; is the distance between the point and ; and is the kernel function.
The density-based spatial clustering of applications with noise (DBSCAN) is a classical clustering algorithm to identify aggregations in space. It is noteworthy that the anomaly points can be found in DBSCAN, and it is not sensitive to anomalies in the dataset. In this paper, we are interested in the intensively gathered areas. To this end, suitable parameters were determined from a large number of tests to discover the hotspots. Algorithm 1 is shown below.
| Algorithm 1 DBSCAN |
Input:
Set of clusters . Step 1:
|
The raster analysis divides the research area into small cells to perform quantitative statistical analysis. The Global Moran’s I is introduced to measure the spatial autocorrelation based on the result of the raster analysis. The Global Moran’s I is calculated as:
where is the attribute value of the space unit ; and is the spatial weight value between the unit and . is the mean value of all units. The Global Moran’s I is mainly used to describe the average degree of correlation between spatial units and their surrounding areas in the whole region.
5. Results and Discussion
The experiment was based on the three-step approach constructed above, and the results and discussion are presented in this section. Four periods were mainly compared and analyzed: the pre-pandemic time in 2018, the normal time of pandemic prevention and control (6 March 2022), the first day of lockdown in Pudong (28 March 2022), and the first day of lockdown in Puxi in 2022 (1 April 2022). The ride counts of the 15 days in 2018 were aggregated and averaged for further analysis.
5.1. The Overall Analysis
5.1.1. Temporal Pattern
Firstly, the temporal pattern of car-hailing travel in the pre-pandemic time was studied. The overall temporal analysis for online car-hailing trips of the 15 days from 7 April to 21 April 2018 was performed. The hourly number of origins and destinations of trips were counted and a consecutive time series was generated to draw a line chart. As shown in Figure 4, the variation trends of the volume of the origin and destination in the 15 days are presented by the blue curve and the orange curve, respectively. The workdays are framed out by dark green dashed boxes in the graph. In particular, 8 April 2018 is a Sunday but a workday due to the compensatory work of the Tomb-Sweeping Day. It is observed from the line chart that the volume of the trips on weekdays is higher than that on weekends, mainly due to heavy commuting on workdays.

Figure 4.
Temporal pattern of the volume of online car-hailing trips in 2018.
Figure 5 shows the temporal patterns of the three special days in 2022, and that of the mean of 2018 (7 April to 21 April). Apparently, with the implementation of the lockdown management in Pudong and Puxi successively, the volume of trips decreased extremely. When Pudong began the implementation of lockdown management, the number of ride-hailing trips in Shanghai decreased by 69.13% on 28 March compared with 6 March, from a total number of 771,622 to 238,192. What is more, on 1 April, the first day of lockdown in Puxi, the number of trips was cut down to 4859 for the whole day, nearly 0.6% under normal conditions (6 March 2022). The hourly number of trips was around 9000 in 2018, while on 6 March 2022 (a normal time), the quantity was raised to more than 30,000, which is more than three times what it was four years ago. The growth of online car-hailing was significant, and the share rate of public transport by ride-sourcing had increased. This is mainly because of the continuous growth and maturity of the online car-hailing market. As a result, people were more inclined to use online car-hailing to complete point-to-point travel. By 1 April 2022, the volume of trips of online car-hailing became so small that its line almost dropped to the horizontal axis. We observed that the maximum of ride counts appeared between 9 and 10 o’clock, and kept decreasing after that time.
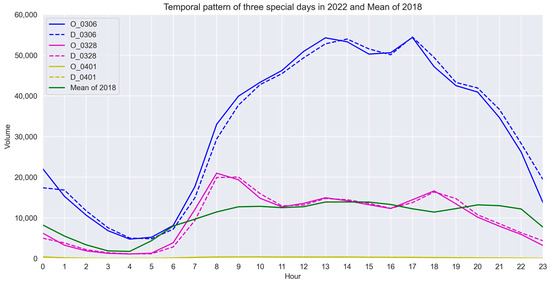
Figure 5.
Temporal pattern of the volume of online car-hailing trips of the three special days in 2022, and the mean of 2018.
5.1.2. Spatial Pattern
Secondly, we examined the impact of COVID-19 and the lockdown on the overall spatial pattern of car-hailing. The whole region of Shanghai was divided into grids for the aggregation of trips. The locations of the origins of ride-hailing trips are presented (the distribution of destinations was quite similar in this spatial scale from what we observed).
Figure 6a–d show the spatial patterns of 2018, and 3 days of 2022, respectively. The spatial distribution of trips becomes much broader in 2022. The number of trips in Pudong has increased rapidly, due to the gradual maturation of the online car-hailing market, as well as the development of Pudong and the construction of infrastructures. It is noteworthy that the hot spots with high trip density start to show up in the suburbs in 2022, compared with the spatial pattern in 2018. Jiading, Songjiang, and Qingpu districts and some regions in Pudong New District have begun to exhibit their vitality. This phenomenon is according to the planning of the Five New Cities of Shanghai government. Figure 6c shows the spatial pattern of car-hailing trips on 28 March 2022, which is the first day of the lockdown in Pudong, Shanghai. The ride-sourcing trips in the east of the Huangpu River were cut straight off. The number of trips in Puxi was reduced to half the usual according to our statistics. Despite the implementation of the lockdown in Pudong, many enterprises still maintained working in Puxi, leading to the maintenance of trips there to a certain extent. Figure 6d shows the spatial pattern of online car-hailing trips on 1 April 2022, which is the first day of the lockdown in Puxi, Shanghai. It is worth noting that Puxi began to conduct the closed-off management on this day while Pudong remained closed because of the grim situation of pandemic prevention and control. As a result, the volume of trips of online car-hailing in the whole of Shanghai suffered a huge decline of several orders of magnitude. Only a few places had significant ride-hailing orders in the Pudong and Chongming districts.
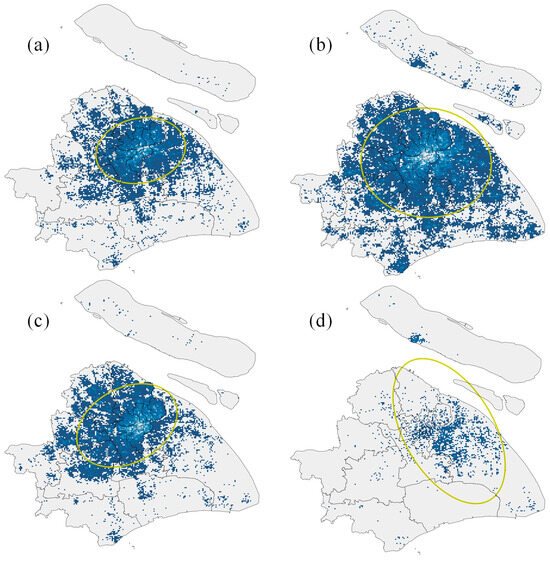
Figure 6.
Results of spatial patterns and standard deviation ellipses (the yellow circles). (a) Results of 2018, (b) results on 6 March 2022, (c) results on 28 March 2022, and (d) results on 1 April 2022.
Table 2 presents the mean values, the maximums, and the regions of the top five values of grids of the origins (O) and destinations (D) over the four periods. We observed that the number of trips of online car-hailing increased a lot in 2022 compared with 2018, but it suffered a precipitous descent with the successive lockdowns in Pudong and Puxi. The mean values of O and D were close for the same day, and that of O was always bigger in our case. However, an imbalance in the maximums of the O and D was revealed. The maximum of the O on the weekday of 2018 was 59% larger than that of the D, both of which occurred at the Hongqiao Transportation Hub. This value was raised to 136% on the weekend of 2018. Nevertheless, the maximum of the D on a normal day of 2022 (6 March, without the lockdown) was 85% larger than that of the O. In 2018, the top five regions were almost all transportation hubs including Hongqiao Transportation Hub, Shanghai Railway Station, and Pudong International Airport. However, in the normal time of 2022, business districts like South Shanxi Road and South Huangpi Road displayed their vitality. On 28 March 2022, the attractiveness of the Hongqiao Transportation Hub lessened, and trips to the Pudong International Airport were cut off due to the lockdown in Pudong. On 1 April, because of the lockdown in Puxi, regions in Pudong showed a high value such as Shanghai First Maternity and Infant Hospital, Shanghai Children’s Medical Center, Pudong Avenue, and so on.
Table 2.
Statistics of point pattern.
What is more, the method of the standard deviation ellipse was applied to measure the direction distribution of the spatial pattern. We used the origins for calculation. The results for spatial point analysis are displayed in the same graph. As shown in Figure 6, the major axis of the standard deviation ellipse depicts the direction of the data distribution, and the ellipse covers approximately 99.7% of the sample points. The oblateness was introduced to denote the directionality of the data, which is calculated as the ratio of the major axis minus the minor axis to the major axis. The oblateness ranges from 0 to 1 and the greater the value, the more obvious the directionality. We observed that in the normal time in 2022 (Figure 6b), the direction turned northwest–southeast compared with that in 2018. This is mainly because of the rapid development in Pudong New District including regions of Zhangjiang, and Chuangsha, which is consistent with the government planning of Shanghai. Until now, an east–west urban development belt along the Yan’an Road-Century Avenue has been formed in Shanghai. In addition, the coverage of the ellipse on 28 March 2022 grows larger, resulting from the greater quantity and span of online car-hailing trips. On the first day of the lockdown in Pudong (Figure 6c), the majority of the trips remained in Puxi and a traditional gathering of trips appeared along the Yan’an Road, accounting for the northeast–southwest direction and a compact ellipse. Meanwhile, on 1 April (Figure 6d), a large proportion of travel was restricted, leaving a small portion in Pudong and Chongming districts. Its standard deviation ellipse was generated as shown in the graph.
Table 3 presents the angle and oblateness of the generated standard deviation ellipses for the 5 days. The angle of the ellipse on 6 March 2022 has the largest absolute value, indicating the direction closest to the east-west. The oblateness of the ellipse on 1 April 2022 reached the maximum, showing the strongest directionality. This mainly owes to the small size of the trip data. The minimum of oblateness occurs on 6 March 2022, which is the normal time of pandemic prevention and control. This day’s directionality becomes insignificant, which means the data points are fairly evenly distributed in all directions. The development of the peripheral city clusters in keeping with the policy and planning of Shanghai is probably the primary reason for this phenomenon.
Table 3.
Result of angles and oblateness.
5.2. Analysis of Flows between the Administrative Districts
In this section, the flows between the administrative districts are investigated. The flows, net flows between administrative districts, and net flows of each district are researched based on the method set out in Section 4.2. Shanghai governs 16 districts which are shown in Table 1, and the locations of the 16 administrative districts are presented in Figure 1.
The flows between administrative districts were calculated and the 16-by-16 matrix was generated for each day. Figure 7a,b, Figure 7c,d, Figure 7e,f, and Figure 7g,h show the flows between administrative districts in 2018, and 6 March, 28 March, and 1 April 2022, respectively. As shown in Figure 7a,c,e,g, the values on the diagonal of the matrix make up the majority, namely the diagonally dominant. Pudong and Minhang Districts are the top two in terms of the amount of travel, where the Hongqiao Transportation Hub and the Pudong International Airport are located, respectively. The trips of car-hailing within the administrative districts are the majority. To better display the number of trips between the boroughs, the diagonal elements were set to zero (Figure 7b,d,f,h). The districts numbered from 0 to 8 and 10 account for the vast majority of the trips, corresponding to the districts with the intersection of the central area of Shanghai.
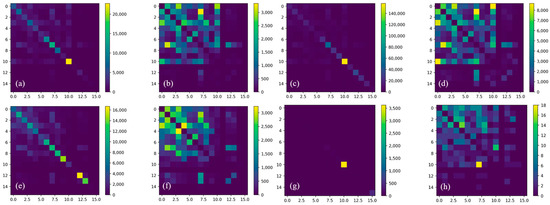
Figure 7.
Flows between administrative districts (normal and zero-diagonal). (a) Flow pattern in 2018; (b) flow pattern of zero-diagonal in 2018; (c) flow pattern on 6 March 2022; (d) flow pattern of zero-diagonal on 6 March 2022; (e) flow pattern on 28 March 2022; (f) flow pattern of zero-diagonal on 28 March 2022; (g) flow pattern on 1 April 2022; (h) flow pattern of zero-diagonal on 1 April 2022.
The flow matrixes in 2018 (Figure 7a,b) are symmetrical on the diagonal, which implies that the flows between any two districts are approximately equal. It is noteworthy that administrative district No. 7 is Minhang District, in which the Hongqiao Hub is located. The ride-sourcing flows between districts 1 and 7, i.e., Xuhui and Minhang, are the maximum. Flows between Pudong (No. 10) and Huangpu (No. 0) as well as within the central urban areas (No. 0–3) are also prominent. However, the flows in Jinshan (No. 11) and Chongming (No. 15) Districts are inconspicuous in contrast to the main part in the central areas.
With regards to the matrixes of the 3 days in 2022, the trips within the administrative districts are still the majority, although the inter-district flows (notably in central urban areas) become more obvious on 28 March. On 6 March (Figure 7c,d), the normal time of pandemic prevention and control, flows in Pudong and the peripheral districts became more significant compared with those in 2018. The policy and planning of the Five New Cities in Shanghai as well as the development of sub-centers are likely to have contributed to this change. Moreover, the flows associated with Minhang District (mainly coming from the Hongqiao Hub and its surroundings) turn out to be less prominent, thus the result of visualization has an overall brighter color. On 28 March (Figure 7e,f), the first day that Pudong began to implement lockdown management, the flows associated with Pudong New District almost vanished. There is an apparent difference between 28 March and the normal times that Songjiang (No. 12) and Qingpu (No. 13) Districts show their activity. In terms of the inter-district flows, the districts of low order (i.e., intersect with the downtown area) still account for the vast majority of the trips. But it is quite different to see that the flows between Jing’an and Putuo Districts (No. 3 and 4) are greatly enhanced, while the traditionally prominent trips that are related to the transportation hubs (especially the Hongqiao Hub) are substantially reduced. That probably comes from the great decline in the arrival and departure of trains and planes due to the serious situation of the COVID-19 pandemic in Shanghai. On 1 April (Figure 7g,h), the first day of lockdown in Puxi, the travel is mostly concentrated in Pudong while the volume is considerably smaller in other places. The inter-district flows lose their symmetry due to the slight quantity of trips, which makes the randomness increase. It is worth noting that the flow from Pudong District to Minhang District (No. 10 to 7) is the largest of inter-district flows, even though it is only 18.
Furthermore, the net flows between the administrative districts were also studied and visualized. The matrix of net flows is derived from the flow matrix minus its transposition. As a result, the net flow matrix is the skew-symmetric matrix (see Section 4.2 for more details). In terms of visualization, the color blue (for the positive value) denotes the net outflow, while red (for the negative value) denotes the net inflow. For instance, as shown in Figure 8a, the net flow from districts 0 to 10 is positive with the color of blue, which means there is a net outflow for district No. 0 from districts 0 to 10. On the contrary, there is a net inflow for district No. 10 from districts 10 to 0, with the red color and the negative value. Figure 8 presents the net flows in 2018 and the three days in 2022. There is an obvious difference between the patterns of net flow over the two years. In 2018, the upper triangle of the matrix of net flow is almost positive with the color of blue, while the lower triangle is almost negative and red. In 2022, the pattern is different and not so regular. On 6 and 28 March 2022, Minhang District is an inflow from any other district, showing all red with negative values in the line of No. 7. On 1 April, the pattern becomes irregular due to the special crowd behaviors as well as the stochastic results.
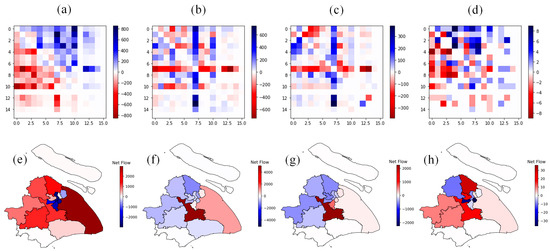
Figure 8.
Net flows between administrative districts. (a) Net flow pattern in 2018; (b) net flow pattern on 6 March 2022; (c) net flow pattern on 28 March 2022; (d) net flow pattern on 1 April 2022; (e) net flows of administrative districts in 2018; (f) net flows of administrative districts on 6 March 2022; (g) net flows of administrative districts on 28 March 2022; (h) net flows of administrative districts on 1 April 2022.
What is more, the visualization of the net flow of administrative districts was shown. Red represents the inflow (i.e., the sink), blue represents the outflow (i.e., the source), and the white color represents that the inflow and outflow of the district are equal. Figure 8e presents the net flow of districts in 2018. The sources are surrounded by sinks, which indicates that the net flow diverges from the center to the peripheries. Pudong New District is the most prominent sink, and Huangpu and Jing’an Districts are the most prominent sources in 2018.
Figure 8f presents the pattern of net flow on 6 March 2022. The suburbs change to sources with a blue color. Pudong New District has been greatly reduced in the inflow compared to 2018, albeit the sink. The most dramatic fact on 6 March is that Minhang District has become the most prominent sink, attracting net flows all around. Although the various interfering factors are complicated, the causes of this phenomenon may come from the development of the urban spatial structure, as well as the willingness of citizens to leave Shanghai (the Hongqiao Hub is in Minhang District) sensing possible stricter policies for the COVID-19 pandemic. Notice that on 6 March, some new cases of COVID-19 were confirmed, and the embryonic development of the pandemic has begun to exist. Figure 8g,h present the patterns of the net flow of districts for the two days (28 March and 1 April 2022) of the beginning of lockdown in Pudong and Puxi, respectively. With the implementation of the close-off management in Pudong, trips there plummeted, as did the net flows, causing a whiter color in Pudong. Puxi still had a relatively normal life so the pattern of net flow on 28 March did not change a lot in Puxi. On 1 April, the first day of the lockdown in Puxi, the absolute quantity of ride-hailing trips in Shanghai had plunged to a low level. Therefore, the randomness of the pattern of net flow increases. Still, Minhang and Pudong Districts remained the sinks, probably indicating that people left Shanghai through the transportation hubs in these two districts due to the lockdown in the city.
It is also noteworthy that many trips by car-hailing do not create a net flow like commuting, because people go to their destinations and finally come back to their origins. However, it is unknown whether people have used the same mode of transportation. The route point of the travel chain is also uncertain. Although it is hard to exploit the microscopic explanations from the aggregate macroscopic data, abundant results and implications can still be obtained. For example, Pudong New District was always the sink in our study, especially with significantly high values in 2018. That is probably a result of the Pudong International Airport for external transportation. The method and analysis of net flow provide a new lens for the research into human mobility, which will benefit subsequent studies.
5.3. The Multi-Perspective Analysis in the Central Urban Area
In this section, we study a rectangular central urban area of Shanghai (with the (longitude, latitude) from (121.25, 31.07) to (121.6, 31.34), from bottom left to top right) from a more mesoscopic view with the four-perspective method. The destinations of trips were studied to analyze the impact of lockdown on residents’ travel purposes.
Figure 9 shows the results of the muti-perspective analysis of the pre-pandemic time in 2018, the normal time of pandemic prevention and control, the first day of the lockdown in Pudong, and the first day of the lockdown in Puxi in 2022, respectively. The appropriate parameters were selected and the graphs were drawn. It is obvious that the scatter covers a wider area in the normal time compared with that in 2018, and the scatters of the two days of the start of lockdown have their own particular distribution features in space. The total number of trips in these four periods was 210,892, 541,519, 185,276, and 2806 in our selected central urban area. The coverage and shape of hotspot areas are easy to recognize in the graph of KDE. The bandwidth was determined as 0.006 in 2018, which is confirmed as a suitable value to produce a decent result through plentiful tests. The bandwidth of KDE was determined as 0.005 in 2022 to produce similar effects in terms of spatial coverage. However, KDE shows an effect after the average, probably offsetting the hotspot areas. As a result, other methods were introduced for integrated research. DBSCAN was used in this study to recognize the hot spots of car-hailing trips. Two key parameters, i.e., the minimum neighborhood number and the neighborhood radius of these four periods, were determined as 400 and 0.0015, 1000 and 0.0015, 500 and 0.0015, and 50 and 0.0015, respectively, which resulted in close numbers of clusters and relatively stable ratios of points remaining. As to the raster analysis, the interval of 0.005 of latitude and longitude (approximately equal to 500 m in Shanghai) was determined, which enables delicate research from a mesoscopic perspective. This perspective facilitates a standardized and intuitive analysis of the number of destinations for ride-sourcing trips in grids of the same size. The maximum of the raster analysis was chosen carefully to present a similar effect for each day.
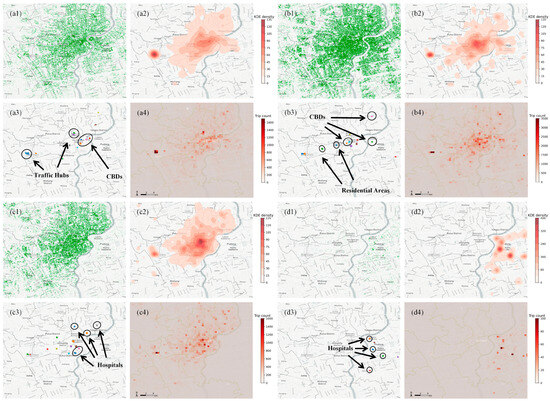
Figure 9.
Result of multi-perspective analysis. (a1) Scatter diagram in 2018; (a2) KDE plot in 2018; (a3) hotspots discovered from DBSCAN in 2018; (a4) raster analysis plot in 2018; (b1) scatter diagram on 6 March 2022; (b2) KDE plot on 6 March 2022; (b3) hotspots discovered from DBSCAN on 6 March 2022; (b4) raster analysis plot on 6 March 2022; (c1) scatter diagram on 28 March 2022; (c2) KDE plot on 28 March 2022; (c3) hotspots discovered from DBSCAN on 28 March 2022; (c4) raster analysis plot on 28 March 2022; (d1) scatter diagram on 1 April 2022; (d2) KDE plot on 1 April 2022; (d3) hotspots discovered from DBSCAN on 1 April 2022; (d4) raster analysis plot on 1 April 2022.
The locations of the clusters of DBSCAN were investigated in depth and the feature areas were circled in the diagram. On 6 March, Hongqiao Transportation Hub was the busiest area as before, yet the activity of other hubs was submerged by some prominent commercial areas and hospitals. What is more, the first signs of the outbreak of the pandemic were emerging on this day. Therefore, more clusters around the hospitals turned up, such as Shanghai No. 8 People Hospital, and South Shanxi Road where Xuhui District Central Hospital is located. Pudong New District has developed rapidly by 2022, so Century Avenue, Zhangjiang also shows up in the results of DBSCAN. On 28 March, the trips and clusters were distributed in Puxi. Due to the impact of the COVID-19 pandemic and lockdown, travel to hospitals has greatly increased. There were nine clusters related to hospitals out of fourteen. There are many reasons accounting for this phenomenon. Because of the outbreak and the rapid spread of the pandemic, many citizens became ill and went to hospital out of fear of COVID-19. Many elderly people, pregnant women, and patients with underlying diseases also chose to go to a hospital in advance, even when they were not sick, to mitigate the inconvenience caused by the lockdown. In addition, a group of residents also went to the hospitals to purchase medicine due to the shortage outside. Owing to the lockdown of the city, the delivery volume of transportation hubs plummeted on 28 March, represented by the Hongqiao Transportation Hub. The Hongqiao Transportation Hub had a maximum value decreased to 22.6% of that on 6 March, but remained the top travel destination. It was also noted that Hongqiao Park emerged as a new hotspot for travel of ride-hailing, where a group of shopping malls and residential communities are located. Lastly, on 1 April, Pudong remained sealed because of the grim situation of control of the pandemic. A few trips of ride-hailing recovered in Pudong, mainly for hospitals. Shanghai First Maternity and Infant Hospital, Shanghai Children’s Medical Center, and Shanghai East Hospital were the highly visited areas for ride-sourcing service, due to the rigid needs for medical treatment. Also note that the Weifang Villages were hot zones, which is a residential area of relatively high density.
In terms of raster analysis, the trip count of each day is recorded in a matrix of the shape of 61 by 67, which represents the values of the corresponding grids. Through the visualization of the raster analysis, an intuitive and quantitative result of the strength in space is obtained. The Global Moran’s I is introduced to measure spatial autocorrelation. The value of Global Moran’s I, the p-value, the z-value, and the statistics (after normalization) are shown in Table 4. The Global Moran’s I describes the average degree of correlation between spatial units and their surrounding areas in the whole region. Queen contiguity is used as the measurement of spatial weight, where the common edge or common point is regarded as adjacency. It is noteworthy that the p-values of all these four days are less than 0.01, which indicates that the null hypothesis is rejected at 0.01 significance level. The z-scores are all greater than 2.58, indicating that the data have obvious clustering characteristics. The results of the p-value and z-score ensure the significance of Global Moran’s I. The index of Global Moran’s I is different for these characteristic periods. Firstly, in the normal period of pandemic management in 2022, the trips of car-hailing show less aggregation compared to 2018. Shanghai encourages the development and construction of five new cities and more trips for ride-sourcing occur and gather in the suburbs. Secondly, to the time of lockdown in Pudong and Puxi, the spatial distribution patterns have changed remarkably. On 28 March, the trips of online car-hailing are mostly distributed in Puxi, which results in a high Global Moran’s I value. On 1 April, the number of trips plunged to a low level. A few trips occur in Pudong and Chongming, thus showing a less concentrated pattern.
Table 4.
Result of analysis of spatial autocorrelation.
What is more, a correlation analysis was also conducted based on the online car-hailing ride counts of raster analysis. The maximum–minimum normalization was performed by mapping the values to [0, 1]. The analysis of Spearman’s rank correlation coefficient was performed for the trip counts of grids on fifteen days in 2018, which is better for recognizing the nonlinear correlation between the samples. Figure 10 shows the Spearman’s rank correlation coefficient between these days. All diagonal values are one because of the correlation to themselves. The overall correlation coefficients have high values, the lowest value of which is near 0.95. It indicates that during the normal time in 2018, the trip distribution in space was generally similar, no matter whether taking place on workdays or weekends. However, weekends are more similar to weekends and weekdays to weekdays according to the redder part of the graph. The day of index 1 (8 April, a compensatory workday for the Tomb-Sweeping Day) has the characteristics of a working day, thus it is confirmed to be classified as a weekday in the previous part. The figure shows Spearman’s rank correlation coefficient between the three days in 2022 and 15 days in 2018. The gaps in the correlation coefficient between the three days are remarkable. The distribution of online car-hailing trips on 6 March (the normal time in 2022) is quite similar to that of 2018, with Spearman’s rank correlation coefficient greater than 0.7. Notice that 6 March 2022 is on the weekend, so the coefficient increases on the weekends in 2018. However, 28 March and 1 April are the first days of the lockdown in Pudong and Puxi, respectively. The spatial distribution patterns have changed remarkably. Consequently, the correlation coefficients of these two days become less significant, albeit positive.
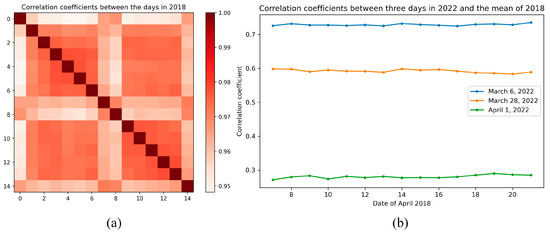
Figure 10.
Result of correlation analysis. (a) Spearman’s rank correlation coefficient of ride counts between 15 days in 2018; (b) Spearman’s rank correlation coefficient of ride counts between the three days in 2022 and 2018.
6. Conclusions
Based on the car-hailing dataset of fifteen days in 2018 and three special days in 2022 in Shanghai, we studied how COVID-19 and the lockdown affect car-hailing travel. We established a three-step method to analyze the impact of the pandemic and lockdown from the macroscopic to the mesoscopic perspective, which has not been used as comprehensively as our study in the previous research. The main findings and insights in this paper are as follows:
- The lockdown due to COVID-19 brought a precipitous decline in the amount of travel using car-hailing, which had significant impacts on the economy and society.
- Human mobility and crowd behaviors were affected profoundly due to the coronavirus and the lockdown, especially associated with hospitals. A remarkable increase in the number of clusters related to hospitals was observed.
- Trips related to the transportation hubs (especially the Hongqiao Transportation Hub) were the most prominent in ride-hailing. However, the worsening situation of the pandemic and especially the lockdown tremendously affected the traffic at the hubs. The travel to hubs even became insignificant on the first day of lockdown in Puxi.
- Planning of the government and urban development also brought remarkable changes in the number of car-hailing trips and its spatiotemporal pattern. The coverage grows wider to the suburbs and the direction became more horizontal in 2022.
- Different methods of visualization have different visual effects and meanings, which may both facilitate observation and interpretations and mislead the understanding of results. Thus, a delicate and comprehensive investigation of different means and scales of visualization should be conducted to aid in the quantitative analysis and present the proper results, which provide a possible solution to the MAUP.
These findings could hopefully provide evidence and insights for the understanding of the impact of COVID-19 and the lockdown on people’s travel, as well as support the government in decision-making in different stages of the pandemic development. During the pandemic, government and TNCs can enhance accessibility and dispatch of online car-hailing near hospitals to meet increased medical transportation needs. Restricted travel during the lockdown requires a reassessment of transportation resources in transport hubs and CBDs, prioritizing urgent and essential demands. Government regulation should be implemented to ensure a suitable fit with the local situation. During stringent lockdowns, people were limited to activities within a very small range, which would affect their opportunities to go out for activities, socialize, shop, and so on. Urban green spaces play a crucial role in promoting exercise and enhancing mental well-being [41]. Therefore, there might be increased investment from the government in transportation infrastructure and decentralization of public facilities to facilitate better access to these green spaces, which requires careful consideration and balancing by the government. Effective initiatives implemented in other countries, such as Italy’s measures of city time planning and extension of open space functions [18], can also be assessed and borrowed for China, taking into account the specific circumstances of the region. Our results may also promote the style of community living, which will reduce the risk of infectious diseases, which may optimize the traffic and alleviate the congestion on the roads. This study provides evidence of the impacts of COVID-19 and the lockdown on car-hailing travel in a megacity in China, which can serve as a reference for other cities in understanding the potential variations in crowd behavior and spatio-temporal pattern resulting from implementing the lockdown, and whether to adopt it. Additionally, for cities with less stringent policies, our findings offer valuable insights for determining management strategies and provide a framework for investigating the impacts of COVID-19 and initiatives on online car-hailing travel.
There are also some limitations in our study, such as an insufficient amount of data before and amid the lockdown, and a lack of consideration for other influential factors like COVID-19 statistics. This calls for further detailed research. Nevertheless, our research provides valuable insights into the analysis of the impacts of COVID-19 and the lockdown on car-hailing travel and provides a reference for subsequent studies.
Author Contributions
Data curation, Y.Z. (Yixuan Zhou) and Y.L.; formal analysis, Y.Z. (Yixuan Zhou) and Q.X.; funding acquisition, L.Z. and X.W.; investigation, Q.X.; methodology, Y.Z. (Yixuan Zhou) and L.Z.; resources, L.Z.; software, Y.Z. (Yuxin Zhang); supervision, L.Z., Y.L. and X.W.; visualization, Y.Z. (Yixuan Zhou); writing—original draft, Y.Z. (Yixuan Zhou); writing—review and editing, Y.Z. (Yixuan Zhou). All authors have read and agreed to the published version of the manuscript.
Funding
The work was sponsored by the Natural Science Foundation of Shanghai (No. 22ZR1422200), and the Key R&D Program of Zhejiang Province, China (No. 2021C01011). The authors also acknowledge the Shanghai Transportation Information Center for providing the online car-hailing dataset for this study.
Institutional Review Board Statement
Not applicable.
Informed Consent Statement
Not applicable.
Data Availability Statement
The data files are available upon reasonable request from the corresponding author.
Conflicts of Interest
The authors declare no conflict of interest.
References
- WHO. Coronavirus (COVID-19) Dashboard. Available online: https://covid19.who.int/ (accessed on 13 September 2023).
- Zheng, H.Y.; Zhang, K.N.; Nie, Y. Plunge and rebound of a taxi market through COVID-19 lockdown: Lessons learned from Shenzhen, China. Transp. Res. A-Policy 2021, 150, 349–366. [Google Scholar] [CrossRef]
- Yu, J.R.; Xie, N.K.; Zhu, J.T.; Qian, Y.W.; Zheng, S.J.; Chen, X.Q. Exploring impacts of COVID-19 on city-wide taxi and ride-sourcing markets: Evidence from Ningbo, China. Transp. Policy 2022, 115, 220–238. [Google Scholar]
- Kogan, K.; Herbon, A. Retailing under panic buying and consumer stockpiling: Can governmental intervention make a difference? Int. J. Prod. Econ. 2022, 254, 108631. [Google Scholar]
- Lavuri, R.; Jaiswal, D.; Thaichon, P. Extrinsic and intrinsic motives: Panic buying and impulsive buying during a pandemic. Int. J. Retail Distrib. 2022, 51, 10. [Google Scholar]
- Nicola, M.; Alsafi, Z.; Sohrabi, C.; Kerwan, A.; Al-Jabir, A.; Iosifidis, C.; Agha, M.; Agha, R. The socio-economic implications of the coronavirus pandemic (COVID-19): A review. Int. J. Surg. 2020, 78, 185–193. [Google Scholar]
- Sharif, A.; Aloui, C.; Yarovaya, L. COVID-19 pandemic, oil prices, stock market, geopolitical risk and policy uncertainty nexus in the US economy: Fresh evidence from the wavelet-based approach. Int. Rev. Financ. Anal. 2020, 70, 101496. [Google Scholar]
- Paul, S.K.; Chowdhury, P. A production recovery plan in manufacturing supply chains for a high-demand item during COVID-19. Int. J. Phys. Distrib. Logist. 2021, 51, 104–125. [Google Scholar]
- Selden, T.M.; Berdahl, T.A. COVID-19 And Racial/Ethnic Disparities in Health Risk, Employment, And Household Composition. Health Affair 2020, 39, 1624–1632. [Google Scholar] [CrossRef]
- Chakraborty, I.; Maity, P. COVID-19 outbreak: Migration, effects on society, global environment and prevention. Sci. Total Environ. 2020, 728, 138882. [Google Scholar] [CrossRef] [PubMed]
- Tirachini, A.; Cats, O. COVID-19 and Public Transportation: Current Assessment, Prospects, and Research Needs. J. Public Transp. 2020, 22, 1–21. [Google Scholar]
- Singh, S.; Kumar, R.; Panchal, R.; Tiwari, M.K. Impact of COVID-19 on logistics systems and disruptions in food supply chain. Int. J. Prod. Res. 2021, 59, 1993–2008. [Google Scholar] [CrossRef]
- Borkowski, P.; Jazdzewska-Gutta, M.; Szmelter-Jarosz, A. Lockdowned: Everyday mobility changes in response to COVID-19. J. Transp. Geogr. 2021, 90, 102906. [Google Scholar] [PubMed]
- Silveira-Santos, T.; Gonzalez, A.B.R.; Rangel, T.; Pozo, R.F.; Vassallo, J.M.; Diaz, J.J.V. Were ride-hailing fares affected by the COVID-19 pandemic? Empirical analyses in Atlanta and Boston. In Transportation; Springer: Cham, Switzerland, 2022. [Google Scholar]
- Shen, Z.Y. Workplace commute in Shanghai under post-pandemic rehabilitation: Health and fitness problems in planning and sustainability challenges. Front. Environ. Sci. 2022, 10, 1037363. [Google Scholar]
- Yang, T.R. Understanding commuting patterns and changes: Counterfactual analysis in a planning support framework. Environ. Plan B-Urban 2020, 47, 1440–1455. [Google Scholar]
- Chen, S.M.; Zhang, Z.J.; Yang, J.T.; Wang, J.; Zhai, X.H.; Barnighausen, T.; Wang, C. Fangcang shelter hospitals: A novel concept for responding to public health emergencies. Lancet 2020, 395, 1305–1314. [Google Scholar] [PubMed]
- Angiello, G. Toward greener and pandemic-proof cities: Italian cities policy responses to COVID-19 outbreak. Tema 2020, 13, 271–280. [Google Scholar]
- Carteni, A.; Di Francesco, L.; Henke, I.; Marino, T.V.; Falanga, A. The Role of Public Transport during the Second COVID-19 Wave in Italy. Sustainability 2021, 13, 11905. [Google Scholar]
- Cartenì, A.; Di Francesco, L.; Martino, M. The role of transport accessibility within the spread of the Coronavirus pandemic in Italy. Safety Sci. 2021, 133, 104999. [Google Scholar]
- Hu, S.H.; Xiong, C.F.; Liu, Z.Q.; Zhang, L. Examining spatiotemporal changing patterns of bike-sharing usage during COVID-19 pandemic. J. Transp. Geogr. 2021, 91, 102997. [Google Scholar]
- Zhou, Y.R.; Liu, X.C.; Grubesic, T. Unravel the impact of COVID-19 on the spatio-temporal mobility patterns of microtransit. J. Transp. Geogr. 2021, 97, 103226. [Google Scholar]
- Luan, S.L.; Yang, Q.F.; Jiang, Z.T.; Wang, W. Exploring the impact of COVID-19 on individual’s travel mode choice in China. Transp. Policy 2021, 106, 271–280. [Google Scholar] [CrossRef] [PubMed]
- Ferreira, N.; Poco, J.; Vo, H.T.; Freire, J.; Silva, C.T. Visual Exploration of Big Spatio-Temporal Urban Data: A Study of New York City Taxi Trips. IEEE Trans. Vis. Comput. Graphs 2013, 19, 2149–2158. [Google Scholar] [CrossRef] [PubMed]
- Liu, Y.X.; Zhang, L.; Zhou, Y.X.; Xu, Q.; Fu, W.; Shen, T. Clustering-Based Decision Tree for Vehicle Routing Spatio-Temporal Selection. Electronics 2022, 11, 2379. [Google Scholar] [CrossRef]
- Li, T.; Jing, P.; Li, L.C.; Sun, D.Z.; Yan, W.B. Revealing the Varying Impact of Urban Built Environment on Online Car-Hailing Travel in Spatio-Temporal Dimension: An Exploratory Analysis in Chengdu, China. Sustainability 2019, 11, 1336. [Google Scholar] [CrossRef]
- Zhang, K.S.; Sun, D.; Shen, S.W.; Zhu, Y. Analyzing spatiotemporal congestion pattern on urban roads based on taxi GPS data. J. Transp. Land Use 2017, 10, 675–694. [Google Scholar] [CrossRef]
- Gong, L.; Liu, X.; Wu, L.; Liu, Y. Inferring trip purposes and uncovering travel patterns from taxi trajectory data. Cartogr. Geogr. Inf. Sci. 2016, 43, 103–114. [Google Scholar] [CrossRef]
- Zhou, Y.; Zhang, L.; Xu, Q.; Liu, Y.; Fu, W. Characteristics Exploration of Hospitals in Shanghai through Spatial Relationship Using Taxi Data. In Proceedings of the IEEE 2022 7th International Conference on Image, Vision and Computing (ICIVC), Xi’an, China, 26–28 July 2022; pp. 287–292. [Google Scholar]
- Liao, C.W.; Chen, C.; Zhang, Z.Q.; Xie, H. Understanding and visualizing passengers’ travel behaviours: A device-free sensing way leveraging taxi trajectory data. Pers. Ubiquit Comput. 2012, 26, 491–503. [Google Scholar] [CrossRef]
- Nie, Y. How can the taxi industry survive the tide of ridesourcing? Evidence from Shenzhen, China. Transp. Res. C-Emerg. 2017, 79, 242–256. [Google Scholar] [CrossRef]
- Liu, Y.; Kang, C.G.; Gao, S.; Xiao, Y.; Tian, Y. Understanding intra-urban trip patterns from taxi trajectory data. J. Geogr. Syst. 2012, 14, 463–483. [Google Scholar] [CrossRef]
- Bi, S.B.; Wang, L.Y.; Liu, S.L.; Zhang, L.L.; Yuan, C. Identification of Urban Jobs-Housing Sites Based on Online Car-Hailing Data. Sustainability 2023, 15, 1712. [Google Scholar] [CrossRef]
- Bi, S.B.; Yuan, C.; Liu, S.L.; Wang, L.Y.; Zhang, L.L. Spatiotemporal Prediction of Urban Online Car-Hailing Travel Demand Based on Transformer Network. Sustainability 2022, 14, 13568. [Google Scholar] [CrossRef]
- Ge, H.X.; Li, S.T.; Cheng, R.J.; Chen, Z.L. Self-Attention ConvLSTM for Spatiotemporal Forecasting of Short-Term Online Car-Hailing Demand. Sustainability 2022, 14, 7371. [Google Scholar] [CrossRef]
- Li, S.; Bao, S.T.; Yao, C.Y.; Zhang, L. Exploring the Spatio-Temporal and Behavioural Variations in Taxi Travel Based on Big Data during the COVID-19 Pandemic: A Case Study of New York City. Sustainability 2022, 14, 13548. [Google Scholar] [CrossRef]
- Openshaw, S. In Modifiable Areal Unit Problem. In Proceedings of the ACM SIGSPATIAL International Workshop on Advances in Geographic Information Systems, Irvine, CA, USA, 5–7 November 2008. [Google Scholar]
- Wang, Z.B.; Gong, X.; Zhang, Y.C.; Liu, S.Y.; Chen, N. Multi-Scale Geographically Weighted Elasticity Regression Model to Explore the Elastic Effects of the Built Environment on Ride-Hailing Ridership. Sustainability 2023, 15, 4966. [Google Scholar] [CrossRef]
- Duan, Y.; Yuan, C.; Mao, X.; Zhao, J.; Ma, N. Influence of the built environment on taxi travel demand based on the optimal spatial analysis unit. PLoS ONE 2023, 18, e0292363. [Google Scholar] [CrossRef] [PubMed]
- Pearce, J.R. International Encyclopedia of Human Geography; Elsevier: Amsterdam, The Netherlands, 2009. [Google Scholar]
- Razani, N.; Radhakrishna, R.; Chan, C. Public Lands Are Essential to Public Health during a Pandemic. Pediatrics 2020, 146, e20201271. [Google Scholar] [CrossRef]
Disclaimer/Publisher’s Note: The statements, opinions and data contained in all publications are solely those of the individual author(s) and contributor(s) and not of MDPI and/or the editor(s). MDPI and/or the editor(s) disclaim responsibility for any injury to people or property resulting from any ideas, methods, instructions or products referred to in the content. |
© 2023 by the authors. Licensee MDPI, Basel, Switzerland. This article is an open access article distributed under the terms and conditions of the Creative Commons Attribution (CC BY) license (https://creativecommons.org/licenses/by/4.0/).